Abstract
Due to the fast growth of China’s economy, urban atmospheric pollution has become a serious problem affecting the public’s physical and mental health. The ‘2 + 26’ cities, as the Jing-Jin-Ji atmospheric pollution transmission channel, has attracted widespread concern. There were several previous studies on the economic loss of public health caused by PM2.5 pollution in ‘2 + 26’ cities. To assess the economic loss caused by PM2.5 on human health in ‘2 + 26’ cities, this paper used the exposure-response model, the health effect loss model and willingness to pay method to obtain the economic loss from PM2.5 pollution with the latest available data in 2020. It was concluded that, in 2020, the economic loss of ‘2 + 26’ cities from PM2.5 was spatially distributed low in the east and high in the west. In addition, it was larger in the southern and northern part, which was smaller in the middle of the region. Based on the conclusions, policy recommendations were put forward.
1. Introduction
1.1. Background
With the concept of sustainable development gradually gaining popularity, saving resources and protecting the environment have become the consensus. However, due to the fast growth of China’s economy, the consumption of energy has increased and resulted in serious air pollution that has caused great harm to all residents. Jing-Jin-Ji and its surrounding areas are particularly polluted. In order to address these environmental issues, the Ministry of Ecology and Environment formulated the ‘Air Pollution Prevention and Control Work Plan for Jing-Jin-Ji and its surrounding areas in 2017’ and determined that the implementation scope was the air pollution transmission channel of Jing-Jin-Ji, which was namely ‘2 + 26’ cities. The reason why the ‘2 + 26’ cities were chosen in this paper is that, although there are several studies about assessing the health effect loss of different cities, it is still important to consider the regional effect on different cities within since the PM2.5 pollution is dynamically transmitted. Thus, according to the Air Pollution Prevention and Control Work Plan for Jing-Jin-Ji and its surrounding areas formulated by Ministry of Ecology and Environment, it is more reasonable to consider the ‘2 + 26’ cities as a whole to discuss the health effect economic loss, for which the paper chose the air pollution transmission channel of Jing-Jin-Ji mentioned in the ‘Plan’, which was namely ‘2 + 26’ cities. The ‘Plan’ claimed that the ‘2 + 26’ cities include Beijing, Tianjin, Shijiazhuang, Tangshan, Langfang, Baoding, Zhangzhou, Hengshui, Xingtai, Handan, Taiyuan, Yangquan, Changzhi, Jincheng, Jinan, Zibo, Jining, Dezhou, Liaocheng, Binzhou, Heze, Zhengzhou, Kaifeng, Anyang, Hebi, Xinxiang, Jiaozuo, and Xiangyang.
Air pollution with PM2.5 as the characteristic pollutant has now become the most urgent and prominent environmental problem in China. A large number of epidemiological studies at home and abroad have confirmed that particulate matter is the most harmful air pollutant to human health, and it can cause serious damage to the human respiratory system and cardiovascular system. Due to the small diameter of PM2.5, it is easy for it to adsorb heavy metals and microorganisms, which can also break through the barrier and enter cells and blood circulation, which is more likely to cause serious damage to the human respiratory system and cardiopulmonary system. Therefore, PM2.5 has caused a great amount of social and economic loss, which not only increased the economic expenditure for medical treatment, but also affected the working ability and time of the labor force, resulting in a reduction in labor output and a negative impact on society as a whole.
1.2. Significance
Different from the most urban research, based on the “2017 Air Pollution Prevention and Control Work Plan for Beijing-Tianjin-Hebei and Surrounding Areas”, this paper, formulated by the Ministry of Environmental Protection, determined that the research scope is the Beijing-Tianjin-Hebei air pollution transmission channel area, that is, ‘2 + 26’ cities. The ‘2 + 26’ cities are densely populated, and PM2.5 concentrations have long been above the standard. Urban residents have been affected by the air pollution for a long time, so the air pollution problem has received extensive attention. However, there is still a lack of assessments of the health impacts and economic loss of atmospheric particulate pollution across related cities in large areas.
The residents’ health is often plagued by the pollution [1,2]; thus, based on the epidemiological survey data of atmospheric particulate pollutants at home and abroad, this paper used the model of Poisson Regression to analyze the health effects and to assess the economic loss that were caused by PM2.5 in ‘2 + 26’ cities. In addition, the comprehensive assessment method could be applied to other places to provide strong data support for solving local environmental problems. The regional comprehensive assessment also provides an important basis for government departments to conduct a cost-benefit analysis of particle pollution prevention and control policies.
1.3. Literature Review and Research Gap
Air pollution has become the most urgent and prominent environmental problem in China, among which PM2.5 is the main component [3,4]. Many epidemiological research studies at home and abroad considered that PM2.5 is more harmful to human health compared to other air pollutants [5,6].
In recent years, European and American countries have conducted a large number of estimation studies on the health hazards of atmospheric particulate pollution, which have a significant impact on population mortality and morbidity [7,8]. Compared to foreign studies, China’s research on particulate pollution started relatively late (Table 1). For example, Wang et al. [9] not only quantified the negative health effects of PM2.5 through the exposure-response relationship, but they also established a CGE model in a closing economy to change the labor supply and additional medical expenses to the conduction variables, simulating the exogenous effect of PM2.5 pollution on the national economy. It concluded that negative health effects caused the total output loss of the industrial sector to be about CNY 23.97 billion. In addition, Xie et al. [10] combined the CGE model with the pollutant emission model to estimate the economic impact on Jing-Jin-Ji in 2020. It can be concluded that the additional health expenditure could reach CNY 16.62 billion under the setting scenario. The research has great reference significance for the selection of health effect terminals in this paper.

Table 1.
Research review.
In addition, Wang et al. [19] proposed an economic loss evaluation system that related to health effects to efficiently simulate the characteristic concentrations of PM2.5 and estimated economic loss, which indicated that the system could provide new perspectives on the economic loss assessment of health, while it might assist those policymakers in its application in real life. The measures to reduce the public health economic loss were used for reference in this paper.
In conclusion, the applications of this research produced huge economic and social benefits and effectively reduced the public health economic loss, which was also greatly significant and complemented the data on PM2.5 pollution loss. However, It could be seen that there was less research on PM2.5 in ‘2 + 26’ cities. Due to a lack of data from regional epidemiological studies, the current study was largely limited to a city-scale assessment. Overall, research on air health pollution in China is not mature enough.
1.4. The Main Work and the Innovations
Therefore, this paper adopted the ambient air quality standard (GB3095-2012), combined with the epidemiological survey data of atmospheric particulate pollutants at home and abroad, based on which the exposure-response model was used to quantitatively analyze the health effects of urban residents in the ‘2 + 26’ cities due to PM2.5 pollution and to evaluate the economic loss caused by the health effects of cities in each region (Figure 1). In addition, the determination of ‘2 + 26’ cities refers to the comparison and reference of pollution between different regions and considers the calculation results within the ‘2 + 26’ area by city and disease terminal to achieve a multi-faceted and three-dimensional comprehensive analysis, which was the innovation of this paper.
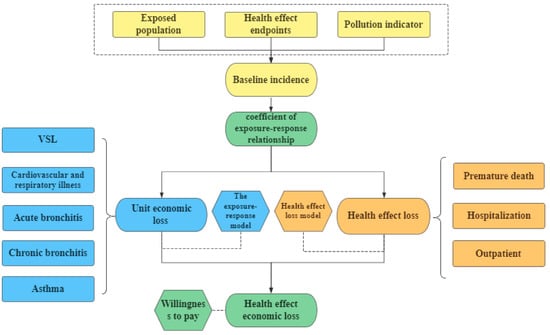
Figure 1.
Roadmap.
Overall, this study analyzed the exposure-response relationship and comprehensively assessed the impact on the chosen different health effect terminals, including hospitalization for respiratory diseases and hospitalization for cardiovascular disease, internal medicine and pediatric clinics, chronic bronchitis, acute bronchitis, and asthma. Considering the lack of specific data, there were still other impacts of PM2.5 on the residents that were not included in this study.
2. Study Area
2.1. Background
To solve environmental issues, the Ministry of Ecology and Environment formulated the Air Pollution Prevention and Control Work Plan for Jing-Jin-Ji and its adjacent areas in 2017 and determined that the implementation scope was the air pollution transmission channel of Jing-Jin-Ji, which was namely ‘2 + 26’ cities and included Beijing, Tianjin, Shijiazhuang, Tangshan, Langfang, Baoding, Zhangzhou, Hengshui, Xingtai, Handan, Taiyuan, Yangquan, Changzhi, Jincheng, Jinan, Zibo, Jining, Dezhou, Liaocheng, Binzhou, Heze, Zhengzhou, Kaifeng, Anyang, Hebi, Xinxiang, Jiaozuo, and Xiangyang.
In this paper, the average monitoring concentration data of PM2.5 in 2020 were collected by the China Environmental Monitoring Station. Figure 2 revealed that the average annual concentration of PM2.5 in ‘2 + 26’ cities exhibited a certain spatial aggregation effect. The three cities of Hengshui, Dezhou, and Liaocheng had the highest average concentrations of PM2.5 in 2020. All three cities exceeded 80 μg/m3, which revealed that the pollution was still serious. Furthermore, in the marginal area, the air pollution was relatively less serious. PM2.5 annual average concentration of Yangquan, Changzhi, Taiyuan, and Jincheng were generally lower than 40 μg/m3. It can be seen that the average PM2.5 concentration in western cities was lower than that in eastern cities in the ‘2 + 26’ cities area. In general, the PM2.5 concentration in ‘2 + 26’ cities shows a radial shape from the center, with a higher concentration in the center of the region and a gradual decrease outward.
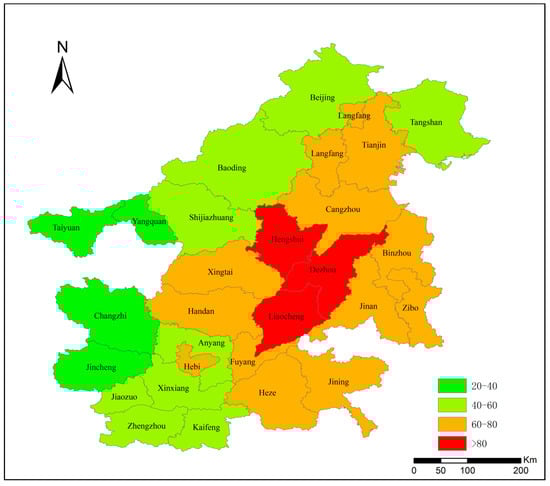
Figure 2.
Average PM2.5 concentration of ‘2 + 26’ cities in 2020 (μg/m3). (Data source: China Environmental Monitoring Station, 2020).
2.2. Existing Problems
The rapid growth of China’s economy is inseparable from the support of coal resources and the rational use of energy. As one of the core areas, there are still some unreasonable conditions in the development of ‘2 + 26’ cities.
2.2.1. High Pollution Intensity
Although ‘2 + 26’ cities only account for 7.2% of the country’s land area, they consume 33% of the country’s coal. The emission intensity of pollutants per unit area is about four times the national average level, which is the highest air pollution.
2.2.2. Difficulty in Controlling PM2.5 Pollution
The operation of some factories, such as those of the chemical industry and those of smelting, and building materials, cannot avoid the production of a large number of polluting solid particles. The existence of these factories in ‘2 + 26’ cities is also a part of social development, and it is difficult to deal with the environmental management of these polluting factories.
At present, many governments in ‘2 + 26’ cities have concentrated the construction of these polluting factories in areas that deviate from the city, but the discharge of harmful gases cannot be avoided; at the same time, in terms of air pollution control methods, government departments need to start from the source of air pollution. Sometimes, a lot of air pollution is generated in the process of control, and a lot of financial resources need to be invested as support.
2.2.3. Air Pollution Control System Needs to Be Improved
Environmental protection is related to the safety of residents’ life; thus, government departments in ‘2 + 26’ cities need to attach great importance to governance since the sources of PM2.5 particulate solids are very wide, such as vehicle exhaust emissions, polluting factory emissions, and construction waste generated by the construction industry. These pollutants come from various industries and require coordinated management by various departments.
3. Methods and Data
3.1. The Exposure-Response Model
Based on the most widely used exposure-response model (Huang and Zhang, 2013), the health risks of the public under PM2.5 exposure could be assessed according to the current air pollution epidemiology studies, which is shown in the Equation (1).
where E is the public health effect, which is under the current PM2.5 concentration. E0 is the health effect under the background concentration of PM2.5, β is the coefficient of exposure-response relationship, C is the current concentration of PM2.5, and C0 is the reference concentration of PM2.5.
Based on the reliability and accessibility of the existing data of domestic epidemiology, this paper selected the health effect terminals that were relevant to PM2.5, including respiratory disease death, cardiovascular death, acute bronchitis, asthma attack, pediatrics, outpatient, and early death. As a small part of clinical symptoms was difficult to quantify its health effects and it lacked the corresponding statistical data, we only assessed the health effect loss from the selected terminals and their economic loss.
The exposure-response relationship coefficient β is a ratio of change in health benefits from the unit concentration of PM2.5 increasing, and it is a terminal for quantitatively evaluating the health hazard pollutants. Here, the estimation of the health effect loss was based on the exposure-response relationship coefficient and the baseline incidence rate. Due to the lack of relevant information in China, this paper selected the conclusions of Kan et al. [20] and used the death exposure-response relationship model as a reference. The coefficients of cardiovascular disease, respiratory system hospitalization, and other exposures were selected from Xie et al. [21]. The data are shown in Table 2.
Table 2.
The coefficients of the PM2.5 exposure-response relationship and the baseline incidence at different health terminals.
The baseline incidence of a health terminal indicated the frequency of occurrence of a newly created disease in the health terminal in a particular population over a certain period of time. It was a measure of the impact on the health effects. The benchmark incidence rate of each health terminal in ‘2 + 26’ cities was selected by reference to the health statistics yearbooks, economic statistics yearbooks, and national health service survey report of ‘2 + 26’ cities. As the data of some cities were difficult to obtain, the paper used the average health terminal incidence rate of the national residents as the health baseline data. The data of the exposure-response relationship coefficients and the baseline incidence are demonstrated in Table 2.
3.2. Health Effect Loss Model
The health effect loss model is shown in Equation (2):
where E is the public health risk under the actual concentration of PM2.5; ΔE is the change of public health risk from the variation of the PM2.5 concentration; E0 is the health effect under the background concentration of PM2.5; P is the public quantity (10,000 people); β is the coefficient of the exposure-response relationship (%); C is the current concentration of PM2.5; and C0 is the background concentration of PM2.5.
Compared with the statistical population, each health effect terminal in this paper had a lower occurring probability. While the health effect loss model is more about time series, the statistical poisson distributions are likely to be their actual distribution. The current assessment in accordance with the loss of health effect from PM2.5 pollution is on the basis of Poisson regression model in China.
Since the background concentration value was inconclusive, on the basis of the epidemiological survey data of air pollution and the current situation in ‘2 + 26’ cities, this paper selected the baseline concentration value (35 μg/m3) in the transition period set by the World Health Organization in 2005 as the background concentration to estimate the health effect loss, which is also the limit of the PM2.5 concentration standard adopted by China.
3.3. Willingness to Pay Method
The willingness to pay is a method for evaluating the value of environmental quality by measuring the monetary value that the people are willing to pay to improve the health of themselves and others. Based on the results of China’s currently available and reliable research on the willingness to pay method, and combining the unit loss value, this paper assessed the total economic loss caused by the change of the PM2.5 concentration. The model is shown in Equation (3):
where C is the sum of the health loss from PM2.5, Vi is the unit economic loss of each health effect, and ΔEi is the change of the public death risk and the change of the public morbidity risk from the alteration of PM2.5 values.
For premature death from PM2.5, the more scientific and complete value of statistical life (VSL) is usually adopted to calculate the economic loss. When using the model, if the study area has a large difference in income levels, the annual average income of the urban population can be selected as the weight. In addition, the VSL of the existing city can be calculated to obtain the unit health loss value of the target city. Similarly, for the determination of the unit economic value of the relevant health effect terminals, the relevant research currently mainly use the disease cost method. The cost of each disease contains the direct medical cost and indirect social cost. The unit economic value of each disease can be calculated by the World Bank in 2007 calculation method and the method mentioned in Environmental and natural Resources Economics (Tenth Edition) written by Tietenberg, which contains the human capital law and disease cost method. The VSL is shown in Equation (4):
where L is the value of statistical life according to the World Bank calculation method; L1 is the loss of income caused by illness; L2 is the income loss caused by premature death; L3 is the increase in medical costs caused by illness; S is the per capita national income of the polluted area (CNY/year); P is the population of the polluted area; Ai is the incidence of type I disease in the polluted area higher than that in the control area; ti is the per capita loss of working time (years) resulting from the type i disease (recuperation or treatment), which includes the nursing time of non-medical personnel; Bi is the mortality rate that is higher in the polluted area than the control area, which was caused by type i disease; Ti is the per capita lost working time (years) due to premature death caused by type i disease; Ci is the per capita cost of medical care for type i diseases.
As the definition of the sick time of chronic bronchitis was difficult to determine, this paper comprehensively considered that the disease cost method could not be used. The current study generally considered the price of avoiding chronic bronchitis as 32% of its VSL; thus, it was appropriate to use the value as per unit of health loss for chronic bronchitis.
4. Results
4.1. Unit Economic Value of Each Health Effect Terminal
According to the currently available and reliable unit health economic loss value in China, taking the results of Xie [22] into account and adopting the VSL of Beijing as the benchmark data, this paper calculated each city’s VSL based on the income ratio compared to Beijing. Considering that the scope of the ‘2 + 26’ cities was wide and the income level was quite different, the average annual income of the urban population was selected as the weight. In addition, the VSL in Beijing was assessed to obtain the unit health economic loss value in the ‘2 + 26’ cities. Similarly, for the definition of the economic value unit of respiratory disease hospitalization, cardiovascular hospitalization, acute bronchitis, internal medicine clinics, pediatric clinics, and asthma, the disease cost method was mainly used. The cost conversion of each individual disease contained the direct medical cost conversion and the indirect social cost conversion. This paper used the World Bank’s method in Equation (4) to quantify the unit loss of each chosen health effect terminal. According to the China Health Statistics Yearbook in 2020, National Health Service survey data and the ratio of income of urban population in ‘2 + 26’ area in 2020, this paper calculated the unit medical expenses and the loss time of cardiovascular disease, respiratory disease hospitalization, outpatient medical department, and outpatient pediatrics as the unit economic loss value.
It can be seen from Figure 3 that, among all the health effect terminals, the unit economic loss of chronic bronchitis accounted for a larger proportion than other health effect terminals, which is followed by cardiovascular hospitalization, premature death (part of the VSL), respiratory illness hospitalization, acute bronchitis, asthma, and outpatient. In addition, it is shown that the unit economic loss of different cities in ‘2 + 26’ cities appears with similar distribution characteristics. Residents in Beijing, Zhengzhou, Binzhou, Jining, and Liaocheng suffer from PM2.5 pollution the most, while the unit economic loss of each health effect terminal is lower in Xingtai, Hengshui, and Baoding. In conclusion, the unit economic loss of all the health effect terminals in ‘2 + 26’ cities shows a spatial distribution pattern of high east and low west.
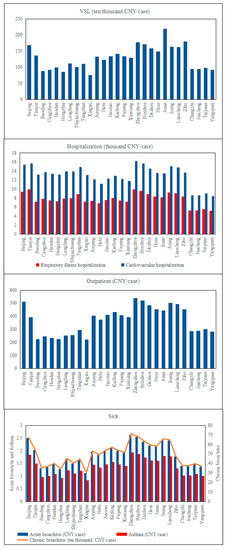
Figure 3.
Unit economic loss of each health terminal in ‘2 + 26’ cities.
The definition of the suffering time of chronic bronchitis was quite difficult to be determined, so it could not be calculated with the disease cost method. Thus, the paper define that the value of avoiding chronic bronchitis was equivalent to 32% of its VSL, which was taken as the unit loss of chronic bronchitis according to previous research. The unit loss value of acute bronchitis mainly referred to Huang and Zhang [23], and the ratio of the per capita income of urban population in ‘2 + 26’ cities was considered as the coefficient of the unit economic loss of various diseases in 2020. With these data, the unit loss of acute bronchitis and asthma in other cities could be converted. The unit economic loss of chosen terminals in ‘2 + 26’ cities had a certain amplification due to the use of the proportion of income.
4.2. Health Effect Loss in ‘2 + 26’ Cities
Due to the different levels of economic development in different cities and the uneven distribution of population density and air pollution within the ‘2 + 26’ cities, the health effect loss caused by PM2.5 is also different, showing regional differences. PM2.5 exposed the residents to a greater health threat. It can be seen from Figure 4 that different chosen health effect terminals had different sensitivities to PM2.5 pollution. The number of the residents affected by PM2.5 in ‘2 + 26’ cities was about 9397 (3988, 14,084) thousand. As for premature death, there were about 3412 (1654, 5114) thousand cases of premature death from PM2.5, which accounted for the largest proportion compared to other diseases. While the number of cases of chronic bronchitis was 216 (193, 247) thousand, the proportion of chronic bronchitis accounting for the total economic loss was the smallest, which was 216 (193–247) thousand cases. It can be concluded that, among all the negative impacts, the number of outpatient cases was the largest compared to other health effect terminals. The cases of premature deaths due to PM2.5 pollution were slightly fewer than those of the outpatient, showing that both two health effect terminals had a similar sensitivity to PM2.5 pollution. In addition, the cases of hospitalization also accounted for a great proportion that cannot be neglected.
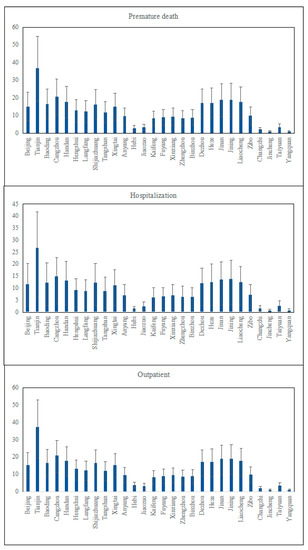
Figure 4.
‘2 + 26’ urban public health effect terminal loss values (ten thousand cases).
Tianjin, among all the cities, accounted for the largest proportion of cases compared to other cities to all three health terminals, while Hebi and Jincheng accounted for the smallest. Although the distribution of the PM2.5 concentration was uneven within the ‘2 + 26’ cities, the health effect loss did not follow the changes of the PM2.5 concentration and presented a spatial distribution in which the loss of those cities in the north-east of the region was large and that in the south-west of the region was low. There might be several reasons accounting for this situation, not only the location of the city might affect the number of cases, but also different environment policies that each city creates might be the core factors.
4.3. Total Health Effect Economic Loss in‘2 + 26’ Cities
The amount of economic loss caused by PM2.5 in ‘2 + 26’ cities in 2020 was CNY 4650.30 (2259.55, 6950.09) billion, accounting for 4.59% (2.22%, 6.86%) of the GDP.
4.3.1. The Economic Loss of Three Kinds of Health Terminals
It can be seen from Figure 5 that the sensitivity of each health effect terminal to the PM2.5 concentration was different. The economic loss caused by premature death caused by PM2.5 was about CNY 4560 (2210, 6840) trillion; the loss caused by hospitalization for respiratory diseases was about CNY 644.4 (329.6, 6838.07) billion; the loss caused by hospitalization for cardiovascular disease was about CNY 644.4 (329.6, 6838.07) billion; the loss caused by the outpatient was about CNY 12.27 (8.06, 16.18) billion.
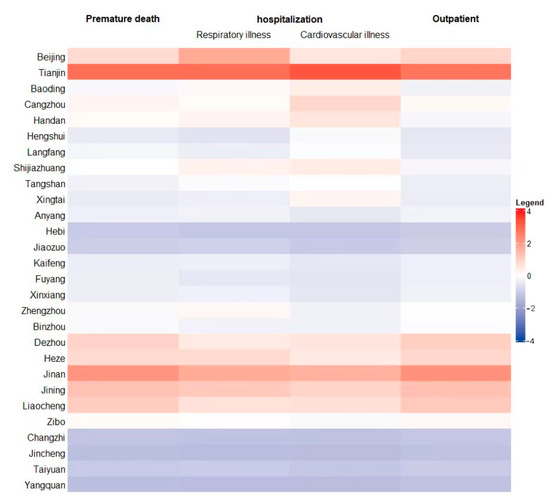
Figure 5.
Normalized economic loss of three kinds of health effect terminals in 2020.
From the comparison between each health terminal selected in this paper, we found that the economic loss from premature death accounted for the biggest proportion, which was 98.1% in the total loss, followed by chronic bronchitis (sick), respiratory and cardiovascular diseases (hospitalization), internal medicine (outpatient), asthma (sick), and pediatrics (outpatient).
In addition, it was found that premature death caused by PM2.5 pollution caused most of the economic loss. This is explained not only by the personal lost time but also from the way of determining VSL, which included the ratio of urban personal income. This amplified the economic loss of premature death to a certain extent, making it a bigger proportion in the total health effect economic loss, which also led to a larger proportion of GDP in 2020. Although the health effect economic loss of pediatric outpatient accounted for the smallest proportion, which was CNY 432 million, accounting for 0.02% of the total economic loss, due to the huge calculation base, the actual economic loss caused by it turned out to be an important part that cannot be ignored.
4.3.2. Total Economic Loss
As the economic growth level of each city was different, and the population intensity and air pollution degree were unevenly distributed within ‘2 + 26’ cities, the economic loss from PM2.5 was also different. It is revealed in Figure 6 that the loss of Tianjin, Jinan, and Jining were the largest, CNY 509.764 billion, CNY 481.83 billion, and CNY 314.84 billion, respectively, with a total economic loss of CNY 1244.44 billion, accounting for 26.7% of the total economic loss of ‘2 + 26’ cities in 2020. On the contrary, Jincheng and Yangquan in the Shanxi Province accounted for the lowest proportions of the health effect economic loss, which were both less than CNY 10 billion, CNY 9.145 billion, and CNY 9.605 billion, respectively. According to the ratio of the economic loss to GDP in each city, Baoding was the largest, with 8.62%, followed by Cangzhou, with 6.80%. The smallest were in Jincheng and Yangquan, which were 0.87% and 0.69%, respectively. Overall, the health effect economic loss was small in the east and large in the west, with larger loss in the north and south but smaller loss in the middle of the ‘2 + 26’ region.
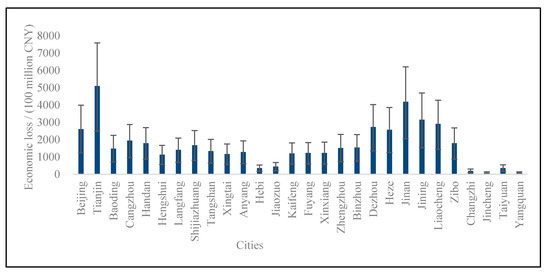
Figure 6.
Economic loss of ‘2 + 26’ cities in 2020.
Considering the geographical location of Jincheng and Yangquan, the proportion of energy and other industries related to PM2.5 in the urban industrial structure is smaller than that of other cities. At the same time, due to factors such as heating in the northern district, the economic losses caused by PM2.5 pollution in central and northern cities were larger than those in southern cities. In addition, the health effect economic losses of Beijing, Tianjin, Jinan, and Jining were above the average economic loss of all the ‘2 + 26’ cities, which could be affected by the larger exposed population and smaller core city area. On the contrary, the economic losses of Jiaozuo, Hebi, Taiyuan, Changzhi, Jincheng, and Yangquan were all smaller than CNY 100 billion, which implied that, other than geographical location, regional emissions policies also play a significant role in the process of the health effect economic loss. The proportion of health economic loss in the GDP of each city in ‘2 + 26’ cities can be ranked as Baoding, Cangzhou, Tianjin, Jinan, Jining, Liaocheng, Dezhou, Beijing, Heze, Handan, Zibo, Shijiazhuang, Binzhou, Zhengzhou, Langfang, Tangshan, Anyang, Xinxiang, Puyang, Kaifeng, Xingtai, Hengshui, Jiaozuo, Hebi, Taiyuan, Changzhi, Jincheng, and Yangquan.
5. Conclusions
5.1. Health Effect Loss Cannot Be Neglected
Among all the diseases, premature death, acute bronchitis, and asthma accounted for more than 80% of the total health effect economic loss. It can be concluded that different chosen health effect terminals had different sensitivities to PM2.5 pollution. In addition, the health effect economic loss of outpatient was the largest compared to other health effect terminals. The economic loss of premature death due to PM2.5 pollution was slightly smaller than that of outpatient, showing that both health effect terminals had similar sensitivities to PM2.5 pollution. In addition, the health effect economic loss of hospitalization also accounted for a great proportion that cannot be neglected.
5.2. The Economic Loss of Public Health Effect Presents Regional Differences
According to the results above, the economic loss of the public health effect in 2020 accounted for a non-negligible proportion of the GDP, and it presented geographical differences. It was concluded that the health effect economic loss was small in the east and large in the west, with larger loss in the north and south but smaller loss in the middle of the ‘2 + 26’ region. Inside the ‘2 + 26’ cities region, the economic loss from inland cities was smaller than that in other regions. The economic loss in some coastal cities were larger, which accounted for a large proportion. Tianjin, Jinan, and Jining had the biggest health economic losses while Jincheng and Yangquan accounted for the lowest proportion of health effect economic losses. This might be because Tianjin, Jinan, and Jining had more cases of premature death and a larger population. In addition, the lower PM2.5 concentration was inseparable from the smaller city core area, which resulted from the local government’s contribution to the reasonable land planning. Not only had it set up corresponding emission reduction policies, but it also made efforts in green public construction to achieve pollution reduction effects.
6. Policies
6.1. Continue to Implement Coal Consumption Control to Reduce Health Effect Loss
Overall, more attention should be paid to the health effect terminals that are closely related to the public health caused by PM2.5 pollution, especially premature death and outpatient. In general, these health effect terminals are generated from PM2.5 pollution, which consumes large proportions of coal and energy. Fortunately, the energy consumption structure of ‘2 + 26’ cities began to develop towards diversification. Compared with the national standard value, the percentage of coal consumption in total energy consumption was still large, while the proportion of clean energy was insufficient. For the northern and southern cities in the ‘2 + 26’ area, they need to continue to implement coal consumption control measures to reduce PM2.5 emissions. In addition, new air quality standards need to be revised to adapt to the different coal consuming policies. Only the establishment of strict air quality standards can truly protect the health of residents. In this case, air quality standards should be formulated more strictly.
6.2. Control the Level of Urbanization and Optimize the Arrangement of the Core Area
The population of the city appears to be one of the influencing factors of PM2.5 pollution. Normally, the number of residents is connected to the cases of premature death, respiratory disease, hospitalization and all the other chosen health effect terminals. With a larger population, the city tends to have more economic loss caused by air pollutants, especially PM2.5. People in these cities are more easily affected by the pollution generated by more permanent residents, in which case different cities need to take different actions to find out the most suitable population for its own in order to reduce the loss and prevent all the possible problems caused by overpopulation. Cities’ permanent population can be controlled through reasonable policy settings in order to slow down the degree of urbanization, which might lead to the minimization of PM2.5 pollution from overpopulation.
In addition, each city needs to determine its reasonable core area based on its different urban population, functions, and positioning to control PM2.5 pollution. At the same time, reasonable policy arrangements and government supervision also play a vital role in reducing the PM2.5 pollution concentration. At present, some ‘2 + 26’ cities have implemented measures to strengthen the management of single and double numbers of motor vehicles, traffic publicity guidance, and inspection of control of restricted vehicles. These policies have produced significant emission reduction effects.
Author Contributions
Conceptualization, L.L.; Data curation, Y.W., Y.J., Y.X., F.W. and Y.C.; Formal analysis, Y.W.; Methodology, Y.L. and S.W.; Writing—original draft, Y.W.; Writing—review & editing, Y.W., K.S. and L.L. All authors have read and agreed to the published version of the manuscript.
Funding
This research received no external funding. The authors express sincere thanks for the support from the National Natural Science Foundation of China under Grant No. 71803182 and 71773118, Beijing Social Science Foundation Project under Grant No. 19YJC023, National Science and Technology Major Project under Grant No. 2016ZX05016005-003, Open Fund of State Key Laboratory of Water Resource Protection and Utilization in Coal Mining under Grant No. SHJT-17-42.20, and Tianjin Academy of Social Sciences under Grant No. 19YZD-04.
Institutional Review Board Statement
Not applicable.
Informed Consent Statement
Not applicable.
Data Availability Statement
The datasets used and analysed during the current study are available from the corresponding author on reasonable request.
Conflicts of Interest
The authors declare that they have no competing financial interests or personal relationships reported in this paper.
References
- Dominici, F.; Samet, J.M.; Zeger, S.L. Combining evidence on air pollution and daily mortality from the 20 largest US cities: A hierarchical modelling strategy. J. R. Stat. Soc. Ser. A (Stat. Soc.) 2000, 163, 263–302. [Google Scholar] [CrossRef]
- Wang, G.; Song, Y.; Chen, J.; Yu, J. Valuation of Haze Management and Prevention Using the Contingent Valuation Method with the Sure Independence Screening Algorithm. Sustainability 2016, 8, 310. [Google Scholar] [CrossRef]
- Xu, L.Y.; Yin, H.; Xie, X.-D. Health Risk Assessment of Inhalable Particulate Matter in Beijing Based on the Thermal Environment. Int. J. Environ. Res. Public Health 2014, 11, 12368–12388. [Google Scholar] [CrossRef]
- Li, L.; Lei, Y.; Wu, S.; Huang, Z.; Luo, J.; Wang, Y.; Chen, J.; Yan, D. Evaluation of future energy consumption on PM2.5 emissions and public health economic loss in Beijing. J. Clean. Prod. 2018, 187, 1115–1128. [Google Scholar] [CrossRef]
- Haritash, A.K.; Kaushik, C.P. Assessment of Seasonal Enrichment of Heavy Metals in Respirable Suspended Particulate Matter of a Sub-Urban Indian City. Environ. Monit. Assess 2006, 128, 411–420. [Google Scholar] [CrossRef]
- Xie, W.; Li, G.; Zhao, D.; Xie, X.; Wei, Z.; Wang, W.; Wang, M.; Li, G.; Liu, W.; Sun, J.; et al. Relationship between fine particulate air pollution and ischaemic heart disease morbidity and mortality. Heart 2014, 101, 257–263. [Google Scholar] [CrossRef] [PubMed]
- Chen, B.H.; Hong, C.J. Quantitative assessment of the health impact of atmospheric sulfur dioxide pollution in Shanghai’s cities. J. Environ. Public Health 2002, 19, 11–13. [Google Scholar]
- Boulanger, G.; Bayeux, T.; Mandin, C.; Kirchner, S.; Vergriette, B.; Pernelet-Joly, V.; Kopp, P. Socio-economic costs of indoor air pollution: A tentative estimation for some pollutants of health interest in France. Environ. Int. 2017, 104, 14–24. [Google Scholar] [CrossRef] [PubMed]
- Wang, G.Z.; Wu, L.Y.; Chen, J.B.; Song, Y.X.; Chen, R.R. CGE analysis of health economic effects of PM2.5 pollution in Beijing. Chin. J. Health Econ. 2017, 37, 2779–2785. [Google Scholar]
- Xie, Y.; Dai, H.C.; Hanaoka, T.; Masui, T. The impact of PM2.5 pollution on population health and economic impact in Beijing, Tianjin and Hebei region. Popul. Resour. Environ. 2016, 26, 19–27. [Google Scholar]
- Wong, C.M.; Ma, S.; Hedley, A.J.; Lam, T.H. Effect of air pollution on daily mortality in Hong Kong. Environ. Health Perspect. 2001, 109, 335. [Google Scholar] [CrossRef] [PubMed]
- Xu, M.; Guo, Y.; Zhang, Y.; Westerdahl, D.; Mo, Y.; Liang, F.; Pan, X. Spatiotemporal analysis of particulate air pollution and ischemic heart disease mortality in Beijing, China. Environ. Health 2014, 13, 109. [Google Scholar] [CrossRef] [PubMed]
- Xie, Y.B.; Chen, J.; Li, W. Health risk and damage value assessment of Beijing residents exposed to high concentrations of PM2.5 during heavy smog. Environ. Sci. 2014, 35, 1–8. [Google Scholar]
- Etchie, T.O.; Sivanesan, S.; Adewuyi, G.O.; Krishnamurthi, K.; Rao, P.S.; Etchie, A.T.; Pillarisetti, A.; Arora, N.K.; Smith, K.R. The health burden and economic costs averted by ambient PM2.5 pollution reductions in Nagpur, India. Environ. Int. 2017, 102, 145–156. [Google Scholar] [CrossRef] [Green Version]
- Han, S.J.; Wang, J.; Yan, Q.S.; Yang, L.M.; Zhao, Q.Y.; Wang, S.B.; Li, C.; Zhang, Y.S.; Zhang, R.Q. Health Benefit Evaluation of PM10 and PM2.5 Pollution Control in Zhengzhou City from 2014 to 2016. Environ. Sci. Policy 2019, 40, 2565–2571. [Google Scholar]
- Zeng, X.G.; Ruan, F.F.; Peng, Y.Y. Spatial distribution of PM2.5 pollution health effects in China based on spatial grid scale. China Environ. Sci. 2019, 39, 2624–2632. [Google Scholar]
- Yao, M.; Wu, G.; Zhao, X.; Zhang, J. Estimating health burden and economic loss attributable to short-term exposure to multiple air pollutants in China. Environ. Res. 2020, 183, 109184. [Google Scholar] [CrossRef] [PubMed]
- Zhang, Z.X.; Cao, H. “2+26” urban haze governance policy effect evaluation. China Popul. Resour. Environ. 2022, 32, 26–36. [Google Scholar]
- Wang, J.; Zhang, L.; Niu, X.; Liu, Z. Effects of PM2.5 on health and economic loss: Evidence from Beijing-Tianjin-Hebei region of China. J. Clean. Prod. 2020, 257, 120605. [Google Scholar] [CrossRef]
- Kan, H.D.; Chen, B.H.; Wang, H. Economic evaluation of airborne particulate pollution on residents’ health in Shanghai. Chin. J. Health Econ. 2004, 23, 8–11. [Google Scholar]
- Xie, P.; Liu, X.Y.; Liu, Z.R.; Li, T.T.; Zhong, L.J.; Xiang, Y.R. Impact of air pollution on human health in the Pearl River Delta. J. Environ. Sci. China 2010, 30, 997–1003. [Google Scholar]
- Xie, X.X. Health Value: Environmental Benefit Evaluation Method and Urban Air Pollution Control Strategy. Ph.D. Thesis, Peking University, Beijing, China, 2011. [Google Scholar]
- Huang, D.S.; Zhang, S.Q. Health Benefit Evaluation of PM2. 5 Pollution Control in Beijing-Tianjin-Hebei Region. J. Environ. Sci. China 2013, 3, 166–174. [Google Scholar]
Publisher’s Note: MDPI stays neutral with regard to jurisdictional claims in published maps and institutional affiliations. |
© 2022 by the authors. Licensee MDPI, Basel, Switzerland. This article is an open access article distributed under the terms and conditions of the Creative Commons Attribution (CC BY) license (https://creativecommons.org/licenses/by/4.0/).