
Development of the Anthropometric Grouping Index for the Eastern Caribbean Population Using the Eastern Caribbean Health Outcomes Research Network (ECHORN) Cohort Study Data

 , , and
Abstract
:1. Introduction
2. Materials and Methods
Statistical Methods
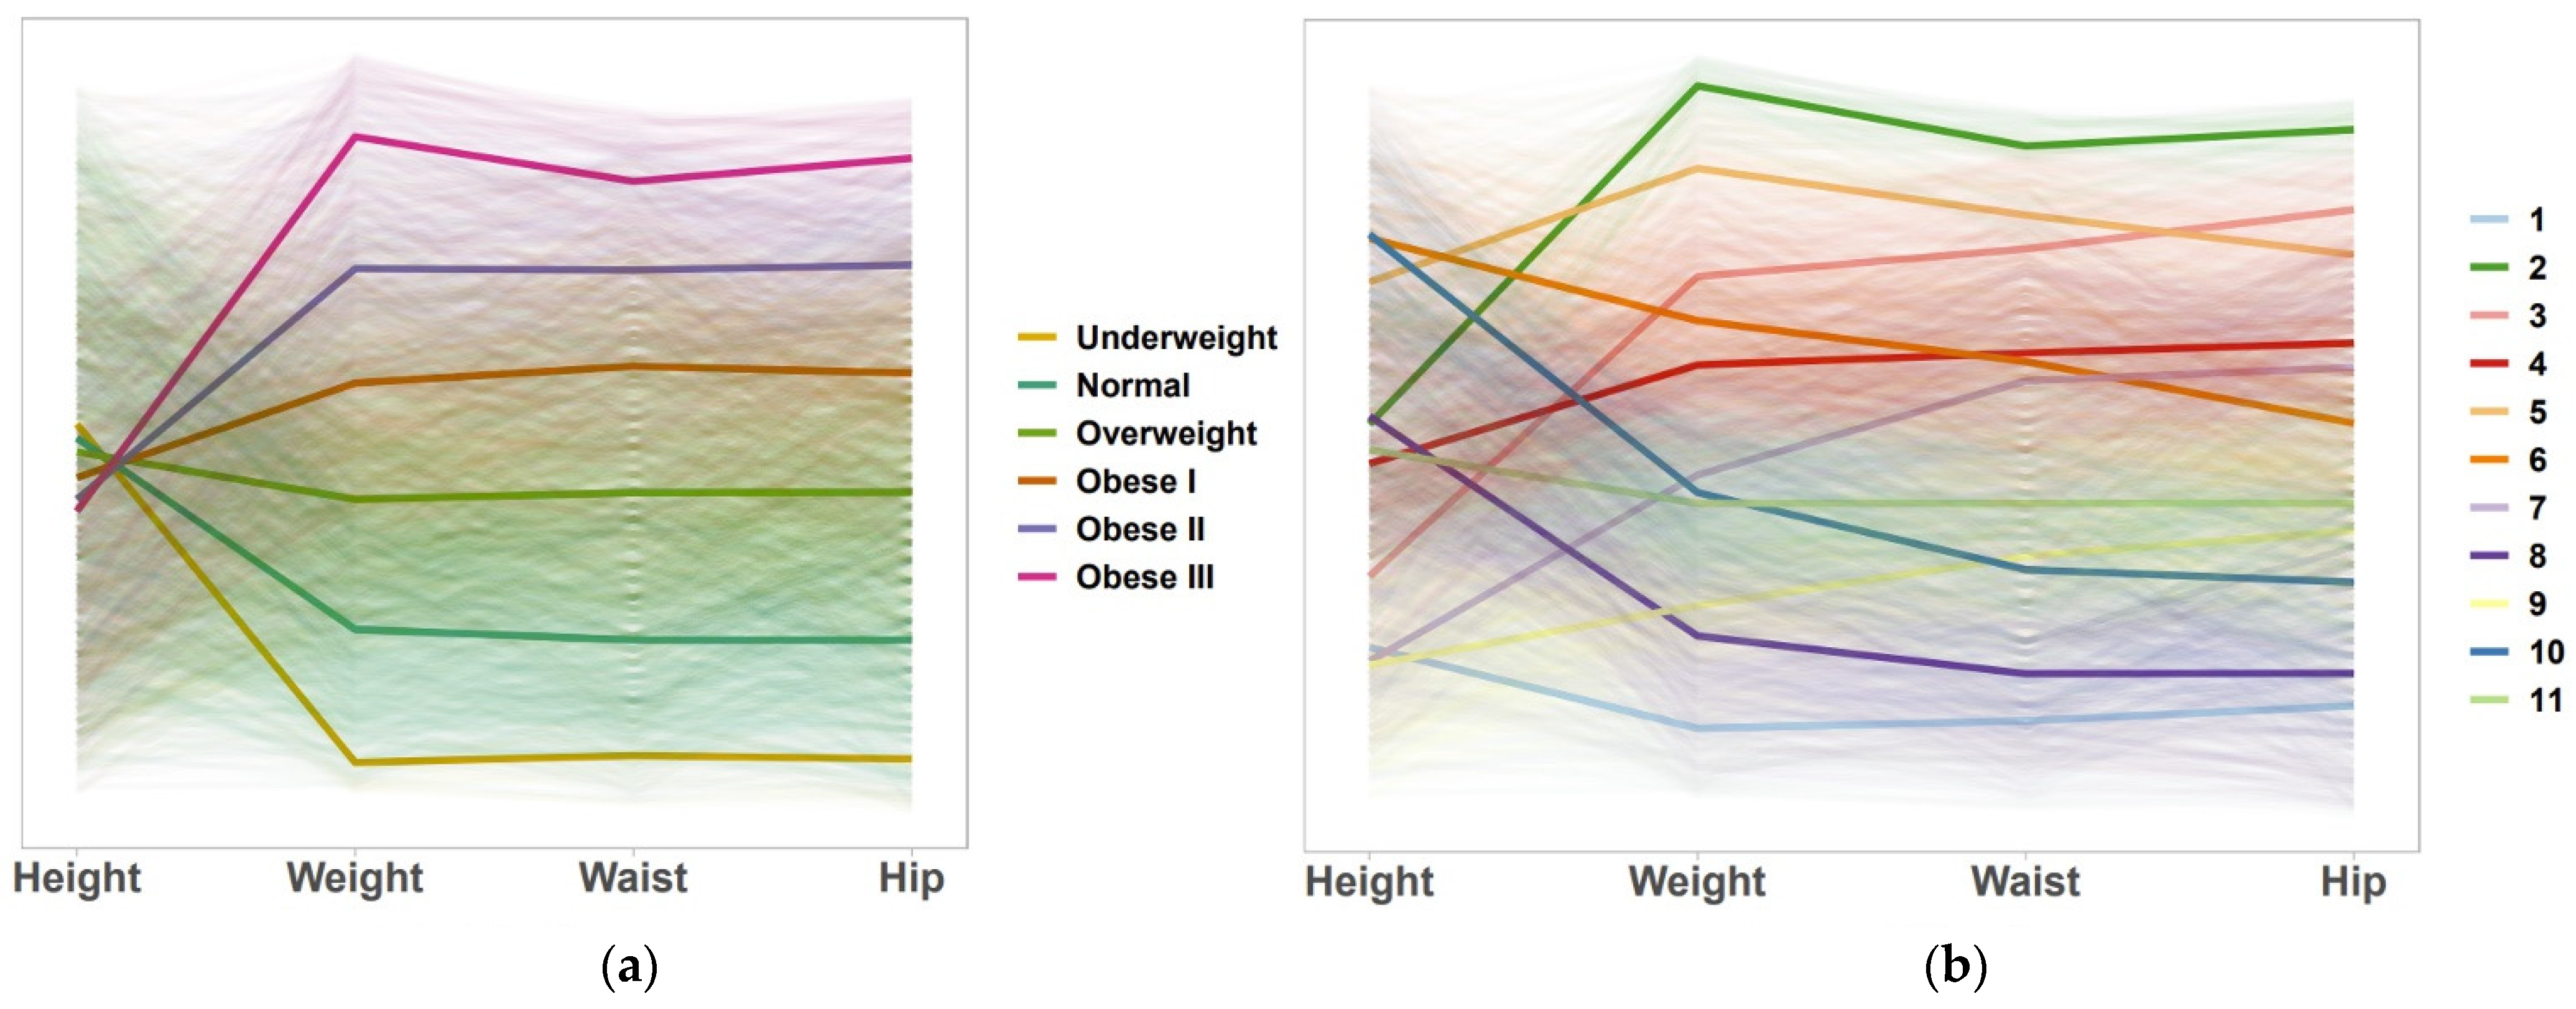
3. Results
3.1. AGI-11
3.2. Average Anthropometric Measures by AGI-11 and BMI
3.3. Association between Blood Sugar Level and AGI Using Generalized Linear Mixed Models (GLMM)
4. Discussion
5. Conclusions
Author Contributions
Funding
Institutional Review Board Statement
Informed Consent Statement
Data Availability Statement
Acknowledgments
Conflicts of Interest
References
- NCD Risk Factor Collaboration (NCD-RisC). Trends in adult body-mass index in 200 countries from 1975 to 2014: A pooled analysis of 1698 population-based measurement studies with 19·2 million participants. Lancet 2016, 387, 1377–1396. [Google Scholar] [CrossRef] [Green Version]
- Barao, K.; Forones, N.M. Body mass index: Different nutritional status according to WHO, OPAS and Lipschitz classifications in gastrointestinal cancer patients. Arq. Gastroenterol. 2012, 49, 169–171. [Google Scholar] [CrossRef] [PubMed] [Green Version]
- Nuttall, F.Q. Body mass index: Obesity, BMI, and health: A critical review. Nutr. Today 2015, 50, 117–128. [Google Scholar] [CrossRef] [PubMed] [Green Version]
- Bergman, R.N.; Stefanovski, D.; Buchanan, T.A.; Sumner, A.E.; Reynolds, J.C.; Sebring, N.G.; Xiang, A.H.; Watanabe, R.M. A better index of body adiposity. Obesity 2011, 19, 1083–1089. [Google Scholar] [CrossRef]
- Garrido-Chamorro, R.P.; Sirvent-Belando, J.E.; Gonzalez-Lorenzo, M.; Martin-Carratala, M.L.; Roche, E. Correlation between body mass index and body composition in elite athletes. J. Sports Med. Phys. Fit. 2009, 49, 278–284. [Google Scholar]
- International Agency for Research on Cancer. Absence of Excess Body Fatness; IARC Handb Cancer Prev.: Lyon, France, 2018. [Google Scholar]
- Luke, A.; Durazo-Arvizu, R.; Rotimi, C.; Prewitt, T.E.; Forrester, T.; Wilks, R.; Ogunbiyi, O.J.; Schoeller, D.A.; McGee, D.; Cooper, R.S. Relation between body mass index and body fat in black population samples from Nigeria, Jamaica, and the United States. Am. J. Epidemiol. 1997, 145, 620–628. [Google Scholar] [CrossRef] [PubMed] [Green Version]
- Ortega, F.B.; Sui, X.; Lavie, C.J.; Blair, S.N. Body mass index, the most widely used but also widely criticized index: Would a criterion standard measure of total body fat be a better predictor of cardiovascular disease mortality? Mayo Clin. Proc. 2016, 91, 443–455. [Google Scholar] [CrossRef] [Green Version]
- Rahman, M.; Berenson, A.B. Accuracy of current body mass index obesity classification for white, black, and Hispanic reproductive-age women. Obstet. Gynecol. 2010, 115, 982–988. [Google Scholar] [CrossRef] [Green Version]
- Thomas, D.M.; Bredlau, C.; Bosy-Westphal, A.; Mueller, M.; Shen, W.; Gallagher, D.; Maeda, Y.; McDougall, A.; Peterson, C.M.; Ravussin, E.; et al. Relationships between body roundness with body fat and visceral adipose tissue emerging from a new geometrical model. Obesity 2013, 21, 2264–2271. [Google Scholar] [CrossRef] [Green Version]
- Davis, J.; Juarez, D.; Hodges, K. Relationship of ethnicity and body mass index with the development of hypertension and hyperlipidemia. Ethn. Dis. 2013, 23, 65–70. [Google Scholar]
- Alperet, D.J.; Lim, W.Y.; Mok-Kwee Heng, D.; Ma, S.; van Dam, R.M. Optimal anthropometric measures and thresholds to identify undiagnosed type 2 diabetes in three major Asian ethnic groups. Obesity 2016, 24, 2185–2193. [Google Scholar] [CrossRef] [PubMed]
- Bertoli, S.; Leone, A.; Krakauer, N.Y.; Bedogni, G.; Vanzulli, A.; Redaelli, V.I.; De Amicis, R.; Vignati, L.; Krakauer, J.C.; Battezzati, A. Association of body shape index (ABSI) with cardio-metabolic risk factors: A cross-sectional study of 6081 Caucasian adults. PLoS ONE 2017, 12, e0185013. [Google Scholar]
- Liu, J.; Tse, L.A.; Liu, Z.; Rangarajan, S.; Hu, B.; Yin, L.; Leong, D.P.; Li, W.; PURE (Prospective Urban Rural Epidemiology) Study in China. Predictive values of anthropometric measurements for cardiometabolic risk factors and cardiovascular diseases among 44 048 Chinese. J. Am. Heart Assoc. 2019, 8, e010870. [Google Scholar] [CrossRef] [PubMed]
- Alvim, R.; Mourao-Junior, C.A.; de Oliveira, C.M.; Krieger, J.E.; Mill, J.G.; Pereira, A.C. Body mass index, waist circumference, body adiposity index, and risk for type 2 diabetes in two populations in Brazil: General and Amerindian. PLoS ONE 2014, 9, e100223. [Google Scholar]
- De Oliveira, C.M.; Pavani, J.; Krieger, J.E.; de Oliveira Alvim, R.; Mourão-Junior, C.A.; da Costa Pereira, A. Body adiposity index in assessing the risk of type 2 diabetes mellitus development: The Baependi Heart Study. Diabetol. Metab. Syndr. 2019, 11, 76. [Google Scholar] [CrossRef] [Green Version]
- De Oliveira, C.M.; Ulbrich, A.Z.; Neves, F.S.; Dias, F.; Horimoto, A.; Krieger, J.E.; Alvim, R.O.; Pereira, A. Association between anthropometric indicators of adiposity and hypertension in a Brazilian population: Baependi Heart Study. PLoS ONE 2017, 12, e0185225. [Google Scholar]
- Goh, L.G.; Dhaliwal, S.S.; Welborn, T.A.; Lee, A.H.; Della, P.R. Ethnicity and the association between anthropometric indices of obesity and cardiovascular risk in women: A cross-sectional study. BMJ Open 2014, 4, e004702. [Google Scholar] [CrossRef] [Green Version]
- Gupta, S.; Kapoor, S. Body adiposity index: Its relevance and validity in assessing body fatness of adults. ISRN Obes 2014, 2014, 243294. [Google Scholar] [CrossRef] [Green Version]
- Lin, Y.A.; Chen, Y.J.; Tsao, Y.C.; Yeh, W.C.; Li, W.C.; Tzeng, I.S.; Chen, J.Y. Relationship between obesity indices and hypertension among middle-aged and elderly populations in Taiwan: A community-based, cross-sectional study. BMJ Open 2019, 9, e031660. [Google Scholar] [CrossRef] [Green Version]
- Nguyen Ngoc, H.; Kriengsinyos, W.; Rojroongwasinkul, N.; Aekplakorn, W. Association of adiposity indices with hypertension in middle-aged and elderly Thai population: National Health Examination Survey 2009 (NHES-IV). J. Cardiovasc. Dev. Dis. 2019, 6, 13. [Google Scholar] [CrossRef] [Green Version]
- Ononamadu, C.J.; Ezekwesili, C.N.; Onyeukwu, O.F.; Umeoguaju, U.F.; Ezeigwe, O.C.; Ihegboro, G.O. Comparative analysis of anthropometric indices of obesity as correlates and potential predictors of risk for hypertension and prehypertension in a population in Nigeria. Cardiovasc. J. Afr. 2017, 28, 92–99. [Google Scholar] [CrossRef] [PubMed]
- Quaye, L.; Owiredu, W.; Amidu, N.; Dapare, P.; Adams, Y. Comparative abilities of body mass index, waist circumference, abdominal volume index, body adiposity index, and conicity index as predictive screening tools for metabolic syndrome among apparently healthy Ghanaian adults. J. Obes. 2019, 2019, 8143179. [Google Scholar] [CrossRef] [PubMed]
- Sun, K.; Lin, D.; Feng, Q.; Li, F.; Qi, Y.; Feng, W.; Yang, C.; Yan, L.; Ren, M.; Liu, D. Assessment of adiposity distribution and its association with diabetes and insulin resistance: A population-based study. Diabetol. Metab. Syndr. 2019, 11, 51. [Google Scholar] [CrossRef] [PubMed]
- Wang, F.; Chen, Y.; Chang, Y.; Sun, G.; Sun, Y. New anthropometric indices or old ones: Which perform better in estimating cardiovascular risks in Chinese adults. BMC Cardiovasc. Disord. 2018, 18, 14. [Google Scholar] [CrossRef] [PubMed] [Green Version]
- Wang, Q.; Wang, Z.; Yao, W.; Wu, X.; Huang, J.; Huang, L.; Sun, Y. Anthropometric indices predict the development of hypertension in normotensive and pre-hypertensive middle-aged women in Tianjin, China: A prospective cohort study. Med. Sci. Monit 2018, 24, 1871–1879. [Google Scholar] [CrossRef] [PubMed] [Green Version]
- Zayas-Martínez, L. Development of the Caribbean Anthropometric Index; UPR Medical Sciences Campus: San Juan, Puerto Rico, 2019. [Google Scholar]
- Bray, G.; Bouchard, C. (Eds.) Handbook of Obesity: Epidemiology, Etiology, and Physiopathology, 3rd ed.; CRC Press: Boca Raton, FL, USA, 2014. [Google Scholar]
- Barnes, A.S. The epidemic of obesity and diabetes: Trends and treatments. Tex. Heart Inst. J. 2011, 38, 142–144. [Google Scholar]
- Spatz, E.S.; Martinez-Brockman, J.L.; Tessier-Sherman, B.; Mortazavi, B.; Roy, B.; Schwartz, J.I.; Nazario, C.M.; Maharaj, R.; Nunez, M.; Adams, O.P.; et al. Phenotypes of hypertensive ambulatory blood pressure patterns: Design and rationale of the ECHORN Hypertension Study. Ethn. Dis. 2019, 29, 535–544. [Google Scholar]
- ECHORN Coordinating Center. ECHORN Cohort Study Wave 1: Manual of Procedures; Eastern Caribbean Health Outcomes Research Network: New Haven, CT, USA, 2014. [Google Scholar]
- MacQueen, J. Some methods for classification and analysis of multivariate observations. In Proceedings of the Fifth Berkeley Symposium on Mathematical Statistics and Probability, Los Angeles, CA, USA, 21 June–18 July 1965; Le Cam, L.M., Neyman, J., Eds.; University of California Press: Berkeley, CA, USA, 1967; pp. 281–297. [Google Scholar]
- Sugar, C.A.; James, G.M. Finding the number of clusters in a dataset: An information-theoretic approach. J. Am. Stat. Assoc. 2003, 98, 750–763. [Google Scholar] [CrossRef]
- Maitra, R.; Melnykov, V. Simulating data to study performance of finite mixture modeling and clustering algorithms. J. Comput. Graph. Stat. 2010, 4, 354–376. [Google Scholar] [CrossRef] [Green Version]
- Almodóvar-Rivera, I.; Maitra, R. Kernel-estimated nonparametric overlap-based syncytial clustering. J. Mach. Learn. Res. 2020, 21, 1–54. [Google Scholar]
- Maitra, R. A re-defined and generalized percent-overlap-of-activation measure for studies of fMRI reproducibility and its use in identifying outlier activation maps. Neuroimage 2010, 50, 124–135. [Google Scholar] [CrossRef] [PubMed] [Green Version]


| 1 | 2 | 3 | 4 | 5 | 6 | 7 | 8 | 9 | 10 | 11 | |
|---|---|---|---|---|---|---|---|---|---|---|---|
| 1 | 1 | 0.0001 | 0.0001 | 0.0003 | 0.0001 | 0.0002 | 0.0011 | 0.0971 | 0.0902 | 0.001 | 0.0076 |
| 2 | 0.0001 | 1 | 0.0026 | 0.0002 | 0.0059 | 0.0001 | 0.0001 | 0.0001 | 0.0001 | 0.0001 | 0.0001 |
| 3 | 0.0001 | 0.0026 | 1 | 0.0652 | 0.0185 | 0.0022 | 0.0319 | 0.0001 | 0.0005 | 0.0002 | 0.0014 |
| 4 | 0.0003 | 0.0002 | 0.0652 | 1 | 0.0121 | 0.0705 | 0.1117 | 0.0013 | 0.0058 | 0.0073 | 0.0866 |
| 5 | 0.0001 | 0.0059 | 0.0185 | 0.0121 | 1 | 0.0238 | 0.0007 | 0.0001 | 0.0001 | 0.0003 | 0.0005 |
| 6 | 0.0002 | 0.0001 | 0.0022 | 0.0705 | 0.0238 | 1 | 0.0026 | 0.0012 | 0.0007 | 0.0573 | 0.0308 |
| 7 | 0.0011 | 0.0001 | 0.0319 | 0.1117 | 0.0007 | 0.0026 | 1 | 0.0021 | 0.0786 | 0.0013 | 0.0796 |
| 8 | 0.0971 | 0.0001 | 0.0001 | 0.0013 | 0.0001 | 0.0012 | 0.0021 | 1 | 0.0669 | 0.0594 | 0.1108 |
| 9 | 0.0902 | 0.0001 | 0.0005 | 0.0058 | 0.0001 | 0.0007 | 0.0786 | 0.0669 | 1 | 0.0028 | 0.1135 |
| 10 | 0.001 | 0.0001 | 0.0002 | 0.0073 | 0.0003 | 0.0573 | 0.0013 | 0.0594 | 0.0028 | 1 | 0.1133 |
| 11 | 0.0076 | 0.0001 | 0.0014 | 0.0866 | 0.0005 | 0.0308 | 0.0796 | 0.1108 | 0.1135 | 0.1133 | 1 |
| K | nk | Height (cm) | Weight (kg) | Waist (cm) | Hip (cm) | |
|---|---|---|---|---|---|---|
| AGI-11 | 1 | 223 | 155.38 ± 4.44 | 53.2 ± 5.06 | 74.52 ± 5.67 | 91.8 ± 4.9 |
| 2 | 67 | 166.92 ± 7.97 | 131.6 ± 13.20 | 126.96 ± 9.98 | 142.31 ± 7.98 | |
| 3 | 192 | 159 ± 4.46 | 98.10 ± 7.77 | 109.52 ± 7.76 | 126.6 ± 5.39 | |
| 4 | 347 | 165.1 ± 3.48 | 89.09 ± 6.63 | 100.38 ± 6.23 | 114.03 ± 5.05 | |
| 5 | 134 | 175.44 ± 5.96 | 111.9 ± 8.78 | 113.52 ± 7.13 | 121.83 ± 6.56 | |
| 6 | 269 | 177.67 ± 4.87 | 93.47 ± 7.04 | 100 ± 5.81 | 108.39 ± 5.07 | |
| 7 | 270 | 154.8 ± 4.25 | 78.18 ± 6.16 | 98.62 ± 5.69 | 112.25 ± 5.25 | |
| 8 | 286 | 167.3 ± 4.41 | 62.46 ± 5.5 | 78.5 ± 5.61 | 94.05 ± 5.19 | |
| 9 | 373 | 154.55 ± 4.34 | 65.46 ± 5.4 | 86.63 ± 5.45 | 101.78 ± 4.51 | |
| 10 | 259 | 177.75 ± 4.57 | 76.46 ± 6.01 | 86.07 ± 5.71 | 99.17 ± 4.94 | |
| 11 | 471 | 165.59 ± 3.42 | 75.41 ± 5.80 | 90.43 ± 5.24 | 103.38 ± 4.81 | |
| BMI | 1: Underweight | 37 | 166.61 ± 9.41 | 48.67 ± 6.17 | 69.89 ± 7.24 | 87.84 ± 7.24 |
| 2: Normal | 707 | 165.93 ± 9.68 | 62.64 ± 8.44 | 80.61 ± 7.13 | 95.64 ± 5.71 | |
| 3: Overweight | 1024 | 165.26 ± 9.45 | 75.46 ± 9.39 | 90.89 ± 7.42 | 103.95 ± 5.87 | |
| 4: Obese I | 659 | 164 ± 9.21 | 86.89 ± 10.41 | 99.33 ± 8.15 | 111.74 ± 6.73 | |
| 5: Obese II | 313 | 162.88 ± 8.44 | 98.73 ± 11.10 | 107.02 ± 9.14 | 120.44 ± 7.26 | |
| 6: Obese III | 151 | 162.38 ± 8.66 | 117.46 ± 17.08 | 117.65 ± 12 | 134.18 ± 10.51 |
| K | POR | 95% CI | |
|---|---|---|---|
| AGI-11 | 1 | 1.65 | (1.05, 2.61) |
| 2 | 3.73 | (2.02, 6.86) | |
| 3 | 2.79 | (1.76, 4.41) | |
| 4 | 1.97 | (1.31, 2.98) | |
| 5 | 2.66 | (1.62, 4.37) | |
| 6 | 2.23 | (1.45, 3.44) | |
| 7 | 2.37 | (1.54, 3.64) | |
| 8 b | 1 | - | |
| 9 | 1.51 | (0.99, 2.29) | |
| 10 | 0.93 | (0.57, 1.51) | |
| 11 | 1.81 | (1.23, 2.66) | |
| BMI | 1: Underweight | 0.2 | (0.05, 0.85) |
| 2: Normal b | 1 | - | |
| 3: Overweight | 1.17 | (0.92, 1.48) | |
| 4: Obese I | 1.87 | (1.45, 2.42) | |
| 5: Obese II | 2.01 | (1.47, 2.75) | |
| 6: Obese III | 2.57 | (1.68, 3.74) |
Publisher’s Note: MDPI stays neutral with regard to jurisdictional claims in published maps and institutional affiliations. |
© 2022 by the authors. Licensee MDPI, Basel, Switzerland. This article is an open access article distributed under the terms and conditions of the Creative Commons Attribution (CC BY) license (https://creativecommons.org/licenses/by/4.0/).
Share and Cite
Almodóvar-Rivera, I.A.; Rosario-Rosado, R.V.; Nazario, C.M.; Hernández-Santiago, J.; Ramírez-Marrero, F.A.; Nunez, M.; Maharaj, R.; Adams, P.; Martinez-Brockman, J.L.; Tessier-Sherman, B.; et al. Development of the Anthropometric Grouping Index for the Eastern Caribbean Population Using the Eastern Caribbean Health Outcomes Research Network (ECHORN) Cohort Study Data. Int. J. Environ. Res. Public Health 2022, 19, 10415. https://doi.org/10.3390/ijerph191610415
Almodóvar-Rivera IA, Rosario-Rosado RV, Nazario CM, Hernández-Santiago J, Ramírez-Marrero FA, Nunez M, Maharaj R, Adams P, Martinez-Brockman JL, Tessier-Sherman B, et al. Development of the Anthropometric Grouping Index for the Eastern Caribbean Population Using the Eastern Caribbean Health Outcomes Research Network (ECHORN) Cohort Study Data. International Journal of Environmental Research and Public Health. 2022; 19(16):10415. https://doi.org/10.3390/ijerph191610415
Chicago/Turabian StyleAlmodóvar-Rivera, Israel A., Rosa V. Rosario-Rosado, Cruz M. Nazario, Johan Hernández-Santiago, Farah A. Ramírez-Marrero, Maxime Nunez, Rohan Maharaj, Peter Adams, Josefa L. Martinez-Brockman, Baylah Tessier-Sherman, and et al. 2022. "Development of the Anthropometric Grouping Index for the Eastern Caribbean Population Using the Eastern Caribbean Health Outcomes Research Network (ECHORN) Cohort Study Data" International Journal of Environmental Research and Public Health 19, no. 16: 10415. https://doi.org/10.3390/ijerph191610415
APA StyleAlmodóvar-Rivera, I. A., Rosario-Rosado, R. V., Nazario, C. M., Hernández-Santiago, J., Ramírez-Marrero, F. A., Nunez, M., Maharaj, R., Adams, P., Martinez-Brockman, J. L., Tessier-Sherman, B., & Nunez-Smith, M., on behalf of the ECHORN Writing Group. (2022). Development of the Anthropometric Grouping Index for the Eastern Caribbean Population Using the Eastern Caribbean Health Outcomes Research Network (ECHORN) Cohort Study Data. International Journal of Environmental Research and Public Health, 19(16), 10415. https://doi.org/10.3390/ijerph191610415