
Comparative Analysis of Male Cyclist Population in Four Asia Countries for Anthropometric Measurements


Abstract
1. Introduction
2. Materials and Methods
2.1. Participants
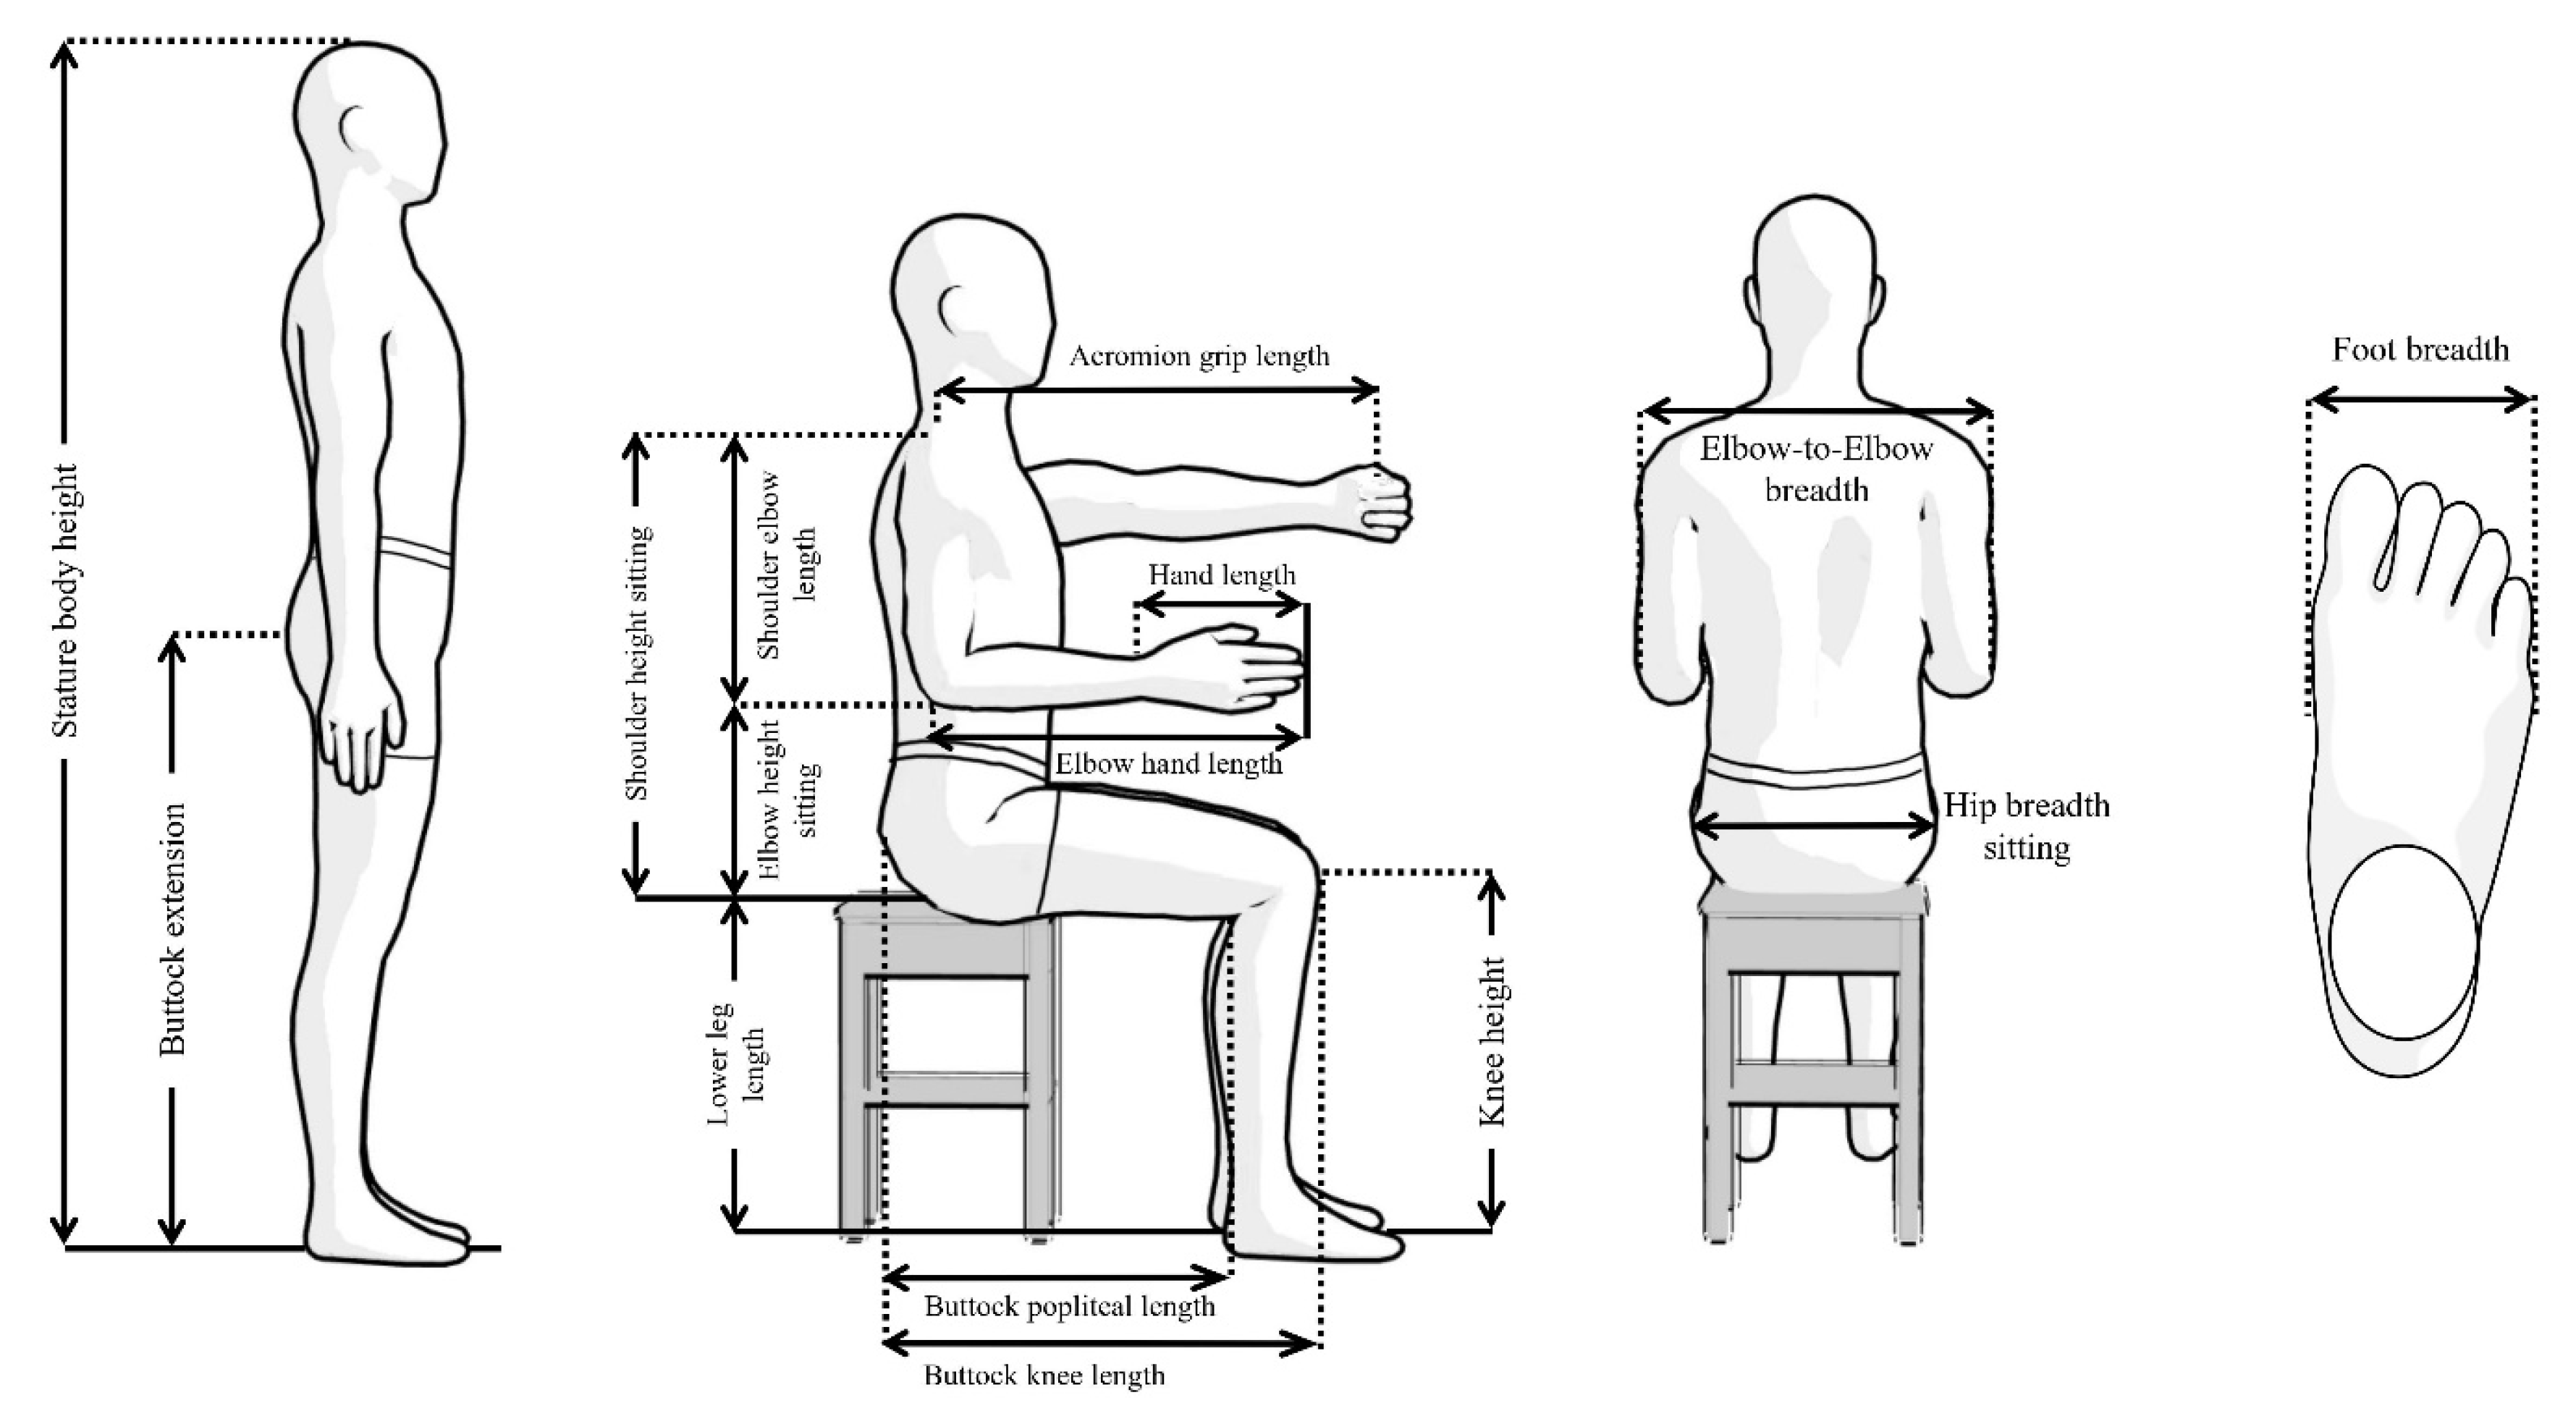
2.2. Selection of Anthropometric Variables
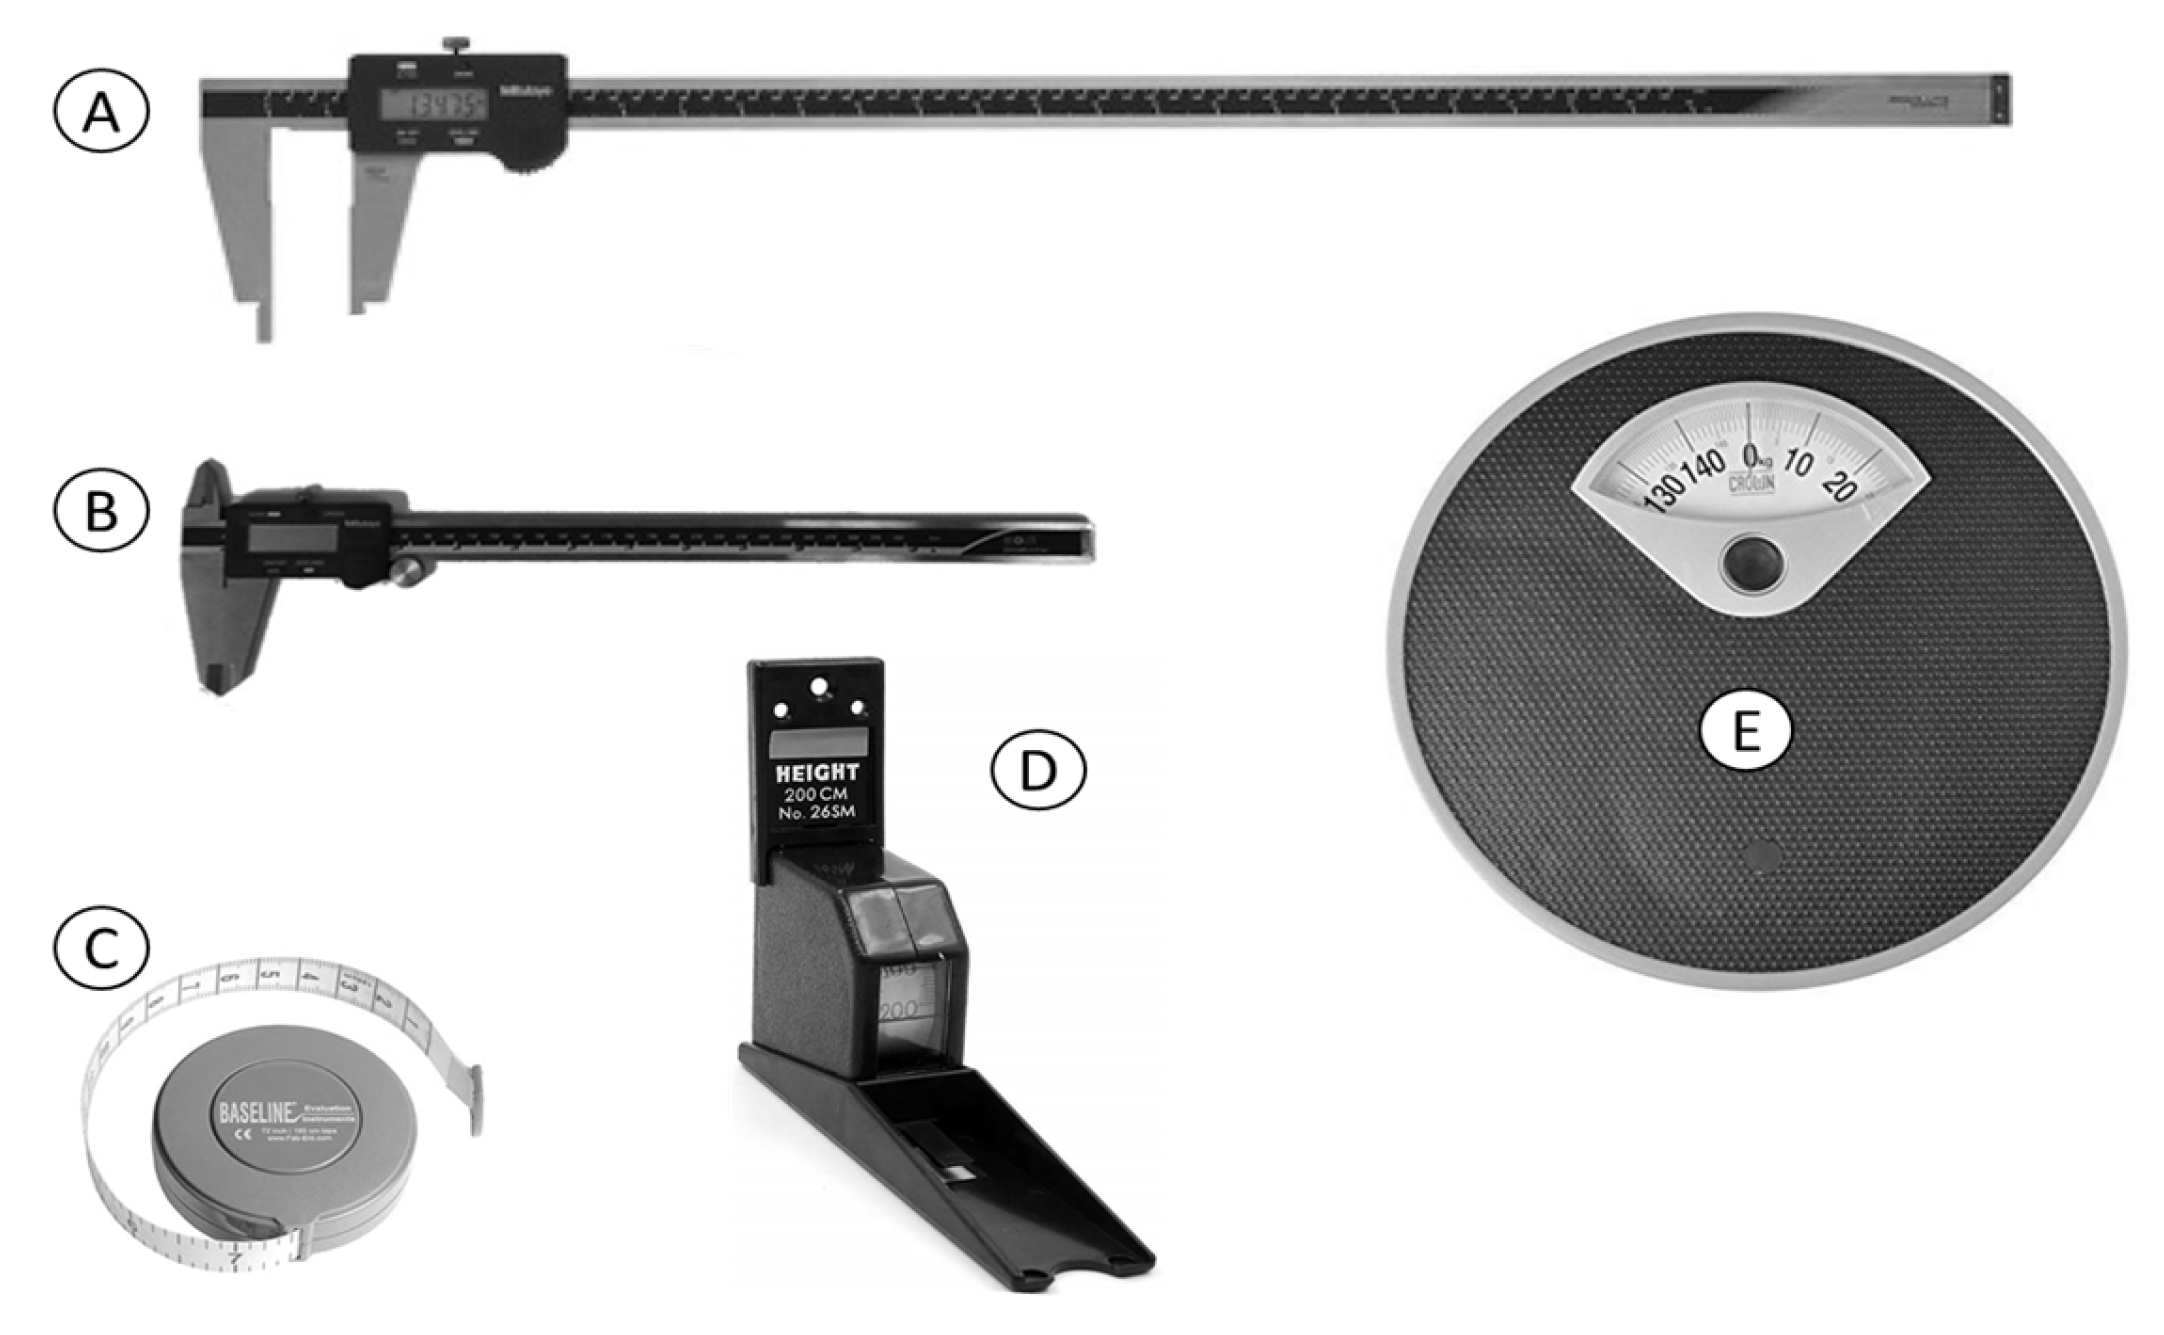
2.3. Measuring Instruments
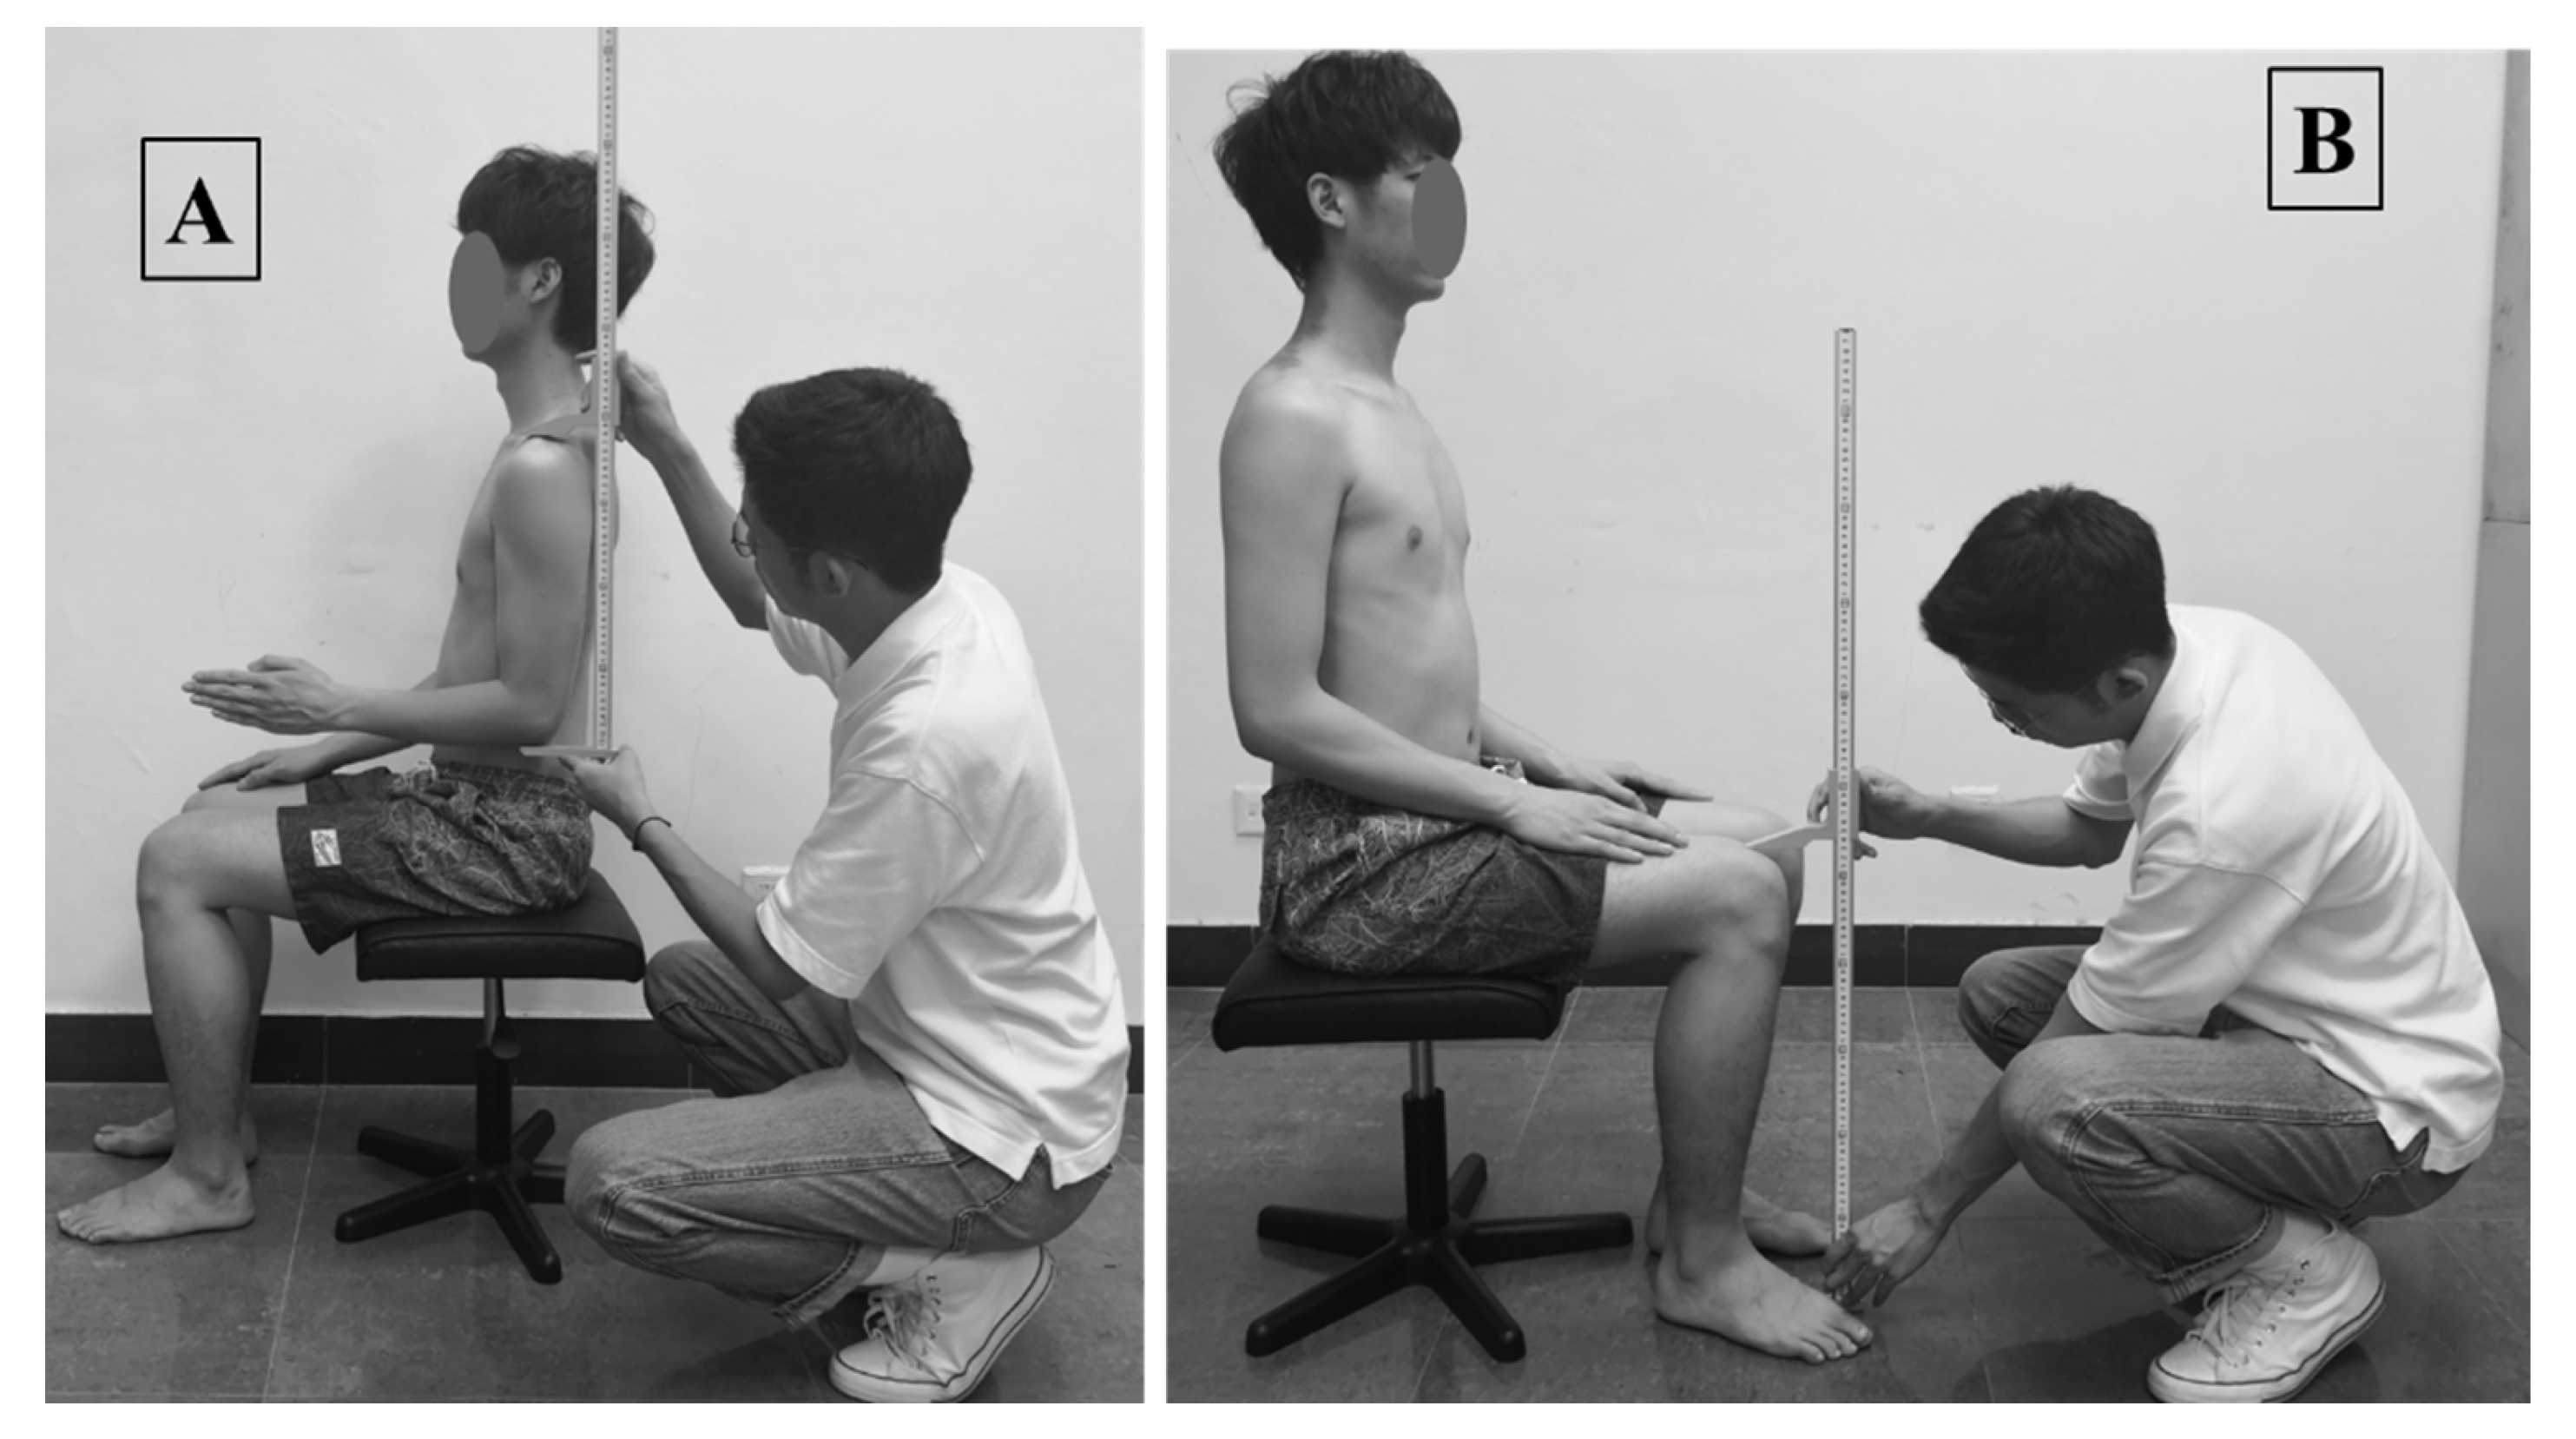
2.4. Measurement Procedure
2.5. Intra-/Inter- Reliability Assessment of Anthropometry
2.6. Data Analysis
3. Results
4. Discussion
5. Conclusions
Author Contributions
Funding
Institutional Review Board Statement
Informed Consent Statement
Data Availability Statement
Conflicts of Interest
Appendix A

| Anthropometric Variables | Confidence Interval | Chinese | Indian | Taiwanese | Singaporeans | |
|---|---|---|---|---|---|---|
| Stature body height | 95% Confidence Interval for Mean | Lower Bound | 1710.74 | 1680.81 | 1710.38 | 1668.51 |
| Upper Bound | 1734.10 | 1707.56 | 1731.55 | 1698.75 | ||
| Std. Deviation | 59.78 | 68.78 | 54.95 | 76.20 | ||
| Buttock extension | 95% Confidence Interval for Mean | Lower Bound | 872.56 | 832.64 | 854.58 | 956.57 |
| Upper Bound | 903.09 | 856.15 | 869.84 | 975.97 | ||
| Std. Deviation | 78.10 | 60.43 | 39.63 | 48.90 | ||
| Shoulder height (Sitting) | 95% Confidence Interval for Mean | Lower Bound | 613.47 | 571.20 | 509.94 | 570.42 |
| Upper Bound | 630.42 | 583.23 | 523.66 | 589.00 | ||
| Std. Deviation | 43.38 | 30.92 | 35.62 | 46.84 | ||
| Shoulder-elbow length | 95% Confidence Interval for Mean | Lower Bound | 360.76 | 350.09 | 251.22 | 325.55 |
| Upper Bound | 375.36 | 358.79 | 258.40 | 346.45 | ||
| Std. Deviation | 37.35 | 22.38 | 18.63 | 52.66 | ||
| Elbow height (Sitting) | 95% Confidence Interval for Mean | Lower Bound | 243.91 | 217.00 | 256.62 | 237.40 |
| Upper Bound | 259.17 | 227.50 | 267.37 | 250.02 | ||
| Std. Deviation | 39.03 | 27.01 | 27.90 | 31.81 | ||
| Lower leg length | Mean | 425.69 | 447.60 | 419.97 | 413.90 | |
| 95% Confidence Interval for Mean | Lower Bound | 417.77 | 439.58 | 414.84 | 408.37 | |
| Upper Bound | 433.62 | 455.61 | 425.10 | 419.43 | ||
| Std. Deviation | 40.55 | 41.19 | 26.62 | 27.88 | ||
| Knee height | 95% Confidence Interval for Mean | Lower Bound | 527.47 | 542.67 | 503.37 | 493.31 |
| Upper Bound | 538.43 | 559.79 | 512.91 | 509.09 | ||
| Std. Deviation | 28.04 | 44.03 | 24.76 | 39.74 | ||
| Acromion-grip length | 95% Confidence Interval for Mean | Lower Bound | 623.07 | 621.17 | 563.71 | 639.99 |
| Upper Bound | 638.88 | 637.18 | 574.21 | 663.81 | ||
| Std. Deviation | 40.45 | 41.14 | 27.26 | 60.04 | ||
| Hand length | 95% Confidence Interval for Mean | Lower Bound | 181.13 | 175.03 | 176.09 | 180.49 |
| Upper Bound | 189.67 | 180.23 | 179.93 | 183.85 | ||
| Std. Deviation | 21.83 | 13.38 | 9.98 | 8.47 | ||
| Elbow-hand length | 95% Confidence Interval for Mean | Lower Bound | 443.44 | 469.51 | 362.80 | 456.79 |
| Upper Bound | 454.49 | 479.59 | 370.34 | 467.33 | ||
| Std. Deviation | 28.26 | 25.91 | 19.59 | 26.58 | ||
| Buttock-popliteal length | 95% Confidence Interval for Mean | Lower Bound | 430.79 | 490.09 | 350.04 | 449.87 |
| Upper Bound | 446.01 | 505.37 | 359.62 | 460.57 | ||
| Std. Deviation | 38.95 | 39.29 | 24.88 | 26.96 | ||
| Buttock-knee length | 95% Confidence Interval for Mean | Lower Bound | 534.05 | 588.29 | 447.78 | 556.45 |
| Upper Bound | 561.01 | 602.02 | 459.74 | 568.05 | ||
| Std. Deviation | 68.97 | 35.29 | 31.04 | 29.21 | ||
| Elbow-Elbow breadth | 95% Confidence Interval for Mean | Lower Bound | 442.06 | 422.84 | 394.65 | 429.26 |
| Upper Bound | 461.10 | 437.78 | 403.56 | 440.64 | ||
| Std. Deviation | 48.70 | 38.41 | 23.15 | 28.67 | ||
| Hip breadth (Sitting) | 95% Confidence Interval for Mean | Lower Bound | 352.53 | 331.53 | 371.65 | 302.97 |
| Upper Bound | 367.68 | 342.24 | 381.84 | 311.37 | ||
| Std. Deviation | 38.76 | 27.54 | 26.44 | 21.19 | ||
| Foot breadth | 95% Confidence Interval for Mean | Lower Bound | 98.69 | 100.11 | 103.40 | 99.73 |
| Upper Bound | 105.27 | 103.33 | 105.21 | 102.39 | ||
| Std. Deviation | 16.82 | 8.27 | 4.70 | 6.70 | ||
| Weight (kg) | 95% Confidence Interval for Mean | Lower Bound | 68.26 | 66.15 | 65.94 | 64.47 |
| Upper Bound | 72.45 | 70.32 | 69.24 | 67.41 | ||
| Std. Deviation | 10.72 | 10.72 | 8.56 | 7.42 | ||
| BMI (kg/m2) | 95% Confidence Interval for Mean | Lower Bound | 23.08 | 23.09 | 21.87 | 22.84 |
| Upper Bound | 24.33 | 24.51 | 22.87 | 23.69 | ||
| Std. Deviation | 3.22 | 3.67 | 2.61 | 2.13 | ||
| Anthropometric Variables | Singaporean vs. Taiwanese | Singaporean vs. Chinese | Singaporean vs. Indian | Taiwanese vs. Chinese | Indian vs. Taiwanese | Indian vs. Chinese |
|---|---|---|---|---|---|---|
| Stature body height | 86.7 | 85.67 | 98.62 | 104.22 | 91.58 | 90.66 |
| 119.35 | 117.85 | 106.24 | 105.81 | 119.16 | 117.47 | |
| Buttock extension | 150.74 | 136.49 | 149.64 | 88.45 | 97.54 | 82.55 |
| 58.94 | 68.51 | 57.18 | 122.03 | 113.31 | 125.66 | |
| Shoulder height (Sitting) | 140.45 | 77.13 | 102.76 | 56.46 | 147.46 | 71.41 |
| 68.65 | 126.15 | 102.25 | 154.96 | 64.33 | 136.91 | |
| Shoulder-elbow length | 152.48 | 85.82 | 92.04 | 53.51 | 158.46 | 95.04 |
| 57.3 | 117.71 | 112.56 | 157.99 | 53.54 | 113.04 | |
| Elbow height (Sitting) | 85.66 | 93.02 | 122.27 | 111.34 | 68.85 | 79.18 |
| 120.33 | 110.72 | 83.49 | 98.47 | 141.46 | 129.06 | |
| Lower leg length | 95.83 | 87.31 | 75.12 | 97.28 | 128.69 | 119.18 |
| 110.74 | 116.27 | 128.83 | 112.95 | 82.75 | 88.67 | |
| Knee height | 92.66 | 73.69 | 67.95 | 79.04 | 140.23 | 118.74 |
| 113.73 | 129.49 | 135.73 | 131.71 | 71.43 | 89.12 | |
| Acromion-grip length | 145.83 | 112.97 | 114 | 62.12 | 146.92 | 104.88 |
| 63.57 | 91.35 | 91.44 | 149.13 | 64.86 | 103.12 | |
| Hand length | 116.84 | 92.29 | 113.6 | 85.53 | 104.96 | 86.42 |
| 90.92 | 111.43 | 91.83 | 125.03 | 106.03 | 121.75 | |
| Elbow-hand length | 156.14 | 116.79 | 90.6 | 54.84 | 158.49 | 130.43 |
| 53.84 | 87.64 | 113.94 | 156.62 | 53.51 | 77.31 | |
| Buttock-popliteal length | 155.69 | 117.59 | 70.1 | 58.14 | 158.43 | 141 |
| 54.26 | 86.86 | 133.66 | 153.22 | 53.57 | 66.64 | |
| Buttock-knee length | 155.48 | 112.83 | 75.81 | 57.13 | 158.45 | 133.39 |
| 54.47 | 91.49 | 128.16 | 154.26 | 53.55 | 74.33 | |
| Elbow-to-elbow breadth | 139.11 | 84.22 | 105.09 | 63.21 | 132.75 | 87.87 |
| 69.91 | 119.26 | 100.01 | 148.01 | 78.76 | 120.29 | |
| Hip breadth (Sitting) | 52.57 | 60.59 | 70.25 | 122.2 | 67.61 | 82.98 |
| 151.55 | 142.2 | 133.51 | 87.3 | 142.68 | 125.23 | |
| Foot breadth | 88.42 | 106.83 | 98.71 | 123.33 | 97.18 | 109.5 |
| 117.73 | 97.32 | 106.14 | 86.13 | 113.67 | 98.45 | |
| BMI | 116.23 | 96.98 | 95.4 | 90.93 | 119.86 | 106.53 |
| 91.49 | 106.87 | 109.33 | 119.48 | 91.42 | 101.44 | |
| Weight | 96.8 | 87.74 | 93.29 | 96.95 | 109.42 | 100.73 |
| 109.83 | 115.84 | 111.36 | 113.28 | 101.65 | 107.3 |
| Characteristic | Singapore (SGD) | India (INR) | Taiwan (ROC) | China (PRC) | ||||||||
|---|---|---|---|---|---|---|---|---|---|---|---|---|
| Mean | Range | Mean | Range | Mean | Range | Mean | Range | |||||
| Min | Max | Min | Max | Min | Max | Min | Max | |||||
| Age (Yrs.) | 27 | 20 | 56 | 25 | 18 | 37 | 30 | 20 | 49 | 32 | 19 | 59 |
| Body surface area (m2) | 1.76 | 1.46 | 2.20 | 1.78 | 1.33 | 2.11 | 1.79 | 1.54 | 2.33 | 1.83 | 1.33 | 2.33 |
| HRmax (beats/min) | 194 | 175 | 198 | 195 | 187 | 199 | 192 | 180 | 198 | 191 | 173 | 199 |
| Performance level (VO2) | 79 | 78 | 82 | 79 | 78 | 80 | 79 | 78 | 81 | 79 | 78 | 82 |
| Years of practice | 9 | 2 | 38 | 7 | 1 | 19 | 12 | 2 | 31 | 14 | 1 | 41 |
| Weekly training load (km) | 2650 | 2452 | 2978 | 2785 | 2125 | 3250 | 2700 | 1985 | 2985 | 2520 | 2085 | 2920 |
| Anthropometric Variables | Intra-Observer Technical Error (%TEM) | Inter-Observer Technical Error (%TEM) | ||||||
|---|---|---|---|---|---|---|---|---|
| Singapore (SGD) | India (INR) | Taiwan (ROC) | China (PRC) | Singapore (SGD) | India (INR) | Taiwan (ROC) | China (PRC) | |
| Stature body height | 0.47 | 0.51 | 0.35 | 0.49 | 0.11 | 0.24 | 0.34 | 0.45 |
| Buttock extension | 0.32 | 0.34 | 0.28 | 0.30 | 0.35 | 0.48 | 0.54 | 0.54 |
| Shoulder height (Sitting) | 0.94 | 0.93 | 0.86 | 0.84 | 1.20 | 1.09 | 1.24 | 0.59 |
| Shoulder-elbow length | 1.11 | 1.24 | 0.92 | 1.01 | 0.98 | 1.09 | 1.32 | 1.45 |
| Elbow height (Sitting) | 1.73 | 1.68 | 1.45 | 1.64 | 1.20 | 1.54 | 1.05 | 0.95 |
| Lower leg length | 1.2 | 1.23 | 0.89 | 0.98 | 0.89 | 0.97 | 0.85 | 1.57 |
| Knee height | 0.40 | 0.54 | 0.65 | 0.35 | 0.68 | 0.78 | 0.56 | 1.25 |
| Acromion-grip length | 0.64 | 0.79 | 0.68 | 0.54 | 0.60 | 0.63 | 0.70 | 1.01 |
| Hand length | 1.33 | 1.35 | 1.21 | 1.01 | 1.21 | 1.51 | 1.24 | 1.32 |
| Elbow-hand length | 0.91 | 0.93 | 0.78 | 0.89 | 0.78 | 0.88 | 0.78 | 0.85 |
| Buttock-popliteal length | 1.10 | 1.39 | 1.56 | 1.23 | 0.68 | 0.87 | 0.74 | 0.65 |
| Buttock-knee length | 0.86 | 0.66 | 0.98 | 0.78 | 0.65 | 0.73 | 0.69 | 0.95 |
| Elbow-to-elbow breadth | 0.64 | 0.80 | 0.75 | 0.74 | 0.85 | 0.89 | 0.94 | 1.02 |
| Hip breadth (Sitting) | 0.95 | 0.96 | 0.98 | 0.9 | 1.01 | 1.18 | 1.25 | 1.35 |
| Foot breadth | 0.64 | 0.78 | 0.85 | 0.54 | 0.94 | 0.98 | 0.86 | 0.89 |
| Weight | 0.23 | 0.15 | 0.3 | 0.25 | 0.23 | 0.34 | 0.32 | 0.35 |
References
- World Health Organization. Physical Activity. Available online: https://www.euro.who.int/en/health-topics/environment-and-health/Transport-and-health/data-and-statistics/physical-activity2 (accessed on 20 March 2021).
- Pucher, J.; Buehler, R.; Seinen, M. Bicycling renaissance in North America? an update and re-appraisal of cycling trends and policies. Transport. Res. Part A Pol. Pract. 2011, 45, 451–475. [Google Scholar] [CrossRef]
- Young, M.; Savan, B.; Manaugh, K.; Scott, L. Mapping the demand and potential for cycling in Toronto. Int. J. Sustain. Transport. 2021, 15, 285–293. [Google Scholar] [CrossRef]
- Assunçao-Denis, M.; Tomalty, R. Increasing cycling for transportation in Canadian communities: Understanding what works. Transport. Res. A Pol. Pract. 2019, 123, 288–304. [Google Scholar] [CrossRef]
- Aldred, R.; Woodcock, J.; Goodman, A. Does more cycling mean more diversity in cycling? Transp. Rev. 2016, 36, 28–44. [Google Scholar] [CrossRef]
- Chen, C.F.; Chen, P.C. Estimating recreational cyclists’ preferences for bicycle routes—Evidence from Taiwan. Transp. Policy 2013, 26, 23–30. [Google Scholar] [CrossRef]
- Hsieh, L.Y.; Lin, Y.C.; Lee, Y.H.; Lee, S.T. Relationship between bikeway image, tourism value and intention to revisit bikeways in Taiwan. J. Inf. Optim. Sci. 2021, 42, 235–248. [Google Scholar] [CrossRef]
- Goel, R.; Goodman, A.; Aldred, R.; Nakamura, R.; Tatah, L.; Martin, L.; Garcia, T.; Zapata-Diomedi, B.; De Sa, T.H.; Tiwari, G.; et al. Cycling behaviour in 17 countries across 6 continents: Levels of cycling, who cycles, for what purpose, and how far? Transp. Rev. 2022, 42, 58–81. [Google Scholar] [CrossRef]
- Streisfeld, G.M.; Bartoszek, C.; Creran, E.; Inge, B.; McShane, M.D.; Johnston, T. Relationship between body positioning, muscle activity, and spinal kinematics in cyclists with and without low back pain: A systematic review. Sports Health 2017, 9, 75–79. [Google Scholar] [CrossRef]
- Brand, A.; Sepp, T.; Klöpfer-Krämer, I.; Müßig, J.A.; Kröger, I.; Wackerle, H.; Augat, P. Upper Body posture and muscle activation in recreational cyclists: Immediate effects of variable cycling setups. Res. Q. Exerc. Sport. 2020, 91, 298–308. [Google Scholar] [CrossRef]
- Garimella, R.; Peeters, T.; Parrilla, E.; Uriel, J.; Sels, S.; Huysmans, T.; Verwulgen, S. Estimating cycling aerodynamic performance using anthropometric measures. Appl. Sci. 2020, 10, 8635. [Google Scholar] [CrossRef]
- Menaspa, P.; Rampinini, E.; Bosio, A.; Carlomagno, D.; Riggio, M.; Sassi, A. Physiological and anthropometric characteristics of junior cyclists of different specialties and performance levels. Scand. J. Med. Sci. Sports 2012, 22, 392–398. [Google Scholar] [CrossRef] [PubMed]
- Brunkhorst, L.; Kielstein, H. Comparison of anthropometric characteristics between professional triathletes and cyclists. Biol. Sport 2013, 30, 269–273. [Google Scholar] [CrossRef] [PubMed]
- Grainger, K.; Dodson, Z.; Korff, T. Predicting bicycle setup for children based on anthropometrics and comfort. Appl. Ergon. 2017, 59, 449–459. [Google Scholar] [CrossRef] [PubMed]
- Wadsworth, D.J.S.; Weinrauch, P. The roel of a bike fit in cyclists with hip pain. A clinical commentary. Int. J. Sports Phys. Ther. 2019, 14, 468–486. [Google Scholar] [CrossRef]
- Holliday, W.; Swart, J. Anthropometrics, flexibility and training history as determinants for bicycle configuration. Sports Med. Health Sci. 2021, 3, 93–100. [Google Scholar] [CrossRef]
- Scoz, R.D.; Amorim, C.F.; Espindola, T.; Santiago, M.; Mendes, J.J.B.; De Oliverira, P.R.; Ferreira, L.M.A.; Brito, R.N. Discomfort, pain and fatigue levels of 160 cyclists after a kinematic bike-fitting method: An experimental study. BMJ Open Sport Exerc. Med. 2021, 7, e001096. [Google Scholar] [CrossRef]
- Wang, E.M.Y.; Wang, M.J.; Yeh, W.Y.; Shih, Y.C.; Lin, Y.C. Development of anthropometric work environment for Taiwanese workers. Int. J. Ind. Ergon. 1999, 23, 3–8. [Google Scholar] [CrossRef]
- Del Prado-Lu, J.L. Anthropometric measurement of Filipino manufacturing workers. Int. J. Ind. Ergon. 2007, 37, 497–503. [Google Scholar] [CrossRef]
- Klamklay, J.; Sungkhapong, A.; Yodpijit, N.; Patterson, P.E. Anthropometry of the southern Thai population. Int. J. Ind. Ergon. 2008, 38, 111–118. [Google Scholar] [CrossRef]
- Iseri, A.; Arslan, N. Estimated anthropometric measurements of Turkish adults and effects of geographical regions. Int. J. Ind. Ergon. 2009, 39, 860–865. [Google Scholar]
- Khadem, M.M.; Islam, M.A. Development of anthropometric data for Bangladeshi male population. Int. J. Ind. Ergon. 2014, 44, 407–412. [Google Scholar] [CrossRef]
- Sadeghi, F.; Mazloumi, A.; Kazemi, Z. An anthropometric data bank for the Iranian working population with ethnic diversity. Appl. Ergon. 2015, 48, 95–103. [Google Scholar] [CrossRef] [PubMed]
- Dawal, S.Z.M.; Ismail, Z.; Yusuf, K.; Abdul-Rashid, S.H.; Shalahim, N.S.M.; Abdullah, N.S.; Kamil, N.S.M. Determination of the significant anthropometry dimensions for user-friendly designs of domestic furniture and appliances—Experience from a study in Malaysia. Measurement 2015, 59, 205–215. [Google Scholar] [CrossRef]
- Vyavahare, R.T.; Kallurkar, S.P. Anthropometry of male agricultural workers of western India for the design of tools and equipment. Int. J. Ind. Ergon. 2016, 53, 80–85. [Google Scholar] [CrossRef]
- Hartono, M. Indonesian anthropometry update for special populations incorporating Drillis and Contini revisited. Int. J. Ind. Ergon. 2018, 64, 89–101. [Google Scholar] [CrossRef]
- Lee, Y.C.; Chen, C.H.; Lee, C.H. Body anthropometric measurements of Singaporean adult and elderly population. Measurement 2019, 148, 106949. [Google Scholar] [CrossRef]
- Arunachalam, M.; Singh, S.P.; Karmakar, S. Determination of the key anthropometric and range of motion measurements for the ergonomic design of motorcycle. Measurement 2020, 159, 107751. [Google Scholar] [CrossRef]
- Lin, Y.C.; Wang, M.J.J.; Wang, E.M. The comparisons of anthropometric characteristics among four peoples in East Asia. Appl. Ergon. 2004, 35, 173–178. [Google Scholar] [CrossRef]
- Yap, W.S.; Chan, C.C.; Chan, S.P.; Wang, Y.T. Ethnic difference in anthropometry among adult Singaporean, Malay and Indians, and their effects on lung volumes. Respir. Med. 2001, 95, 297–304. [Google Scholar] [CrossRef][Green Version]
- Mohammad, Y.A. Anthropometric characteristics of the hand based on laterality and sex among Jordanian. Int. J. Ind. Ergon. 2005, 35, 747–754. [Google Scholar] [CrossRef]
- Chuan, T.K.; Hartono, M.; Kumar, N. Anthropometry of the Singaporean and Indonesian populations. Int. J. Ind. Ergon. 2010, 40, 757–766. [Google Scholar] [CrossRef]
- Widyanti, A.; Susanti, L.; Sutalaksana, I.Z.; Muslim, K. Ethnic differences in Indonesian anthropometry data: Evidence from three different largest ethnics. Int. J. Ind. Ergon. 2015, 47, 72–78. [Google Scholar] [CrossRef]
- Bhattacharjya, R.B.; Kakoty, S.K. A survey of the anthropometric data relating to five ethnic groups in Assam considering gender and ethnic diversity: Application of the data in designing an improvised pedal-operated Chaak. Int. J. Ind. Ergon. 2020, 76, 102927. [Google Scholar] [CrossRef]
- Da Silva, G.V.; Gordon, C.C.; Halpern, M. Comparison of anthropometry of Brazilian and US Military population for flight deck design. Int. J. Ind. Ergon. 2018, 64, 170–177. [Google Scholar] [CrossRef]
- Rahman, N.I.; Dawal, S.Z.; Yusoff, N.; Kamil, N.S.M. Anthropometric measurements among four Asian countries in designing sitting and standing workstations. Sādhanā 2018, 43, 10. [Google Scholar] [CrossRef]
- Krejcie, R.V.; Morgan, D.W. Determining sample size for research activities. Educ. Psychol. Meas. 1970, 30, 607–610. [Google Scholar] [CrossRef]
- McLean, B.D.; Parker, A.W. An anthropometric analysis of elite Australian track cyclists. J. Sports Sci. 1989, 7, 247–255. [Google Scholar] [CrossRef]
- Hsiao, S.W.; Chen, R.Q.; Leng, W.L. Applying riding-posture optimization on bicycle frame design. Appl. Ergon. 2015, 51, 69–79. [Google Scholar] [CrossRef]
- Foley, J.P.; Bird, S.R.; White, J.A. Anthropometric comparison of cyclists from different events. Br. J. Sports Med. 1989, 23, 30–33. [Google Scholar] [CrossRef]
- Donkers, P.C.M.; Toussaint, H.M.; Molenbroek, J.F.M.; Steenbekkers, L.P.A. Recommendations for the assessment and design of young children’s bicycles on the basis of anthropometric data. Appl. Ergon. 1993, 24, 109–118. [Google Scholar] [CrossRef]
- Laios, L.; Giannatsis, J. Ergonomic evaluation and redesign of children bicycles based on anthropometric data. Appl. Ergon. 2010, 41, 428–435. [Google Scholar] [CrossRef] [PubMed]
- Christiaans, H.H.; Bremner, A. Comfort on bicycles and the validity of a commercial bicycle fitting system. Appl. Ergon. 1998, 29, 201–211. [Google Scholar] [CrossRef]
- Lee, Y.C.; Lin, G.; Wang, M.J.J. Comparing 3D foot scanning with conventional measurement methods. J. Foot Ankle Res. 2014, 7, 44. [Google Scholar] [CrossRef]
- Mishra, P.; Pandey, C.M.; Singh, U.; Gupta, A.; Sahu, C.; Keshri, A. Descriptive statistics and normality tests for statistical data. Ann. Card. Anaesth. 2019, 22, 67. [Google Scholar] [PubMed]
- Fujimoto, S.; Watanabe, T. Studies on the body surface area of Japanese. Acta Med. Nagasaki 1969, 13, 1–13. [Google Scholar]
- Nes, B.M.; Janszky, I.; Wisløff, U.; Støylen, A.; Karlsen, T. Age-predicted maximal heart rate in healthy subjects: The HUNT Fitness Study. Scand. J. Med. Sci. Sports 2013, 23, 697–704. [Google Scholar] [CrossRef]
- Uth, N.; Sørensen, H.; Overgaard, K.; Pedersen, P.K. Estimation of VO2max from the ratio between HRmax and HRrest—The heart rate ratio method. Eur. J. Appl. Physiol. 2004, 91, 111–115. [Google Scholar] [CrossRef]


| Characteristic | Mean | Range | |
|---|---|---|---|
| Min | Max | ||
| Age (Yrs.) | 28 | 18 | 50 |
| Body surface area (m2) | 1.79 | 1.47 | 2.20 |
| HRmax (beats/min) | 193 | 179 | 199 |
| Performance level (VO2) | 79 | 78 | 81 |
| Years of practice | 10 | 1 | 32 |
| Weekly training load (km) | 2664 | 2162 | 3033 |
| S. No | Anthropometric | Countries | Median | Mean | Std. Deviation | Minimum | Maximum | Interquartile Range | Range | Percentiles | ||
|---|---|---|---|---|---|---|---|---|---|---|---|---|
| 5th | 50th | 95th | ||||||||||
| 1 | Stature body height | India | 1680 | 1694.18 | 68.78 | 1540.00 | 1875.00 | 99.25 | 335.00 | 1599.00 | 1680.00 | 1823.75 |
| Singapore | 1677 | 1683.63 | 76.20 | 1521.00 | 1900.00 | 102.75 | 379.00 | 1552.40 | 1677.00 | 1820.00 | ||
| Taiwan | 1715.8 | 1720.97 | 54.95 | 1587.40 | 1855.20 | 83.52 | 267.80 | 1634.16 | 1715.80 | 1813.36 | ||
| China | 1720 | 1722.42 | 59.78 | 1600.00 | 1933.40 | 80 | 333.40 | 1630.00 | 1720.00 | 1818.70 | ||
| 2 | Buttock extension | India | 855 | 844.39 | 60.43 | 575.00 | 980.00 | 70 | 405.00 | 725.00 | 855.00 | 935.00 |
| Singapore | 971 | 966.27 | 48.90 | 820.00 | 1073.00 | 57 | 253.00 | 877.10 | 971.00 | 1039.95 | ||
| Taiwan | 859.35 | 862.21 | 39.63 | 775.00 | 955.00 | 55.92 | 180.00 | 797.28 | 859.35 | 930.62 | ||
| China | 891 | 887.83 | 78.10 | 470.00 | 1099.30 | 74 | 629.30 | 775.10 | 891.00 | 1000.00 | ||
| 3 | Shoulder height (Sitting) | India | 572.2 | 577.22 | 30.92 | 507.10 | 654.00 | 44.48 | 146.90 | 522.38 | 572.20 | 632.60 |
| Singapore | 569.5 | 579.71 | 46.84 | 493.00 | 711.00 | 54 | 218.00 | 512.10 | 569.50 | 653.95 | ||
| Taiwan | 515.6 | 516.80 | 35.62 | 435.30 | 599.30 | 53.6 | 164.00 | 460.91 | 515.60 | 580.50 | ||
| China | 622.5 | 621.94 | 43.38 | 450.00 | 740.00 | 44.5 | 290.00 | 555.26 | 622.50 | 700.00 | ||
| 4 | Shoulder-elbow length | India | 352.85 | 354.44 | 22.38 | 301.70 | 410.10 | 27.52 | 108.40 | 315.85 | 352.85 | 393.53 |
| Singapore | 317.5 | 336.00 | 52.66 | 263.00 | 432.00 | 32.75 | 169.00 | 268.15 | 317.50 | 419.95 | ||
| Taiwan | 253.85 | 254.81 | 18.63 | 210.00 | 312.10 | 24.92 | 102.10 | 222.52 | 253.85 | 285.33 | ||
| China | 358 | 368.06 | 37.35 | 310.00 | 500.00 | 33 | 190.00 | 323.14 | 358.00 | 450.00 | ||
| 5 | Elbow height (Sitting) | India | 224.2 | 222.25 | 27.01 | 160.60 | 284.90 | 39.25 | 124.30 | 175.38 | 224.20 | 270.93 |
| Singapore | 243 | 243.71 | 31.81 | 190.00 | 358.00 | 45.5 | 168.00 | 198.00 | 243.00 | 292.95 | ||
| Taiwan | 261.05 | 262.00 | 27.90 | 201.30 | 321.80 | 43.85 | 120.50 | 219.68 | 261.05 | 311.06 | ||
| China | 257 | 251.54 | 39.03 | 140.00 | 320.00 | 53 | 180.00 | 179.20 | 257.00 | 309.78 | ||
| 6 | Lower leg length | India | 444.6 | 447.60 | 41.19 | 373.80 | 710.30 | 50.3 | 336.50 | 393.05 | 444.60 | 498.05 |
| Singapore | 410 | 413.90 | 27.88 | 356.00 | 493.00 | 35.5 | 137.00 | 370.15 | 410.00 | 464.75 | ||
| Taiwan | 417.3 | 419.97 | 26.62 | 362.60 | 477.00 | 34.6 | 114.40 | 375.66 | 417.30 | 465.67 | ||
| China | 428.5 | 425.69 | 40.55 | 160.00 | 500.00 | 40 | 340.00 | 366.94 | 428.50 | 480.00 | ||
| 7 | Knee height | India | 551.6 | 551.23 | 44.03 | 463.10 | 835.40 | 47.5 | 372.30 | 492.00 | 551.60 | 603.63 |
| Singapore | 491.5 | 501.20 | 39.74 | 425.00 | 680.00 | 53.75 | 255.00 | 453.25 | 491.50 | 572.95 | ||
| Taiwan | 506.85 | 508.14 | 24.76 | 458.60 | 560.10 | 38.57 | 101.50 | 469.15 | 506.85 | 549.68 | ||
| China | 534 | 532.95 | 28.04 | 430.00 | 601.00 | 35.1 | 171.00 | 490.00 | 534.00 | 590.20 | ||
| 8 | Acromion-grip length | India | 627.55 | 629.17 | 41.14 | 528.60 | 750.00 | 51.2 | 221.40 | 561.85 | 627.55 | 702.58 |
| Singapore | 650 | 651.90 | 60.04 | 542.00 | 800.00 | 54 | 258.00 | 553.70 | 650.00 | 764.75 | ||
| Taiwan | 566.825 | 568.96 | 27.26 | 491.50 | 635.80 | 33.67 | 144.30 | 521.44 | 566.83 | 617.38 | ||
| China | 625 | 630.97 | 40.45 | 550.00 | 750.00 | 52 | 200.00 | 580.00 | 625.00 | 716.00 | ||
| 9 | Hand length | India | 177.95 | 177.63 | 13.38 | 150.90 | 209.30 | 21.58 | 58.40 | 155.60 | 177.95 | 199.80 |
| Singapore | 183 | 182.17 | 8.47 | 160.00 | 205.00 | 11 | 45.00 | 168.00 | 183.00 | 196.95 | ||
| Taiwan | 178.1 | 178.01 | 9.98 | 148.00 | 200.50 | 10.97 | 52.50 | 159.38 | 178.10 | 195.49 | ||
| China | 185 | 185.40 | 21.83 | 76.00 | 300.00 | 15.9 | 224.00 | 170.00 | 185.00 | 209.20 | ||
| 10 | Elbow-hand length | India | 475.05 | 474.55 | 25.91 | 420.30 | 538.90 | 35.65 | 118.60 | 433.50 | 475.05 | 523.68 |
| Singapore | 461.5 | 462.06 | 26.58 | 386.00 | 520.00 | 36.75 | 134.00 | 413.10 | 461.50 | 497.00 | ||
| Taiwan | 367.15 | 366.57 | 19.59 | 317.00 | 420.60 | 24.43 | 103.60 | 340.24 | 367.15 | 408.84 | ||
| China | 450 | 448.96 | 28.26 | 270.00 | 500.00 | 29 | 230.00 | 406.80 | 450.00 | 490.00 | ||
| 11 | Buttock-popliteal length | India | 497.95 | 497.73 | 39.29 | 398.30 | 569.80 | 57.82 | 171.50 | 436.25 | 497.95 | 563.18 |
| Singapore | 458 | 455.22 | 26.96 | 356.00 | 508.00 | 29.75 | 152.00 | 400.15 | 458.00 | 497.00 | ||
| Taiwan | 353.05 | 354.83 | 24.88 | 289.30 | 416.00 | 33.55 | 126.70 | 307.97 | 353.05 | 398.92 | ||
| China | 440 | 438.40 | 38.95 | 330.00 | 524.00 | 41.5 | 194.00 | 360.00 | 440.00 | 508.00 | ||
| 12 | Buttock-knee length | India | 596.65 | 595.15 | 35.29 | 497.70 | 675.40 | 51.4 | 177.70 | 538.95 | 596.65 | 655.03 |
| Singapore | 568.5 | 562.25 | 29.21 | 470.00 | 624.00 | 32.5 | 154.00 | 491.70 | 568.50 | 596.85 | ||
| Taiwan | 455 | 453.76 | 31.04 | 351.70 | 517.10 | 40.67 | 165.40 | 393.27 | 455.00 | 499.90 | ||
| China | 549.4 | 547.53 | 68.97 | 478.56 | 671.00 | 47.5 | 671.00 | 480.00 | 549.40 | 630.80 | ||
| 13 | Elbow-to-elbow breadth | India | 434 | 430.31 | 38.41 | 330.00 | 533.00 | 60 | 203.00 | 357.75 | 434.00 | 488.75 |
| Singapore | 430.5 | 434.95 | 28.67 | 379.00 | 533.00 | 40.5 | 154.00 | 399.10 | 430.50 | 489.50 | ||
| Taiwan | 401.55 | 399.11 | 23.15 | 349.20 | 449.80 | 35.65 | 100.60 | 361.62 | 401.55 | 435.73 | ||
| China | 450 | 451.58 | 48.70 | 150.00 | 600.00 | 40 | 450.00 | 393.00 | 450.00 | 518.94 | ||
| 14 | Hip breadth (Sitting) | India | 340 | 336.88 | 27.54 | 270.00 | 425.00 | 34.75 | 155.00 | 290.00 | 340.00 | 380.00 |
| Singapore | 306 | 307.17 | 21.19 | 250.00 | 371.00 | 26.75 | 121.00 | 273.00 | 306.00 | 347.75 | ||
| Taiwan | 376.95 | 376.75 | 26.44 | 321.90 | 445.60 | 34.05 | 123.70 | 327.20 | 376.95 | 421.18 | ||
| China | 360 | 360.11 | 38.76 | 250.00 | 550.00 | 40 | 300.00 | 299.20 | 360.00 | 413.54 | ||
| 15 | Foot breadth | India | 100 | 101.72 | 8.27 | 85.00 | 115.00 | 15 | 30.00 | 90.00 | 100.00 | 115.00 |
| Singapore | 102 | 101.06 | 6.70 | 82.00 | 114.00 | 8 | 32.00 | 90.05 | 102.00 | 112.90 | ||
| Taiwan | 104.05 | 104.31 | 4.70 | 91.60 | 120.30 | 6.13 | 28.70 | 96.65 | 104.05 | 111.90 | ||
| China | 100 | 101.98 | 16.82 | 76.00 | 240.00 | 10.7 | 164.00 | 88.40 | 100.00 | 121.60 | ||
| 16 | BMI (kg/m²) | India | 23.81 | 23.80 | 3.67 | 13.71 | 31.74 | 5.71 | 18.03 | 18.48 | 23.81 | 29.25 |
| Singapore | 22.8 | 23.27 | 2.13 | 18.94 | 31.63 | 2.83 | 12.69 | 19.96 | 22.80 | 27.22 | ||
| Taiwan | 22.18 | 22.37 | 2.61 | 17.96 | 31.14 | 3.05 | 13.18 | 18.43 | 22.18 | 27.29 | ||
| China | 23.53 | 23.71 | 3.22 | 17.04 | 34.84 | 3.53 | 17.80 | 18.62 | 23.53 | 29.26 | ||
| 17 | Weight (kg) | India | 68.5 | 68.24 | 10.72 | 38.00 | 96.00 | 16.13 | 58.00 | 51.00 | 68.50 | 83.50 |
| Singapore | 64 | 65.94 | 7.42 | 50.00 | 95.00 | 9.75 | 45.00 | 58.00 | 64.00 | 79.95 | ||
| Taiwan | 67.5 | 67.59 | 8.56 | 53.00 | 92.00 | 11.25 | 39.00 | 55.00 | 67.50 | 85.00 | ||
| China | 70 | 70.36 | 10.72 | 52.00 | 110.00 | 12 | 58.00 | 55.00 | 70.00 | 90.80 | ||
| Anthropometric Variables | Kruskal– Wallis Test | p-Value | Group’s Mean Rank | |||
|---|---|---|---|---|---|---|
| H | p | Singapore (SGD) | India (INR) | Taiwan (ROC) | China (PRC) | |
| Stature body height | 26.36 | 0.0001 | 169.98 | 183.48 | 235.73 | 237.13 |
| Buttock extension | 178.65 | 0.002 | 335.86 | 132.27 | 153.7 | 212.2 |
| Shoulder height (Sitting) | 199.9 | 0.002 | 219.33 | 216.13 | 82.43 | 314.01 |
|
Shoulder-elbow length | 235.15 | 0.004 | 229.34 | 261.06 | 57.34 | 284.74 |
| Elbow height (Sitting) | 79.01 | 0.0001 | 199.94 | 126.52 | 266.14 | 234.25 |
| Lower leg length | 52.29 | 0.004 | 157.25 | 271.71 | 183.76 | 213.88 |
| Knee height | 117.67 | 0.003 | 133.29 | 289.69 | 157.2 | 246.33 |
| Acromion-grip length | 157.64 | 0.0001 | 271.79 | 238.24 | 83.55 | 239.6 |
| Hand length | 31.07 | 0.0001 | 221.73 | 178.21 | 175.48 | 254.21 |
| Elbow-hand length | 254.18 | 0.0001 | 262.53 | 297.87 | 55.19 | 217.57 |
| Buttock-popliteal length | 278.97 | 0.002 | 242.38 | 328.1 | 58.97 | 202.72 |
| Buttock-knee length | 259.74 | 0.0001 | 243.12 | 315 | 58.15 | 216.07 |
| Elbow-to-elbow breadth | 123.45 | 0.003 | 227.42 | 215.63 | 104.88 | 283.56 |
| Hip breadth (Sitting) | 206.55 | 0.0001 | 82.4 | 179.1 | 309.43 | 250.73 |
| Foot breadth | 19.91 | 0.004 | 192.96 | 207.82 | 247.73 | 177.9 |
| BMI | 18.14 | 0.0001 | 207.61 | 230.72 | 166.84 | 223.79 |
| Weight | 11.97 | 0.0001 | 176.82 | 216.51 | 201.43 | 232.43 |
| Statistical Parameters | SGD vs. ROC | SGD vs. PRC | SGD vs. INR | |||
| Mann–Whitney U | Sig (2-Tailed) p-Value | Mann–Whitney U | Sig (2-Tailed) p-Value | Mann–Whitney U | Sig (2-Tailed) p-Value | |
| BMI | 4027 | 0.003 | 4648 | 0.23 | 4490 | 0.09 |
| Weight | 4629.5 | 0.11 | 3724 | 0.001 | 4278.5 | 0.02 |
| Stature body height | 3619.5 | 0 | 3517 | 0 | 4811.5 | 0.35 |
| Buttock extension | 576.5 | 0 | 1701 | 0 | 486.5 | 0 |
| Shoulder height (Sitting) | 1605.5 | 0 | 2662.5 | 0 | 5174.5 | 0.95 |
| Shoulder-elbow length | 402.5 | 0 | 3532 | 0 | 4154 | 0.01 |
| Elbow height (Sitting) | 3515.5 | 0 | 4251.5 | 0.03 | 3223 | 0 |
| Lower leg length | 4532.5 | 0.07 | 3680.5 | 0 | 2461.5 | 0 |
| Knee height | 4216 | 0.01 | 2318.5 | 0 | 1744.5 | 0 |
| Acromion-grip length | 1067.5 | 0 | 4053.5 | 0.009 | 4050 | 0.006 |
| Hand length | 3966.5 | 0.002 | 4179 | 0.02 | 4090 | 0.008 |
| Elbow-hand length | 36.5 | 0 | 3671 | 0 | 4010 | 0.005 |
| Buttock-popliteal length | 81 | 0 | 3591 | 0 | 1959.5 | 0 |
| Buttock-knee length | 102.5 | 0 | 4067 | 0.01 | 2531 | 0 |
| Elbow-to-elbow breadth | 1739.5 | 0 | 3372 | 0 | 4941 | 0.53 |
| Hip breadth (Sitting) | 206.5 | 0 | 1009 | 0 | 1974.5 | 0 |
| Foot breadth | 3792 | 0 | 4667.5 | 0.24 | 4821 | 0.36 |
| Statistical Parameters | ROC vs. PRC | INR vs. ROC | INR vs. PRC | |||
| Mann–Whitney U | Sig (2-Tailed) p-Value | Mann–Whitney U | Sig (2-Tailed) p-Value | Mann–Whitney U | Sig (2-Tailed) p-Value | |
| BMI | 3968 | 0.001 | 4019 | 0.001 | 5092.5 | 0.54 |
| Weight | 4606 | 0.051 | 5104 | 0.35 | 5016 | 0.43 |
| Stature body height | 5376 | 0.849 | 4064.5 | 0.001 | 3968.5 | 0.001 |
| Buttock extension | 3705 | 0 | 4684.5 | 0.06 | 3125.5 | 0 |
| Shoulder height (Sitting) | 313.5 | 0 | 1148 | 0 | 1966.5 | 0 |
| Shoulder-elbow length | 1 | 0 | 4 | 0 | 4424.5 | 0.03 |
| Elbow height (Sitting) | 4786.5 | 0.124 | 1700.5 | 0 | 2775 | 0 |
| Lower leg length | 4640.5 | 0.061 | 3100 | 0 | 3777 | 0 |
| Knee height | 2707.5 | 0 | 1900.5 | 0 | 3823.5 | 0 |
| Acromion-grip length | 914 | 0 | 1204 | 0 | 5265 | 0.83 |
| Hand length | 3395.5 | 0 | 5456 | 0.89 | 3528 | 0 |
| Elbow-hand length | 142 | 0 | 1 | 0 | 2607 | 0 |
| Buttock-popliteal length | 492 | 0 | 7 | 0 | 1507.5 | 0 |
| Buttock-knee length | 385 | 0 | 5 | 0 | 2299.5 | 0 |
| Elbow-to-elbow breadth | 1029 | 0 | 2677.5 | 0 | 3678 | 0 |
| Hip breadth (Sitting) | 3635.5 | 0 | 1571 | 0 | 3169.5 | 0 |
| Foot breadth | 3515.5 | 0 | 4646.5 | 0.04 | 4784.5 | 0.18 |
Publisher’s Note: MDPI stays neutral with regard to jurisdictional claims in published maps and institutional affiliations. |
© 2022 by the authors. Licensee MDPI, Basel, Switzerland. This article is an open access article distributed under the terms and conditions of the Creative Commons Attribution (CC BY) license (https://creativecommons.org/licenses/by/4.0/).
Share and Cite
Muthiah, A.; Lee, Y.-C. Comparative Analysis of Male Cyclist Population in Four Asia Countries for Anthropometric Measurements. Int. J. Environ. Res. Public Health 2022, 19, 10078. https://doi.org/10.3390/ijerph191610078
Muthiah A, Lee Y-C. Comparative Analysis of Male Cyclist Population in Four Asia Countries for Anthropometric Measurements. International Journal of Environmental Research and Public Health. 2022; 19(16):10078. https://doi.org/10.3390/ijerph191610078
Chicago/Turabian StyleMuthiah, Arunachalam, and Yu-Chi Lee. 2022. "Comparative Analysis of Male Cyclist Population in Four Asia Countries for Anthropometric Measurements" International Journal of Environmental Research and Public Health 19, no. 16: 10078. https://doi.org/10.3390/ijerph191610078
APA StyleMuthiah, A., & Lee, Y.-C. (2022). Comparative Analysis of Male Cyclist Population in Four Asia Countries for Anthropometric Measurements. International Journal of Environmental Research and Public Health, 19(16), 10078. https://doi.org/10.3390/ijerph191610078