1. Introduction
Building an ecological civilization, staying true to the new development philosophy, and being committed to the harmony between man and nature, these are not only the ideas advocated by China, but also the core elements of the United Nations’ 2030 Sustainable Development Goals. Green and low-carbon development is an inevitable way to build an ecological civilization and realize sustainable development featuring harmony between man and nature. It is also a necessary condition required for achieving carbon neutrality before 2060. Since the 1990s, when global governance was carried out by human society to address climate change, 21 countries, including Germany, the United Kingdom, and the United States, have successively decoupled economic growth from carbon emissions between the year 2000 and 2014 [
1]. These countries’ fossil energy consumption and carbon emissions followed the laws of the environmental Kuznets curve and began to slowly decline after reaching the peak, while their economic aggregate maintained a growth trend, which can be seen as the manifestations of absolute decoupling or strong decoupling. China is still in a period of rapid economic and social development, and its development stage is still on the left wing of the environmental Kuznets curve. To achieve absolute decoupling of economic development from energy consumption and carbon emissions, the country must first go through a stage in which energy consumption gradually reaches its peak. After some key factors affecting energy consumption and carbon emissions gradually come into play and reach their peaks, it is then possible to gradually achieve the absolute decoupling of China’s economic development from energy consumption and carbon emissions. These key factors can be decomposed into energy consumption and carbon emissions in manufacturing, household consumption, infrastructure construction, and export. The energy consumption of these sectors or fields will not reach peaks at the same time. According to the development experience of other countries, the production sector generally reaches its peak before the consumption sector [
2]. Due to pressure from international competition, the export sector is more advanced in efficiency and may reach the peaks of energy consumption and carbon emissions sooner than the entire manufacturing industry. Studying the peaking time and trends of these key factors is the basis for understanding and grasping the trends of China’s energy consumption and carbon emissions, as well as the basis for adjusting and formulating China’s policies relating to industrial production, foreign trade, and energy consumption.
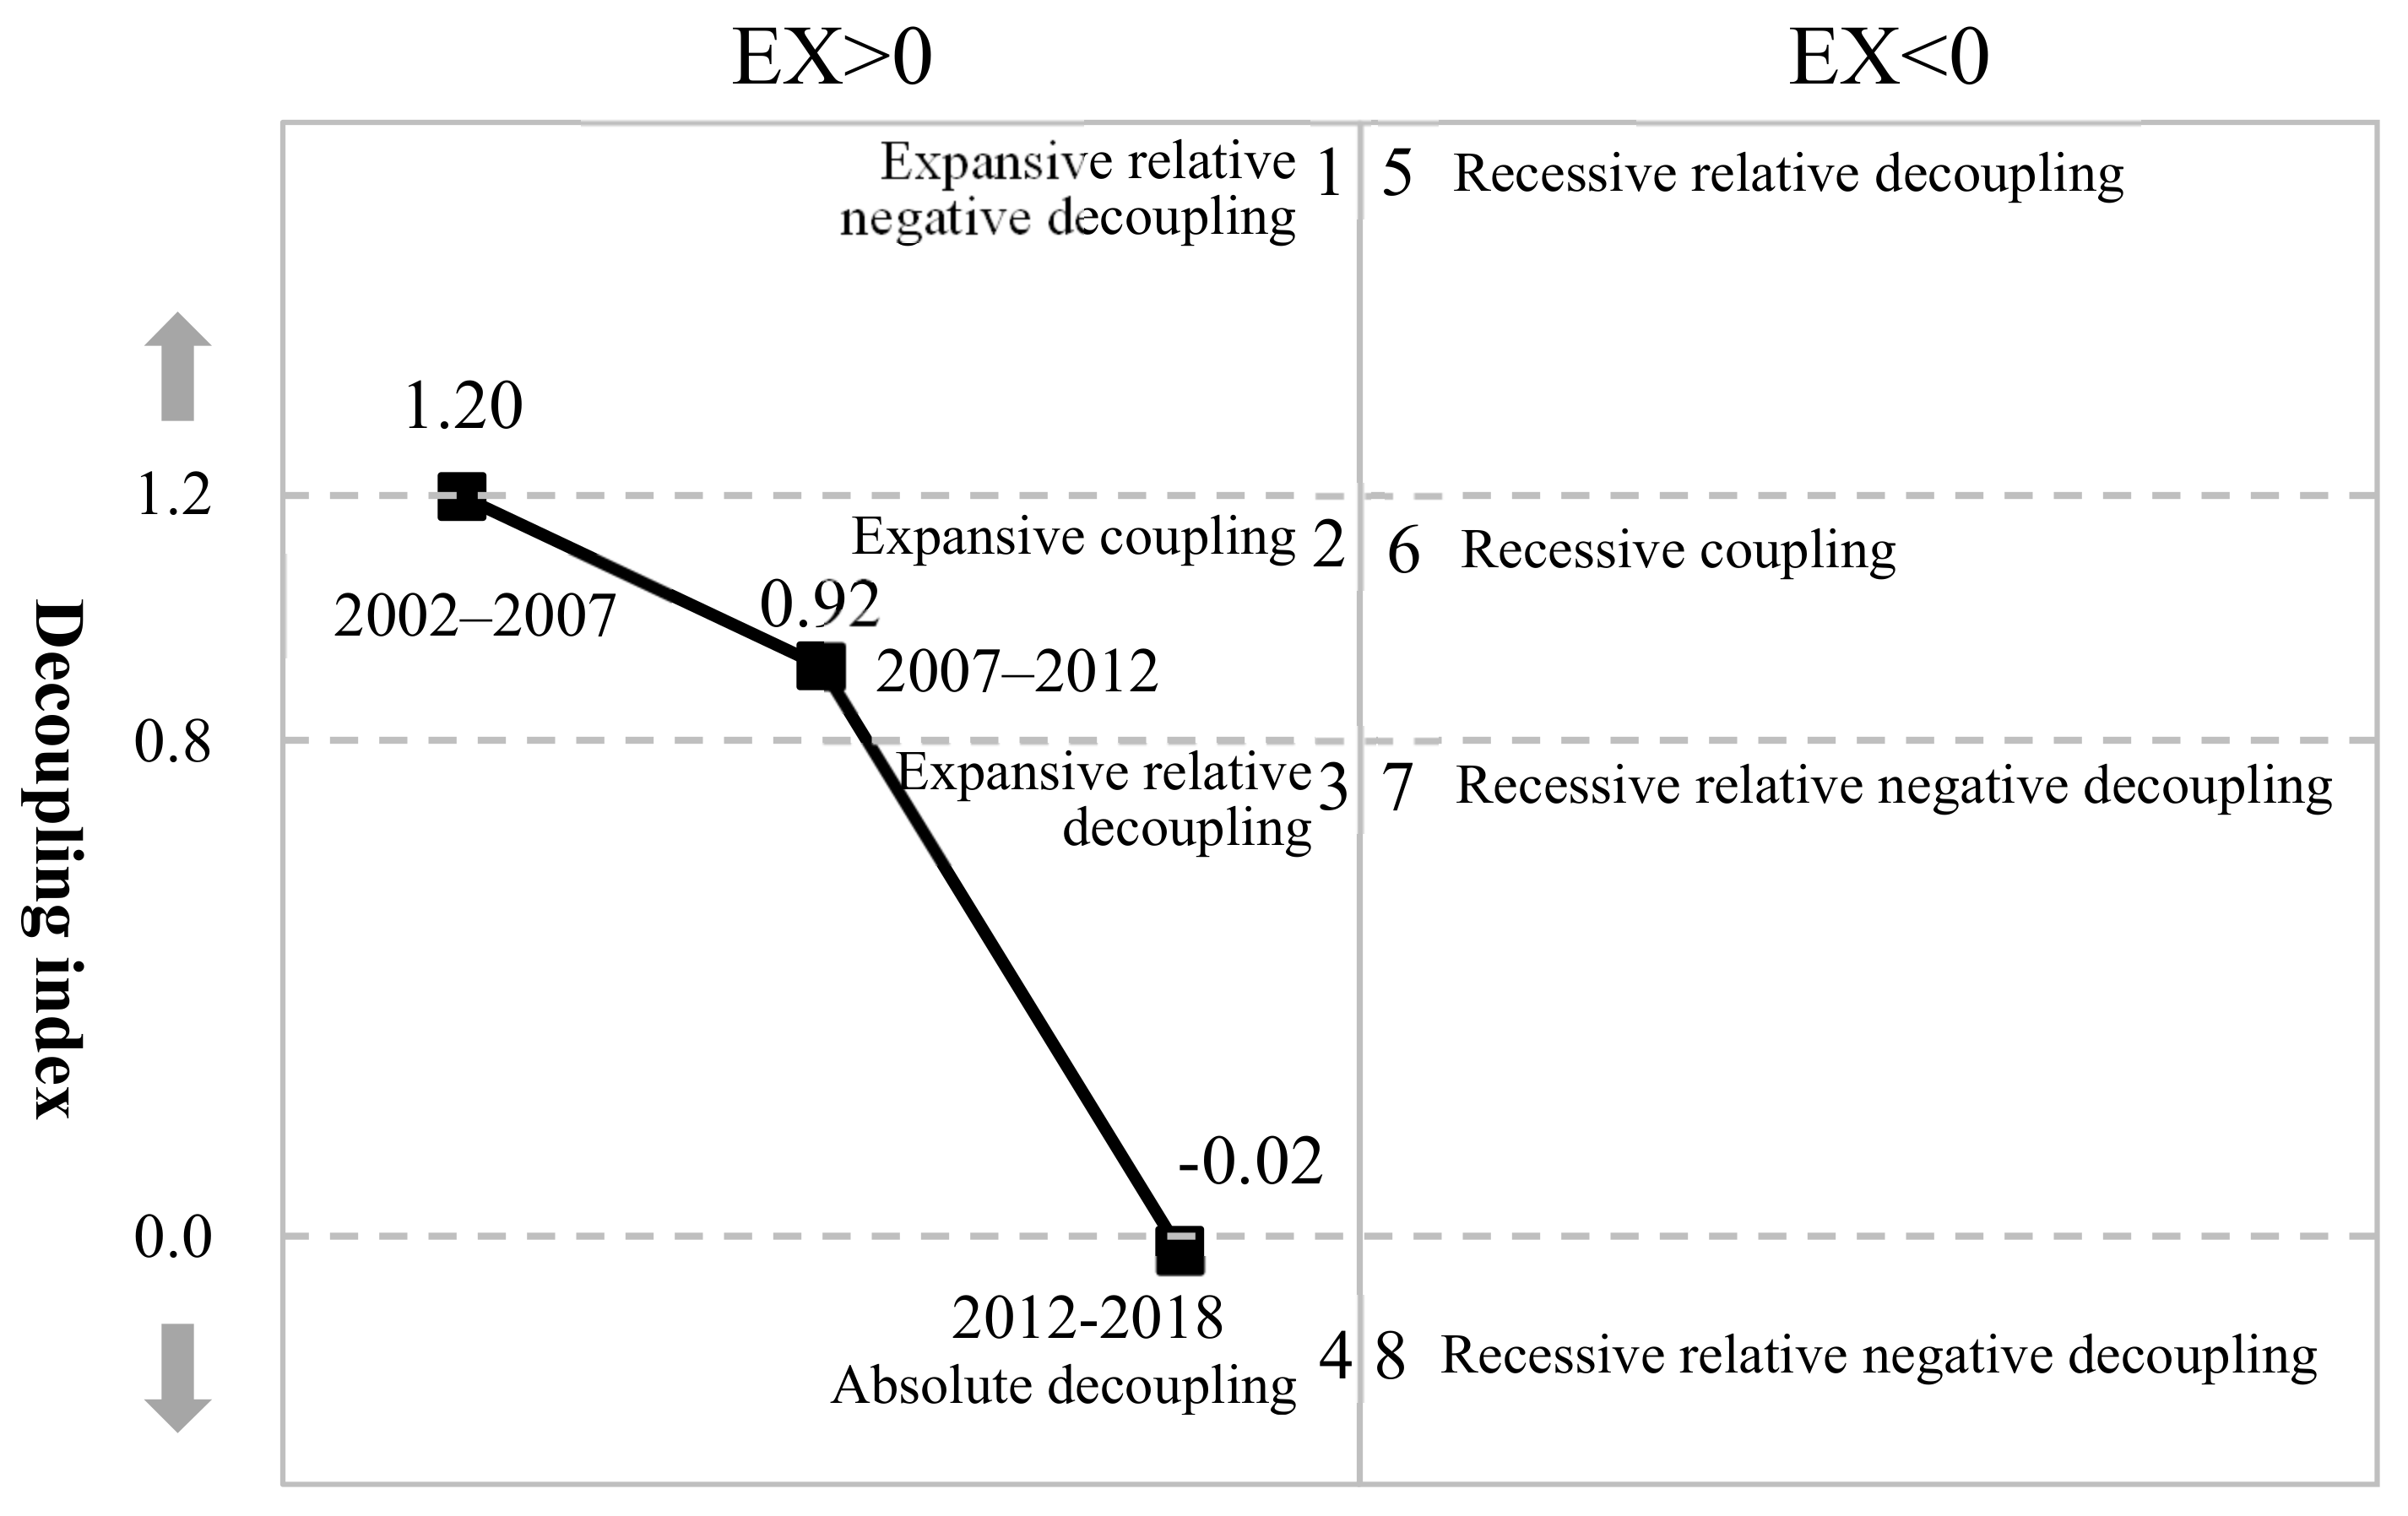
As for decoupling, an economic phenomenon, researchers study the elastic relationship of relative changes in two variables to reflect the development and evolution trends of different variables and use the decoupling elasticity coefficient or the decoupling index to show the degree and direction of evolution trends. The decoupling index model, proposed by Tapio [
3] when studying the relationship between traffic capacity and GDP, is divided into eight categories, including weak decoupling and strong decoupling, according to the values and signs of decoupling indexes. Diakoulaki et al. [
4], Pan et al. [
5], and Sheng et al. [
6] used the decoupling index to study the relationship between economic growth and carbon emissions in China and other countries. Zhang et al. [
7] defined and studied the different nature and stages of decoupling and expanded the decoupling index model into ten categories based on research by Tapio [
3]. Many expressions of decoupling can be classified into two categories from the perspective of development: (i) economic development and the growing trend of energy consumption or carbon emissions change in the same direction but in different ranges, which can be called relative decoupling or weak decoupling, a category which in some studies is subdivided into concepts such as strong relative decoupling and weak relative decoupling; (ii) economic development and the growing trend of energy consumption or carbon emission change in the opposite directions, i.e., increment versus decrement in any ranges, which can be called absolute decoupling or strong decoupling. The relative decoupling between economic development and carbon emissions has been achieved in China, on which some studies have been carried out. However, China’s absolute decoupling from carbon emissions in all economic fields, such as production, consumption, and trade, has not yet been revealed. By studying the change trends and absolute decoupling phenomenon of China’s total value of export and embodied energy of export, this paper intends to reflect the characteristics of China’s current development in economy, trade, and production technology in order to provide a reference for the formulation of policies related to the socio-economic transition to green development, adjustments to industrial and energy structures, as well as participation in global climate governance.
With economic transformation and development and environmental pollution becoming the focus of attention, the rapid development of international trade has also profoundly shaped the global trade landscape, determining energy flow, industrial division, and cooperation modes in different regions while also influencing countries’ economic and industrial development trends and policies. In terms of the energy embodied in global trade, scholars across the world have conducted a lot of research on the embodied energy flow of trade commodities. Some of them revealed the patterns of embodied energy flowing with global trade from the aspect of the embodied energy flow in international trade. For example, Chen et al. [
8] analyzed the embodied energy of the world’s economy and trade in the context of globalization in 2004 based on an input–output model, indicating that the United States is the world’s largest importer of embodied energy, while China is the world’s largest exporter of embodied energy during the same period; Mi et al. [
9] used a multi-regional input–output (MRIO) table to analyze embodied carbon in the trade of major countries in the world from 2007 to 2012 and found that the total embodied carbon of China’s exports declined during the study period, though China was still a net exporter of carbon; Cui et al. [
10] used the input–output model and found that, in 2007, the United States, Japan, the United Kingdom, Italy, and other countries were net importers of embodied energy while China, Russia, India, and other countries were net exporters of embodied energy; Guo et al. [
11] found that from 1995 to 2014, the United States, Japan, France, Germany, and Brazil were net importers of embodied energy while Russia, South Korea, India, China, and Canada were net exporters of embodied energy. Some of them studied the characteristics and conditions of the embodied energy flow from the aspect of the embodied energy flow in particular countries. For example, Chen et al. [
12] used the input–output model to calculate the embodied energy of China’s foreign trade from 2002 to 2006, with the results showing that China was a net exporter of embodied energy and that the embodied energy of export accounted for 20.7% of the country’s energy consumption that year. Qi et al. [
13] used the input–output method to estimate the embodied carbon of China’s import and export from 1997 to 2006, with the results showing that China was a net exporter of embodied carbon during the study period. Tang et al. [
14] studied embodied energy in the international trade of the United Kingdom as a developed country from 1997 to 2011 and inferred from the analysis that the United Kingdom was a net importer of embodied energy during the study period. Xu et al. [
15] used the input–output method to analyze embodied carbon and carbon transfer emissions, with the results showing that China had been a net exporter of carbon in the Sino-British trade from 2004 to 2009. The results of studies by Yang et al. [
16] and Wei et al. [
17] showed that China had always been a net exporter of embodied energy in Sino-US trade. Chen et al. [
18] and Xie et al. [
19] analyzed the embodied energy of import and export trade based on the input–output tables published by the Organization for Economic Co-operation and Development (OECD) and conducted structural analyses on the embodied energy of export by using the structural decomposition analysis (SDA) model, from which they found that China was a net exporter of embodied energy from 1995 to 2005 and that the expansion of export scale was the main reason for the increasing embodied energy of export. Zhang et al. [
20] calculated China’s embodied energy in trade from 1997 to 2013 at the levels of the country and specific industries based on an improved method, with the results showing that China was still a net exporter of embodied energy during the study period and that the net values of embodied energy in every Chinese sector comprise both surplus and deficit, with the surplus being dominant on the whole.
In general, the methodology of estimating the embodied energy of export needs to take into account two key issues: (i) The choice between the input–output method and life cycle assessment. Life cycle assessment is used to study embodied energy in the whole life cycle of commodities from a micro perspective in order to evaluate its impact on the environment and the pattern of embodied energy flows related to international trade. Due to the complexity and variety of import and export commodities, it is relatively difficult to use this method to obtain data and to accurately define the boundaries of energy consumption in each link, thus easily leading to repeated accounting or omissions. Mainly based on international and/or national input–output tables, the input–output method can more comprehensively reflect the participation of different countries and different sectors in international trade and more accurately measure the corresponding embodied energy flows. Therefore, most researchers choose the input–output method to carry out studies. (ii) Whether or not to deduct and how to deduct the imported intermediate inputs when calculating the embodied energy of export. The embodied energy of export refers to the total energy consumed in the production, manufacturing, logistics, and other processes of a country’s export, but does not include the energy consumed by imported intermediate inputs in the aforementioned processes. When deducting the energy consumed by imported intermediate inputs in the calculation of embodied energy of export, because the data in China’s competitive input–output tables do not include a list of imported intermediate input data, studies by Gu et al. [
21], Liu et al. [
22], and Zhang et al. [
20] used the method of distribution in equal proportions to technically process imported intermediate inputs and worked out corresponding embodied energy of export. However, Pang et al. [
23] did not deduct the embodied energy consumed by imported intermediate inputs when calculating the embodied energy of China’s exports and the results were higher than those calculated by Liu et al. [
22].
Although there has been a range of studies conducted on China’s embodied energy in international trade, most of these studies are conducted in particular years, or based on input–output tables of particular years, reflecting the static situation or pattern of the international flow of embodied energy in the current period of input–output tables, thus certainly making them unable to reveal the changing trend of embodied energy of export that may be caused by China’s economic development and changes in the industrial and energy structure. However, understanding the changing trend can provide key information for formulating and adjusting the policies for future economic, industrial, and energy development. Since China acceded to the WTO in 2001, exports in foreign trade have become one of the main driving forces for rapid economic growth. The growth curves and characteristics of exports in foreign trade before and after China’s accession to the WTO can also be differentiated into two stages. Therefore, this paper focuses on the changing trend of embodied energy of export since China’s accession to the WTO. Based on the input–output tables (The extended input–output tables for 2005, 2010 and 2015 are also analyzed, but the results are for reference only because they are not actual survey tables) for 2002, 2007, 2012, and 2018 in China, this paper studies the trends of embodied energy of export through a relatively long time series based on the latest data, and by analyzing the trends of two variables, i.e., export scale and embodied energy of export, judges the elastic relationship of relative changes in the two variables and defines decoupling status and the degree and nature of the two variables. On that basis, the SDA weighted average method is used to decompose the factors affecting the changes in embodied energy of export from 2002 to 2018 and to explore the main reasons that lead to such changes.
2. Theoretical Models
The input–output (IO) method is an analysis method explored and created by Leontief in 1936 and has been widely used in the calculation of embodied energy in commodities for domestic and foreign trade [
12,
14,
20]. The input–output model constructed in this paper for calculating the embodied energy of China’s export is as follows:
Suppose that China trades with
r partners, among which each country or region owns
m sectors. For country
p, according to the horizontal quantitative relationships of the input–output tables, Equation (1) can be obtained.
where
is the direct consumption coefficient of sector No.
i and
=
, thus the direct consumption coefficient matrix is
,
is the total input of sector No. j, is the final demand of sector No. i, and is the total output of sector No. i, and when , = .
If
,
, then the matrix relationship of Equation (1) can be expressed as:
By transposing the terms of Equation (2), we obtain:
where
is the complete demand coefficient, defining that
=
. Thus, the element
is the complete quantity of the products of sector
i demanded for each unit of the final products produced by sector
j; the complete consumption coefficient obtained is
, thus the element
represents the number of each sector’s products or services that need to be completely consumed (i.e., the sum of direct and indirect consumption) for each unit of final products produced by sector
j. Since
only represents the sum of each sector’s direct and indirect consumption, in addition to the content included
,
also includes the final products produced by each sector. Therefore, when calculating the embodied energy, it is more accurate to use the product of
times sectors’ direct energy consumption intensity matrix as the total energy consumption coefficient.
Assuming that the direct energy consumption coefficient of sector i in country P is , then the complete energy consumption of sector i is , and the embodied energy consumption per unit of output value is = .
If the amount of China’s exports to country
P is
, then:
where
is the embodied energy of China’s export to country
P and
is the embodied energy of China’s export.
where
is the total amount of the embodied energy of China’s export, of which the unit is 10,000 tons of coal equivalent;
is the direct energy consumption coefficient matrix per unit of China’s total output, a 1
m matrix, of which the unit is 10,000 tons of coal equivalent per CNY 10,000;
I is a unit square matrix of order m;
is China’s direct consumption coefficient matrix after deducting imported intermediate products; and
is the export matrix, an m
1 matrix, of which the unit is CNY 10,000. Given that China’s input–output tables for 2002, 2007, and 2012 are competitive ones, this paper adopts the method of distribution in equal proportions (i.e., the proportion of imported intermediate inputs in the total intermediate use equals the proportion of imported goods in the final goods) to deduct the embodied energy of imported intermediate inputs to keep the calculation results of embodied energy of export from overestimation. Therefore, when calculating the embodied energy of China’s export in 2002, 2007, and 2012, Equation (6) is adjusted to Equation (7):
where
is China’s direct consumption coefficient matrix, an m
m matrix; and
is the import coefficient matrix, which is a diagonal square matrix of order m. According to the method of distribution in equal proportions, the element
on the diagonal line can be expressed as:
where
is the total output of sector
i, of which the unit is CNY 100 million;
is the gross imports of sector
i, of which the unit is CNY 100 million; and
is the gross exports of sector
i, of which the unit is CNY 100 million.
The energy consumption data used in this paper are quoted from the China Energy Statistical Yearbook 2019, and the import and export data are provided by the National Bureau of Statistics of China. This paper also uses the input–output tables (China’s input–output tables are not compiled every year. Generally, input–output surveys in China are carried out in the years ending in 2 and 7 and the input–output tables for the corresponding years are compiled. Additionally, input–output extension tables are compiled in the years ending in 0 and 5. In order to reduce errors as much as possible, this paper uses the input–output table generated from actual surveys in the years ending in 2 and 7 to conduct research. The input–output table of 2018 is the first input–output table compiled in conjunction with census data in the year of China’s economic census. Therefore, this paper finally conducts research based on the input–output tables for 2002, 2007, 2012, and 2018) for 2002, 2007, 2012, and 2018. Relevant prices are adjusted by the use of the double reduction method with 2002 as the base period. According to the classification of 17 sectors in the basic input–output flow tables of the China Statistical Yearbooks (the data from China Energy Statistical Yearbooks and National Bureau of Statistics of China do not contain energy consumption by real estate, leasing and business services, and financial intermediation so the above two sectors are included into other services), this paper lists 15 sectors in the input–output tables after merging, i.e., agriculture, forestry, animal husbandry, fishery, mining, foods, beverage and tobacco, textile, wearing apparel and leather products, other manufactured products, coking, gas and oil refining, chemical products, non-metallic mineral products, metal manufacture, machinery and equipment, production and supply of electric power and heat power, construction, transport, storage and post, information transmission, computer service and software, wholesale and retail trades, lodging and catering, and other services. Regarding the merging of sectors, there are some differences between studies. For example, scholars such as Zhang et al. [
20] and Xu et al. [
24] listed 15 sectors in input–output tables after merging; Xu et al. [
15] and Chen et al. [
18] listed 17 sectors after merging; and Mi et al. [
9], Chen et al. [
12], Wei et al. [
17], and Zhu et al. [
25] listed more than 30 sectors after merging. Although these studies applied different merging methods, the final research conclusions are comparable.
4. Conclusions
Based on the input–output tables for 2002, 2007, 2012, and 2018, this paper calculates the embodied energy of export in China and every sector, and uses the SDA weighted average method to analyze the reasons for the changes in embodied energy of export from 2002 to 2018. The main conclusions drawn therefrom are as follows.
(i) The embodied energy of China’s export and the total export was strongly decoupled for the first time from 2012 to 2018, signaling that China’s economic, industrial, and energy structures entered a new stage. It was also the first absolute decoupling achieved in the process of decoupling economic growth from energy consumption for the adoption of a low-carbon development path. Due to the pressure of international competition, the export sector had a relatively advanced level of efficiency and thus achieved decoupling earlier than the overall manufacturing sector and consumer sector, which was in line with economic laws and the characteristics of China’s development stage.
(ii) From 2007 to 2018, the embodied energy of export occupied a much smaller proportion of China’s total energy consumption, falling from the peak of 31.48% in 2007 to 26.57%, a drop of 4.91 percentage points. It showed that a larger share of energy consumption had taken place domestically and that the model mainly relying on export expansion to drive economic growth had begun to adjust. The conclusion of this research could also support the assertion of ‘accelerating the construction of a new development pattern with the domestic economic cycle as the main body and the domestic and international dual cycles promoting each other’ from the perspective of external exports and energy consumption.
(iii) A causal analysis of the decoupling between the embodied energy of export and export volume demonstrated that, from 2002 to 2007 and from 2007 to 2012, the embodied energy of export and total export maintained the same direction but had different growth rates. The increase in total export volume was the main reason affecting the embodied energy of export. With the rapid growth of total export volume, the embodied energy of export was also growing rapidly. From 2012 to 2018, the total embodied energy of export declined and an analysis showed that the ‘total energy consumption coefficient’, i.e., technology effect, was the primary cause of the decline. With China’s high-quality development, green transformation, and other strategic advancements, not only does the energy structure continue to transform to renewable energy, but energy efficiency also continues to improve and the decoupling trend is expected to continue and expand to a larger economic field.


