
Simulation of Land Use Pattern Based on Land Ecological Security: A Case Study of Guangzhou, China

Abstract
:1. Introduction
2. Study Area and Data Sources
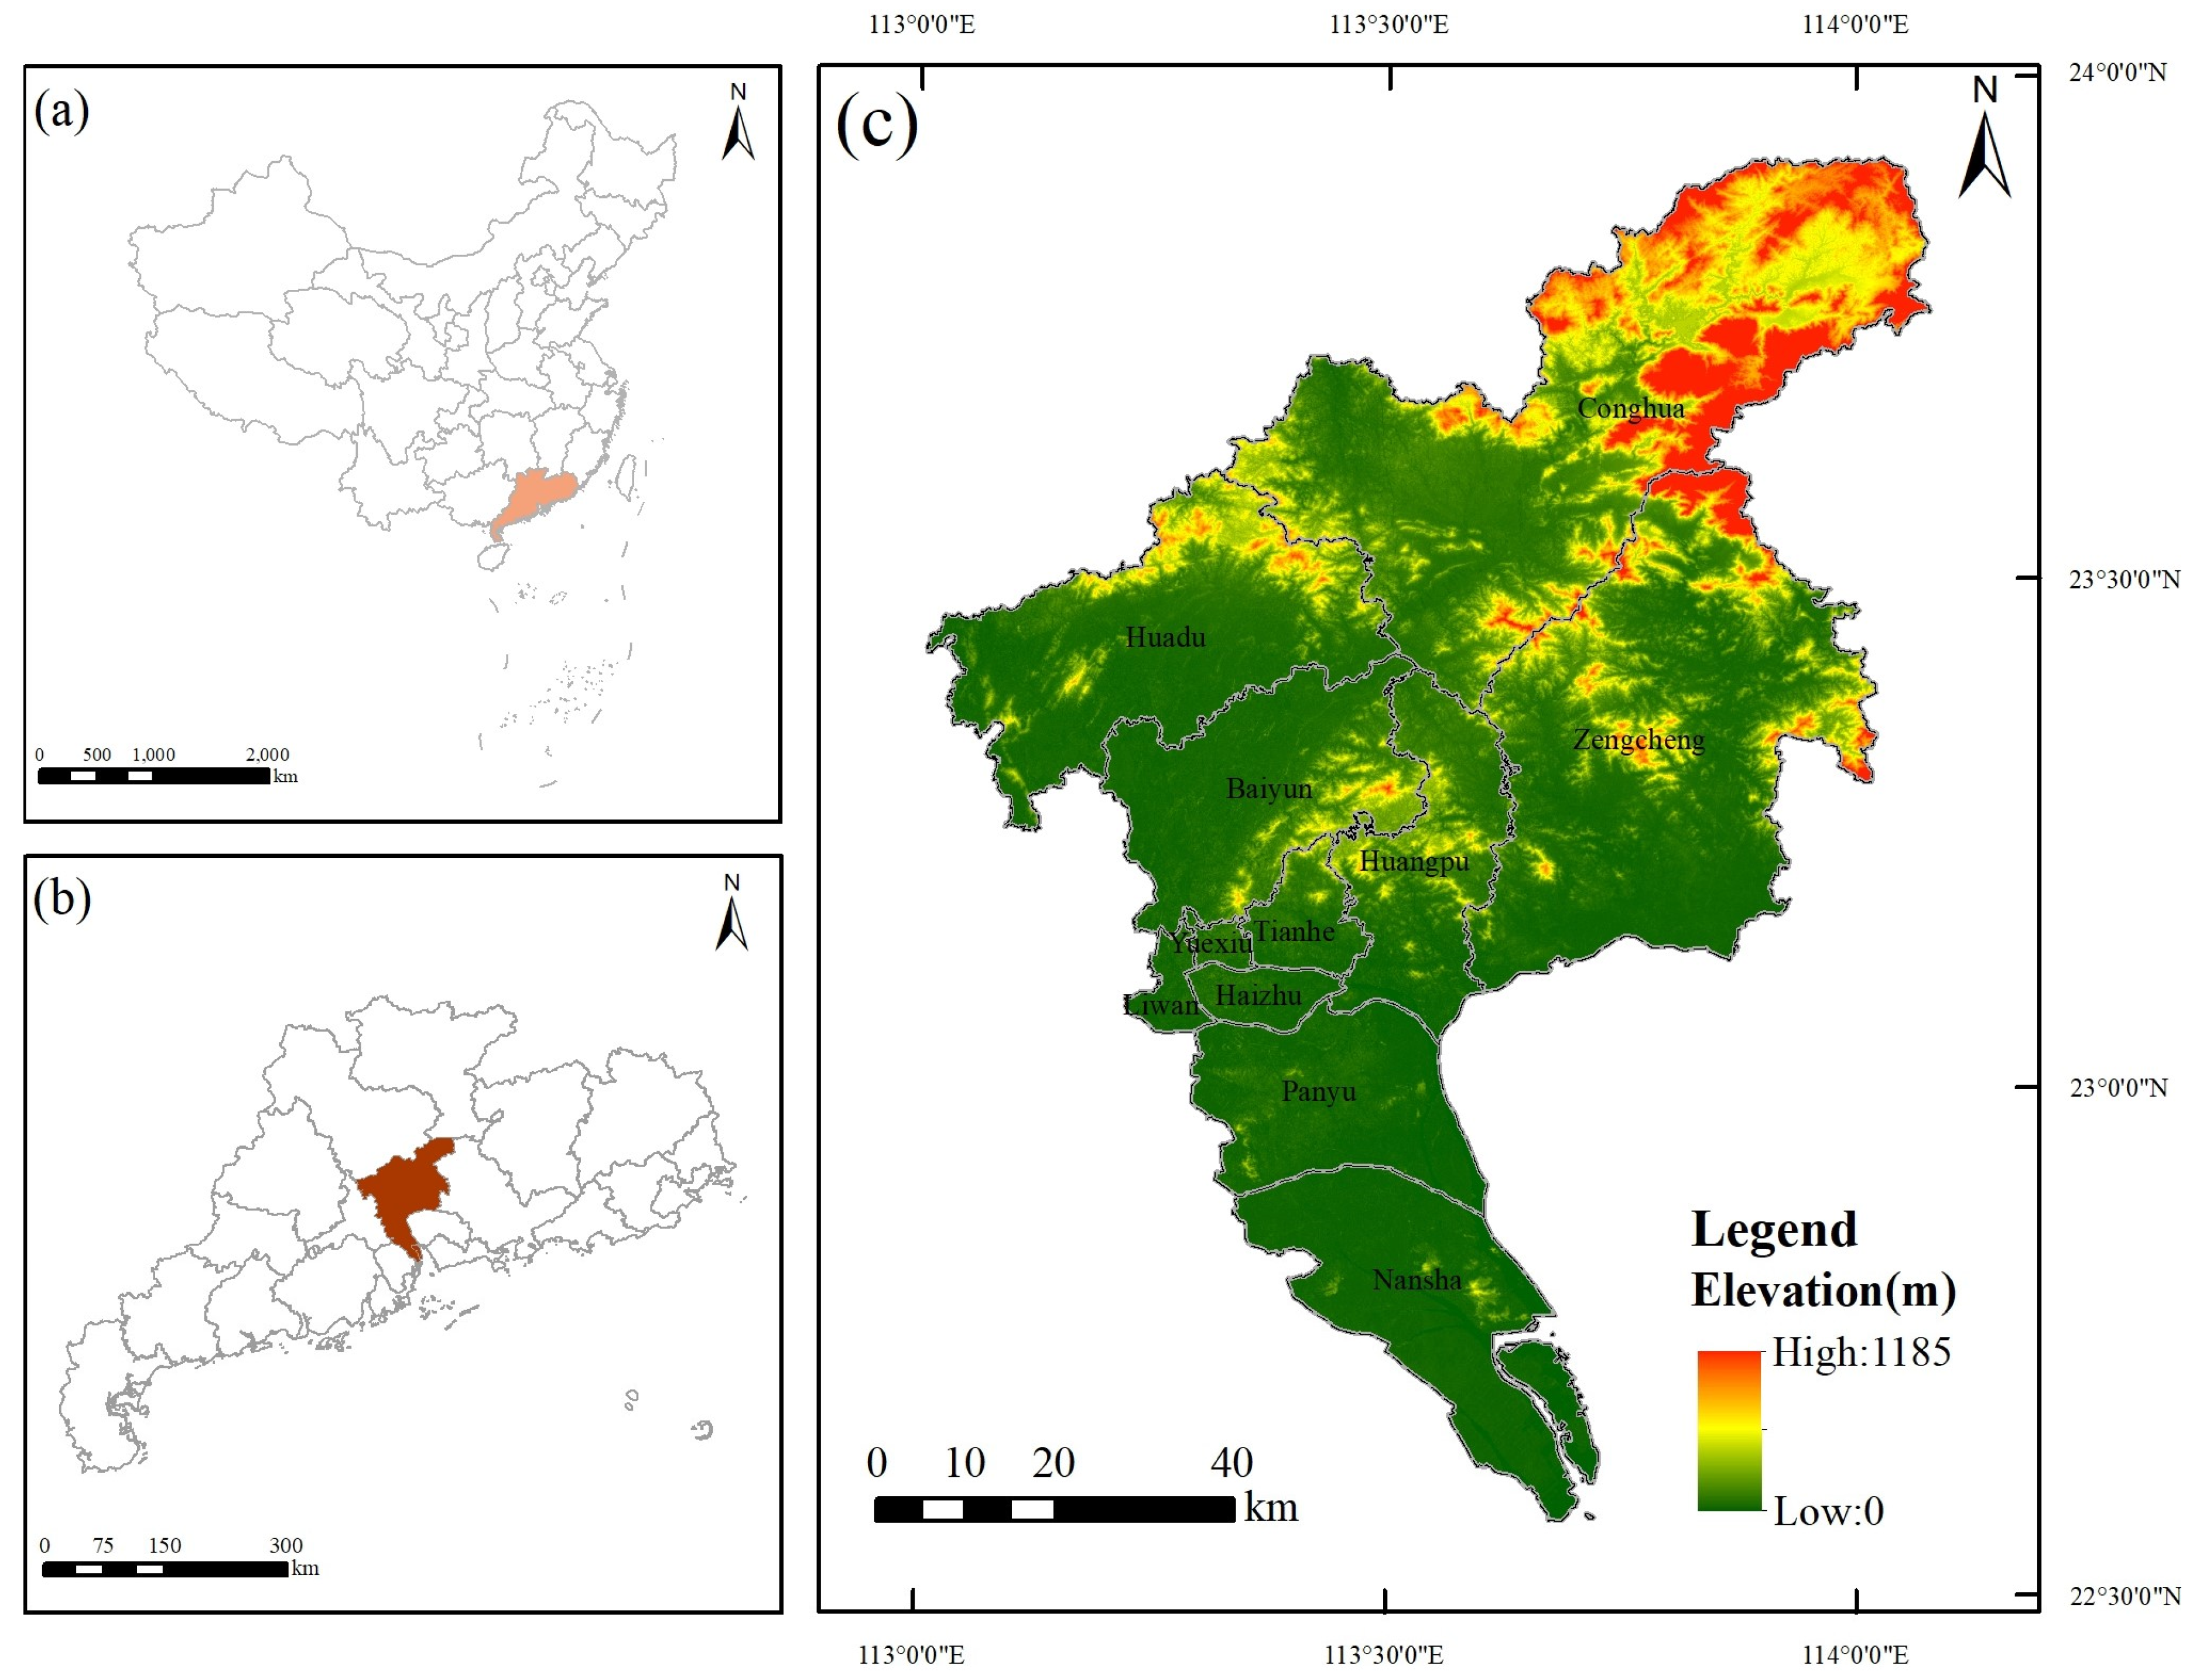
2.1. Study Area
2.2. Data Cources
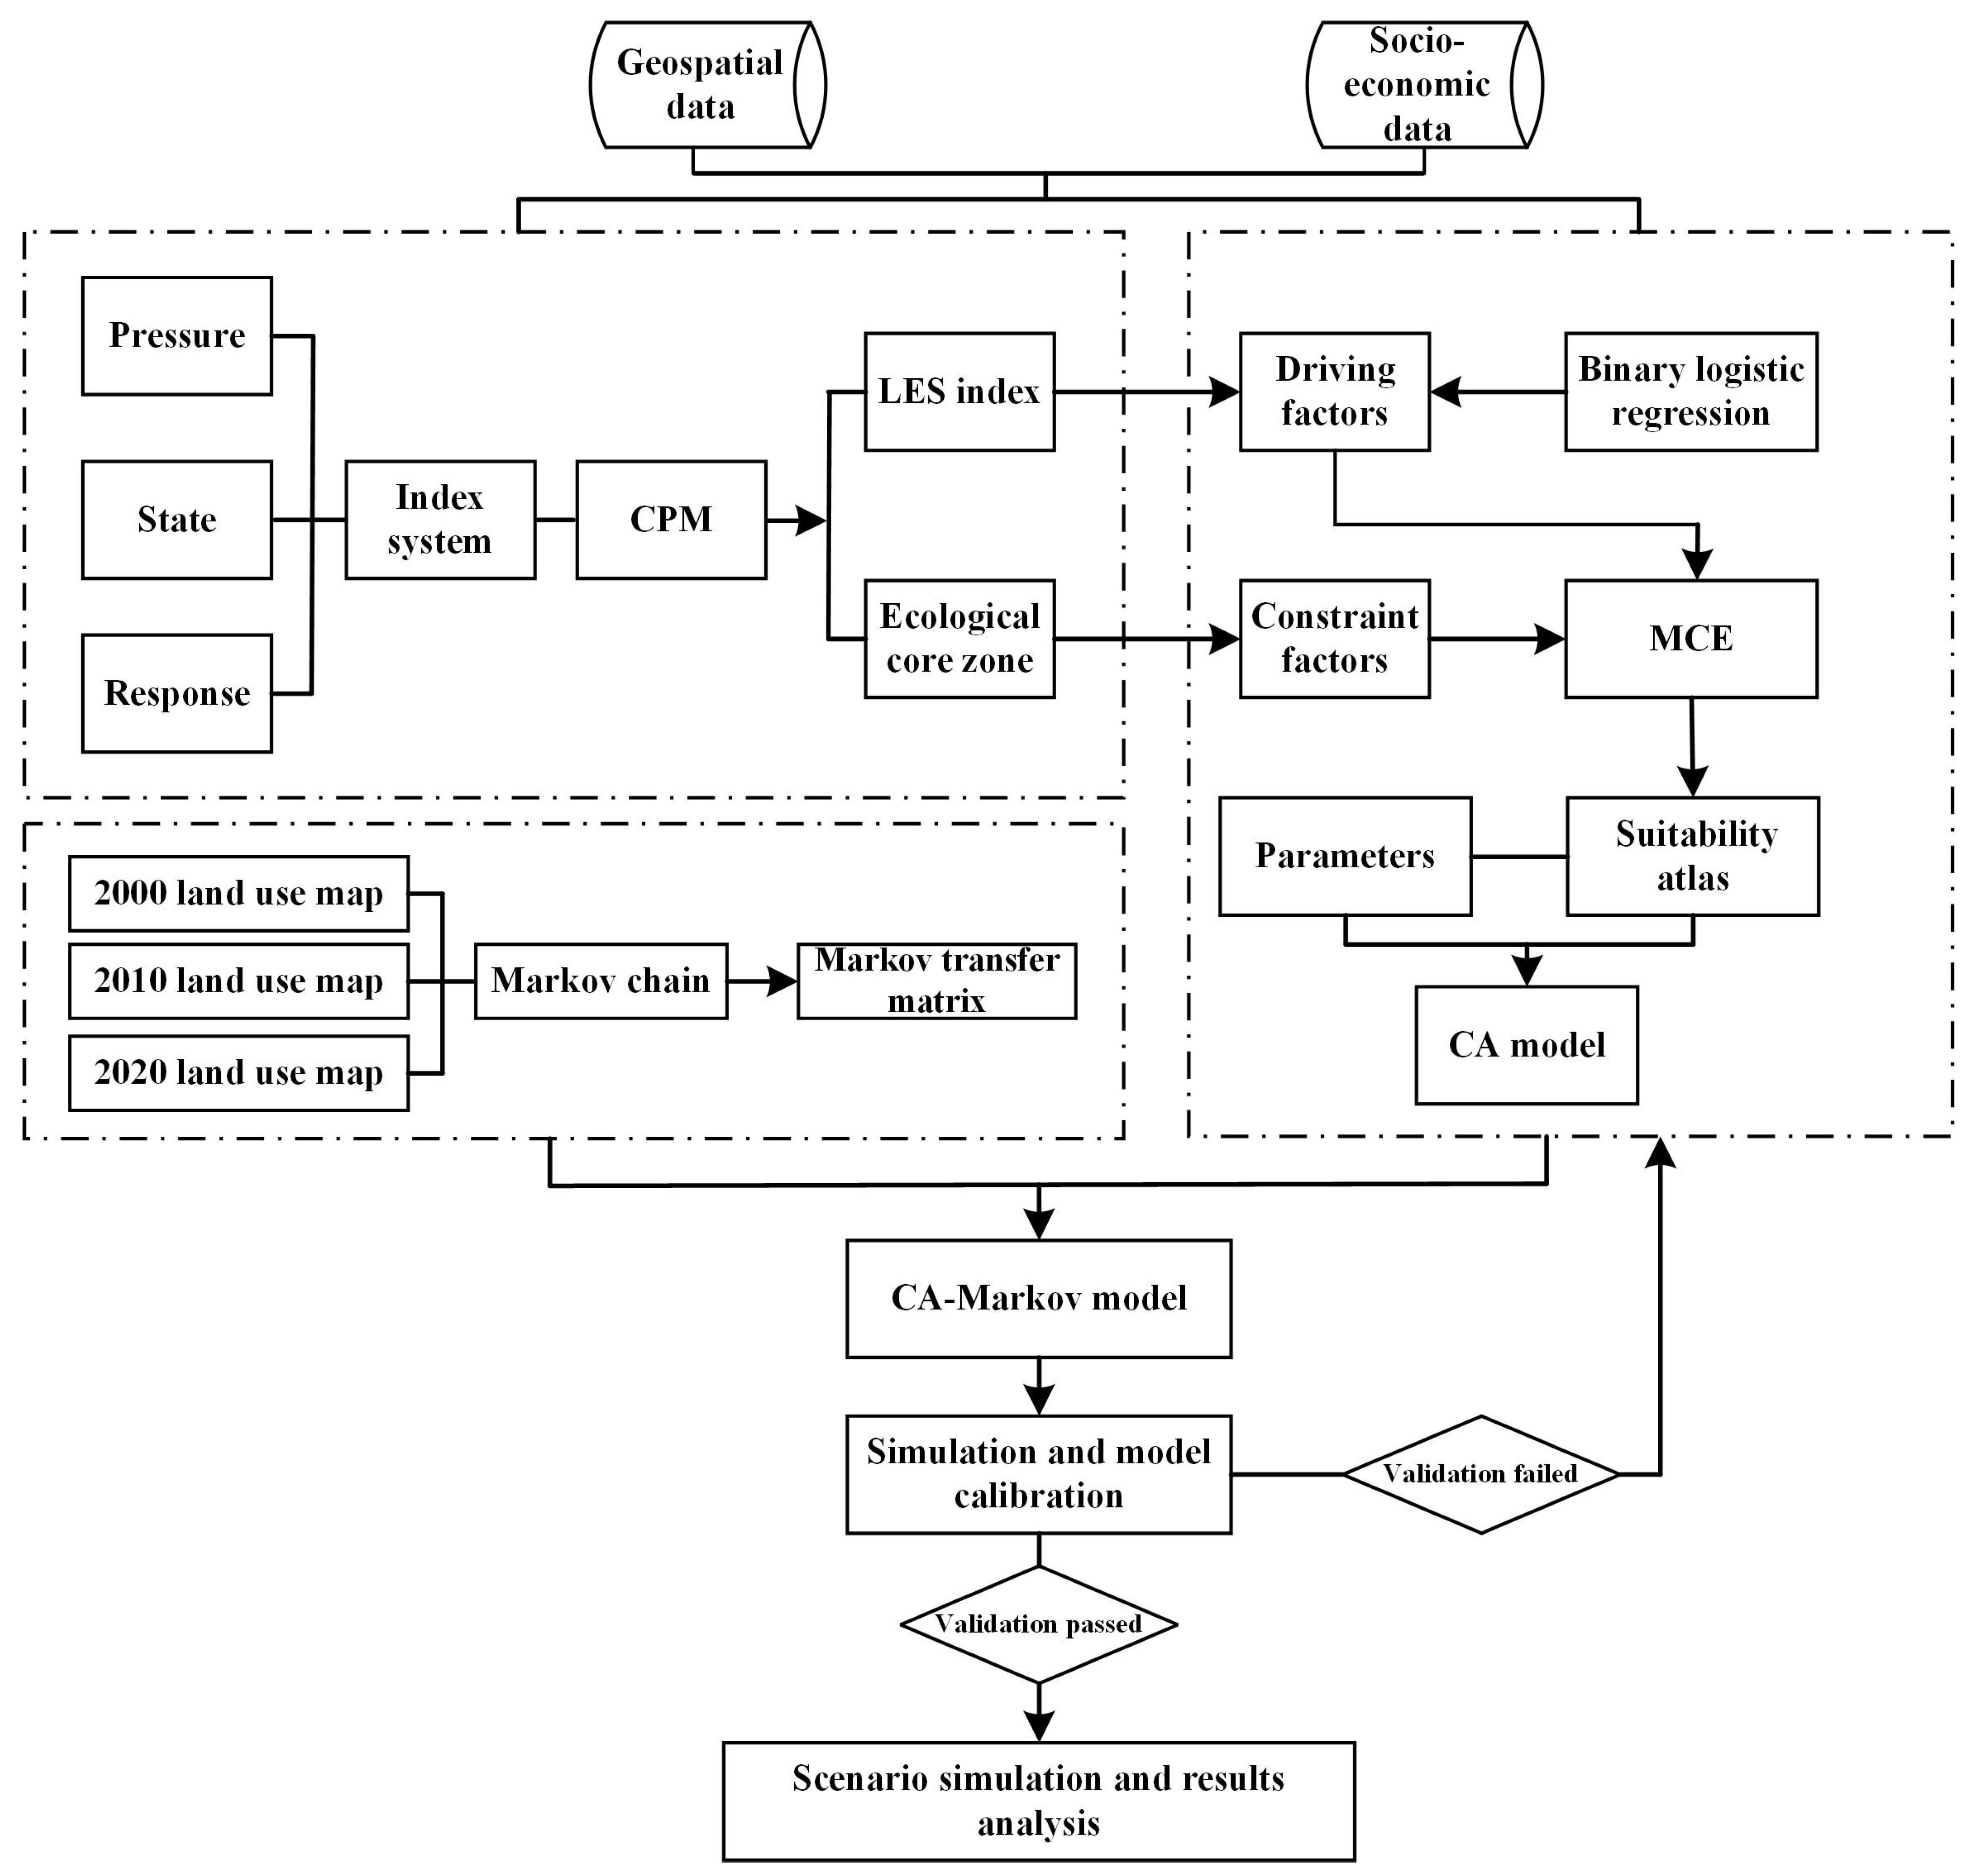
3. Methodology
3.1. Land Ecological Security Evaluation
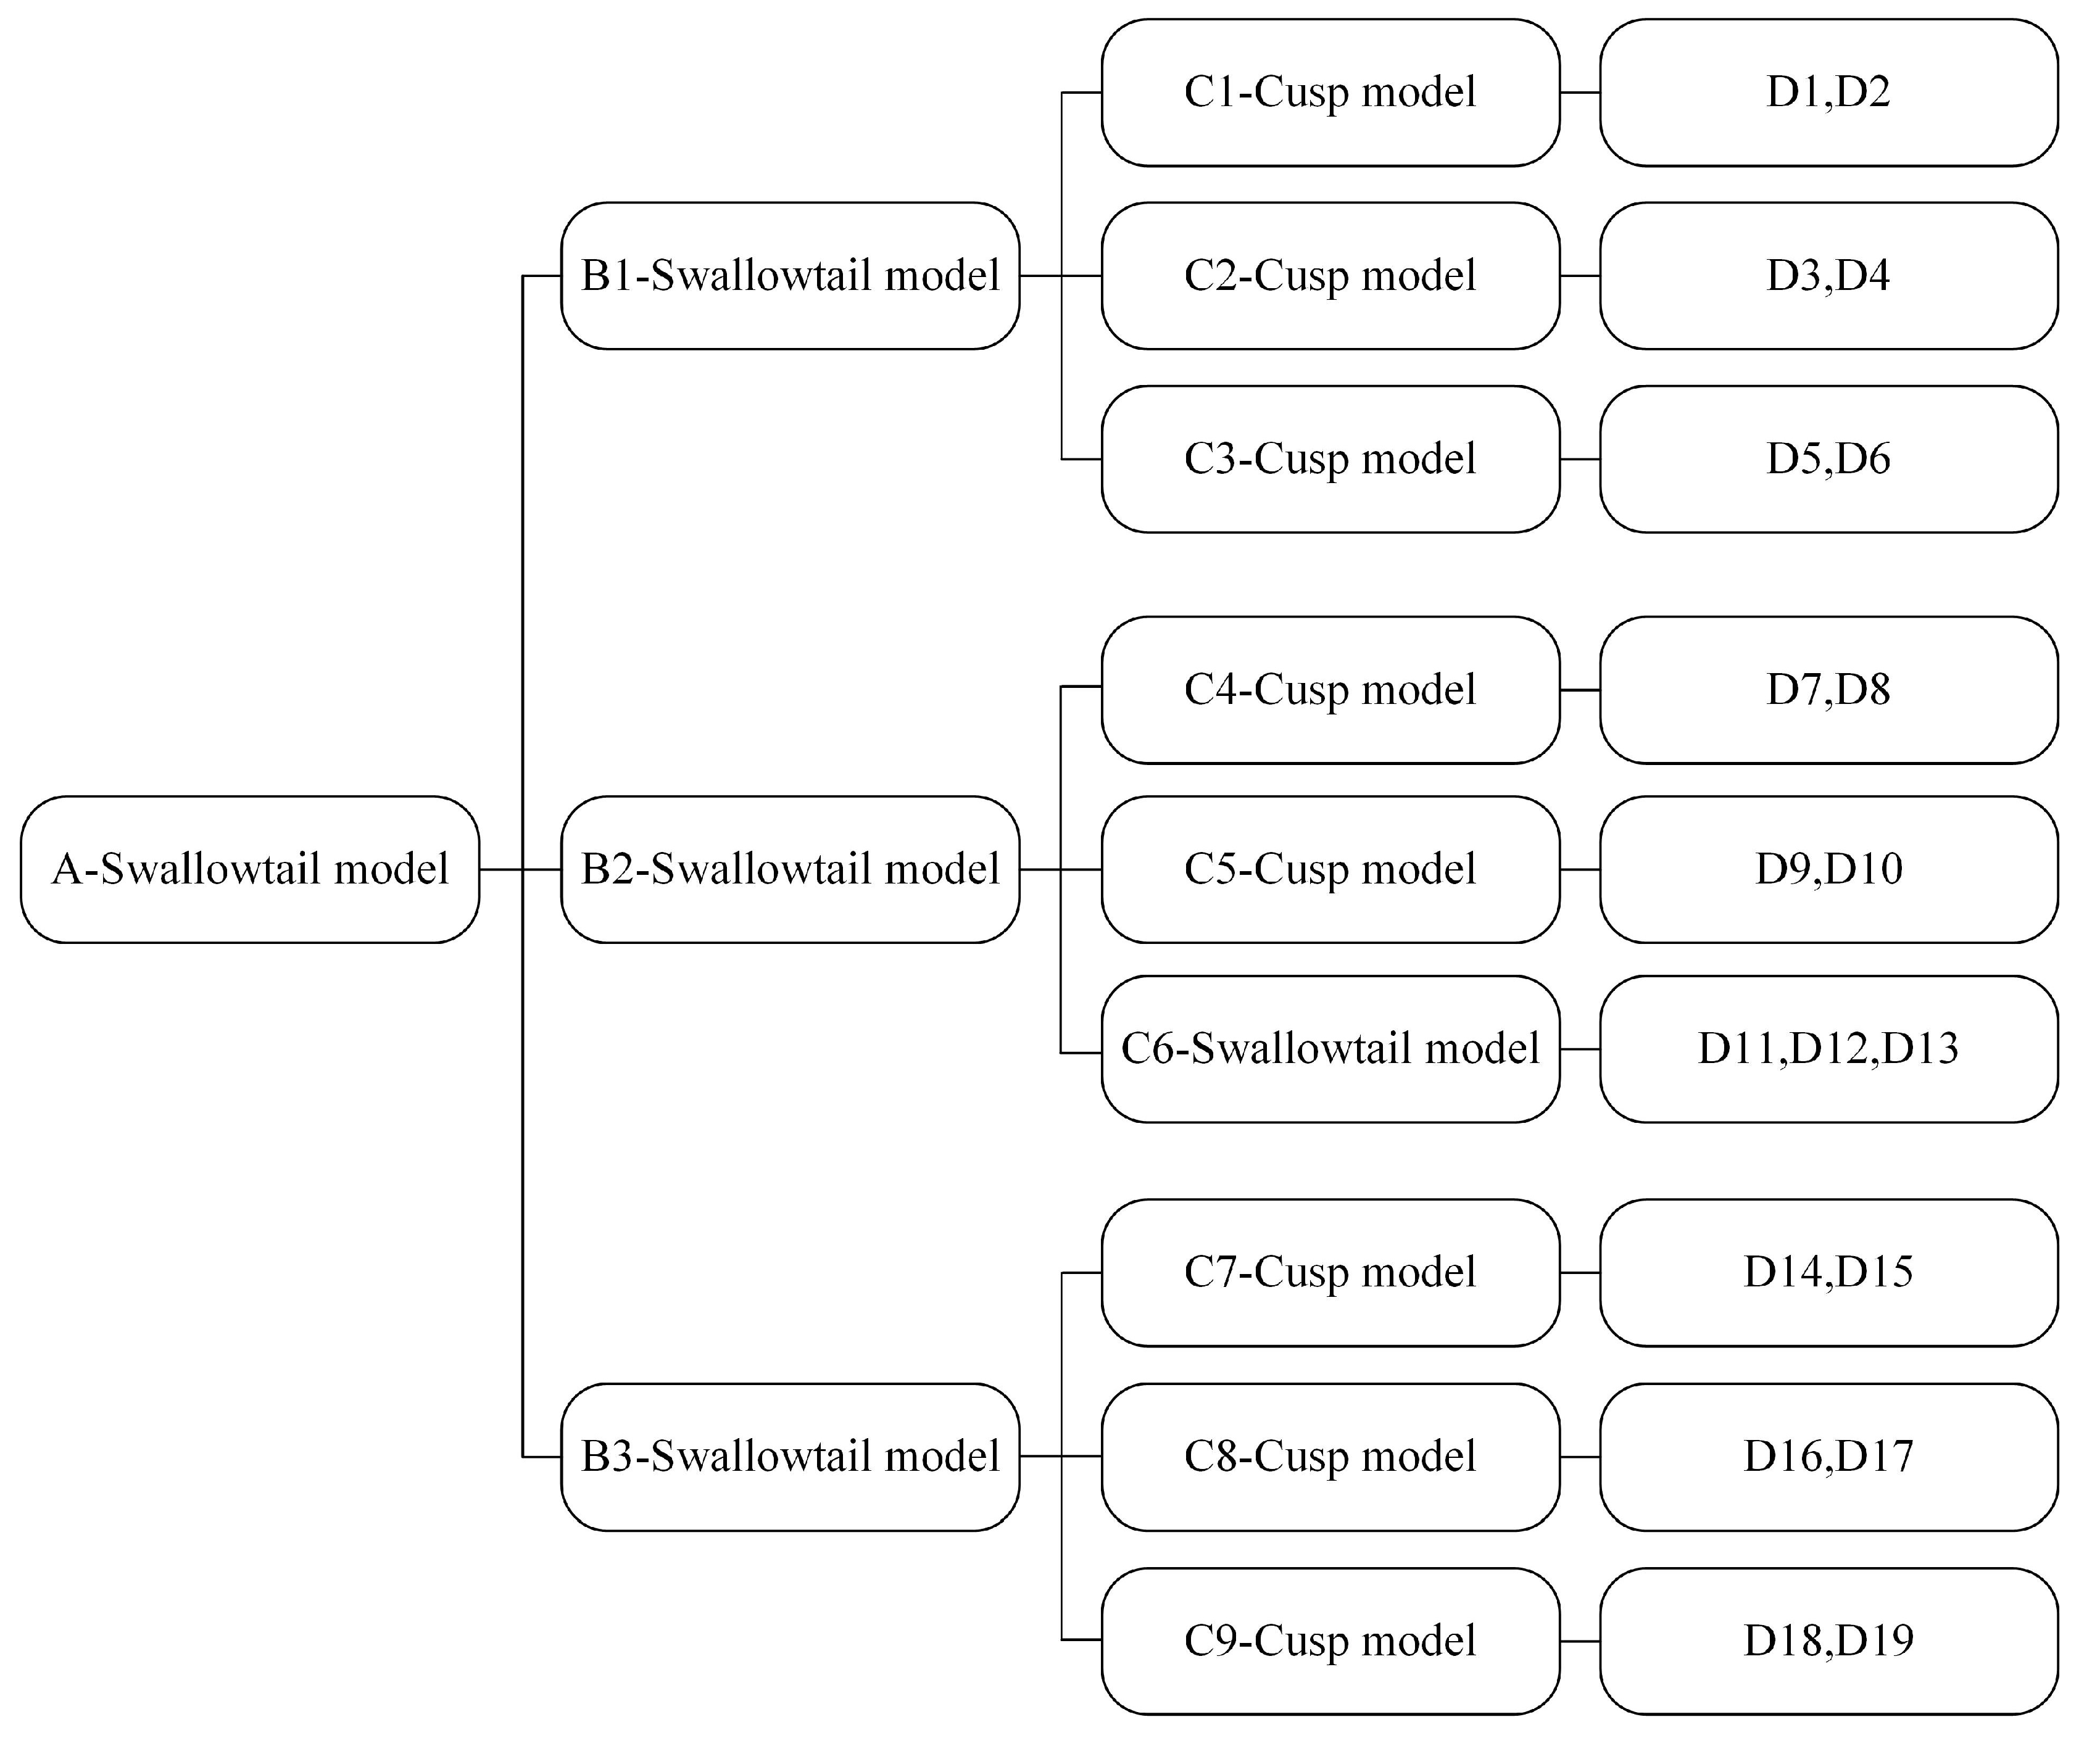
3.1.1. Catastrophe Progress Method
3.1.2. Establishment of Evaluation Index System Based on PSR Model
3.1.3. Standardization of the Index
3.1.4. Determination of Classification Criteria
3.2. Land Use Pattern Simulation
3.2.1. Markov Transfer Probability Matrix Creation
3.2.2. Spatial Transformation Rules Settings
3.2.3. Construction of Suitability Atlas
Constraint Factors Selection and Weight Determination
3.2.4. Model Calibration
4. Results
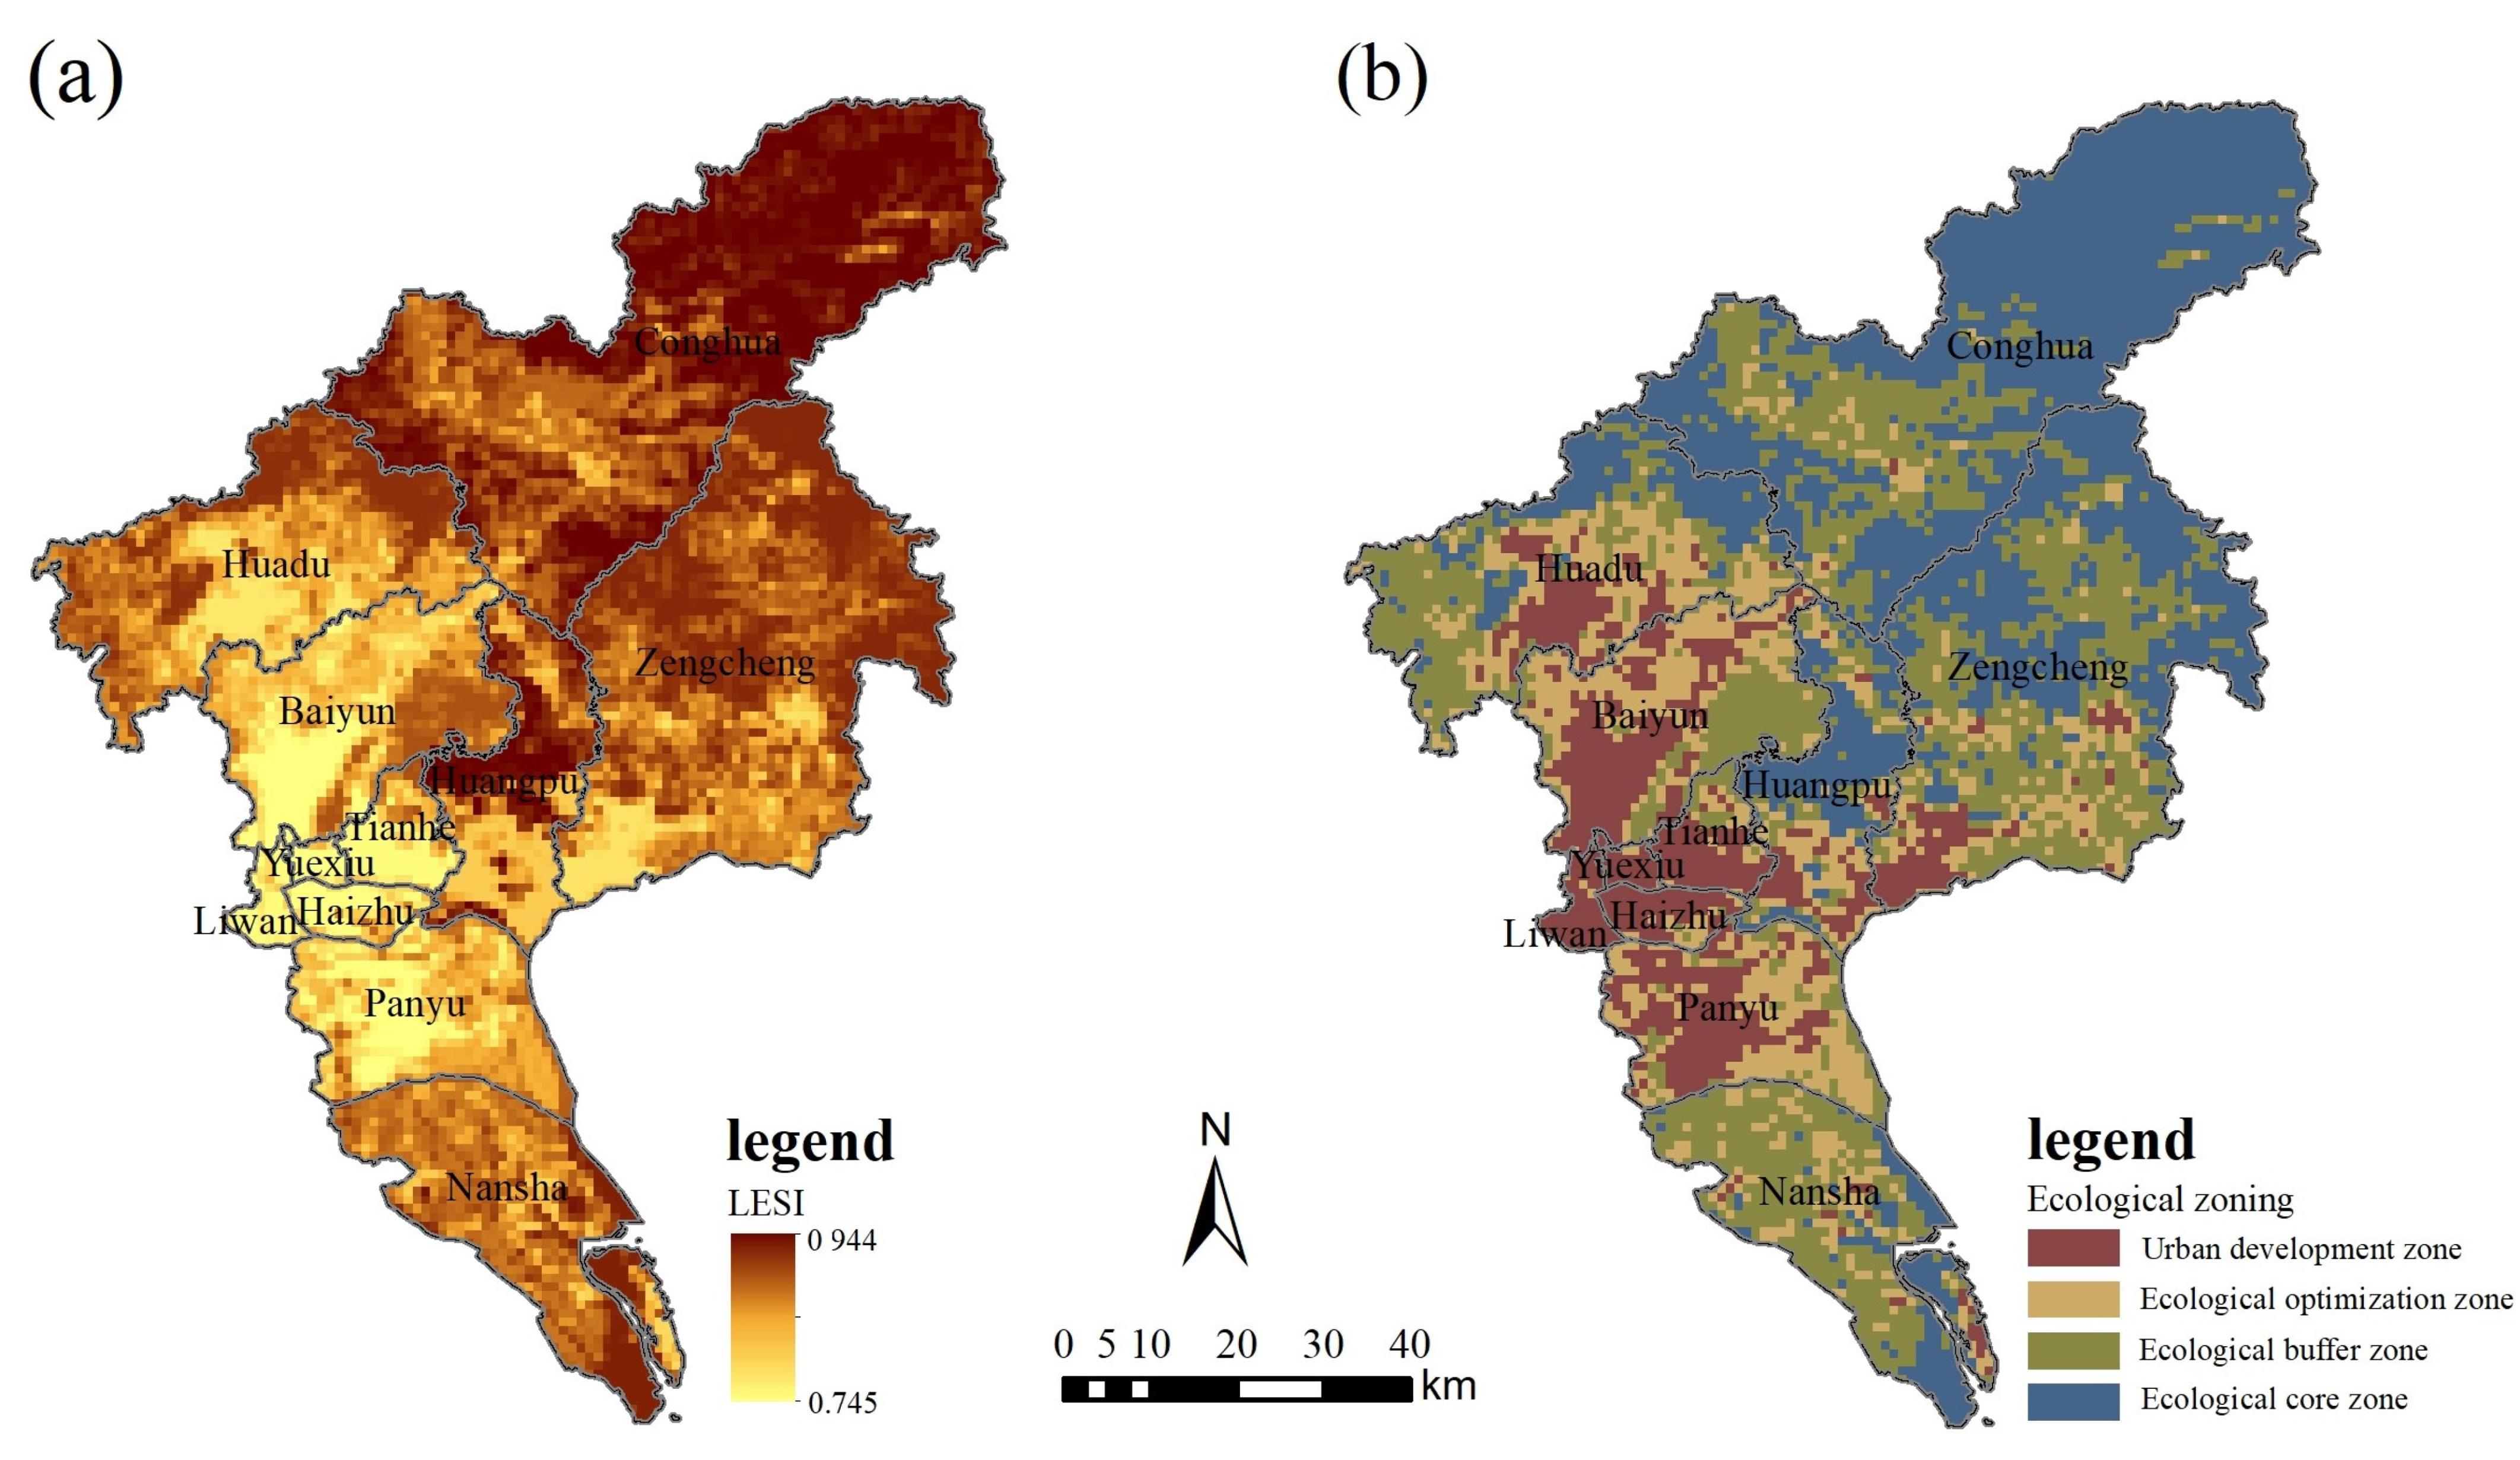
4.1. LES Pattern
4.2. Analysis of Scenario Simulation Results
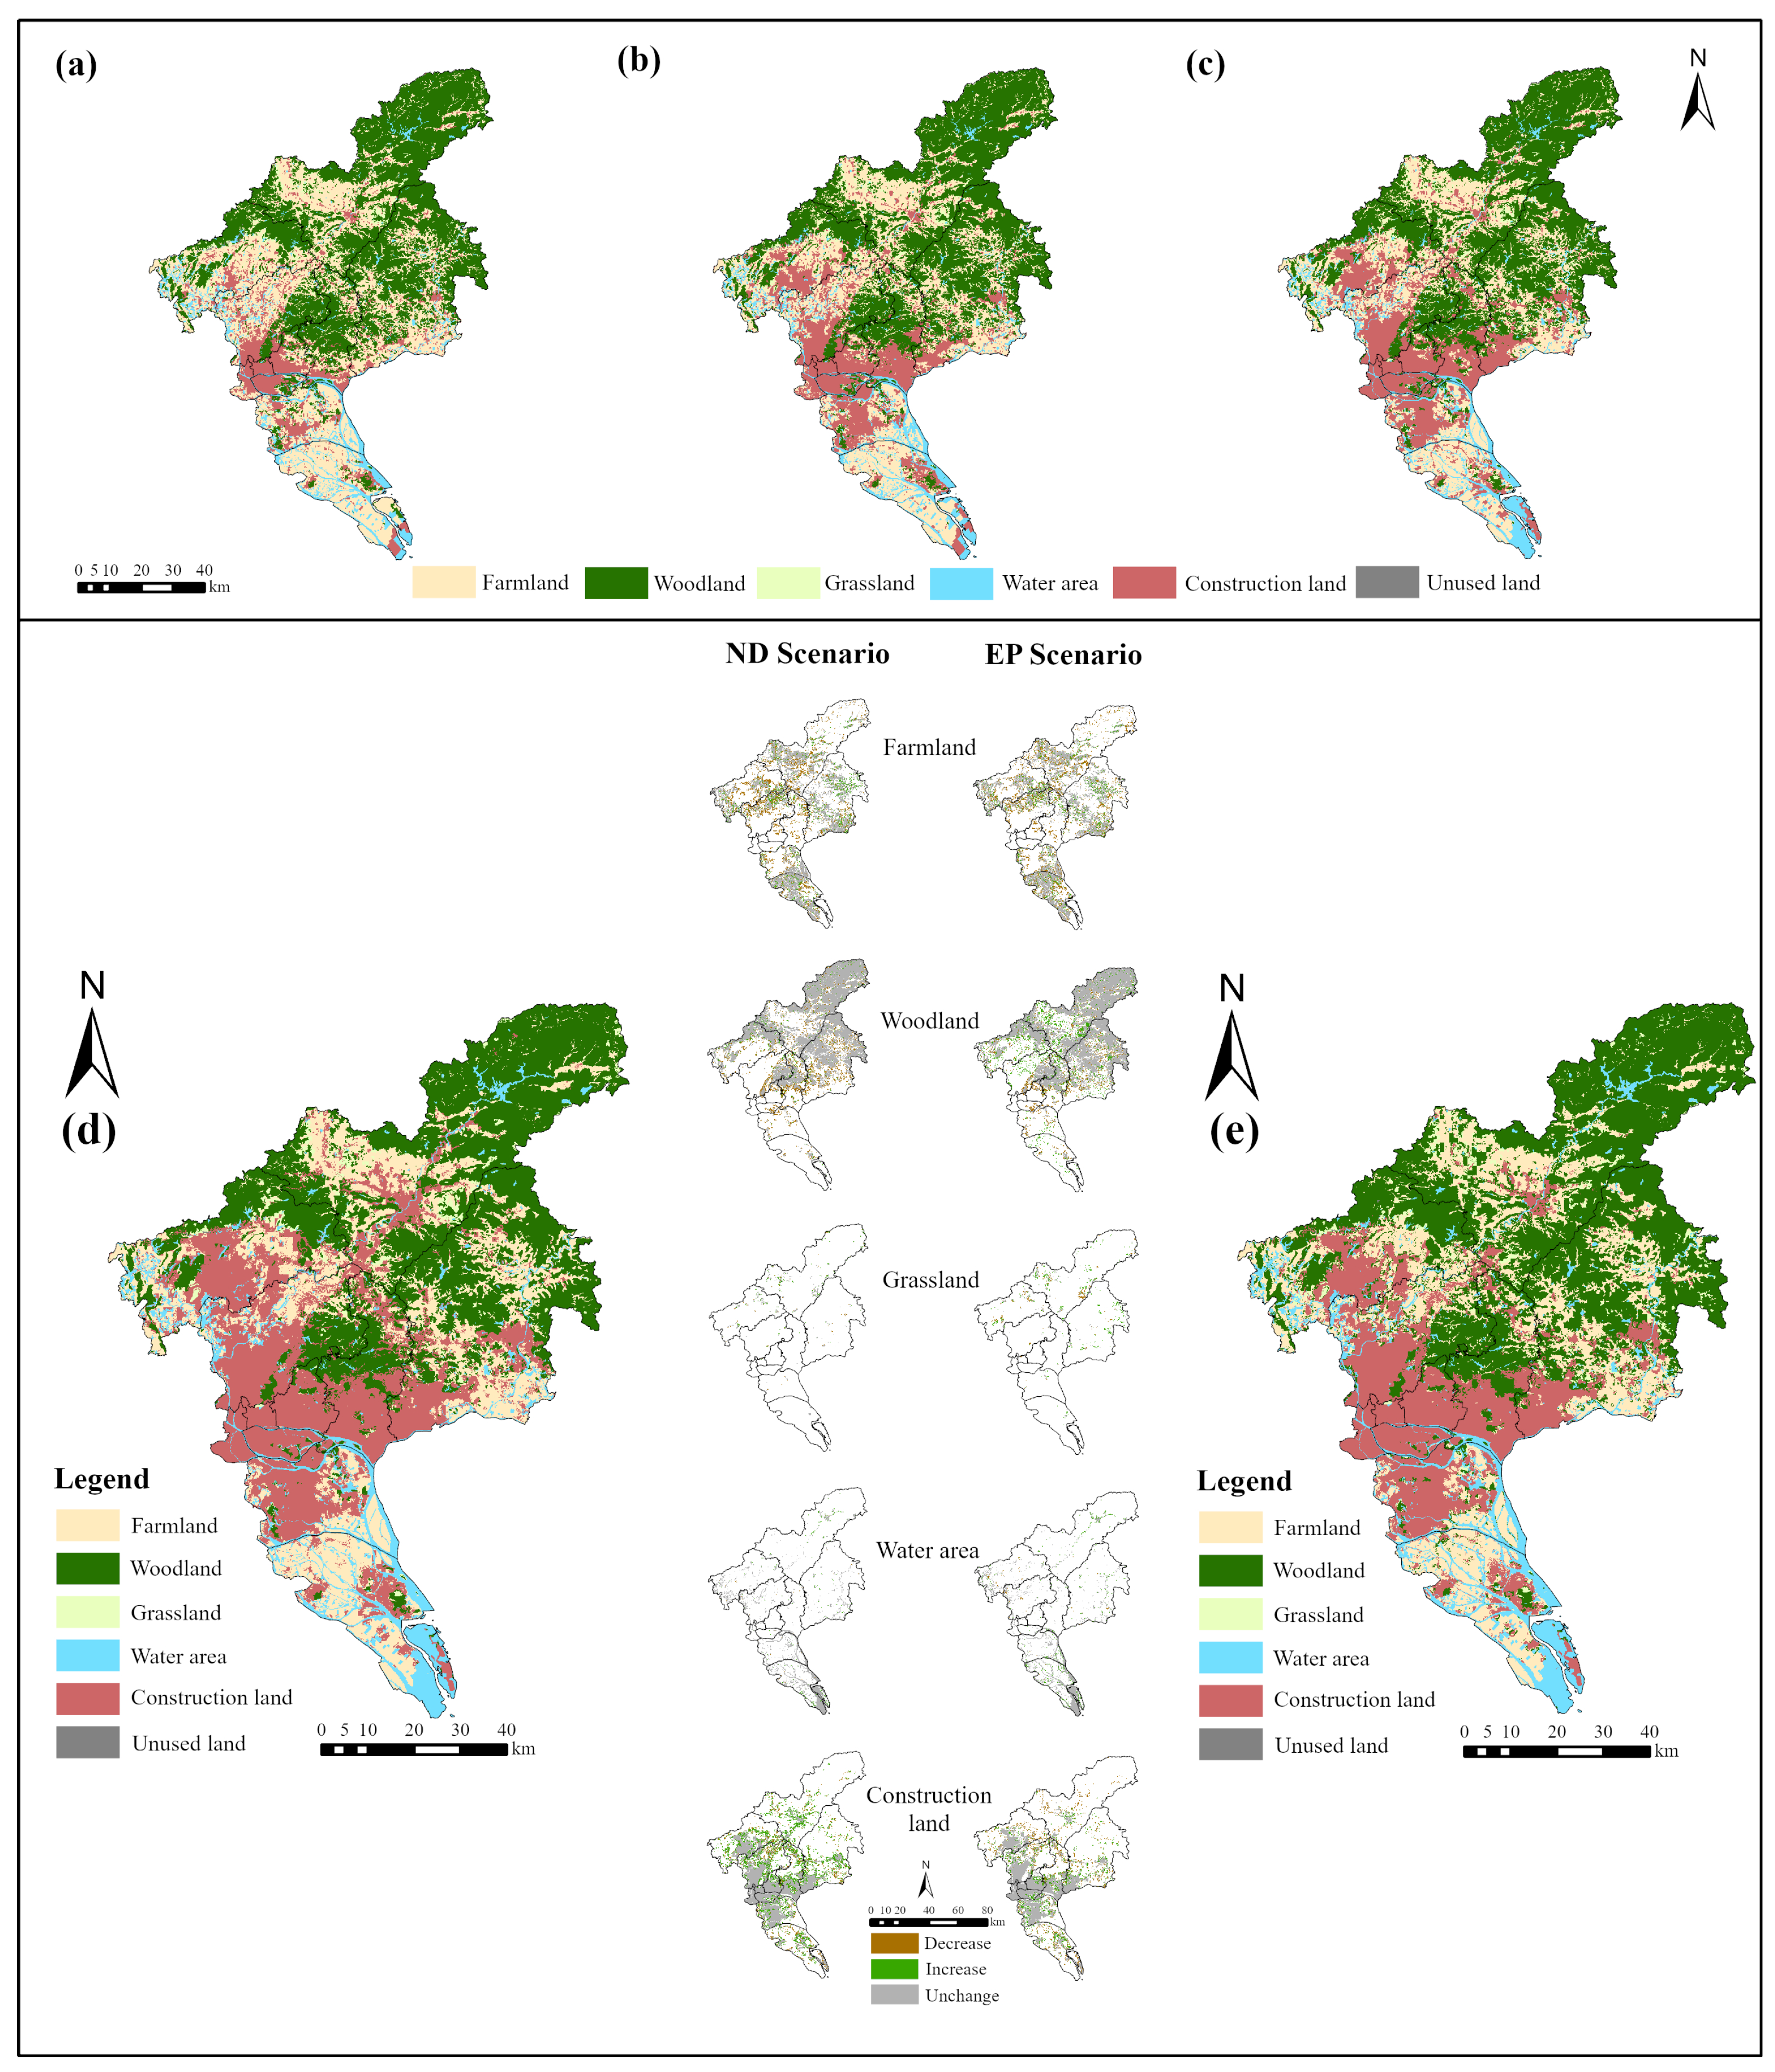
4.2.1. Analysis of Land Use Structure Change
4.2.2. Analysis of Spatial Changes in Land Use
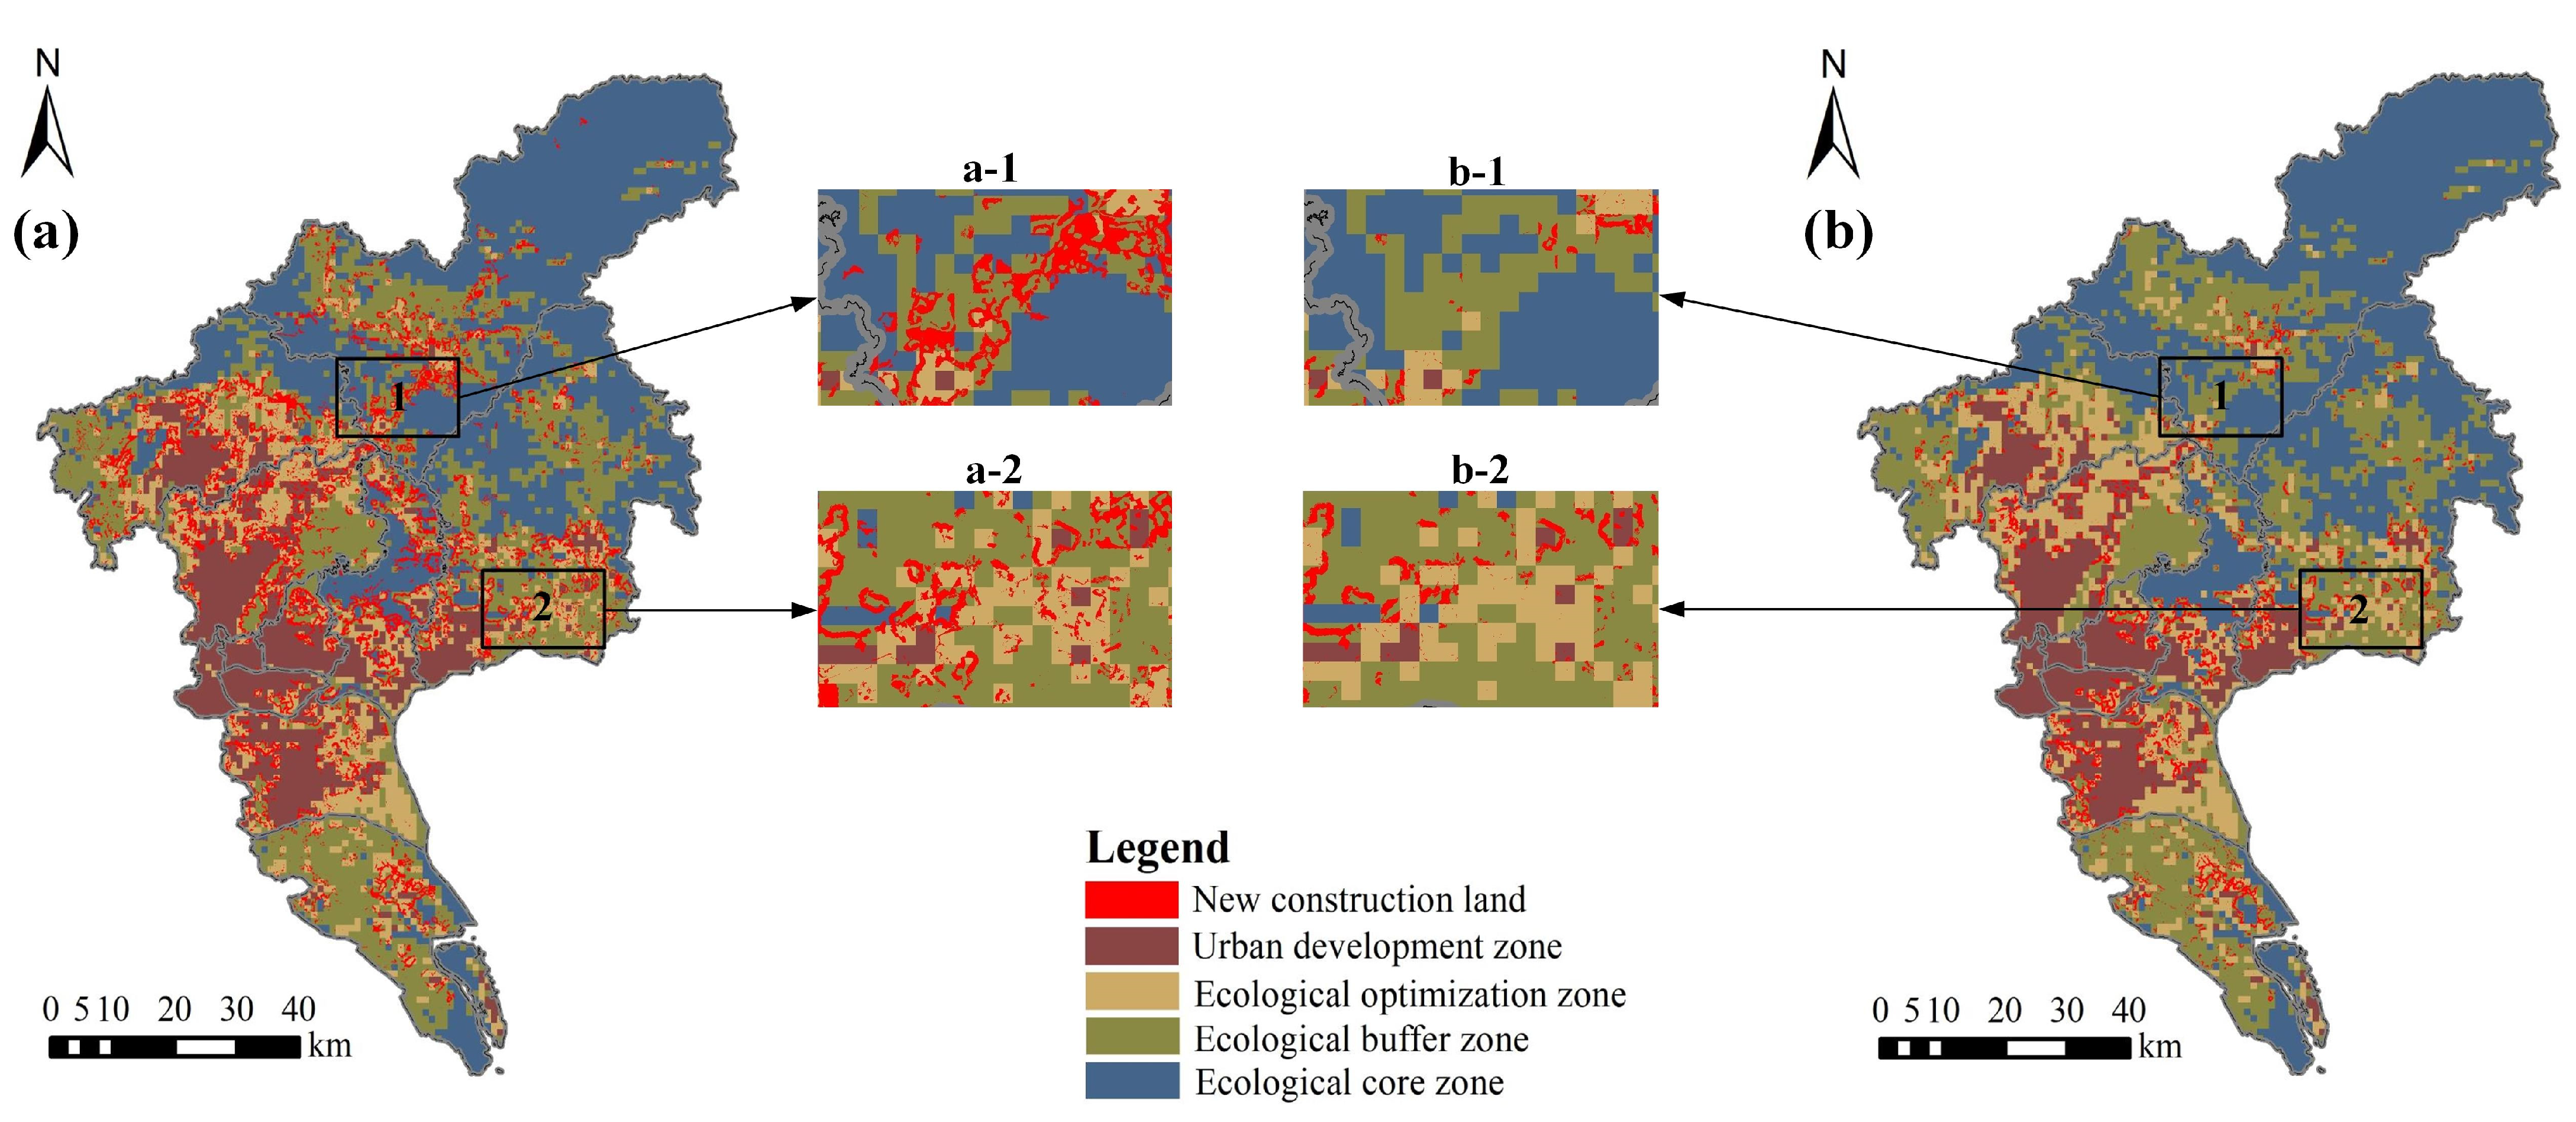
4.3. Land Use Pattern Incorporating LES
5. Discussion
5.1. The Simulation Model Integrating LES
5.2. LES Evaluation
5.3. Implications for Future Land Use and Management
5.4. Limitations and Outlook
6. Conclusions
Author Contributions
Funding
Institutional Review Board Statement
Informed Consent Statement
Data Availability Statement
Conflicts of Interest
References
- Li, Q.; Wang, L.; Gul, H.N.; Li, D. Simulation and optimization of land use pattern to embed ecological suitability in an oasis region: A case study of Ganzhou district, Gansu province, China. J. Environ. Manag. 2021, 287, 112321. [Google Scholar] [CrossRef] [PubMed]
- Fan, Z. Simulation of land cover change in Beijing-Tianjin-Hebei region under different SSP-RCP scenarios. Acta Geographica Sinica. 2022, 77, 228–244. Available online: http://www.geog.com.cn/CN/10.11821/dlxb202201016 (accessed on 25 March 2022). (In Chinese).
- Fu, F.; Deng, S.; Wu, D.; Liu, W.; Bai, Z. Research on the spatiotemporal evolution of land use landscape pattern in a county area based on CA-Markov model. Sustain. Cities Soc. 2022, 80, 103760. [Google Scholar] [CrossRef]
- Giam, X.; Bradshaw, C.J.A.; Tan, H.T.W.; Sodhi, N.S. Future habitat loss and the conservation of plant biodiversity. Biol. Conserv. 2010, 143, 1594–1602. [Google Scholar] [CrossRef]
- Beauchard, O.; Veríssimo, H.; Queirós, A.M.; Herman, P.M.J. The use of multiple biological traits in marine community ecology and its potential in ecological indicator development. Ecol. Indic. 2017, 76, 81–96. [Google Scholar] [CrossRef]
- Zheng, L.; Zhang, Z.; Da, X.; Ma, Y. Dynamic evaluation and influencing factors of land ecological security in Jiayuguan City. Arid Land Geogr. 2021, 44, 289–298. Available online: http://alg.xjegi.com/CN/10.12118/j.issn.1000–6060.2021.01.30 (accessed on 25 January 2021). (In Chinese).
- Li, Z.; Li, M.; Xia, B. Spatio-temporal dynamics of ecological security pattern of the Pearl River Delta urban agglomeration based on LUCC simulation. Ecol. Indic. 2020, 114, 106319. [Google Scholar] [CrossRef]
- Zhu, Y.; Zhong, S.; Wang, Y.; Liu, M. Land Use Evolution and Land Ecological Security Evaluation Based on AHP-FCE Model: Evidence from China. Int. J. Environ. Res. Public Health 2021, 18, 12076. [Google Scholar] [CrossRef]
- Roth, D.; Moreno-Sanchez, R.; Torres-Rojo, J.M.; Moreno-Sanchez, F. Estimation of human induced disturbance of the environment associated with 2002, 2008 and 2013 land use/cover patterns in Mexico. Appl Geogr. 2016, 66, 22–34. [Google Scholar] [CrossRef]
- Cao, Y.; Bai, Z.; Sun, Q.; Zhou, W. Rural settlement changes in compound land use areas: Characteristics and reasons of changes in a mixed mining-rural-settlement area in Shanxi Province, China. Habitat Int. 2017, 61, 9–21. [Google Scholar] [CrossRef]
- He, L.; Jia, Q.; Li, C.; Zhang, L.; Xu, H. Land use pattern simulation based on ecosystem service value and ecological security pattern. Trans. Chin. Soc. Agric. Eng. 2016, 32, 275–284. (In Chinese) [Google Scholar] [CrossRef]
- Xu, H.; Song, Y.; Tian, Y. Simulation of land-use pattern evolution in hilly mountainous areas of North China: A case study in Jincheng. Land Use Policy 2022, 112, 105826. [Google Scholar] [CrossRef]
- Girma, R.; Fürst, C.; Moges, A. Land use land cover change modeling by integrating artificial neural network with cellular Automata-Markov chain model in Gidabo river basin, main Ethiopian rift. Environ. Chall. 2022, 6, 100419. [Google Scholar] [CrossRef]
- Li, J.; Ouyang, X.; Zhu, X. Land space simulation of urban agglomerations from the perspective of the symbiosis of urban development and ecological protection: A case study of Changsha-Zhuzhou-Xiangtan urban agglomeration. Ecol. Indic. 2021, 126, 107669. [Google Scholar] [CrossRef]
- Baig, M.F.; Mustafa, M.R.U.; Baig, I.; Takaijudin, H.B.; Zeshan, M.T. Assessment of land use land cover changes and future predictions using CA-ANN simulation for Selangor, Malaysia. Water 2022, 14, 402. [Google Scholar] [CrossRef]
- Li, F.; Li, Z.; Chen, H.; Chen, Z.; Li, M. An agent-based learning-embedded model (ABM-learning) for urban land use planning: A case study of residential land growth simulation in Shenzhen, China. Land Use Policy 2020, 95, 104620. [Google Scholar] [CrossRef]
- Rafiee, R.; Mahiny, A.S.; Khorasani, N.; Darvishsefat, A.A.; Danekar, A. Simulating urban growth in Mashad City, Iran through the SLEUTH model (UGM). Cities 2009, 26, 19–26. [Google Scholar] [CrossRef]
- Chaudhuri, G.; Clarke, K.C. Modeling an Indian megalopolis—A case study on adapting SLEUTH urban growth model. Comput. Environ. Urban Syst. 2019, 77, 101358. [Google Scholar] [CrossRef] [Green Version]
- Rounsevell, M.D.A.; Pedroli, B.; Erb, K.; Gramberger, M.; Busck, A.G.; Haberl, H.; Kristensen, S.; Kuemmerle, T.; Lavorel, S.; Lindner, M.; et al. Challenges for land system science. Land Use Policy 2012, 29, 899–910. [Google Scholar] [CrossRef]
- Wang, X.; Yao, Y.; Ren, S.; Shi, X. A Coupled FLUS and Markov approach to simulate the spatial pattern of land use in rapidly developing cities. J. Geo-Inf. Sci. 2022, 24, 100–113. Available online: http://www.dqxxkx.cn/CN/10.12082/dqxxkx.2022.210359 (accessed on 25 January 2022). (In Chinese).
- Li, X.; Ma, X.; Xiao, C.; Ou, M. The Regional Land Use Layout Optimization Based on the CLUE-S Model. Econ. Geogr. 2015, 35, 162–167, 172. (In Chinese) [Google Scholar] [CrossRef]
- Rahman, M.T.U.; Ferdous, J. Spatio-temporal variation and prediction of land use based on CA-Markov of southwestern coastal district of Bangladesh. Remote Sens. Appl. Soc. Environ. 2021, 24, 100609. [Google Scholar] [CrossRef]
- Wang, Q.; Guan, Q.; Lin, J.; Luo, H.; Tan, Z.; Ma, Y. Simulating land use/land cover change in an arid region with the coupling models. Ecol. Indic. 2021, 122, 107231. [Google Scholar] [CrossRef]
- Zhang, C.; Xu, J.; Wen, J.; Yang, X.; Wang, J.; Zhao, B. Dynamic simulation of landscape change in the Baiyangdian basin based on the CA-Markov model and MCE constraints. J. Agric. Resour. Environ. 2021, 38, 655–664. (In Chinese) [Google Scholar] [CrossRef]
- Li, H.; Li, S.; Yin, M. Research progress and prospect of land ecological security in China. J. Arid. Land Resour. Environ. 2016, 30, 50–56. (In Chinese) [Google Scholar] [CrossRef]
- Wang, Y.; Li, X.; Zhang, Q.; Li, J.; Zhou, X. Projections of future land use changes: Multiple scenarios-based impacts analysis on ecosystem services for Wuhan city, China. Ecol. Indic. 2018, 94, 430–445. [Google Scholar] [CrossRef]
- Yang, X.; Li, S.; Zhu, C.; Dong, B.; Xu, H. Simulating urban expansion based on ecological security pattern—A case study of Hangzhou, China. Int. J. Environ. Res. Public Health 2022, 19, 301. [Google Scholar] [CrossRef]
- Su, Z.; Li, G.; Chen, S.; Nie, X. Land ecological security evaluation and its influence factors based on catastrophe progression method-taking guangxi zhuang autonomous region as an example. Bull. Soil Water Conserv. 2018, 38, 142–149. (In Chinese) [Google Scholar] [CrossRef]
- Zhang, W.; Xu, X.; Chen, X. Social vulnerability assessment of earthquake disaster based on the catastrophe progression method: A Sichuan Province case study. Int. J. Disast Risk Re. 2017, 24, 361–372. [Google Scholar] [CrossRef]
- Wang, D.; Li, Y.; Yang, X.; Zhang, Z.; Gao, S.; Zhou, Q.; Zhuo, Y.; Wen, X.; Guo, Z. Evaluating urban ecological civilization and its obstacle factors based on integrated model of PSR-EVW-TOPSIS: A case study of 13 cities in Jiangsu Province, China. Ecol. Indic. 2021, 133, 108431. [Google Scholar] [CrossRef]
- Cheng, H.; Zhu, L.; Meng, J. Fuzzy evaluation of the ecological security of land resources in mainland China based on the Pressure-State-Response framework. Sci. Total Environ. 2022, 804, 150053. [Google Scholar] [CrossRef]
- Meyar-Naimi, H.; Vaez-Zadeh, S. Sustainable development based energy policy making frameworks, a critical review. Energ. Policy 2012, 43, 351–361. [Google Scholar] [CrossRef]
- Guo, L.; Feng, Z.; Liu, G.; Shi, Y.; Wang, J.; Lin, F.; Ma, X. Evaluation of land eco-security in Fenhe River Basin based on matter-element model. Chin. J. Ecol. 2020, 39, 2061–2069. (In Chinese) [Google Scholar] [CrossRef]
- Li, J.; Yuan, W. Assessment of urban land ecological security in Yinchuan City based on the grid method. J. Nat. Resour. 2017, 32, 988–1001. Available online: http://www.jnr.ac.cn/CN/10.11849/zrzyxb.20160633 (accessed on 20 June 2017). (In Chinese).
- Song, F.; Yang, X. Assessment of water resources carrying capacity based on improved catastrophe progression method: A case study in the lower reaches of Yangtze River. South-to-North Water Transf. Water Sci. Technol. 2018, 16, 24–32, 58. (In Chinese) [Google Scholar] [CrossRef]
- Zhao, L.; Yang, J.; Li, C.; Ge, Y.; Han, Z. Progress on Geographic Cellular Automata Model. Sci. Geogr. Sin. 2016, 36, 1190–1196. Available online: http://geoscien.neigae.ac.cn/CN/10.13249/j.cnki.sgs.2016.08.009 (accessed on 20 August 2016). (In Chinese).
- Wang, Q.; Wang, H.; Chang, R.; Zeng, H.; Bai, X. Dynamic simulation patterns and spatiotemporal analysis of land-use/land-cover changes in the Wuhan metropolitan area, China. Ecol. Model. 2022, 464, 109850. [Google Scholar] [CrossRef]
- Wang, H.; Hu, Y.; Liang, Y. Simulation and spatiotemporal evolution analysis of biocapacity in Xilingol based on CA-Markov land simulation. Environ. Sustain. Indic. 2021, 11, 100136. [Google Scholar] [CrossRef]
- Wickramasuriya, R.C.; Bregt, A.K.; van Delden, H.; Hagen-Zanker, A. The dynamics of shifting cultivation captured in an extended Constrained Cellular Automata land use model. Ecol. Model. 2009, 220, 2302–2309. [Google Scholar] [CrossRef]
- Yue, D.; Yang, C.; Jiang, B.; Guo, J.; Xu, X. Spatio-temporal pattern prediction of the biocapacity in the Shiyang River Basin on the basis of the CA-Markov model. Acta Ecol. Sin. 2019, 39, 1993–2003. (In Chinese) [Google Scholar] [CrossRef]
- Shu, B.; Zhang, H.; Li, Y.; Qu, Y.; Chen, L. Spatiotemporal variation analysis of driving forces of urban land spatial expansion using logistic regression: A case study of port towns in Taicang City, China. Habitat. Int. 2014, 43, 181–190. [Google Scholar] [CrossRef]
- Shan, L.; Wang, H.; Zhang, B.; Pan, P. Land Use Simulation of the City Clusters Around Poyang Lake based on Land Ecological Security Assessment. J. Geo-Inf. Sci. 2020, 22, 543–556. Available online: http://www.dqxxkx.cn/CN/10.12082/dqxxkx.2020.190306 (accessed on 25 March 2020). (In Chinese).
- Shu, R.; Sun, H.; Zou, Y.; Hou, Q. Driving forces of spatio-temporal changes in cultivated land in Ningxia Eco-economic Belt Along Yellow River. Bull. Soil Water Conserv. 2021, 41, 267–274. (In Chinese) [Google Scholar] [CrossRef]
- Zhou, L.; Dang, X.; Sun, Q.; Wang, S. Multi-scenario simulation of urban land change in Shanghai by random forest and CA-Markov model. Sustain. Cities Soc. 2020, 55, 102045. [Google Scholar] [CrossRef]
- Ghosh, S.; Das Chatterjee, N.; Dinda, S. Urban ecological security assessment and forecasting using integrated DEMATEL-ANP and CA-Markov models: A case study on Kolkata Metropolitan Area, India. Sustain. Cities Soc. 2021, 68, 102773. [Google Scholar] [CrossRef]
- Zhang, L.; Zhou, Y.; Men, M.; Xu, H.; Wang, S. Land use scenario simulation with different types of ecological security. Trans. Chin. Soc. Agric. Eng. 2015, 31, 308–316. (In Chinese) [Google Scholar] [CrossRef]
- Zhang, D.; Wang, X.; Qu, L.; Li, S.; Lin, Y.; Yao, R.; Zhou, X.; Li, J. Land use/cover predictions incorporating ecological security for the Yangtze River Delta region, China. Ecol. Indic. 2020, 119, 106841. [Google Scholar] [CrossRef]
- Shi, M.; Wu, H.; Jia, H.; Zhu, L.; Dong, T.; He, P.; Yang, Q. Temporal and spatial evolution and prediction of carbon stocks in Yili Valley based on MCE-CA-Markov and InVEST models. J. Agric. Resour. Environ. 2021, 38, 1010–1019. (In Chinese) [Google Scholar] [CrossRef]
- Huang, L.; Yang, P. Spatio-temporal evolution characteristics and influencing factors of land ecological security in the Yangtze River Economic Belt. Resour. Environ. Yangtze Basin 2019, 28, 1780–1790. Available online: http://yangtzebasin.whlib.ac.cn/CN/10.11870/cjlyzyyhj201908003 (accessed on 20 August 2019). (In Chinese).
- Xu, L.; Yin, H.; Li, Z.; Li, S. Land Ecological Security Evaluation of Guangzhou, China. Int. J. Environ. Res. Public Health. 2014, 11, 10537–10558. [Google Scholar] [CrossRef] [Green Version]
- Qi, P.; Wang, X.; Fan, W.; Jiao, Y.; Wang, Y. Evaluation of ecological security in Jiayuguan City based on matter element model. Ecol. Sci. 2020, 39, 259–267. (In Chinese) [Google Scholar] [CrossRef]
- Wang, D.; Zhang, R.; Ai, D.; Sun, W. Empirical Study on Evaluation Method of Land Ecological Security Matter-element Model Based on EES-PSR. Trans. Chin. Soc. Agric. Mach. 2017, 48, 228–237. (In Chinese) [Google Scholar] [CrossRef]
- Liu, S.; Xu, L.; Zhang, J. Spatiotemporal change of land ecological security in Xinjiang. Acta Ecol. Sin. 2017, 39, 3871–3884. (In Chinese) [Google Scholar] [CrossRef]
- Zhou, Y.; Wu, T.; Wang, Y. Urban expansion simulation and development-oriented zoning of rapidly urbanising areas: A case study of Hangzhou. Sci. Total Environ. 2022, 807, 150813. [Google Scholar] [CrossRef]
- Lin, J.; Ye, Z.; Yang, H. Thoughts on the underused urban land redevelopment in the era of inventory planning. China Land Sci. 2019, 33, 1–8. (In Chinese) [Google Scholar] [CrossRef]
- Ding, Y.; Guo, Q.; Chen, Z.; Zhang, X. Identification and redevelopment strategy of underused urban land in underdeveloped counties using system theory. Trans. Chin. Soc. Agric. Eng. 2020, 36, 316–326. (In Chinese) [Google Scholar] [CrossRef]
- Huang, H.; Luo, W.; Wu, C.; Li, D. Evaluation of land eco-security based on matter element analysis. Trans. Chin. Soc. Agric. Eng. 2010, 26, 316–322. (In Chinese) [Google Scholar] [CrossRef]
- Gomes, E.; Abrantes, P.; Banos, A.; Rocha, J. Modelling future land use scenarios based on farmers’ intentions and a cellular automata approach. Land Use Policy 2019, 85, 142–154. [Google Scholar] [CrossRef]
- Sheng, X.; Cao, Y.; Zhou, W.; Zhang, H.; Song, L. Multiple scenario simulations of land use changes and countermeasures for collaborative development mode in Chaobai River region of Jing-Jin-Ji, China. Habitat Int. 2018, 82, 38–47. [Google Scholar] [CrossRef]
- Zhang, Y.; Li, Y.; Lv, J.; Wang, J.; Wu, Y. Scenario simulation of ecological risk based on land use/cover change—A case study of the Jinghe county, China. Ecol. Indic. 2021, 131, 108176. [Google Scholar] [CrossRef]

| Type | Number of Control Variables | Potential Function | Bifurcation Set Equation | Normalization Formula |
|---|---|---|---|---|
| Fold model | 1 | |||
| Cusp model | 2 | |||
| Swallowtail model | 3 | |||
| Butterfly model | 4 |
| Target Layer | Criteria Layer | Factor Layer | Index Layer | Unit | Weight | Attribute |
|---|---|---|---|---|---|---|
| LES (A) | Pressure (B1) | Environmental pollution (C1) | Per farmland chemical fertilizer (D1) | kg·ha−1 | 0.005 | Negative |
| Per farmland pesticide (D2) | kg·ha−1 | 0.012 | Negative | |||
| Population growth (C2) | Population density (D3) | P·km−2 | 0.034 | Negative | ||
| Population growth rate (D4) | ‰ | 0.029 | Negative | |||
| Urban expansion (C3) | Proportion of construction (D5) | % | 0.074 | Negative | ||
| Urbanization rate (D6) | % | 0.021 | Negative | |||
| State (B2) | Environmental quality (C4) | Proportion of woodland (D7) | % | 0.082 | Positive | |
| Proportion of water area (D8) | % | 0.138 | Positive | |||
| Economic condition (C5) | Economic density (D9) | yuan·km−2 | 0.091 | Negative | ||
| Per capita GDP (D10) | yuan·P−1 | 0.041 | Negative | |||
| Level of resource reserves (C6) | Per capita farmland (D11) | ha·P−1 | 0.045 | Positive | ||
| Per capita public green space (D12) | ha·P−1 | 0.024 | Positive | |||
| Per capita land reserve resources (D13) | ha·P−1 | 0.074 | Positive | |||
| Response (B3) | Pollution treatment (C7) | Attainment rate of the industrial wasted water discharge (D14) | % | 0.015 | Positive | |
| Disposal rate of household garbage (D15) | % | 0.009 | Positive | |||
| Economic input level (C8) | Proportion of tertiary industry value in GDP (D16) | % | 0.072 | Negative | ||
| Proportion of environment protection investment in GDP (D17) | % | 0.085 | Positive | |||
| Engineering governance (C9) | Newly added soil erosion control area (D18) | ha | 0.043 | Positive | ||
| Afforestation renewal area (D19) | ha | 0.106 | Positive |
| Land Use Type | Period | Constraint Factors | |||||||
|---|---|---|---|---|---|---|---|---|---|
| POP | DR | DRS | DH | DT | SLO | ELE | LESI | ||
| Farmland | T1 | 0.231 (−) | 0.206 (−) | 0.141 (−) | 0.107 (+) | 0.188 (+) | 0.079 (−) | 0.048 (−) | — |
| T2-ND | 0.234 (−) | 0.150 (−) | 0.140 (−) | 0.114 (+) | 0.181 (+) | 0.093 (−) | 0.088 (−) | — | |
| T2-EP | 0.210 (−) | 0.134 (−) | 0.125 (−) | 0.102 (+) | 0.162 (+) | 0.083 (−) | 0.078 (−) | 0.106 (−) | |
| Woodland | T1 | — | 0.114 (+) | 0.123 (+) | 0.103 (+) | 0.117 (+) | 0.204 (+) | 0.339 (+) | — |
| T2-ND | — | 0.112 (+) | 0.130 (+) | 0.111 (+) | 0.128 (+) | 0.226 (+) | 0.293 (+) | — | |
| T2-EP | — | 0.101 (+) | 0.117 (+) | 0.101 (+) | 0.115 (+) | 0.204 (+) | 0.265 (+) | 0.097 (+) | |
| Grassland | T1 | 0.167 (−) | 0.163 (+) | 0.158 (+) | 0.146 (+) | 0.170 (+) | 0.196 (+) | — | — |
| T2-ND | 0.192 (−) | 0.184 (+) | 0.148 (+) | — | 0.161 (+) | 0.169 (+) | 0.146 (+) | — | |
| T2-EP | 0.171 (−) | 0.164 (+) | 0.131 (+) | — | 0.142 (+) | 0.149 (+) | 0.129 (+) | 0.114 (+) | |
| Water area | T1 | 0.144 (−) | 0.100 (−) | 0.184 (+) | 0.159 (+) | 0.183 (+) | 0.127 (−) | 0.103 (−) | — |
| T2-ND | — | 0.117 (−) | 0.224 (+) | 0.186 (+) | 0.222 (+) | 0.142 (−) | 0.109 (−) | — | |
| T2-EP | — | 0.099 (−) | 0.190 (+) | 0.159 (+) | 0.148 (+) | 0.122 (−) | 0.093 (−) | 0.189 (+) | |
| Construction land | T1 | 0.153 (+) | 0.220 (+) | 0.097 (−) | 0.149 (−) | 0.093 (−) | 0.170 (−) | 0.118 (−) | — |
| T2-ND | 0.213 (+) | 0.245 (+) | 0.126 (−) | 0.169 (−) | 0.116 (−) | — | 0.131 (−) | — | |
| T2-EP | 0.165 (+) | 0.115 (+) | 0.106 (−) | 0.142 (−) | 0.101 (−) | 0.153 (−) | 0.123 (−) | 0.095 (−) | |
| Unused land | T1 | 0.303 (−) | 0.108 (−) | 0.123 (+) | 0.125 (+) | 0.146 (+) | — | 0.195 (+) | — |
| T2-ND | 0.282 (−) | 0.138 (−) | 0.140 (+) | 0.133 (+) | 0.142 (+) | — | 0.165 (+) | — | |
| T2-EP | 0.253 (−) | 0.124 (−) | 0.126 (+) | 0.120 (+) | 0.127 (+) | — | 0.149 (+) | 0.101 (+) | |
| Land Use Type | Area/km2 | Difference/km2 | Percentage/% | ||||
|---|---|---|---|---|---|---|---|
| 2020 | 2030-ND | 2030-EP | 2030-ND | 2030-EP | 2030-ND | 2030-EP | |
| Farmland | 1998.29 | 1728.03 | 1738.54 | −270.26 | −259.75 | −13.52 | −13.00 |
| Woodland | 3019.18 | 2792.02 | 3129.06 | −227.16 | 109.88 | −7.52 | 3.64 |
| Grassland | 103.79 | 130.41 | 151.21 | 26.62 | 47.42 | 25.65 | 45.69 |
| Water area | 580.71 | 596.76 | 598.48 | 16.05 | 17.77 | 2.76 | 3.06 |
| Construction land | 1541.73 | 1996.31 | 1627.21 | 454.58 | 85.48 | 29.49 | 5.54 |
| Unused land | 2.08 | 2.25 | 1.28 | 0.17 | −0.80 | 8.17 | −38.46 |
| Land Use Types | Scenarios | Categories | Ecological Zones | Total | |||
|---|---|---|---|---|---|---|---|
| UDZ | EOZ | EBZ | ECZ | ||||
| Farmland | ND | Area/km2 | 50.29 | 476.94 | 1026.80 | 174.00 | 1728.03 |
| Proportion/% | 2.91% | 27.60% | 59.42% | 10.07% | 100.00% | ||
| EP | Area/km2 | 42.26 | 511.03 | 1057.31 | 127.94 | 1738.54 | |
| Proportion/% | 2.43% | 29.39% | 60.82% | 7.36% | 100% | ||
| Woodland | ND | Area/km2 | 4.73 | 66.84 | 516.94 | 2203.51 | 2792.02 |
| Proportion/% | 0.17% | 2.39% | 18.51% | 78.92% | 100% | ||
| EP | Area/km2 | 2.21 | 213.55 | 611.46 | 2301.84 | 3129.06 | |
| Proportion/% | 0.07% | 6.82% | 19.54% | 73.56% | 100% | ||
| Grassland | ND | Area/km2 | 2.68 | 27.87 | 61.07 | 38.79 | 130.41 |
| Proportion/% | 2.06% | 21.37% | 46.83% | 29.74% | 100% | ||
| EP | Area/km2 | 2.35 | 17.64 | 75.98 | 55.24 | 151.21 | |
| Proportion/% | 1.55% | 11.67% | 50.25% | 36.53% | 100% | ||
| Water area | ND | Area/km2 | 31.44 | 107.44 | 264.66 | 193.22 | 596.76 |
| Proportion/% | 5.27% | 18.00% | 44.35% | 32.38% | 100% | ||
| EP | Area/km2 | 32.34 | 115.68 | 240.52 | 209.94 | 598.48 | |
| Proportion/% | 5.40% | 19.33% | 40.19% | 35.08% | 100% | ||
| Construction land | ND | Area/km2 | 952.37 | 549.60 | 384.95 | 109.39 | 1996.31 |
| Proportion/% | 47.71% | 27.53% | 19.28% | 5.48% | 100% | ||
| EP | Area/km2 | 962.35 | 370.79 | 270.17 | 23.90 | 1627.21 | |
| Proportion/% | 59.14% | 22.79% | 16.60% | 1.47% | 100% | ||
| Unused land | ND | Area/km2 | 0.00 | 0.19 | 1.98 | 0.08 | 2.25 |
| Proportion/% | 0.00% | 8.44% | 88.00% | 3.56% | 100% | ||
| EP | Area/km2 | 0.00 | 0.19 | 0.96 | 0.13 | 1.28 | |
| Proportion/% | 0.00% | 14.84% | 75.00% | 10.16% | 100% | ||
Publisher’s Note: MDPI stays neutral with regard to jurisdictional claims in published maps and institutional affiliations. |
© 2022 by the authors. Licensee MDPI, Basel, Switzerland. This article is an open access article distributed under the terms and conditions of the Creative Commons Attribution (CC BY) license (https://creativecommons.org/licenses/by/4.0/).
Share and Cite
Zhao, L.; Liu, G.; Xian, C.; Nie, J.; Xiao, Y.; Zhou, Z.; Li, X.; Wang, H. Simulation of Land Use Pattern Based on Land Ecological Security: A Case Study of Guangzhou, China. Int. J. Environ. Res. Public Health 2022, 19, 9281. https://doi.org/10.3390/ijerph19159281
Zhao L, Liu G, Xian C, Nie J, Xiao Y, Zhou Z, Li X, Wang H. Simulation of Land Use Pattern Based on Land Ecological Security: A Case Study of Guangzhou, China. International Journal of Environmental Research and Public Health. 2022; 19(15):9281. https://doi.org/10.3390/ijerph19159281
Chicago/Turabian StyleZhao, Lesong, Guangsheng Liu, Chunlong Xian, Jiaqi Nie, Yao Xiao, Zhigang Zhou, Xiting Li, and Hongmei Wang. 2022. "Simulation of Land Use Pattern Based on Land Ecological Security: A Case Study of Guangzhou, China" International Journal of Environmental Research and Public Health 19, no. 15: 9281. https://doi.org/10.3390/ijerph19159281
APA StyleZhao, L., Liu, G., Xian, C., Nie, J., Xiao, Y., Zhou, Z., Li, X., & Wang, H. (2022). Simulation of Land Use Pattern Based on Land Ecological Security: A Case Study of Guangzhou, China. International Journal of Environmental Research and Public Health, 19(15), 9281. https://doi.org/10.3390/ijerph19159281