Abstract
Background: Although fall prevention in patients after stroke is crucial, the clinical validity of fall risk assessment tools is underresearched in this population. The study aim was to determine the cut-off scores and clinical validity of the Sensory Organization Test (SOT), the Berg Balance Scale (BBS), and the Fall Efficacy Scale–International (FES-I) in patients after stroke. Methods: In this prospective cross-sectional study, we analyzed data for patients admitted to a rehabilitation unit after stroke from 2018 through 2021. Participants underwent SOT, BBS, and FES-I pre-discharge, and the fall incidence was recorded for 6 months. We used an area under the receiver operating characteristic curve (AUC) to calculate predictive values. Results: Of 84 included patients (median age 68.5 (interquartile range 67–71) years), 32 (38.1%) suffered a fall. All three tests were significantly predictive of fall risk. Optimal cut-off scores were 60 points for SOT (AUC 0.686), 35 and 42 points for BBS (AUC 0.661 and 0.618, respectively), and 27 and 29 points for FES-I (AUC 0.685 and 0.677, respectively). Conclusions: Optimal cut-off scores for SOT, BBS, and FES-I were determined for patients at risk for falls after a stroke, which all three tools classified with a good discriminatory ability.
1. Introduction
Despite significant improvements in treatment, ischemic stroke remains a leading cause of death, disability, impaired body function, and cognitive deficiency [1]. Many neurological consequences of stroke, combined with external and internal environmental factors, can increase the risk of falls and lead to further complications. Falls are a serious problem in all stages after stroke [2], with a one-year post-stroke incidence of 30% to 73% and recurrent falls in 27% of patients [3,4,5]. Falls are associated with injuries of varying severity, decreased physical activity, and functional limitations, leading to the loss of independence and the fear of falling [6]. These additional consequences can entail a longer recovery period and higher treatment costs [7]. Identifying the predictive performance of the most commonly used fall prediction tools may have socioeconomic relevance.
Various predictors, determinants, and circumstances associated with the risk of falling in the acute, subacute, and chronic phases after ischemic stroke have been investigated [8,9,10,11]. Significant risk factors for patients who fall after ischemic stroke include impaired balance, perception, cognitive function, visuospatial hemineglect, a subjective fear of falls, a history of previous falls, depression, the use of walking aids, and impaired self-sufficiency; less common factors include age, incontinence, and gender [4,9,12]. Literature reviews and a meta-analysis have confirmed the multifactorial etiology of falls in stroke survivors, while recommending that risk factors should be identified and addressed by interventions on multiple levels [3,13,14]. There is a need for tools with validated predictive ability in determining fall risk and to assess the effectiveness of the intervention. Previous studies have examined the ability to predict falls after stroke using clinical tests of balance and the fear of falling [4,13,15,16]. However, discriminatory validity and cut-off scores either have not been specified for patients after stroke or need to be updated in a population treated according to current guidelines [12,13].
Balance impairments are a common complication after stroke, leading to falls. Balance disorders occur in approximately 87.5% of stroke patients [14], who also can experience problems with muscle strength, a limited range of motion, impaired coordination, and somatosensory function [14]. Among the sensorimotor consequences, impaired postural control is likely to have the greatest impact on functional independence and gait [15]. Given the variety of neurological deficits and compensatory strategies, an accurate assessment of all aspects of postural control (motor, sensory, and cognitive) is needed [16]. For the subacute and chronic stages, the assessment of postural balance is an important factor in fall risk prediction [17,18]. Multiple standardized tools are available to assess balance in the context of stroke, most commonly clinical evaluation (e.g., the Romberg test, the Dynamic Gait Index, the Functional Reach Test, and the Timed Up and Go), balance scales (the Berg Balance Scale (BBS), the Postural Assessment Scale for Stroke Patients), questionnaires (e.g., the Activities-specific Balance Confidence Scale, the Falls Efficacy Scale), and instrumental posturography (e.g., the EquiTest, NeuroCom, a Force Platform, the Biodex balance system). Several studies have been conducted to validate the most useful assessment tools for predicting falls after discharge. Of these, the BBS has been the most commonly used to predict falls and has been identified in some studies as an effective predictor of falls in patients after stroke [19,20]. However, recent meta-analyses have found considerable heterogeneity among the conducted studies [21,22]. The predictive abilities of BBS for fall risk have been evaluated to date in one meta-analysis, which included studies focusing on risk in patients with Parkinson’s disease or stroke, primarily in the community setting [22]. Predictive values, such as the area under the receiver operating characteristic (ROC) curve, the likelihood ratio (+/−), and positive and negative predictive values have not yet been determined for BBS. Furthermore, with regard to the recency of previous studies, updating the baseline data in relation to predictive abilities is appropriate.
Compared with clinical tests and scales, which carry a bias risk from subjective evaluations by the clinician, instrumental posturography is highly objective [23]. The clinical utility of instrumental posturography as an objective and quantitative measure recommends its use in addition to scales [24,25] and has been confirmed in studies conducted mainly in older people and patients with stroke, Parkinson’s disease, or vestibular disorders [24,25,26]. The choice of appropriate variables and consistent adherence to measurement conditions (standardization) are essential in posturography [27]. The basic test performed within dynamic posturography is the Sensory Organization Test (SOT), which allows for the capture of impaired sensory integration or inadequate sensory reweighting [16]. The SOT has the advantage of allowing for the objective determination of balance parameters such as equilibrium score, somatosensory analysis, and the identification of movement strategies under particular conditions. The few studies that have addressed fall prediction using the SOT have yielded uncertain conclusions. SOT has been studied in a population with vestibular disorders and in people over the age of 65 years [28], but its predictive abilities (equilibrium score) and cut-off scores to identify patients at a high risk of falling after stroke have not been established.
A psychological factor that contributes to an important risk for falls in patients after stroke is self-efficacy related to falls (fear of falling) [29,30]. Approximately 60–70% of patients with chronic stroke report poor self-efficacy related to falls, which is associated with increased anxiety and limitations in mobility balance [30,31]. The Fall Efficacy Scale–International (FES-I) has been developed to derive the level of fear of falling and is a valid tool for discriminating fall risk in patients after stroke [32]. The cut-off value, sensitivity, and specificity of the FES-I for the population requiring rehabilitation in the post-discharge period after stroke have not yet been established. Only one study has identified a cut-off FES-I value in a population of community-dwelling individuals with chronic stroke [32].
The aim of the present study was to determine the performance of the SOT, BBS, and FES-I fall risk-prediction tools, all frequently used in the stroke rehabilitation setting, and establish optimal cut-off scores that could discriminate those at the greatest risk for falls after stroke.
2. Materials and Methods
2.1. Study Design
This monocentric, prospective, cross-sectional study was conducted in a population of patients admitted for rehabilitation after stroke. The study was approved by the institutional ethics committee (reference number 773/2018). All participants signed informed consent. The study was carried out according to Strengthening the Reporting of Observational Studies in Epidemiology (i.e., STROBE) criteria [33].
2.2. Participants and Setting
This study involved patients diagnosed with a primary ischemic stroke admitted to rehabilitation at the Medical Rehabilitation Clinic (CMR) of the University Hospital of Ostrava, Czech Republic, from October 2018 through February 2021. The inclusion criteria were as follows: (1) patients with first ischemic stroke attack < 90 days, (2) age 40–79 years, (3) in stable condition, (4) able to participate, (5) with functional mobility according to Functional Ambulation Categories (FAC) 3–5, and (6) with the ability to stand without support for 5 min. Exclusion criteria were (1) age < 40 or ≥79, (2) decompensated condition, (3) unable to participate, (4) severe phatic disorder, (5) low functional mobility according to FAC 0–2, (6) inability to stand for 6 min, (7) repeated ischemic stroke or death within 6 months after discharge from hospital care, and (8) the presence of an orthopedic or neurological disease that might influence balance.
2.3. Clinical Outcome Measures
Demographic and clinical data were obtained from medical documentation (age, sex, time since the stroke, type of stroke, stroke therapy method). The following assessments were applied as baseline measures by trained occupational therapists and physiotherapists 3 days before patient discharge: Montreal Cognitive Test (MOCA), Barthel Index (BI), FAC, SOT, BBS, and FES-I. Patients also were asked one direct yes/no question: “Are you afraid of falling?” The MOCA was used to assess cognitive impairment [34,35] and the BI to assess functional capacity (activities of daily living) [36]. Mobility was assessed according to the FAC scale (0–5) [37].
2.3.1. SOT
SOT was performed using Balance Manager® System (NeuroCom® International, Inc., a Division of Natus, Clackamas, OR, USA; Smart Balance Master®, software version 8.6.0), according to the protocol provided with the software, taking into account the age and height of the patient. The ability to stabilize the postural position in upright bipedal standing was tested on a force plate under six different sensorial conditions, as follows: condition 1—fixed surface and visual surround, eyes open; condition 2—fixed surface, eyes closed; condition 3—fixed surface, eyes open, moving, surround; condition 4—moving surface, eyes open, fixed, surround; condition 5—moving surface, eyes closed, fixed, surround; and condition 6—moving surface, eyes open, moving surround.
Each of these conditions was repeated three times, with a duration of 20 s for each record. The resulting values for the center of pressure movement detected by the force platform were compared by the software with the normative values for a healthy population. SOT norms are provided for ages up to 79 years (20–59, 60–69, 70–79) (NeuroCom® International Inc., Clackamas, OR, USA; Smart Balance Master®, software version 7.0). These normative values were selected according to the following parameters: height and age, as required by the Smart Balance Master® system software; motor and cognitive status of the normative sample assessed with the Mini-Mental State Examination; the 10-m walking test [38].
The composite score is a value of the arithmetic mean of the percentage of balance obtained in each SOT condition. The resulting point composite (equilibrium score) is an indicator of the stability level: higher values indicate better postural stability, and a drop in values below the 75th percentile indicates instability with a potential risk for falling [39].
2.3.2. BBS
The BBS test consists of 14 items containing principal components for evaluating the ability to maintain balance during standing, sitting, transfers, and rotations that are necessary to perform activities of daily living. The items are evaluated on an ordinal scale of 0 to 4 (0—no performance, 4—highest score), with a maximum of 56 points, and a higher score indicates better stability. The resulting interval scores can be categorized. BBS was originally developed for the prediction of falls in elderly people but is useful for stroke patients, as well [16,22,40,41].
2.3.3. FES-I
The FES-I is a self-report questionnaire and a widely accepted tool to assess perceived confidence in performing a variety of activities of daily living at home and in social settings without falling. The FES-I consists of 16 items scored on an ordinal scale from 1 to 4 (1—not at all concerned, 4—very concerned). Scores range from 16 to 64 points, and higher scores indicate lower self-efficacy [42,43]. In this study, the questions were completed with the patients in the form of structured interviews.
2.4. Data Collection Procedure
Balance evaluation (SOT, BBS) and FES-I were administered within 3 days of the planned date of discharge from CMR. Patients and their families were asked to record the date and circumstances of the fall (time, location, association with activities of daily living). A fall was defined as an unexpected and unplanned event in which a person is found on the floor or another horizontal surface, with or without injury [44]. Participants were followed for 6 months until the occurrence of a fall or falls. The dependent variable was any fall after discharge, based on phone-reported data collected every month. For the analysis, we used composite SOT, BBS, and FES-I scores.
2.5. Statistical Analysis
Descriptive statistics were used to describe baseline characteristics reporting quantitative data, such as medians and interquartile ranges (IQRs). Participants were classified as ‘non-fallers’ and ‘fallers.’ The differences between these two groups in sociodemographic, clinical, and functional characteristics were calculated using the Mann–Whitney U test for non-normally distributed continuous variables, Pearson’s chi-squared test, and Fisher’s exact test for categorical variables.
The optimal cut-off scores for fall risk classification were calculated using the Youden index for ROC analysis. A ROC curve was plotted for each instrument to verify the test’s ability to identify a fall, using the area under the curve (AUC) as a test scale. To determine the clinical validity of the instruments based on the actual fall, we evaluated sensitivity, specificity, positive and negative predictive values, and positive and negative likelihood ratios.
Statistical analyses were performed using Stata version 13, and the significance level was set at 5%.
3. Results
In the period from October 2018 through to February 2021, a total of 1083 patients admitted to CMR were screened, 254 (23.54%) of whom were stroke patients (230 ischemic, 24 hemorrhagic). A total of 128 patients were not included because of not meeting inclusion criteria. The main reasons for exclusion were a low level of functional ambulation based on a FAC score of 0–1 (48; 37.5%), an age > 79 years (39; 30.5%), severe phatic impairment (13; 10.2%), comorbidities that could affect balance (10; 7.8%), recurrent stroke (9; 7%), nonadherence to participation (5; 4.0%), or an age < 40 years (4; 3.1%). This study included 102 patients with ischemic stroke. In total, 18 were lost during the follow-up period (eight individuals were non-adherent, five patients died, and five experienced a stroke recurrence). The remaining 84 patients were eligible for analyses, 42 of them men (50%) and with a median age of 68.5 years (IQR 62.3–73.5). In general, 32 (38.1%; 95% confidence interval (CI) 27.7–49.3) of the 84 patients had a fall or falls within 6 months after discharge. Table 1 presents the sociodemographic, clinical, and functional characteristics of all participants and the results of the comparison between non-fallers and fallers.

Table 1.
Demographic and clinical characteristics of the study participants (N = 84).
There were no statistically significant differences between the two groups in the sex ratio, the time from stroke to measurement, and the affected vascular territory, but they did differ significantly for age and clinical characteristics. The group of patients reporting falls had a significantly higher median age of 72.5 years (IQR 66.0–76.8) vs. 50 years (IQR 55.8–71.0) in the non-falling group; (p = 0.011), a cognitive deficit of a median 25 points (IQR 20–27) vs. 27 points (IQR 26–28) in the non-faller group; (p = 0.02), a reduced level of independence in activities of daily living with a median BI of 85 points (IQR 75–90) vs. 95 points (IQR 90–100); (p < 0.001), and a reduced walking ability with a median FAC of 3 (IQR 3–4) vs. 4 (IQR 3–5) in the non-faller group; (p < 0.001). Among the 32 patients who fell, the median FES-I was 36.5 points (IQR 27.0–43.8) vs. 25.5 (IQR 32.3–33.8) in the non-faller group; (p = 0.003), and a fear of falling was confirmed in 30 participants (93.8%) by direct questions, confirming a high fear of falling vs. 34 participants (65.4%) in the non-faller group. The results also indicated that people who fell had a significantly altered balance ability, as evidenced by a median SOT of 54 points (IQR 46.0–61.8) vs. 64 points (IQR 53.0–73.4); (p < 0.001) and a BBS median of 41 (IQR 31–47) vs. 45 (IQR 40.5–51.0) in the non-faller group; (p = 0.003).
Table 2 shows the optimal cut-off scores for SOT, BBS, and FES-I that discriminated between the non-faller and faller groups at discharge. An analysis of the optimal performance cut-off point for the fall risk scale yielded a cut-off of 60 for the SOT, with a sensitivity of 71.9%, a specificity of 65.4%, an AUC of 0.686, and an OR of 4.83. Two cut-off values of 35 and 42 were determined for BBS, with respective sensitivities of 43.8% and 56.3%, specificities of 88.5% and 67.3%, and AUC values of 0.661 and 0.618. For the FES-I, cut-off scores were established at 27 and 29 points, with respective sensitivities of 81.3% and 71.9%, specificities of 55.8% and 63.5%, and AUC values of 0.685 and 0.677. The results of the ROC curve analyses are presented in Figure 1.
Table 2.
The optimal cut-off scores for SOT, BBS, and FES-I using the Youden method.
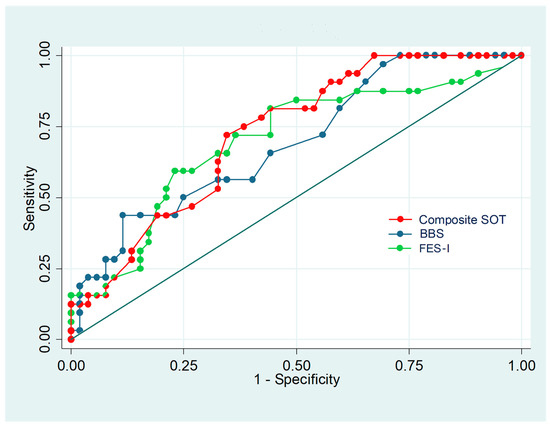
Figure 1.
Receiver operating characteristic curve analysis of the equilibrium score of the Sensory Organization Test (composite SOT), the Berg Balance Scale (BBS), and Falls Efficacy Scale–International (FES-I).
To complete the study, baseline predictive values were established for the combination of the instruments studied. Cut-offs with higher AUCs were always used.
(1) In the case of evaluation of the prediction of falls based on all three tools (at least one positive: SOT ≤ 60, BBS ≤ 35, FES-I ≥ 27), the highest sensitivity was found to be 96.9% (95% CI: 83.8–99.9%), but the lowest specificity was found to be 46.2% (95% CI: 32.2–60.5%), AUC = 0.715.
(2) Alternatively, the combination of BBS ≤ 35, FES-I ≥ 27 (at least one positive) was found to have a high sensitivity of 87.5% (95% CI: 71.0–96.5%) and a specificity of 53.8% (95% CI: 39.5–67.8%, AUC = 0.707.
4. Discussion
In the present study, we examined the validity of three balance tests to assess the risk of falls in patients after a stroke. The results of the ROC curve analysis showed that cut-off scores of 60 for SOT, 35 and 42 for BBS, and 27 and 29 for FES-I before discharge could be used to predict a decreased fall risk for ambulatory patients after a stroke. According to the ROC analysis AUC, the SOT showed the highest predictive capacity among the tools evaluated.
In our study, 38.2% of patients experienced at least one fall during the first 6 months after discharge from hospital care. These results are consistent with the findings of Samuelson et al., who reported a 23% incidence of falls within the first 3 months and a 40% incidence of falls within one year of stroke [45]. In addition, we find agreement in factors associated with the risk of falling, particularly a low postural control and a fear of falling [4,45]. Other studies report a fall incidence during the first 6 months ranging from 37% to 73%, while confirming a higher risk of falls in later stages after a stroke compared with people who did not experience stroke [6,25,46]. However, unlike our current work, which focused on patients with ambulation ability, these previous investigations did not take into account functional status or mobility, which may be related to fall risk [40]. Studies also are most often focused on community dwelling settings.
Age, cognitive impairment, a functional walking ability, a high fear of falling, and stability impairment as measured by instrumented posturography (SOT) and clinical BBS were significant predictors of falls in post-stroke patients after discharge from rehabilitation. However, 84 patients were from the same cohort of post-stroke patients who are more prone to falls than the healthy reference population [2]. The results may have been influenced by the small sample size and the large variance in values for age and clinical characteristics. It can be hypothesized that, compared to a healthy cohort of patients, the results could be different. Previous studies have documented that falls in poststroke individuals are not related to age, gender, or stroke location [24,46,47]. In our study, the age was a significant predictor of falls. In the faller group was a significantly higher median age of 72.5 vs. a median age of 50 in the non-faller group; the age may have influenced the studied clinical characteristics. A generally older age (over 65 years) is one of the main causes of impaired postural stability, gait, and cognitive function, as well as an increased self-reported fear of falling [8]. The clinical characteristics of both groups confirm postural instability, as demonstrated by a clinical test (BBS) and quantitative posturography (SOT), which are consistent with previous studies that compared the results with a relevant cohort (healthy, same age) [25,48,49]. In the non-faller versus the faller group, postural instability impairment was shown to a lesser extent, which may explain the level of functional categories of gait. Patients who did not suffer a fall had a higher level of ambulation and did not depend on another person for ambulation, reflecting their high level of self-sufficiency as evaluated by the BI. The opposite trend is observed in the faller group, which required the supervision of other people for ambulation and a greater need for the use of a walking aid, resulting in a hypothesized lower level of self-sufficiency. We find consistency with these findings and the relationships regarding impaired stability, gait, and their impact on self-sufficiency in patients after stroke in the studies previously referenced [24,41,50,51,52]. The score of cognitive impairment (MOCA) showed that the faller group had a reduced cognitive function versus the non-faller group. The influence of cognitive functions on stability and self-sufficiency was described in the mentioned studies [46,53,54].
We used dynamic posturography as an objective indicator of balance impairment through the SOT, expressed by the equilibrium score. Only a few studies have focused on using posturography to predict falls in specific at-risk groups. Older adults and patients with Parkinson’s disease and vestibular disorders are the most evaluated populations, and results are heterogeneous and inconsistent, without predictive variables [26,47]. General limitations may include retrospective evaluation, the inconsistent standardization of measurements, and the inappropriate selection of variables [27]. Here, we found that SOT scores were lower in the group with falls than in the group without falls, which is consistent with results of a study in adult patients that primarily assessed stability limits [48]. SOT limits of <38 have been reported in relation to vestibular etiologies; however, ROC values have shown an unsatisfactory sensitivity of 53% and a specificity of 87% [26]. A prospective study to determine a cut-off score that discriminates between patients who do and do not experience falls has not been performed, precluding the comparison of our findings with previous results. The main advantage of posturography is the possibility to objectivize postural stability even in patients with cognitive deficits, who are difficult to administer a questionnaire to (e.g., FES-I). From a practical point of view, posturography has economic disadvantages because it requires instrumentation. Nevertheless, given the current trend in technology development, the development of alternative devices that could be supported to perform on a similar principle. For clinical evaluation, we assessed the BBS, which is popular for its low demand in terms of equipment and administration work. However, the results of previous studies show heterogeneity and some important limitations with this tool. Lima et al. conducted a systematic review of BBS for making fall predictions in elderly adults. They were unable to perform a meta-analysis because of heterogeneity among studies, and based on insufficient evidence to support the use of BBS for falls prediction, they concluded that the instrument should not be used alone in older patients [21]. In contrast, in a meta-analysis of 33 articles, Kudlac et al. evaluated the predictive ability of falls BBS and found that it had excellent reliability and validity. They concluded that the BBS is reliable and valid for assessing balance and functional mobility in the post-stroke population; however, this tool should not be considered a strong predictor of fall risk in this patient group [49]. Park et al. conducted a meta-analysis of data from 21 studies describing the predictive validity of BBS for fall risk and reported a high statistical heterogeneity among them. Regarding the overall predictive validity of the BBS, they found a pooled sensitivity of 0.72, a specificity of 0.73, and an AUC of 0.84. In subgroup analyses, an age < 65 years, neuromuscular disease, two-plus falls, or a cut-off score of 45–49 were associated with better sensitivity with statistically less heterogeneity [30]. In our study, the BBS scores in the group without falls were very low compared with the group that experienced falls. Although statistical software has established two cut-off values based on the calculation of the Youden index, both provide low sensitivity but higher specificity, which is of little clinical use. The AUC value was the lowest compared to the other tools studied. However, it can be judged sufficiently discriminatory in the 0.6–0.7 interval [55,56], where otherwise all the tools studied fall.
We found a statistically significant fear of falls among those who experienced falls versus those who did not, which we confirmed by asking a direct yes/no question and using the FES-I questionnaire. The fear of falling was confirmed by direct questioning in the non-falling group by 34 patients (65.4%) compared to the faller group, where 30 individuals (93.8%) confirmed the fear, which was also evident from the FES-I, where patients in the faller group reported a high fear of falling. The FES-I questionnaire showed high sensitivity values and low specificity. The AUC values for the established cut-offs were similar to those of the SOT and can be assessed as indicating borderline low accuracy. In a study of patients with chronic stroke, Faria-Fortini et al. found a FES-I cut-off of 28 points for distinguishing those with falls from those without (AUC = 0.71; sensitivity = 71%; specificity = 57%; positive predictive value = 51%; negative predictive value = 74%) [32]. The main limitation of the FESI questionnaire is its use in people with a cognitive impairment; there is a risk of bias.
In this study, we determined the baseline predictive values for the combination of two or more tests using the cut-off point with the highest AUC. Prediction of the fall based on all tools (SOT, BBS, FES-I—at least one positive) increased sensitivity, but the results were not statistically significant compared to the results of SOT.
Our study has some limitations. First, the main limitation is the small sample size, which causes a large variance of values. Second, the study analyzed only 84 patients from the same identical cohort of stroke patients who were discharged from rehabilitation. Third, we did not include nonambulatory people and people with mild symptoms at discharge from acute unit hospital care. These features were determined based on inclusion criteria in the posturographic examination and on the assumption that nonambulant patients would have a low probability of falling. Third, we did not assess repeated falls for this study.
A strength of our study is the confirmation of the idea that impaired stability and a fear of falling precede falls. The results provide optimal cut-off scores for SOT, BBS, and FES-I in post-stroke patients, which may be useful in preventing falls, evaluating intervention effectiveness, and providing care through telemedicine.
5. Conclusions
SOT, BBS, and FES-I demonstrated a good discriminatory ability to classify post-stroke patients who were fallers from non-fallers. Of the tools evaluated, SOT showed the most promise in predicting falls. The results of our study support the recommendation to use multiple tools that assess static balance and dynamic balance, as well as functional tests and the consideration of fear of falls when predicting fall risk in patients after stroke. The accurate assessment of fall risk and the ability to maintain balance is important to understand the extent and type of balance deficit and provide effective customized preventive interventions. The results may be useful in designing fall prevention interventions for patients after stroke.
Author Contributions
Conceptualization, I.F. and E.M.; methodology, I.F. and E.M.; validation, M.Z., H.T.; formal analysis, software, data curation, visualization, H.T.; investigation, I.F. and M.Z.; resources, I.F.; writing—original draft preparation, I.F.; writing—review and editing, E.M. and M.Z.; supervision, E.M. All authors have read and agreed to the published version of the manuscript.
Funding
Partially supported by SGS08/LF/2019 the University of Ostrava.
Institutional Review Board Statement
The study was approved by the Ethics Committee of the University Hospital of Ostrava, reference number 773/2018.
Informed Consent Statement
Informed consent was obtained from all participants involved in the study.
Data Availability Statement
Data are available on request to the corresponding author.
Conflicts of Interest
The authors declare no conflict of interest.
References
- Pandian, J.D.; Gall, S.L.; Kate, M.P.; Silva, G.S.; Akinyemi, R.O.; Ovbiagele, B.I.; Lavados, P.M.; Gandhi, D.B.C.; Thrift, A.G. Prevention of stroke: A global perspective. Lancet 2018, 392, 1269–1278. [Google Scholar] [CrossRef]
- Weerdesteyn, V.; de Niet, M.; van Duijnhoven, H.J.R.; Geurts, A.C.H. Falls in individuals with stroke. J. Rehabil. Res. Dev. 2008, 45, 1195–1213. [Google Scholar] [CrossRef] [PubMed]
- Denissen, S.; Staring, W.; Kunkel, D.; Pickering, R.M.; Lennon, S.; Geurts, A.C.H.; Weerdesteyn, V.; Verheyden, G. Interventions for preventing falls in people after stroke. Cochrane Database Syst. Rev. 2019, 10, CD008728. [Google Scholar] [CrossRef] [PubMed] [Green Version]
- Samuelsson, C.M.; Hansson, P.O.; Persson, C.U. Early prediction of falls after stroke: A 12-month follow-up of 490 patients in the fall study of gothenburg (fallsgot). Clin. Rehabil. 2019, 33, 773–783. [Google Scholar] [CrossRef] [PubMed]
- Samuelsson, C.M.; Hansson, P.O.; Persson, C.U. Determinants of recurrent falls poststroke: A 1-year follow-up of the fall study of gothenburg. Arch. Phys. Med. Rehabil. 2020, 101, 1541–1548. [Google Scholar] [CrossRef]
- Batchelor, F.A.; Mackintosh, S.F.; Said, C.M.; Hill, K.D. Falls after stroke. Int. J. Stroke 2012, 7, 482–490. [Google Scholar] [CrossRef]
- Suzuki, T.; Sonoda, S.; Misawa, K.; Saitoh, E.; Shimizu, Y.; Kotake, T. Incidence and consequence of falls in inpatient rehabilitation of stroke patients. Exp. Aging Res. 2005, 31, 457–469. [Google Scholar] [CrossRef]
- Persson, C.U.; Hansson, P.-O. Determinants of falls after stroke based on data on 5065 patients from the swedish väststroke and riksstroke registers. Sci. Rep. 2021, 11, 24035. [Google Scholar] [CrossRef] [PubMed]
- Campbell, G.B.; Matthews, J.T. An integrative review of factors associated with falls during post-stroke rehabilitation. J. Nurs. Scholarsh. 2010, 42, 395–404. [Google Scholar] [CrossRef] [PubMed] [Green Version]
- Minet, L.R.; Peterson, E.; von Koch, L.; Ytterberg, C. Occurrence and predictors of falls in people with stroke six-year prospective study. Stroke 2015, 46, 2688–2690. [Google Scholar] [CrossRef]
- Goh, H.T.; Nadarajah, M.; Hamzah, N.B.; Varadan, P.; Tan, M.P. Falls and fear of falling after stroke: A case-control study. Pm&R 2016, 8, 1173–1180. [Google Scholar]
- Powers, W.J.; Rabinstein, A.A.; Ackerson, T.; Adeoye, O.M.; Bambakidis, N.C.; Becker, K.; Biller, J.; Brown, M.; Demaerschalk, B.M.; Hoh, B. Guidelines for the early management of patients with acute ischemic stroke: 2019 update to the 2018 guidelines for the early management of acute ischemic stroke: A guideline for healthcare professionals from the american heart association/american stroke association. Stroke 2019, 50, e344–e418. [Google Scholar] [PubMed]
- Norrving, B.; Barrick, J.; Davalos, A.; Dichgans, M.; Cordonnier, C.; Guekht, A.; Kutluk, K.; Mikulik, R.; Wardlaw, J.; Richard, E. Action plan for stroke in europe 2018–2030. Eur. Stroke J. 2018, 3, 309–336. [Google Scholar] [CrossRef] [PubMed] [Green Version]
- Oliveira, C.B.; Medeiros, Í.R.; Greters, M.G.; Frota, N.A.; Lucato, L.T.; Scaff, M.; Conforto, A.B. Abnormal sensory integration affects balance control in hemiparetic patients within the first year after stroke. Clinics 2011, 66, 2043–2048. [Google Scholar] [CrossRef] [PubMed] [Green Version]
- Middleton, A.; Braun, C.H.; Lewek, M.D.; Fritz, S.L. Balance impairment limits ability to increase walking speed in individuals with chronic stroke. Disabil. Rehabil. 2017, 39, 497–502. [Google Scholar] [CrossRef] [Green Version]
- de Oliveira, C.B.; de Medeiros, I.R.T.; Frota, N.A.F.; Greters, M.E.; Conforto, A.B. Balance control in hemiparetic stroke patients: Main tools for evaluation. J. Rehabil. Res. Dev. 2008, 45, 1215–1226. [Google Scholar] [CrossRef]
- Maeda, N.; Kato, J.; Shimada, T. Predicting the probability for fall incidence in stroke patients using the berg balance scale. J. Int. Med. Res. 2009, 37, 697–704. [Google Scholar] [CrossRef]
- Walsh, M.E.; Horgan, N.F.; Walsh, C.D.; Galvin, R. Systematic review of risk prediction models for falls after stroke. J. Epidemiol. Community Health 2016, 70, 513–519. [Google Scholar] [CrossRef]
- Ashburn, A.; Hyndman, D.; Pickering, R.; Yardley, L.; Harris, S. Predicting people with stroke at risk of falls. Age Ageing 2008, 37, 270–276. [Google Scholar] [CrossRef] [PubMed] [Green Version]
- Mackintosh, S.F.; Hill, K.D.; Dodd, K.J.; Goldie, P.A.; Culham, E.G. Balance score and a history of falls in hospital predict recurrent falls in the 6 months following stroke rehabilitation. Arch. Phys. Med. Rehabil. 2006, 87, 1583–1589. [Google Scholar] [CrossRef]
- Lima, C.A.; Ricci, N.A.; Nogueira, E.C.; Perracini, M.R. The berg balance scale as a clinical screening tool to predict fall risk in older adults: A systematic review. Physiotherapy 2018, 104, 383–394. [Google Scholar] [CrossRef] [PubMed]
- Park, S.-H.; Lee, Y.-S. The diagnostic accuracy of the berg balance scale in predicting falls. West. J. Nurs. Res. 2017, 39, 1502–1525. [Google Scholar] [CrossRef] [PubMed]
- Mancini, M.; Horak, F.B. The relevance of clinical balance assessment tools to differentiate balance deficits. Eur. J. Phys. Rehabil. Med. 2010, 46, 239–248. [Google Scholar] [PubMed]
- Sawacha, Z.; Carraro, E.; Contessa, P.; Guiotto, A.; Masiero, S.; Cobelli, C. Relationship between clinical and instrumental balance assessments in chronic post-stroke hemiparesis subjects. J. Neuroeng. Rehabil. 2013, 10, 95. [Google Scholar] [CrossRef] [PubMed] [Green Version]
- Lendraitiene, E.; Tamosauskaite, A.; Petruseviciene, D.; Savickas, R. Balance evaluation techniques and physical therapy in post-stroke patients: A literature review. Neurologia I Neurochirurgia Polska 2017, 51, 92–100. [Google Scholar] [CrossRef] [PubMed] [Green Version]
- Whitney, S.L.; Marchetti, G.F.; Schade, A.I. The relationship between falls history and computerized dynamic posturography in persons with balance and vestibular disorders. Arch. Phys. Med. Rehabil. 2006, 87, 402–407. [Google Scholar] [CrossRef]
- Chen, B.; Liu, P.; Xiao, F.; Liu, Z.; Wang, Y. Review of the upright balance assessment based on the force plate. Int. J. Environ. Res. Public Health 2021, 18, 2696. [Google Scholar] [CrossRef]
- Visser, J.E.; Carpenter, M.G.; van der Kooij, H.; Bloem, B.R. The clinical utility of posturography. Clin. Neurophysiol. 2008, 119, 2424–2436. [Google Scholar] [CrossRef]
- Schmid, A.A.; Acuff, M.; Doster, K.; Gwaltney-Duiser, A.; Whitaker, A.; Damush, T.; Williams, L.; Hendrie, H. Poststroke fear of falling in the hospital setting. Top. Stroke Rehabil. 2009, 16, 357–366. [Google Scholar] [CrossRef]
- Park, S.; Cho, O.-H. Fear of falling and related factors during everyday activities in patients with chronic stroke. Appl. Nurs. Res. 2021, 62, 151492. [Google Scholar] [CrossRef]
- Thilarajah, S.; Mentiplay, B.F.; Bower, K.J.; Tan, D.; Pua, Y.H.; Williams, G.; Koh, G.; Clark, R.A. Factors associated with post-stroke physical activity: A systematic review and meta-analysis. Arch. Phys. Med. Rehabil. 2018, 99, 1876–1889. [Google Scholar] [CrossRef] [PubMed]
- Faria-Fortini, I.; Polese, J.C.; Faria, C.D.C.M.; Scianni, A.A.; Nascimento, L.R.; Teixeira-Salmela, L.F. Fall efficacy scale–international cut-off score discriminates fallers and non-fallers individuals who have had stroke. J. Bodyw. Mov. Ther. 2021, 26, 167–173. [Google Scholar] [CrossRef] [PubMed]
- von Elm, E.; Altman, D.G.; Egger, M.; Pocock, S.J.; Gøtzsche, P.C.; Vandenbroucke, J.P. The strengthening the reporting of observational studies in epidemiology (strobe) statement: Guidelines for reporting observational studies. Int. J. Surg. 2014, 12, 1495–1499. [Google Scholar] [CrossRef] [Green Version]
- Bartos, A.; Orlikova, H.; Raisova, M.; Ripova, D. Czech training version of the montreal cognitive assessment (moca-cz1) for early identification of alzheimer disease. Cesk. Slov. Neurol. Neurochir. 2014, 77, 587–595. [Google Scholar]
- Munthe-Kaas, R.; Aam, S.; Saltvedt, I.; Wyller, T.B.; Pendlebury, S.T.; Lydersen, S.; Ihle-Hansen, H. Test accuracy of the montreal cognitive assessment in screening for early poststroke neurocognitive disorder the nor-coast study. Stroke 2021, 52, 317–320. [Google Scholar] [CrossRef] [PubMed]
- Marvin, K.; Zelter, L. Barthel Index (bi); Canadian Partnership for Stroke Recovery: Ottawa, ON, Canada, 2015. [Google Scholar]
- Mehrholz, J.; Wagner, K.; Rutte, K.; Meiβner, D.; Pohl, M. Predictive validity and responsiveness of the functional ambulation category in hemiparetic patients after stroke. Arch. Phys. Med. Rehabil. 2007, 88, 1314–1319. [Google Scholar] [CrossRef]
- Borah, D.; Wadhwa, S.; Singh, U.; Yadav, S.L.; Bhattacharjee, M.; Sindhu, V. Age related changes in postural stability. Indian J. Physiol. Pharmacol. 2007, 51, 395–404. [Google Scholar] [PubMed]
- International, N. Balance Manager Systems: Instructions for Use; Natus Medical Incorporated: Clackamas, OR, USA, 2013. [Google Scholar]
- Wei, W.E.; De Silva, D.A.; Chang, H.M.; Yao, J.; Matchar, D.B.; Young, S.H.Y.; See, S.J.; Lim, G.H.; Wong, T.H.; Venketasubramanian, N. Post-stroke patients with moderate function have the greatest risk of falls: A national cohort study. BMC Geriatr. 2019, 19, 373. [Google Scholar] [CrossRef] [PubMed] [Green Version]
- Schinkel-Ivy, A.; Wong, J.S.; Mansfield, A. Balance confidence is related to features of balance and gait in individuals with chronic stroke. J. Stroke Cerebrovasc. Dis. 2017, 26, 237–245. [Google Scholar] [CrossRef] [Green Version]
- Reguli, Z.; Svobodová, L. Česká verze diagnostiky strachu z pádů u seniorů–fes-i (falls efficacy scale international)[czech version of the diagnosis of fear of falls in seniors—fes-i (falls efficacy scale international)]. Studia Sport. 2011, 5, 5–12. [Google Scholar] [CrossRef]
- Yardley, L.; Beyer, N.; Hauer, K.; Kempen, G.; Piot-Ziegler, C.; Todd, C. Development and initial validation of the falls efficacy scale-international (fes-i). Age Ageing 2005, 34, 614–619. [Google Scholar] [CrossRef] [PubMed] [Green Version]
- Verheyden, G.; Weerdesteyn, V.; Pickering, R.M.; Kunkel, D.; Lennon, S.; Geurts, A.C.H.; Ashburn, A. Interventions for preventing falls in people after stroke. Cochrane Database Syst. Rev. 2013, 45, CD008728. [Google Scholar] [CrossRef] [PubMed] [Green Version]
- Laren, A.; Odqvist, A.; Hansson, P.O.; Persson, C.U. Fear of falling in acute stroke: The fall study of gothenburg (fallsgot). Top. Stroke Rehabil. 2018, 25, 256–260. [Google Scholar] [CrossRef] [PubMed]
- Wong, J.S.; Brooks, D.; Inness, E.L.; Mansfield, A. The impact of falls on motor and cognitive recovery after discharge from in-patient stroke rehabilitation. J. Stroke Cerebrovasc. Dis. 2016, 25, 1613–1621. [Google Scholar] [CrossRef] [PubMed] [Green Version]
- Piirtola, M.; Era, P. Force platform measurements as predictors of falls among older people—A review. Gerontology 2006, 52, 1–16. [Google Scholar] [CrossRef] [PubMed]
- Faraldo-Garcia, A.; Santos-Perez, S.; Rossi-Izquierdo, M.; Lirola-Delgado, A.; Vaamonde-Sanchez-Andrade, I.; del-Rio-Valeiras, M.; Soto-Varela, A. Posturographic limits of stability can predict the increased risk of falls in elderly patients with instability? Acta Oto-Laryngol. 2016, 136, 1125–1129. [Google Scholar] [CrossRef]
- Kudlac, M.; Sabol, J.; Kaiser, K.; Kane, C.; Phillips, R.S. Reliability and validity of the berg balance scale in the stroke population: A systematic review. Phys. Occup. Ther. Geriatr. 2019, 37, 196–221. [Google Scholar] [CrossRef]
- Halmi, Z.; Stone, T.W.; Dinya, E.; Málly, J. Postural instability years after stroke. J. Stroke Cerebrovasc. Dis. Off. J. Natl. Stroke Assoc. 2020, 29, 105038. [Google Scholar] [CrossRef]
- Zahl, S.; Mahir, L.; Lmidmani, F.; Elfatimi, A. Postural balance and fall risk after stroke in patients alive at home. Cerebrovasc. Dis. 2017, 43, 127–130. [Google Scholar]
- Liao, W.-L.; Chang, C.-W.; Sung, P.-Y.; Hsu, W.-N.; Lai, M.-W.; Tsai, S.-W. The berg balance scale at admission can predict community ambulation at discharge in patients with stroke. Medicina 2021, 57, 556. [Google Scholar] [CrossRef]
- Yu, H.-x.; Wang, Z.-x.; Liu, C.-b.; Dai, P.; Lan, Y.; Xu, G.-q. Effect of cognitive function on balance and posture control after stroke. Neural. Plast. 2021, 2021, 6636999. [Google Scholar] [CrossRef]
- Saverino, A.; Waller, D.; Rantell, K.; Parry, R.; Moriarty, A.; Playford, E.D. The role of cognitive factors in predicting balance and fall risk in a neuro-rehabilitation setting. PLoS ONE 2016, 11, e0153469. [Google Scholar] [CrossRef] [Green Version]
- Hanley, J.A.; McNeil, B.J. The meaning and use of the area under a receiver operating characteristic (roc) curve. Radiology 1982, 143, 29–36. [Google Scholar] [CrossRef] [PubMed] [Green Version]
- Dušek, L.; Pavlík, T.; Jarkovský, J.; Koptíková, J.; Analýza dat v Neurologii xxv. Hodnocení Diagnostických Testů–Senzitivita a Specificita. 2011. Available online: https://is.muni.cz/publication/960965/cs (accessed on 1 June 2022).
Publisher’s Note: MDPI stays neutral with regard to jurisdictional claims in published maps and institutional affiliations. |
© 2022 by the authors. Licensee MDPI, Basel, Switzerland. This article is an open access article distributed under the terms and conditions of the Creative Commons Attribution (CC BY) license (https://creativecommons.org/licenses/by/4.0/).