
Does Optimization of Industrial Structure Improve Green Efficiency of Industrial Land Use in China?


Abstract
:1. Introduction
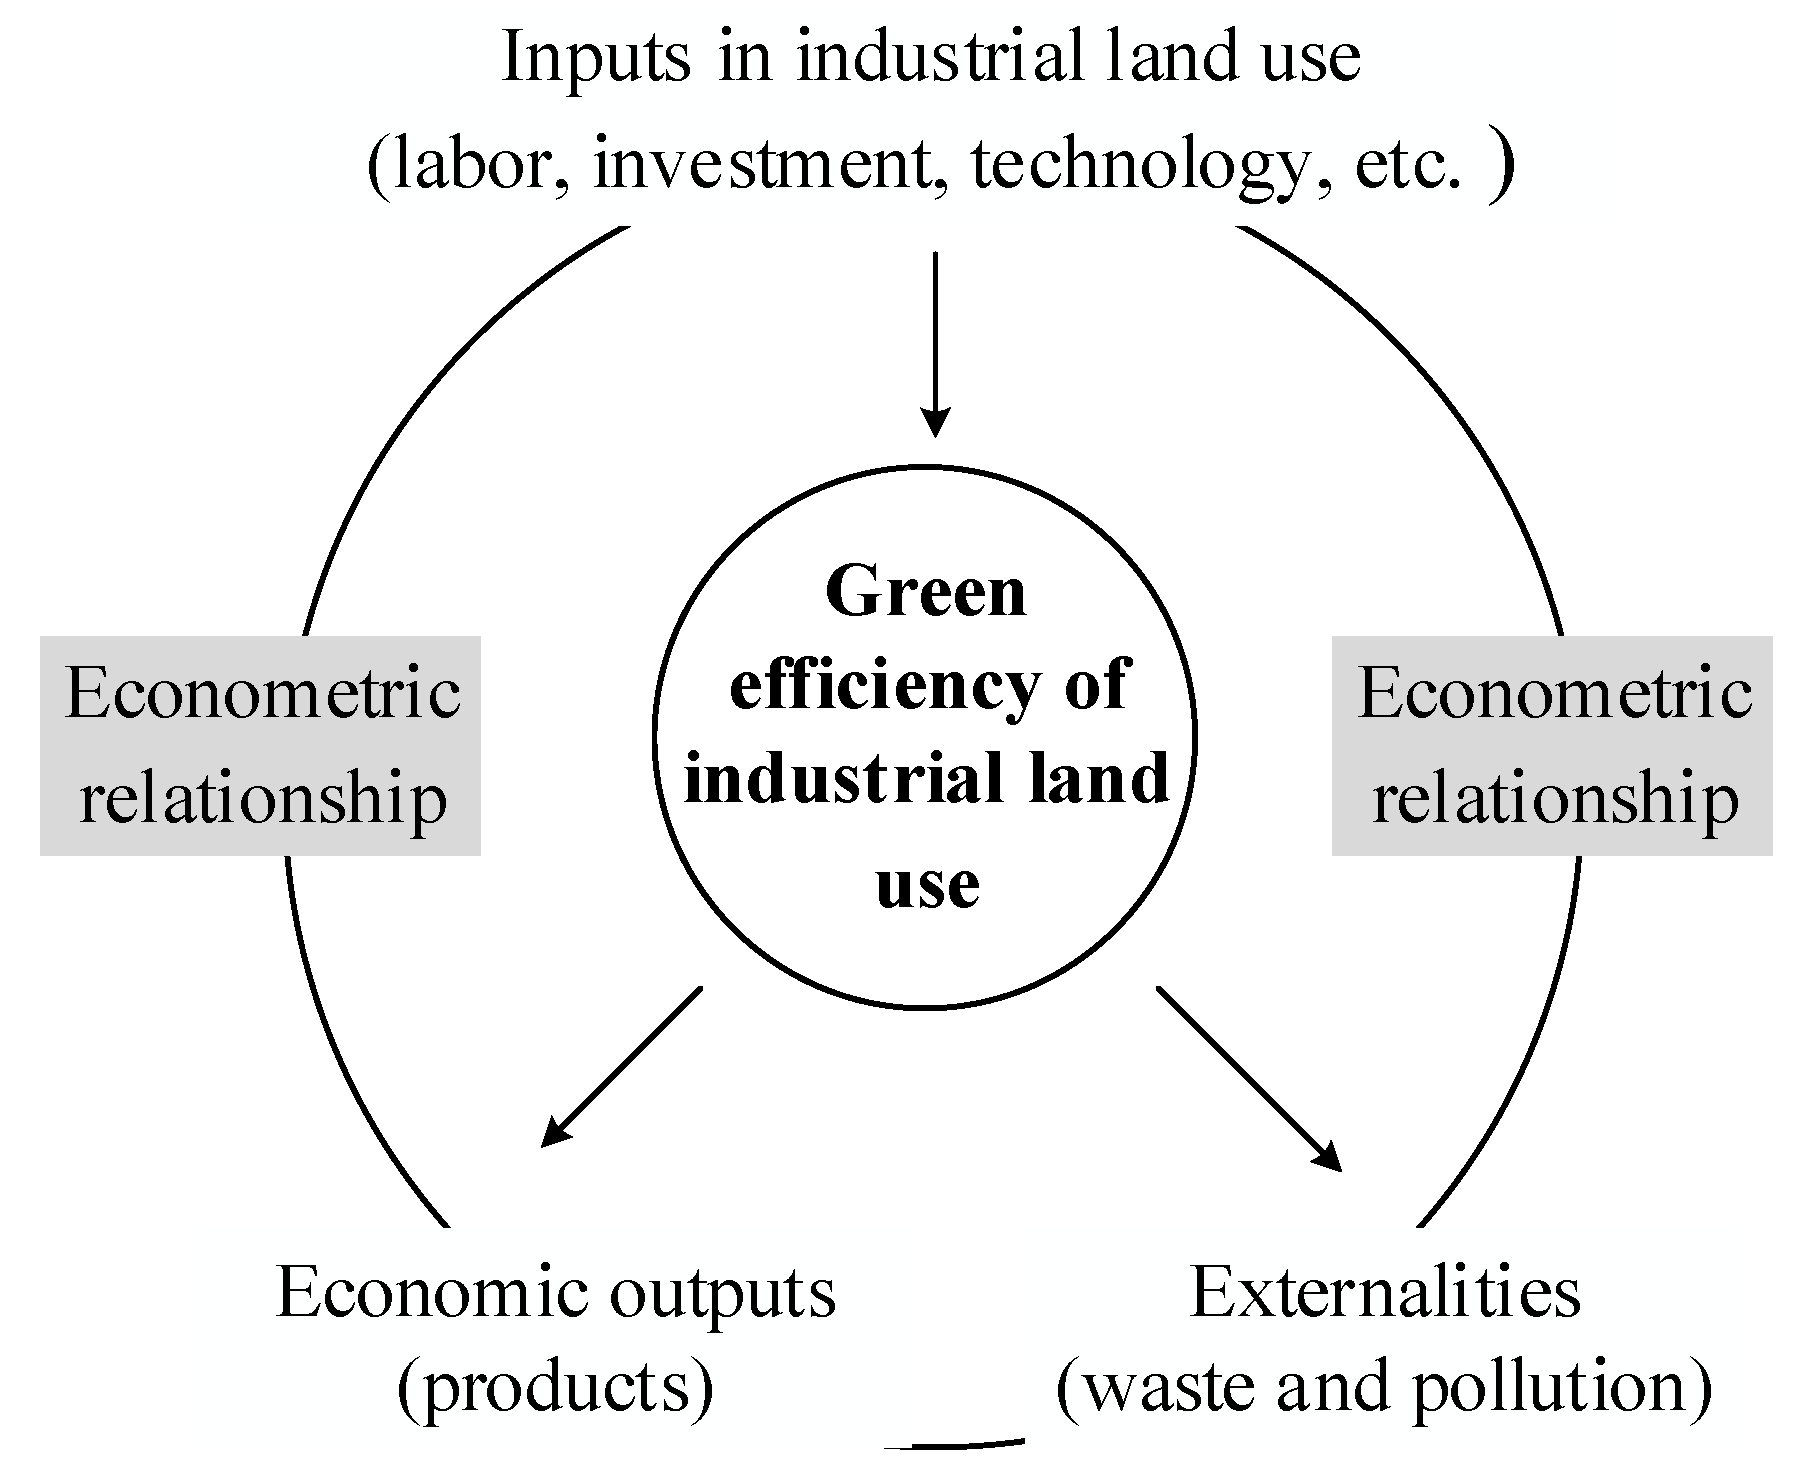
2. Analytical Framework of the Effect Mechanisms
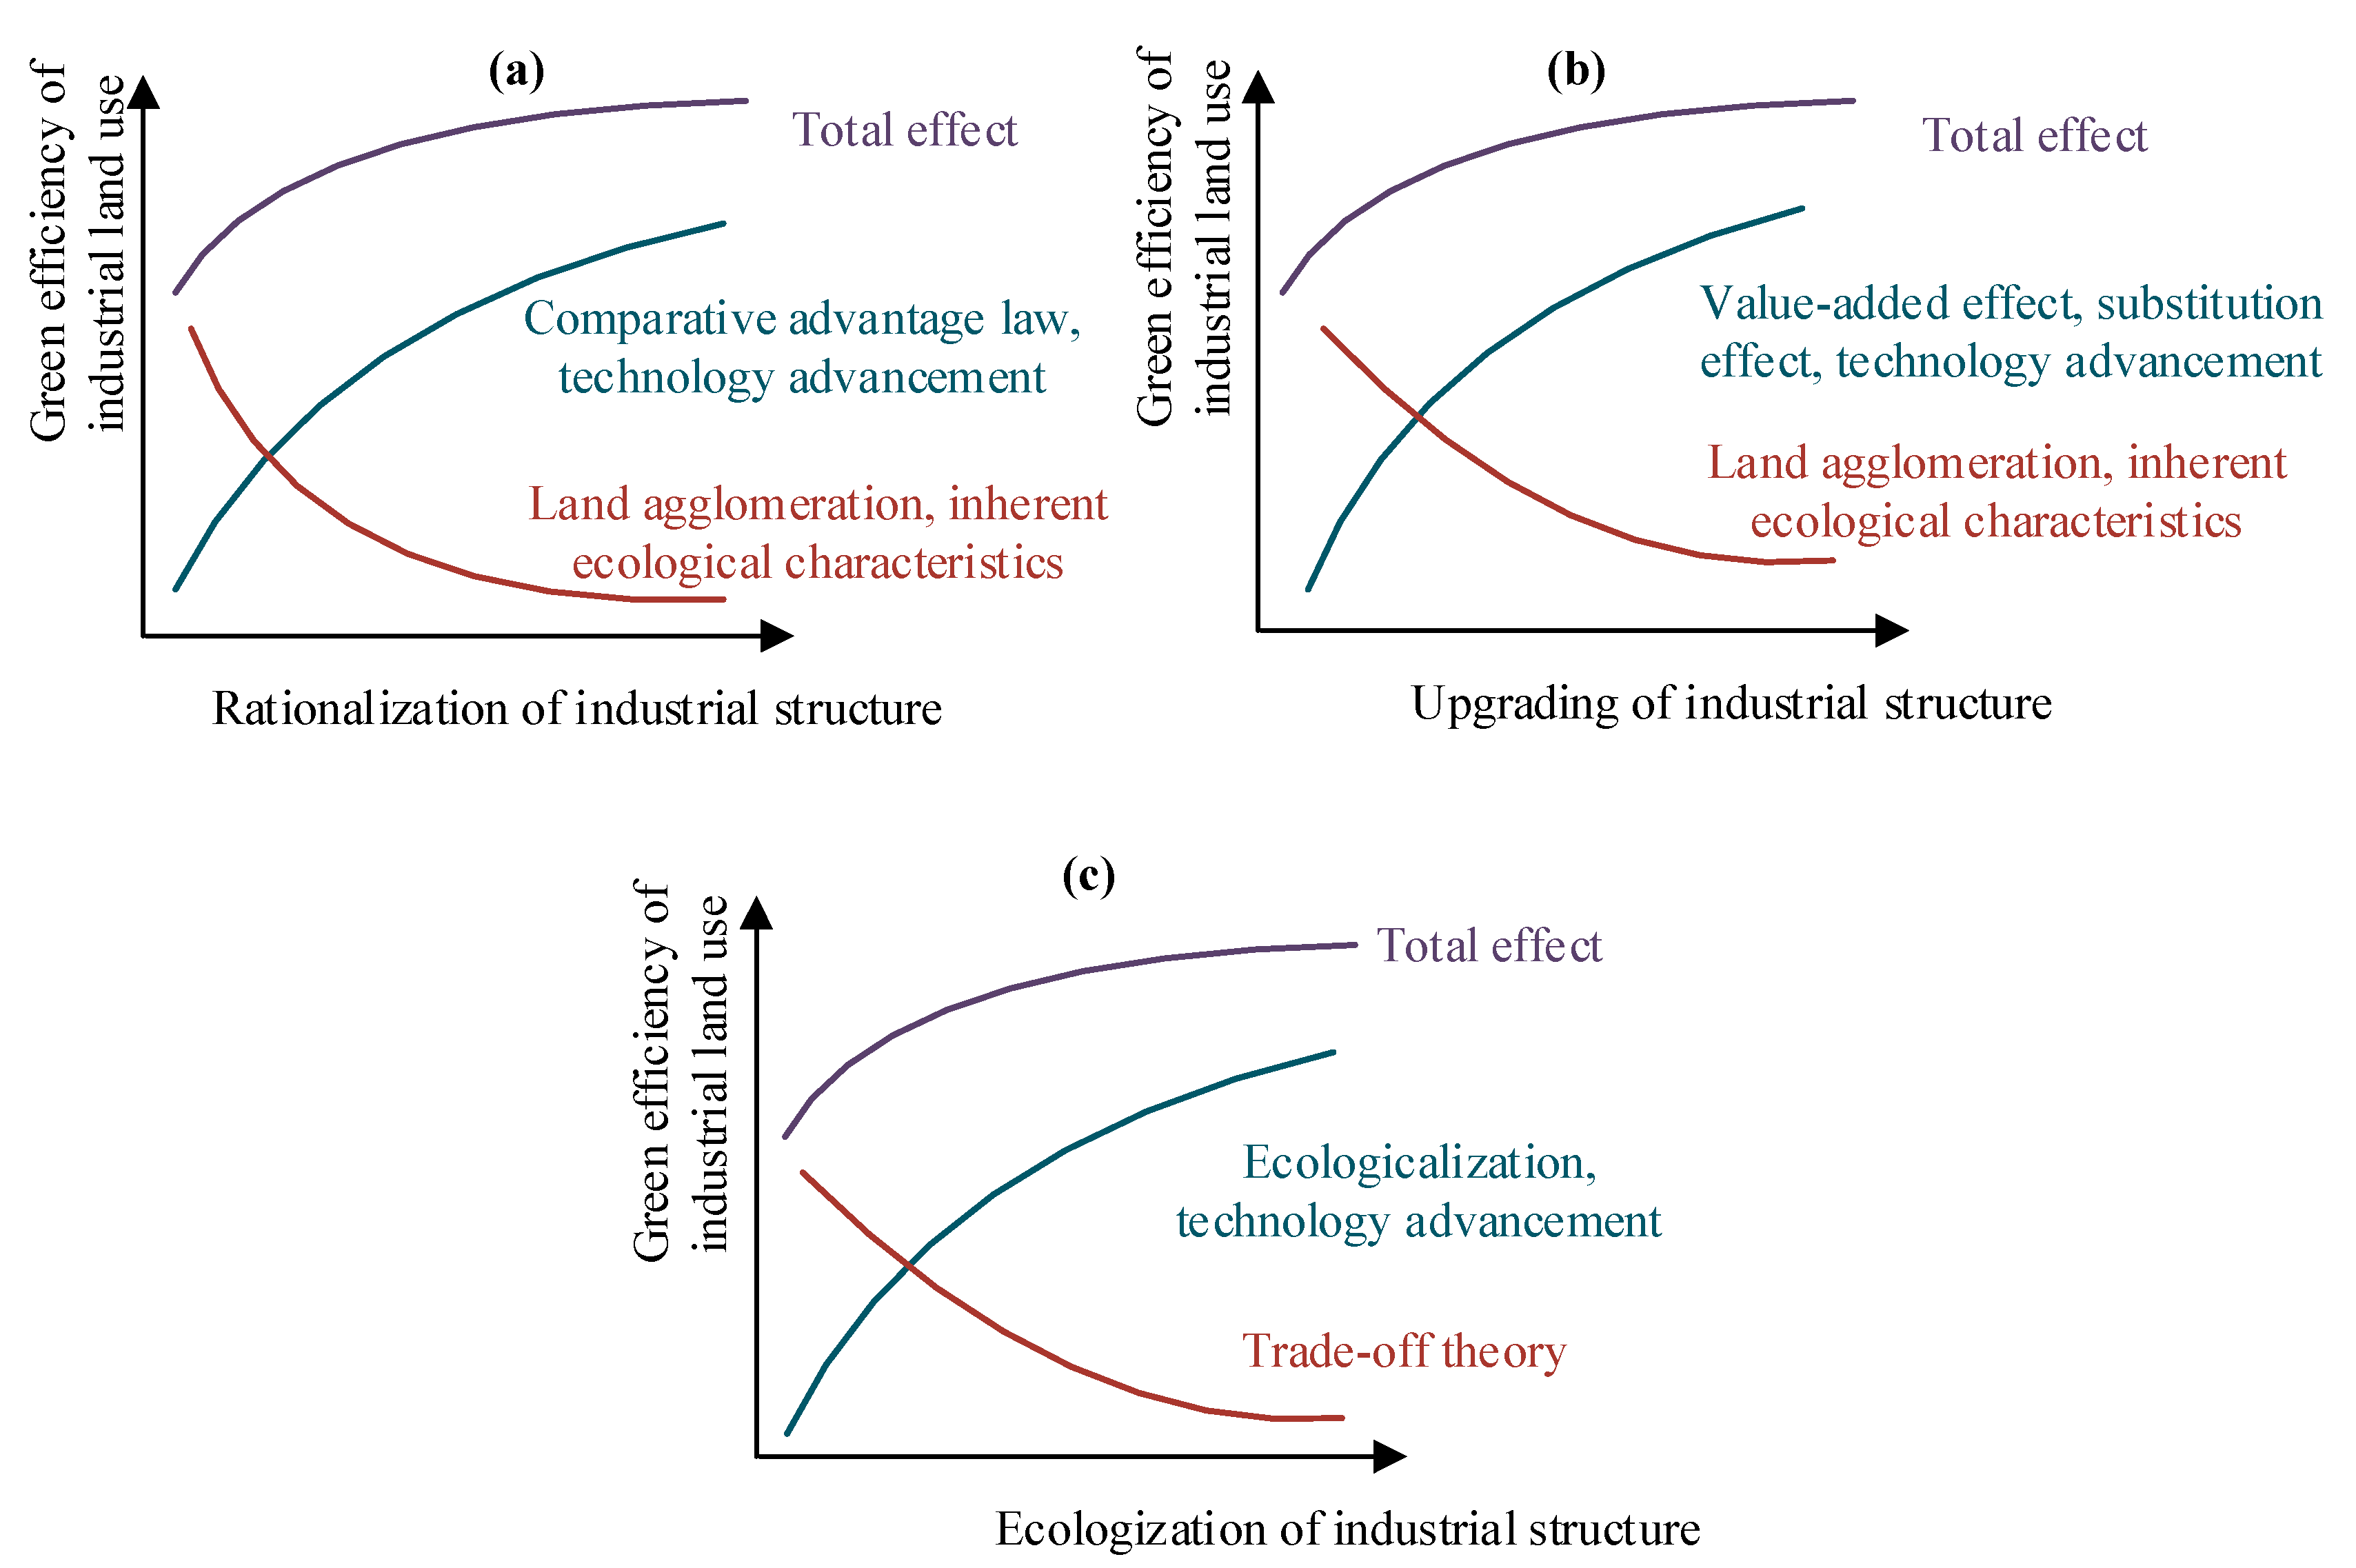
2.1. Rationalization of Industrial Structure
2.2. Upgrading of Industrial Structure
2.3. Ecologization of Industrial Structure
3. Methods and Data
3.1. Method for Measuring the Green Efficiency of Industrial Land Use
3.2. Variables for Evaluating the Industrial Structure
3.2.1. Rationalization of Industrial Structure
3.2.2. Upgrading of Industrial Structure
3.2.3. Ecologization of Industrial Structure
3.3. Method for Measuring the Spatial Effects
3.4. Data Source
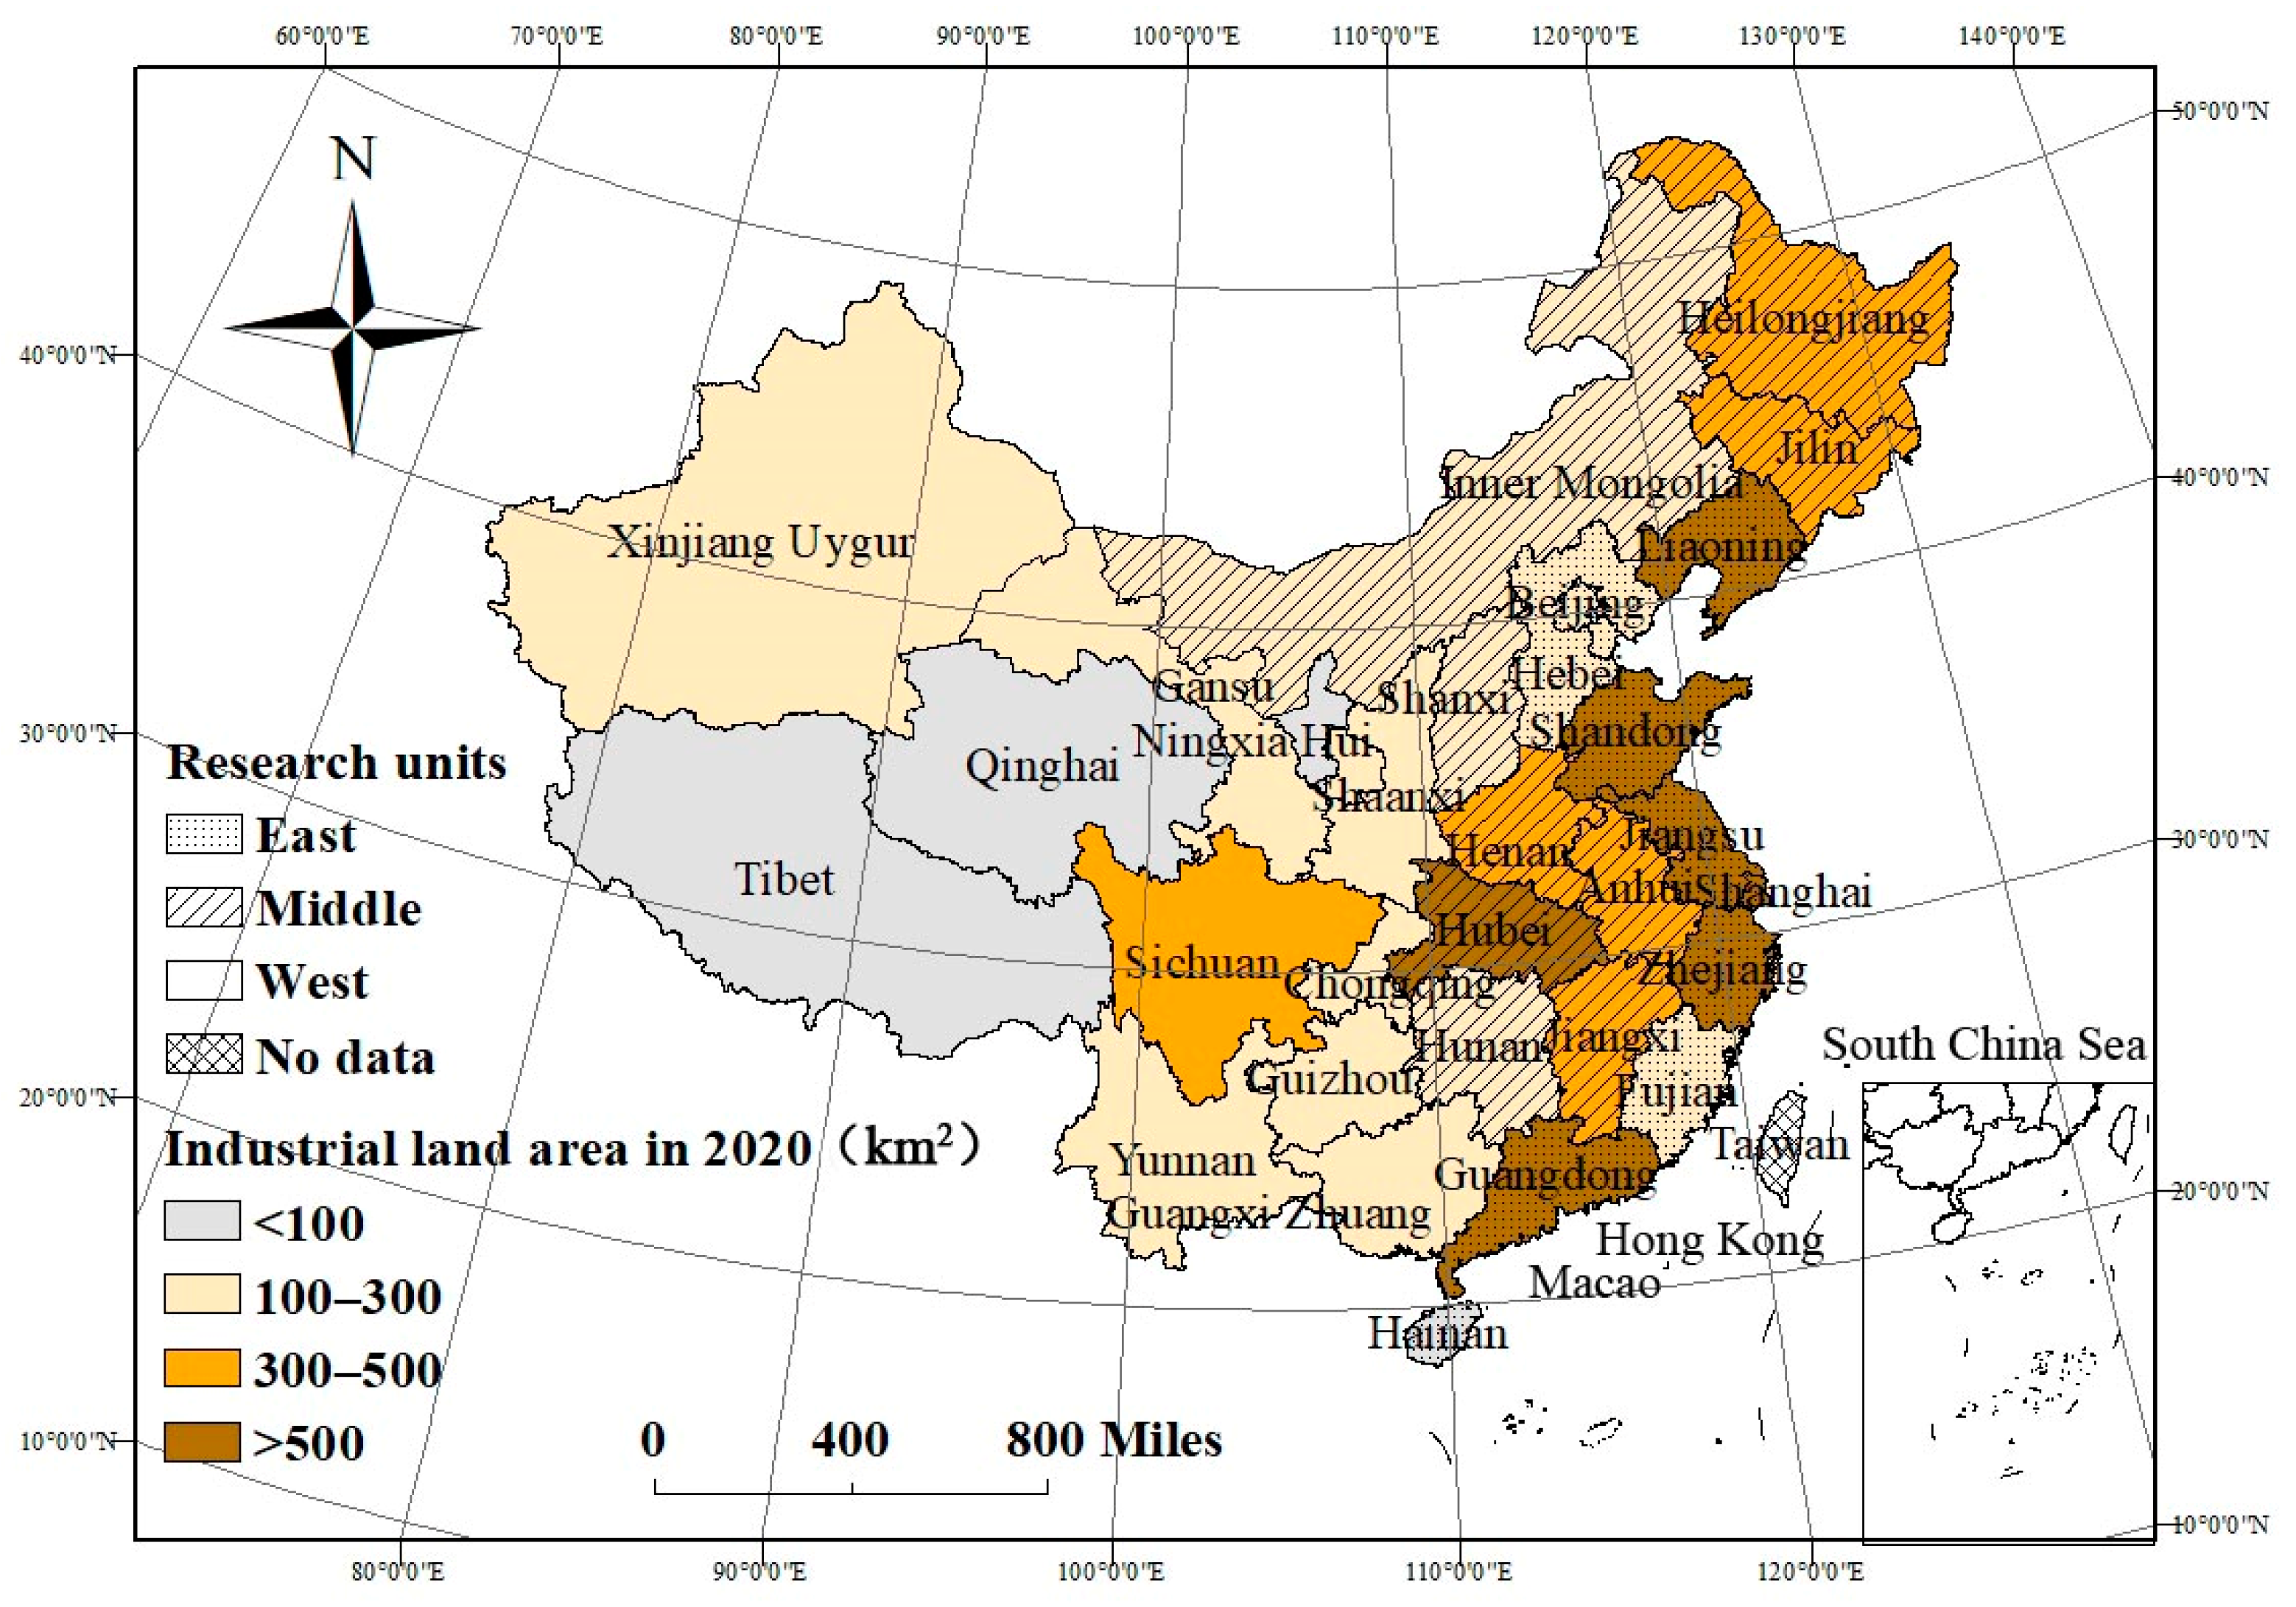
3.4.1. Study Area
3.4.2. Data and Processing
4. Results and Discussions
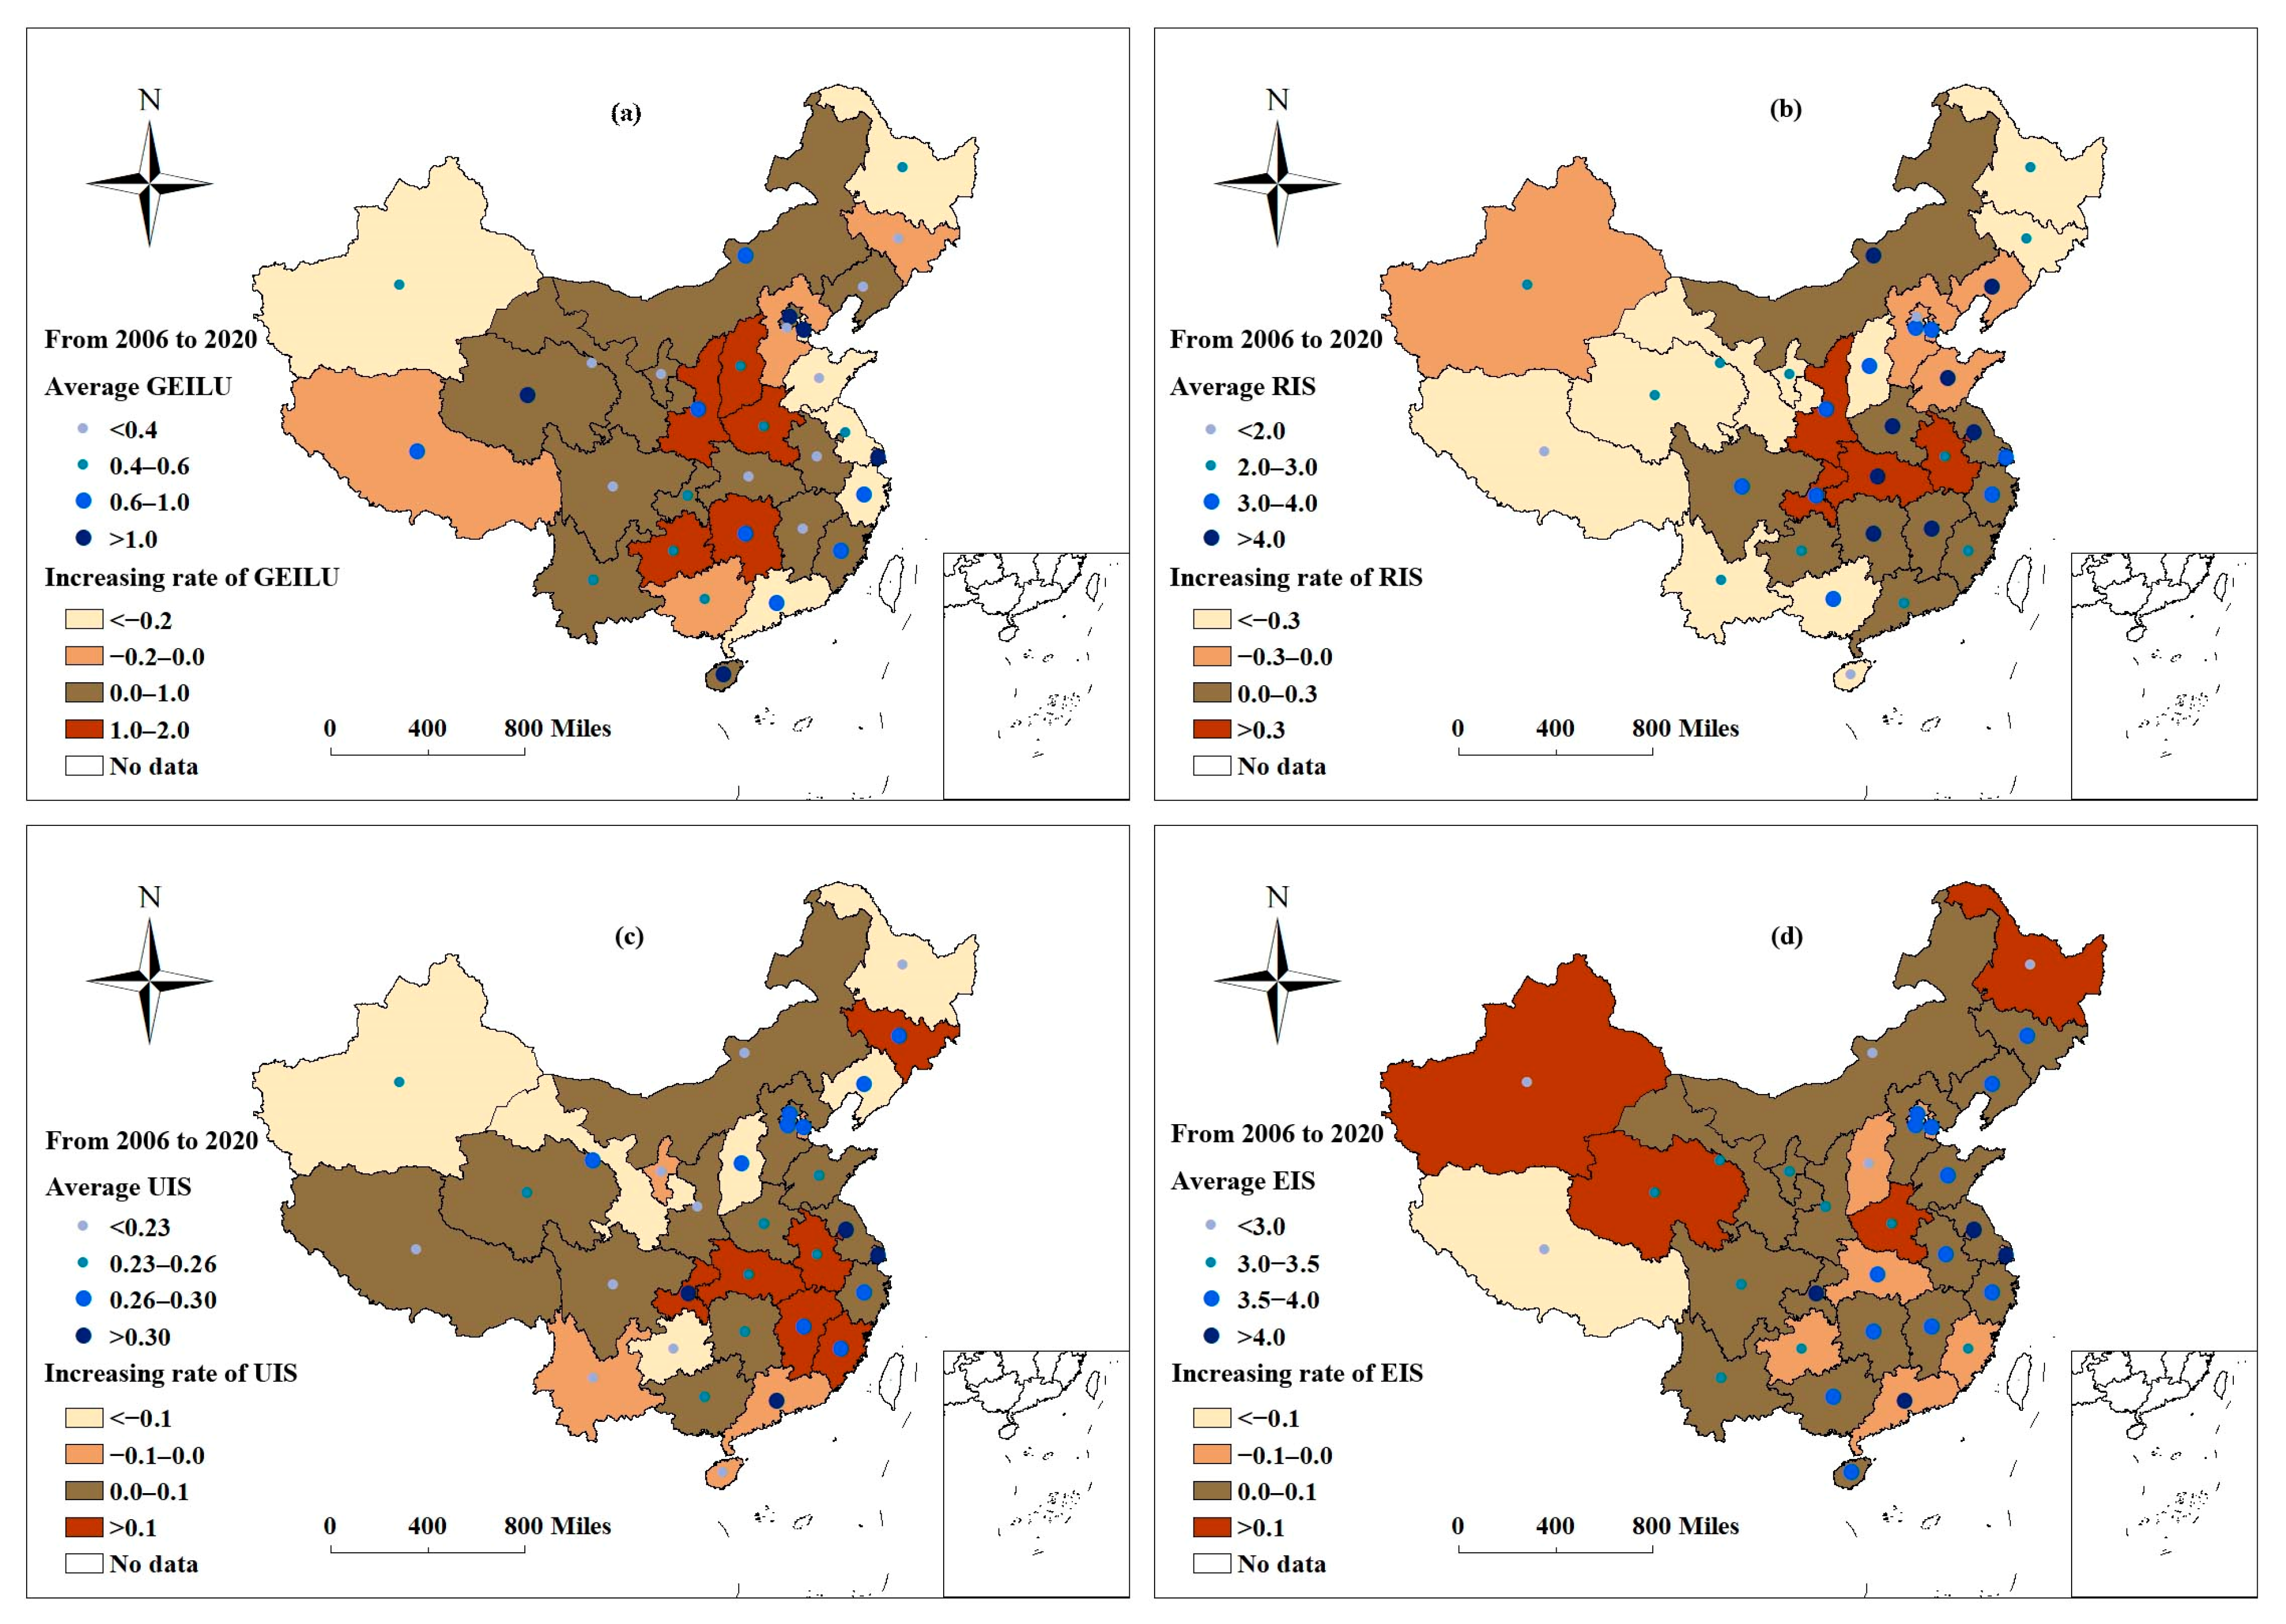
4.1. Analysis of the Green Efficiency of Industrial Land Use
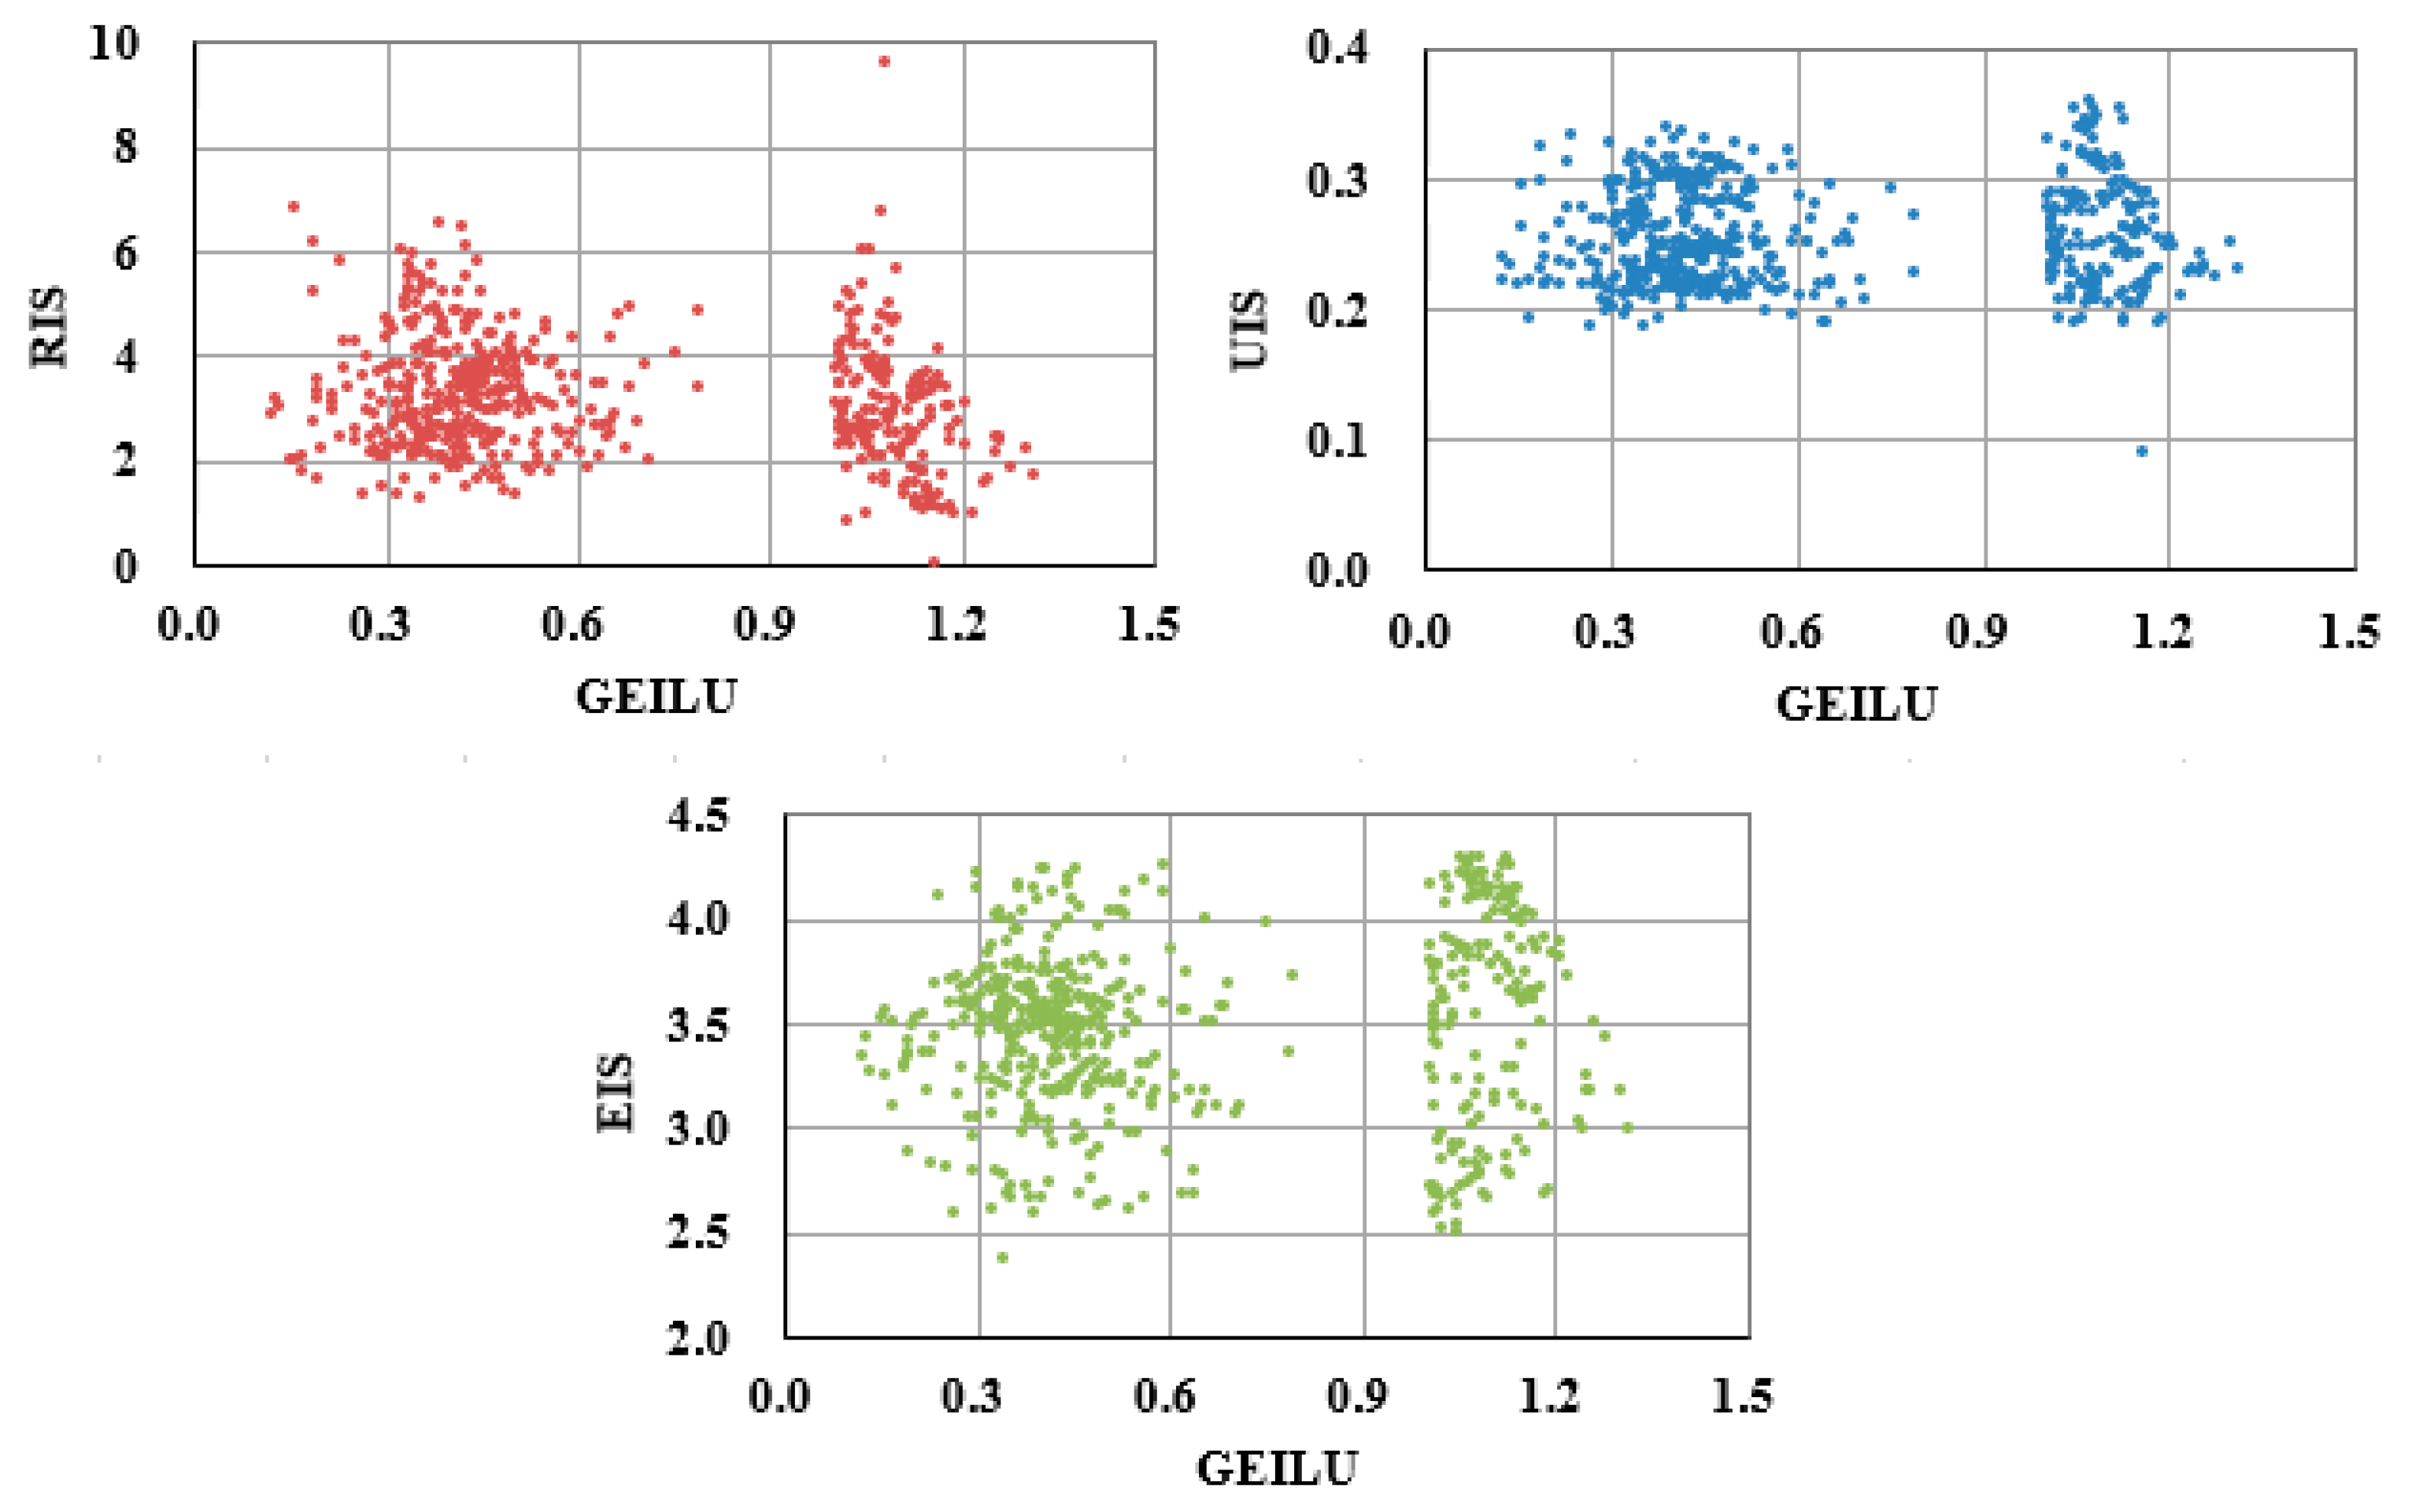
4.2. Analysis of Industrial Structure
4.3. Analysis of the Spatial Effects
4.3.1. Estimation Results
4.3.2. Robust Test of the Estimation Results
- (1)
- Re-evaluation of GEILU. We calculated the GEILU using the super-SBM model under the restriction that the variable returned to scale and then captured the effects of RIS, UIS, and EIS on GEILU, leaving the other conditions unchanged. The estimation results are shown in Table 2 as model (2).
- (2)
- Transformation of spatial weight matrix. We replaced the spatial adjacent weight matrix with an inverse-distance space weight matrix and then captured the effects of RIS, UIS, and EIS on GEILU, leaving the other conditions unchanged. The estimation results are shown in Table 2 as model (3).
4.3.3. Analysis of the Integration Results of the Three Variables
4.4. Analysis of Threshold Effect
5. Conclusions
- (1)
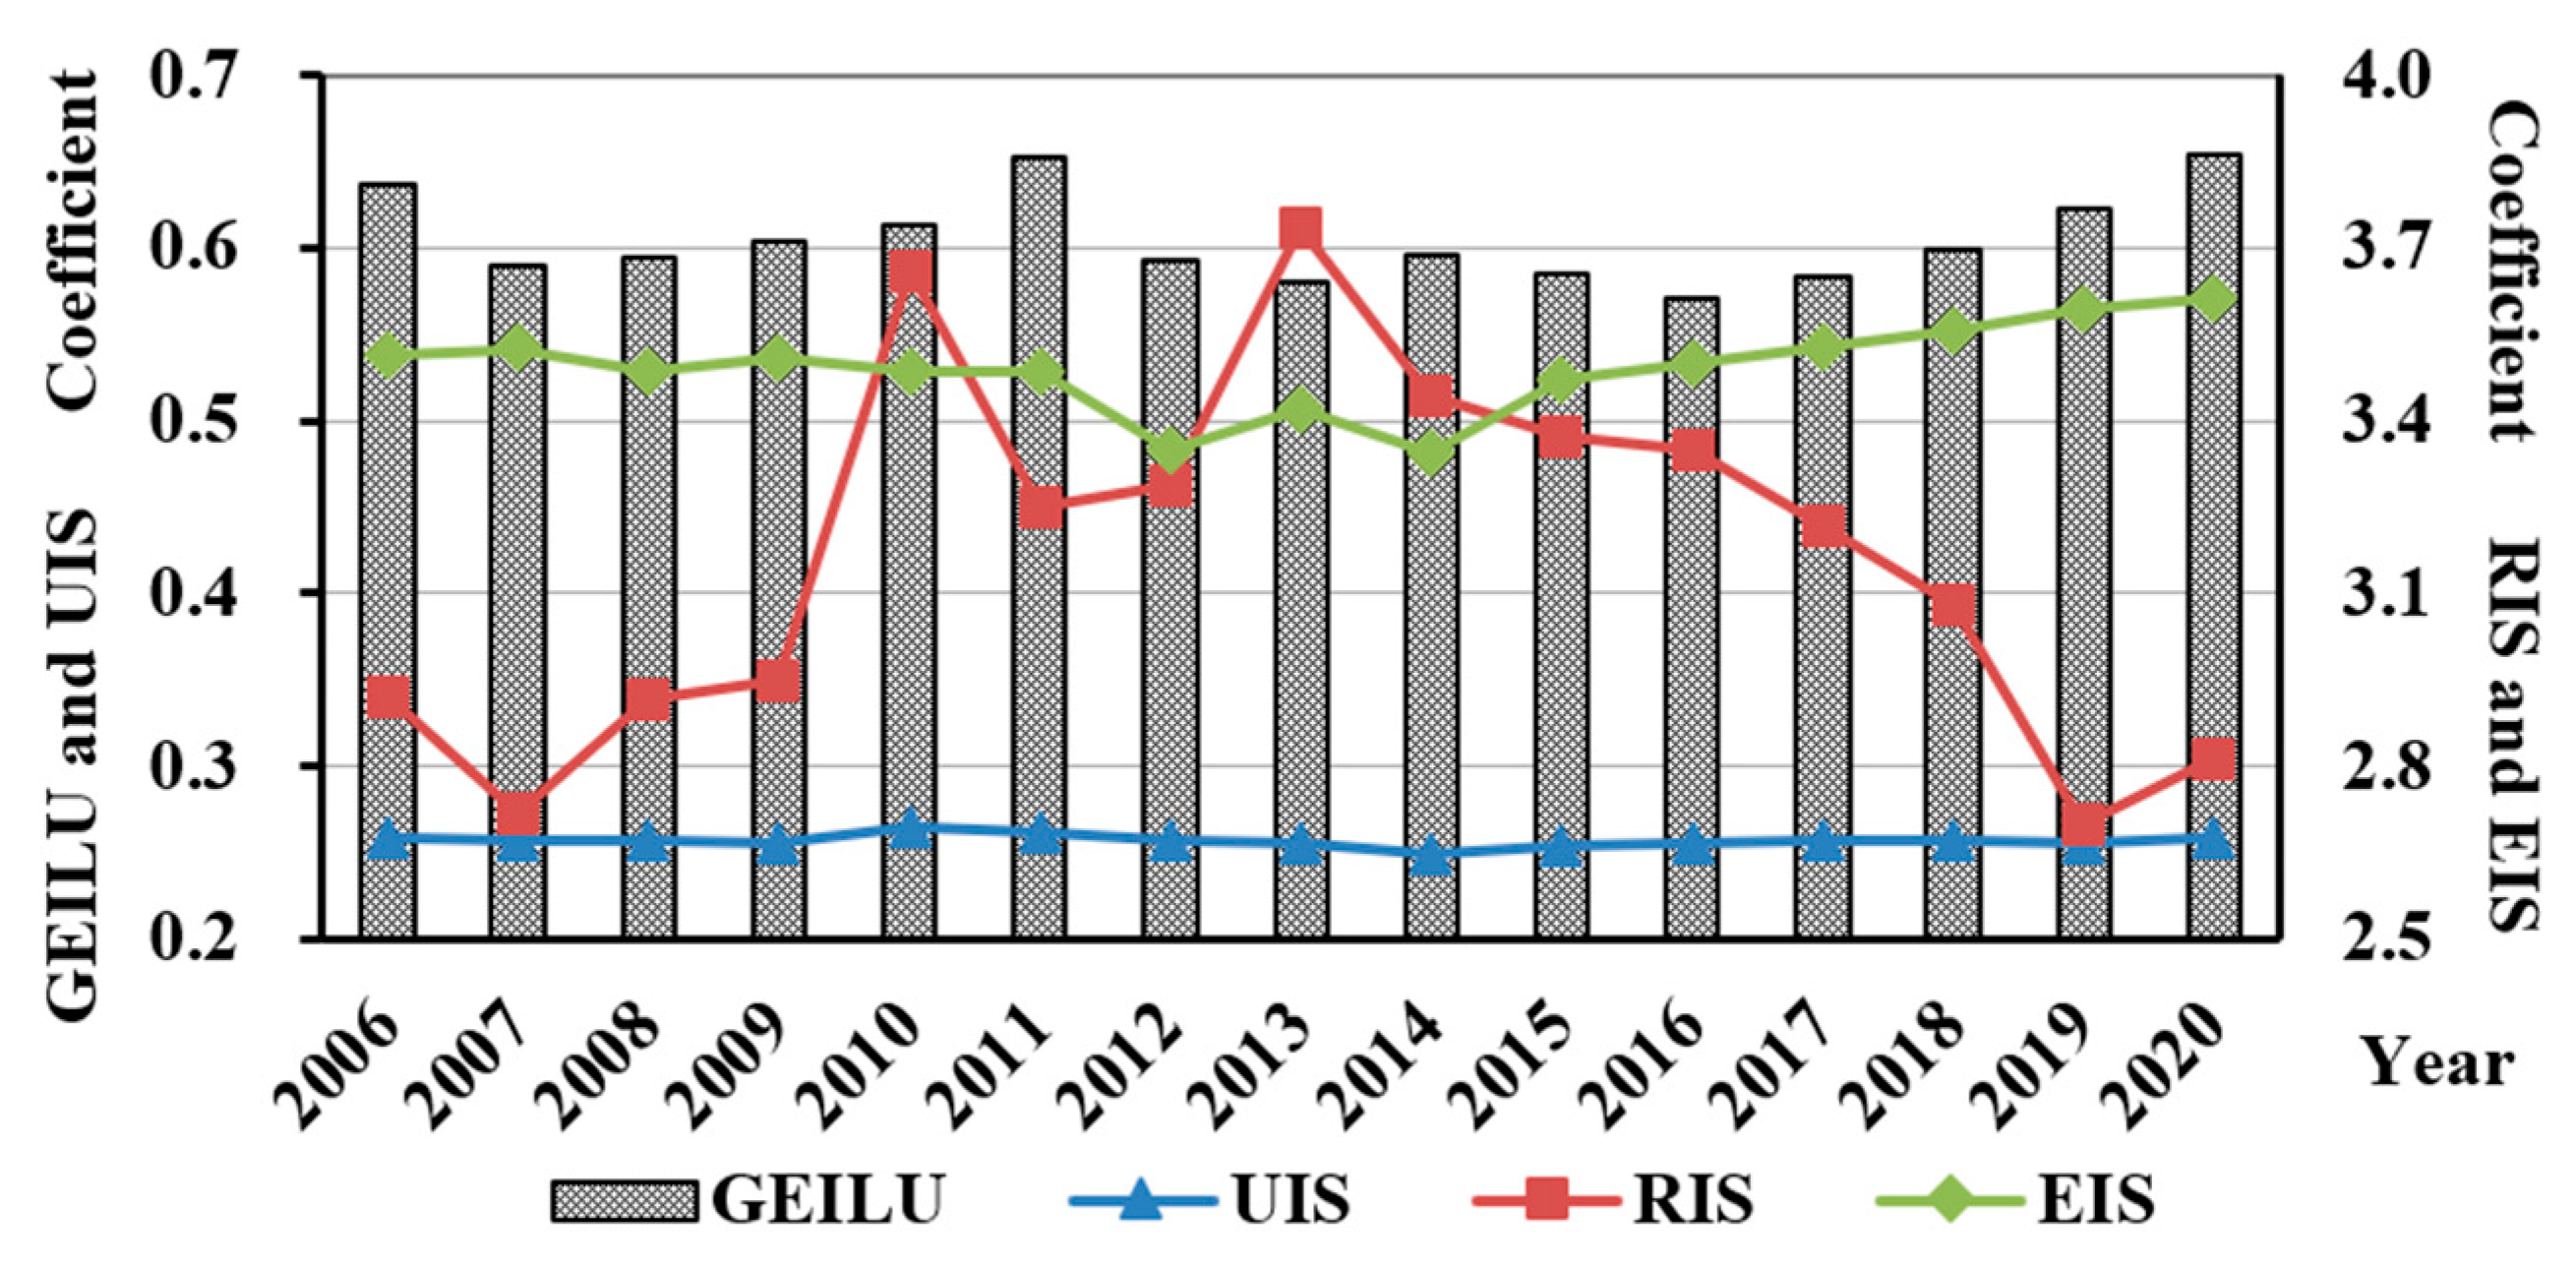
- On the national scale, the GEILU showed fluctuating change from 2006 to 2020 and kept increasing after 2016. The eastern provinces presented relatively higher GEILU, but the middle provinces showed significant improvement. There was almost no change in the UIS; however, the RIS and EIS changed in a positive U shape and an inverted U shape, respectively. The apexes of the U shape were both correlated to around 2013.
- (2)
- The regression results of SDM showed that, from a global perspective, the RIS contributed to the improvement of GEILU and that there was a positive spatial effect. The UIS had an inhibiting effect on GEILU but had no obvious spatial effect. The EIS had an inhibiting effect on GEILU, and there was a negative spatial effect. When integrating the three variables, OIS did not contribute to the improvement of GEILU but presented significantly negative effects. The negative effects stemmed from an inefficient expansion of industrial land and pollution from heavy chemical industries. However, the cooperation with adjacent provinces improved GEILU to a certain extent.
- (3)
- From a phased perspective, the effects of OIS on GEILU had double-threshold characteristics. When the increase of GDP per capita exceeded the thresholds, the effects of RIS and EIS on GEILU changed from negative to positive, and the negative effect of UIS gradually eased and became insignificant. It was speculated that in the early period of this study, the outdated technology in traditional industries brought about the negative effects of OIS on GEILU; however, with industrial and economic development, high-knowledge and high-tech industries created a market scale, and the negative effects gradually shifted into positive or insignificant.
- (4)
- In order to improve the GEILU, provinces with traditional industrial structures should bolster intensive land use and eco-environmental control; however, provinces with rapid development of emerging industries should support the development of high-knowledge and high-tech industries through creating and implementing more flexible land supply policies. Moreover, eliminating the market segmentation between provinces can also help improve GEILU.
Author Contributions
Funding
Institutional Review Board Statement
Informed Consent Statement
Data Availability Statement
Conflicts of Interest
References
- Chen, C.; Sun, Y.; Lan, Q.; Jiang, F. Impacts of industrial agglomeration on pollution and ecological efficiency-A spatial econometric analysis based on a big panel dataset of China’s 259 cities. J. Clean. Prod. 2020, 258, 120721. [Google Scholar] [CrossRef]
- Needham, B.; Louw, E.; Metzemakers, P. An economic theory for industrial land policy. Land Use Policy 2013, 33, 227–234. [Google Scholar] [CrossRef]
- Hudalah, D.; Viantari, D.; Firman, T.; Woltjer, J. Industrial Land Development and Manufacturing Deconcentration in Greater Jakarta. Urban Geogr. 2013, 34, 950–971. [Google Scholar] [CrossRef]
- Talaei, A.; Gemechu, E.; Kumar, A. Key factors affecting greenhouse gas emissions in the Canadian industrial sector: A decomposition analysis. J. Clean. Prod. 2020, 246, 119026. [Google Scholar] [CrossRef]
- Xie, H.; Chen, Q.; Lu, F.; Wu, Q.; Wang, W. Spatial-temporal disparities, saving potential and influential factors of industrial land use efficiency: A case study in urban agglomeration in the middle reaches of the Yangtze River. Land Use Policy 2018, 75, 518–529. [Google Scholar] [CrossRef]
- Meng, F.; Guo, J.; Guo, Z.; Lee, J.C.; Liu, G.; Wang, N. Urban ecological transition: The practice of ecological civilization construction in China. Sci. Total Environ. 2020, 755, 142633. [Google Scholar] [CrossRef]
- Luo, J.; Wu, Y.; Choguill, C.L.; Zhang, X. A study on promoting the intensive use of industrial land in China through governance: A game theoretical approach. J. Urban Manag. 2022; in press. [Google Scholar] [CrossRef]
- Jiao, L.; Xu, Z.; Xu, G.; Zhao, R.; Liu, J.; Wang, W. Assessment of urban land use efficiency in China: A perspective of scaling law. Habitat Int. 2020, 99, 102172. [Google Scholar] [CrossRef]
- Wang, Z.; Chen, J.; Zheng, W.; Deng, X. Dynamics of land use efficiency with ecological intercorrelation in regional development. Landsc. Urban Plan. 2017, 177, 303–316. [Google Scholar] [CrossRef]
- Desli, E.; Gkoulgkoutsika, A.; Sdrolia, E.; Zarotiadis, G. Eco-efficiency: A methodological framework and assessment. Clean. Environ. Syst. 2021, 3, 100049. [Google Scholar] [CrossRef]
- Zhao, Z.; Bai, Y.; Wang, G.; Chen, J.; Yu, J.; Liu, W. Land eco-efficiency for new-type urbanization in the Beijing-Tianjin-Hebei Region. Technol. Forecast. Soc. Chang. 2018, 137, 19–26. [Google Scholar] [CrossRef]
- Park, J.-I.; Kim, J.-O. Does industrial land sprawl matter in land productivity? A case study of industrial parks of South Korea. J. Clean. Prod. 2021, 334, 130209. [Google Scholar] [CrossRef]
- Ahmad, M.; Wu, Y. Natural resources, technological progress, and ecological efficiency: Does financial deepening matter for G-20 economies? Resour. Policy 2022, 77, 102770. [Google Scholar] [CrossRef]
- Yan, S.; Peng, J.; Wu, Q. Exploring the non-linear effects of city size on urban industrial land use efficiency: A spatial econometric analysis of cities in eastern China. Land Use Policy 2020, 99, 104944. [Google Scholar] [CrossRef]
- Sun, Y.; Ma, A.; Su, H.; Su, S.; Chen, F.; Wang, W.; Weng, M. Does the establishment of development zones really improve industrial land use efficiency? Implications for China’s high-quality development policy. Land Use Policy 2020, 90, 104265. [Google Scholar] [CrossRef]
- Zhu, J. The impact of industrial land use policy on industrial change. Land Use Policy 2000, 17, 21–28. [Google Scholar] [CrossRef]
- Li, Q.; Wang, Y.; Chen, W.; Li, M.; Fang, X. Does improvement of industrial land use efficiency reduce PM2.5 pollution? Evidence from a spatiotemporal analysis of China. Ecol. Indic. 2021, 132, 108333. [Google Scholar] [CrossRef]
- Ilieș, D.; Marcu, F.; Caciora, T.; Indrie, L.; Ilieș, A.; Albu, A.; Costea, M.; Burtă, L.; Baias, Ș.; Ilieș, M.; et al. Investigations of Museum Indoor Microclimate and Air Quality. Case Study from Romania. Atmosphere 2021, 12, 286. [Google Scholar] [CrossRef]
- Huang, H.; Li, Y.; Wang, Z. Spatio-temporal changes of eco-efficiency and influencing factors of industrial land use at the provincial level of China. Acta Ecol. Sin. 2020, 40, 100–111. [Google Scholar] [CrossRef]
- Deng, X.; Gibson, J. Improving eco-efficiency for the sustainable agricultural production: A case study in Shandong, China. Technol. Forecast. Soc. Chang. 2019, 144, 394–400. [Google Scholar] [CrossRef]
- Jin, X.; Li, X.; Feng, Z.; Wu, J.; Wu, K. Linking ecological efficiency and the economic agglomeration of China based on the ecological footprint and nighttime light data. Ecol. Indic. 2020, 111, 106035. [Google Scholar] [CrossRef]
- Abel, T.; White, J.; Clauson, S. Risky Business: Sustainability and Industrial Land Use across Seattle’s Gentrifying Riskscape. Sustainability 2015, 7, 15718–15753. [Google Scholar] [CrossRef] [Green Version]
- He, H.; Peng, C. The spatial-temporal evolution and the interactive effect between urban industrial structure transformation and land use efficiency. Geogr. Res. 2017, 36, 1271–1282. [Google Scholar] [CrossRef]
- Liu, J.; Hou, X.; Wang, Z.; Shen, Y. Study the effect of industrial structure optimization on urban land-use efficiency in China. Land Use Policy 2021, 105, 105390. [Google Scholar] [CrossRef]
- Yasmeen, H.; Tan, Q.; Zameer, H.; Tan, J.; Nawaz, K. Exploring the impact of technological innovation, environmental regulations and urbanization on ecological efficiency of China in the context of COP21. J. Environ. Manag. 2020, 274, 111210. [Google Scholar] [CrossRef]
- Dong, Y.; Jin, G.; Deng, X. Dynamic interactive effects of urban land-use efficiency, industrial transformation, and carbon emissions. J. Clean. Prod. 2020, 270, 122547. [Google Scholar] [CrossRef]
- Tu, F.; Yu, X.; Ruan, J. Industrial land use efficiency under government intervention: Evidence from Hangzhou, China. Habitat Int. 2014, 43, 1–10. [Google Scholar] [CrossRef]
- Wu, K.; You, K.; Ren, H.; Gan, L. The impact of industrial agglomeration on ecological efficiency: An empirical analysis based on 244 Chinese cities. Environ. Impact Assess. Rev. 2022, 96, 106841. [Google Scholar] [CrossRef]
- Caldarelli, C.; Gilio, L. Expansion of the sugarcane industry and its effects on land use in São Paulo: Analysis from 2000 through 2015. Land Use Policy 2018, 76, 264–274. [Google Scholar] [CrossRef]
- Yang, Y.; Jiang, G.; Zheng, Q.; Zhou, D.; Li, Y. Does the land use structure change conform to the evolution law of industrial structure? An empirical study of Anhui Province, China. Land Use Policy 2019, 81, 657–667. [Google Scholar] [CrossRef]
- Zhang, W.; Wu, Q.; Wang, B.; Huang, J. Multidimensional study of specialized agglomeration and diversified agglomeration on urban land use efficiency. China Popul. Resour. Environ. 2019, 29, 100–110. [Google Scholar] [CrossRef]
- Yu, B.; Su, Y. Research on the Impact of Industrial Structure Adjustment on Land Use Efficiency and Spillover Effect: An Empirical Analysis Based on PSDM Model and PTR Model. China Land Sci. 2020, 34, 57–66. [Google Scholar] [CrossRef]
- Lv, M.; Chen, W. The study on the impact of industrial structure upgrading on energy efficiency in China based on the data from 1978 to 2013. Resour. Sci. 2016, 38, 1350–1362. [Google Scholar] [CrossRef]
- Sun, W.; Chen, Z.; Wang, D. Can Land Marketization Help Reduce Industrial Pollution? Int. J. Environ. Res. Public Health 2019, 16, 2213. [Google Scholar] [CrossRef] [Green Version]
- Jin, B.; Lu, T.; Deng, Z. Transformation and Upgrading of China’s Industrial Structure: Process, Issues and Trends. China Ind. Econ. 2011, 2, 5–15. [Google Scholar] [CrossRef]
- Shi, D.; Li, P. Quality Evolution and Assessment of China’s Industry over the Past Seven Decades. China Ind. Econ. 2019, 9, 5–23. [Google Scholar] [CrossRef]
- Zheng, X.; Geng, B.; Wu, X.; Lv, L.; Hu, Y. Performance Evaluation of Industrial Land Policy in China. Sustainability 2014, 6, 4823–4838. [Google Scholar] [CrossRef] [Green Version]
- Tang, M.; Li, Z.; Hu, F.; Wu, B. How does land urbanization promote urban eco-efficiency? The mediating effect of industrial structure advancement. J. Clean. Prod. 2020, 272, 122798. [Google Scholar] [CrossRef]
- Mwambo, F.M.; Fürst Martius, C.; Jimenez-Martinez, M.; Ny Arko, B.K.; Borgemeister, C. Combined application of the em-dea and ex-act approaches for integrated assessment of resource use efficiency, sustainability and carbon footprint of smallholder maize production practices in sub-saharan africa-sciencedirect. J. Clean. Prod. 2021, 302, 126132. [Google Scholar] [CrossRef]
- Khezrimotlagh, D.; Zhu, J.; Cook, W.D.; Toloo, M. Data envelopment analysis and big data. Eur. J. Oper. Res. 2019, 274, 1047–1054. [Google Scholar] [CrossRef]
- Charnes, A.; Cooper, W.W.; Rhodes, E. Measuring the efficiency of decision making units. Eur. J. Oper. Res. 1978, 2, 429–444. [Google Scholar] [CrossRef]
- Tone, K. A slacks-based measure of efficiency in data envelopment analysis. Eur. J. Oper. Res. 2001, 130, 498–509. [Google Scholar] [CrossRef] [Green Version]
- Tone, K. A slacks-based measure of super-efficiency in data envelopment analysis. Eur. J. Oper. Res. 2002, 143, 32–41. [Google Scholar] [CrossRef] [Green Version]
- Lesage, J.; Peng, R.K. Introduction to Spatial Econometrics; CRC Press: Boca Raton, FL, USA, 2009; pp. 11–85. [Google Scholar]
- Groenewold, N.; Lee, G.; Chen, A. Inter-regional spillovers in China: The importance of common shocks and the definition of the regions. China Econ. Rev. 2008, 19, 32–52. [Google Scholar] [CrossRef] [Green Version]
- Yang, X.; Lu, X.; Shen, W. Spatial Spillover Effect of Land Element Input on Urban Economic Growth in China. Econ. Geogr. 2020, 40, 83–90. [Google Scholar] [CrossRef]
- Zhong, S. Biased Technological Progress Impact on Manufacturing Employment Growth. West Forum 2015, 25, 62–69. [Google Scholar] [CrossRef]
- Hansen, B.E. Threshold Effects in Non-dynamic Panels: Estimation, Testing, and Inference. J. Econom. 1999, 93, 345–368. [Google Scholar] [CrossRef] [Green Version]

| Statistical Categories | Statistical Subcategories | Refreshed Categories |
|---|---|---|
| Mining | Coal mining and dressing; oil and gas mining; ferrous metals mining and dressing; non-ferrous metals mining and dressing; non-metallic ore mining and dressing; professional and auxiliary activities; other. | Resource-intensive industries |
| Manufacturing | Agricultural food processing; food manufacturing; beverage manufacturing; tobacco manufacturing; textiles; leather, fur, feather, and their products; wood processing and related products; furniture manufacturing; clothing manufacturing; papermaking and paper products; printing and recording media reproduction; manufacturing of cultural, educational, artistic, sports and entertainment products; rubber and plastic products. | Labor-intensive industries |
| Petroleum processing, coking and nuclear fuel processing; non-metallic mineral products; ferrous metal smelting and rolling processing; nonferrous metal smelting and rolling processing; metal products; general equipment manufacturing; special equipment manufacturing; instrument manufacturing. | Capital-intensive industries | |
| Chemical raw materials and products manufacturing; pharmaceutical manufacturing; chemical fiber manufacturing; automobile manufacturing; transportation equipment manufacturing; electrical machinery and equipment manufacturing; electronic equipment manufacturing; comprehensive utilization of waste resources; repair of metal products, machinery, and equipment; other. | Technology-intensive industries | |
| Production and supply of power, heat, gas, and water | Production and supply of power and heat; production and supply of gas; production and supply of water. | Energy-intensive industries |
| Variables | Model (1) | Model (2) | Model (3) | |||
|---|---|---|---|---|---|---|
| Regression Coefficients | t-Stat | Regression Coefficients | t-Stat | Regression Coefficients | t-Stat | |
| Lnρ | 0.332 *** | (6.39) | 0.160 *** | (2.68) | 0.197 *** | (3.29) |
| LnR | 0.005 ** | (0.17) | 0.015 * | (0.24) | 0.068 ** | (2.04) |
| LnU | −0.822 * | (−1.35) | −0.675 * | (−0.82) | −0.067 | (−0.15) |
| LnE | −0.348 * | (1.93) | −0.016 | (0.05) | −0.460 ** | (2.43) |
| LnPD | 0.296 *** | (5.04) | 0.128 | (1.12) | 0.209 *** | (3.86) |
| LnGDPPC | 0.421 *** | (6.63) | 0.532 *** | (4.26) | 0.154 ** | (2.58) |
| LnWPC | 0.551 *** | (8.02) | 0.478 | (3.55) | 0.048 | (0.76) |
| LnRDID | −0.128 * | (−1.37) | −0.473 ** | (−2.57) | −0.035 | (−0.35) |
| LnOOW | 0.342 | (0.65) | −0.790 | (−0.77) | 0.993 ** | (2.50) |
| W×LnR | 0.001 * | (0.06) | 0.438 *** | (4.28) | 0.055 | (0.99) |
| W×LnU | 0.553 | (0.72) | 0.591 | (0.39) | −0.172 | (−0.23) |
| W×LnE | −0.254 ** | (−0.73) | −1.588 | (−2.33) | −0.970 ** | (−2.52) |
| W×LnPD | −0.384 *** | (−4.99) | −0.382 ** | (−2.52) | −0.254 *** | (−3.51) |
| W×LnGDPPC | −0.379 *** | (−4.37) | −0.589 *** | (−3.45) | −0.143 | (−1.45) |
| W×LnWPC | −0.650 *** | (−8.26) | −0.695 *** | (−4.50) | −0.054 | (−0.63) |
| W×LnRDID | −0.035 | (−0.24) | 0.214 | (0.73) | −0.026 | (−0.16) |
| W×LnOOW | −0.162 | (−0.31) | 0.961 | (0.93) | −0.849 ** | (−2.08) |
| R2 | 0.145 | 0.131 | 0.086 | |||
| log-likelihood | 425.396 | 75.701 | 268.974 | |||
| Variables | Direct Effect | Indirect Effect | Total Effect | |||
|---|---|---|---|---|---|---|
| Regression Coefficients | t-Stat | Regression Coefficients | t-Stat | Regression Coefficients | t-Stat | |
| LnR | 0.005 * | (0.16) | 0.001 * | (0.01) | 0.006 * | (0.07) |
| LnU | −0.722 ** | (−2.18) | 0.551 | (0.96) | −0.171 | (0.21) |
| LnE | −0.360 * | (1.63) | −0.224 ** | (−0.73) | −0.584 ** | (−2.01) |
| LnPD | 0.309 *** | (4.60) | −0.357 ** | (−4.36) | −0.048 ** | (−0.37) |
| LnGDPPC | 0.425 *** | (5.49) | −0.282 *** | (−4.37) | 0.143 *** | (3.86) |
| LnWPC | 0.537 *** | (7.68) | −0.598 | (−8.32) | −0.061 | (−0.98) |
| LnRDID | −0.154 * | (−1.05) | −0.048 | (−0.34) | −0.202 | (−1.36) |
| LnOOW | 0.169 | (0.31) | −0.086 | (−0.21) | 0.083 | (0.16) |
| Threshold Values | LnR | LnU | LnE | |||
|---|---|---|---|---|---|---|
| Regression Coefficients | t-Stat | Regression Coefficients | t-Stat | Regression Coefficients | t-Stat | |
| lnGDPPC ≤ 0.581 | −0.201 *** | (−4.26) | −2.860 *** | (−5.15) | −0.345 * | (−1.89) |
| 0.648 ≤ lnGDPPC ≤ 0.581 | −0.102 ** | (−1.96) | −1.026 *** | (−2.48) | −0.164 | (−0.78) |
| lnGDPPC ≥ 0.648 | 0.206 *** | (3.08) | −0.310 | (−0.62) | 0.115 * | (0.31) |
Publisher’s Note: MDPI stays neutral with regard to jurisdictional claims in published maps and institutional affiliations. |
© 2022 by the authors. Licensee MDPI, Basel, Switzerland. This article is an open access article distributed under the terms and conditions of the Creative Commons Attribution (CC BY) license (https://creativecommons.org/licenses/by/4.0/).
Share and Cite
Li, B.; Wang, Z.; Xu, F. Does Optimization of Industrial Structure Improve Green Efficiency of Industrial Land Use in China? Int. J. Environ. Res. Public Health 2022, 19, 9177. https://doi.org/10.3390/ijerph19159177
Li B, Wang Z, Xu F. Does Optimization of Industrial Structure Improve Green Efficiency of Industrial Land Use in China? International Journal of Environmental Research and Public Health. 2022; 19(15):9177. https://doi.org/10.3390/ijerph19159177
Chicago/Turabian StyleLi, Bingqing, Zhanqi Wang, and Feng Xu. 2022. "Does Optimization of Industrial Structure Improve Green Efficiency of Industrial Land Use in China?" International Journal of Environmental Research and Public Health 19, no. 15: 9177. https://doi.org/10.3390/ijerph19159177
APA StyleLi, B., Wang, Z., & Xu, F. (2022). Does Optimization of Industrial Structure Improve Green Efficiency of Industrial Land Use in China? International Journal of Environmental Research and Public Health, 19(15), 9177. https://doi.org/10.3390/ijerph19159177