
Non-Carcinogenic Health Risk Evaluation of Elevated Fluoride in Groundwater and Its Suitability Assessment for Drinking Purposes Based on Water Quality Index


 ,
,  , ,
, ,  and
and 
Abstract
:1. Introduction
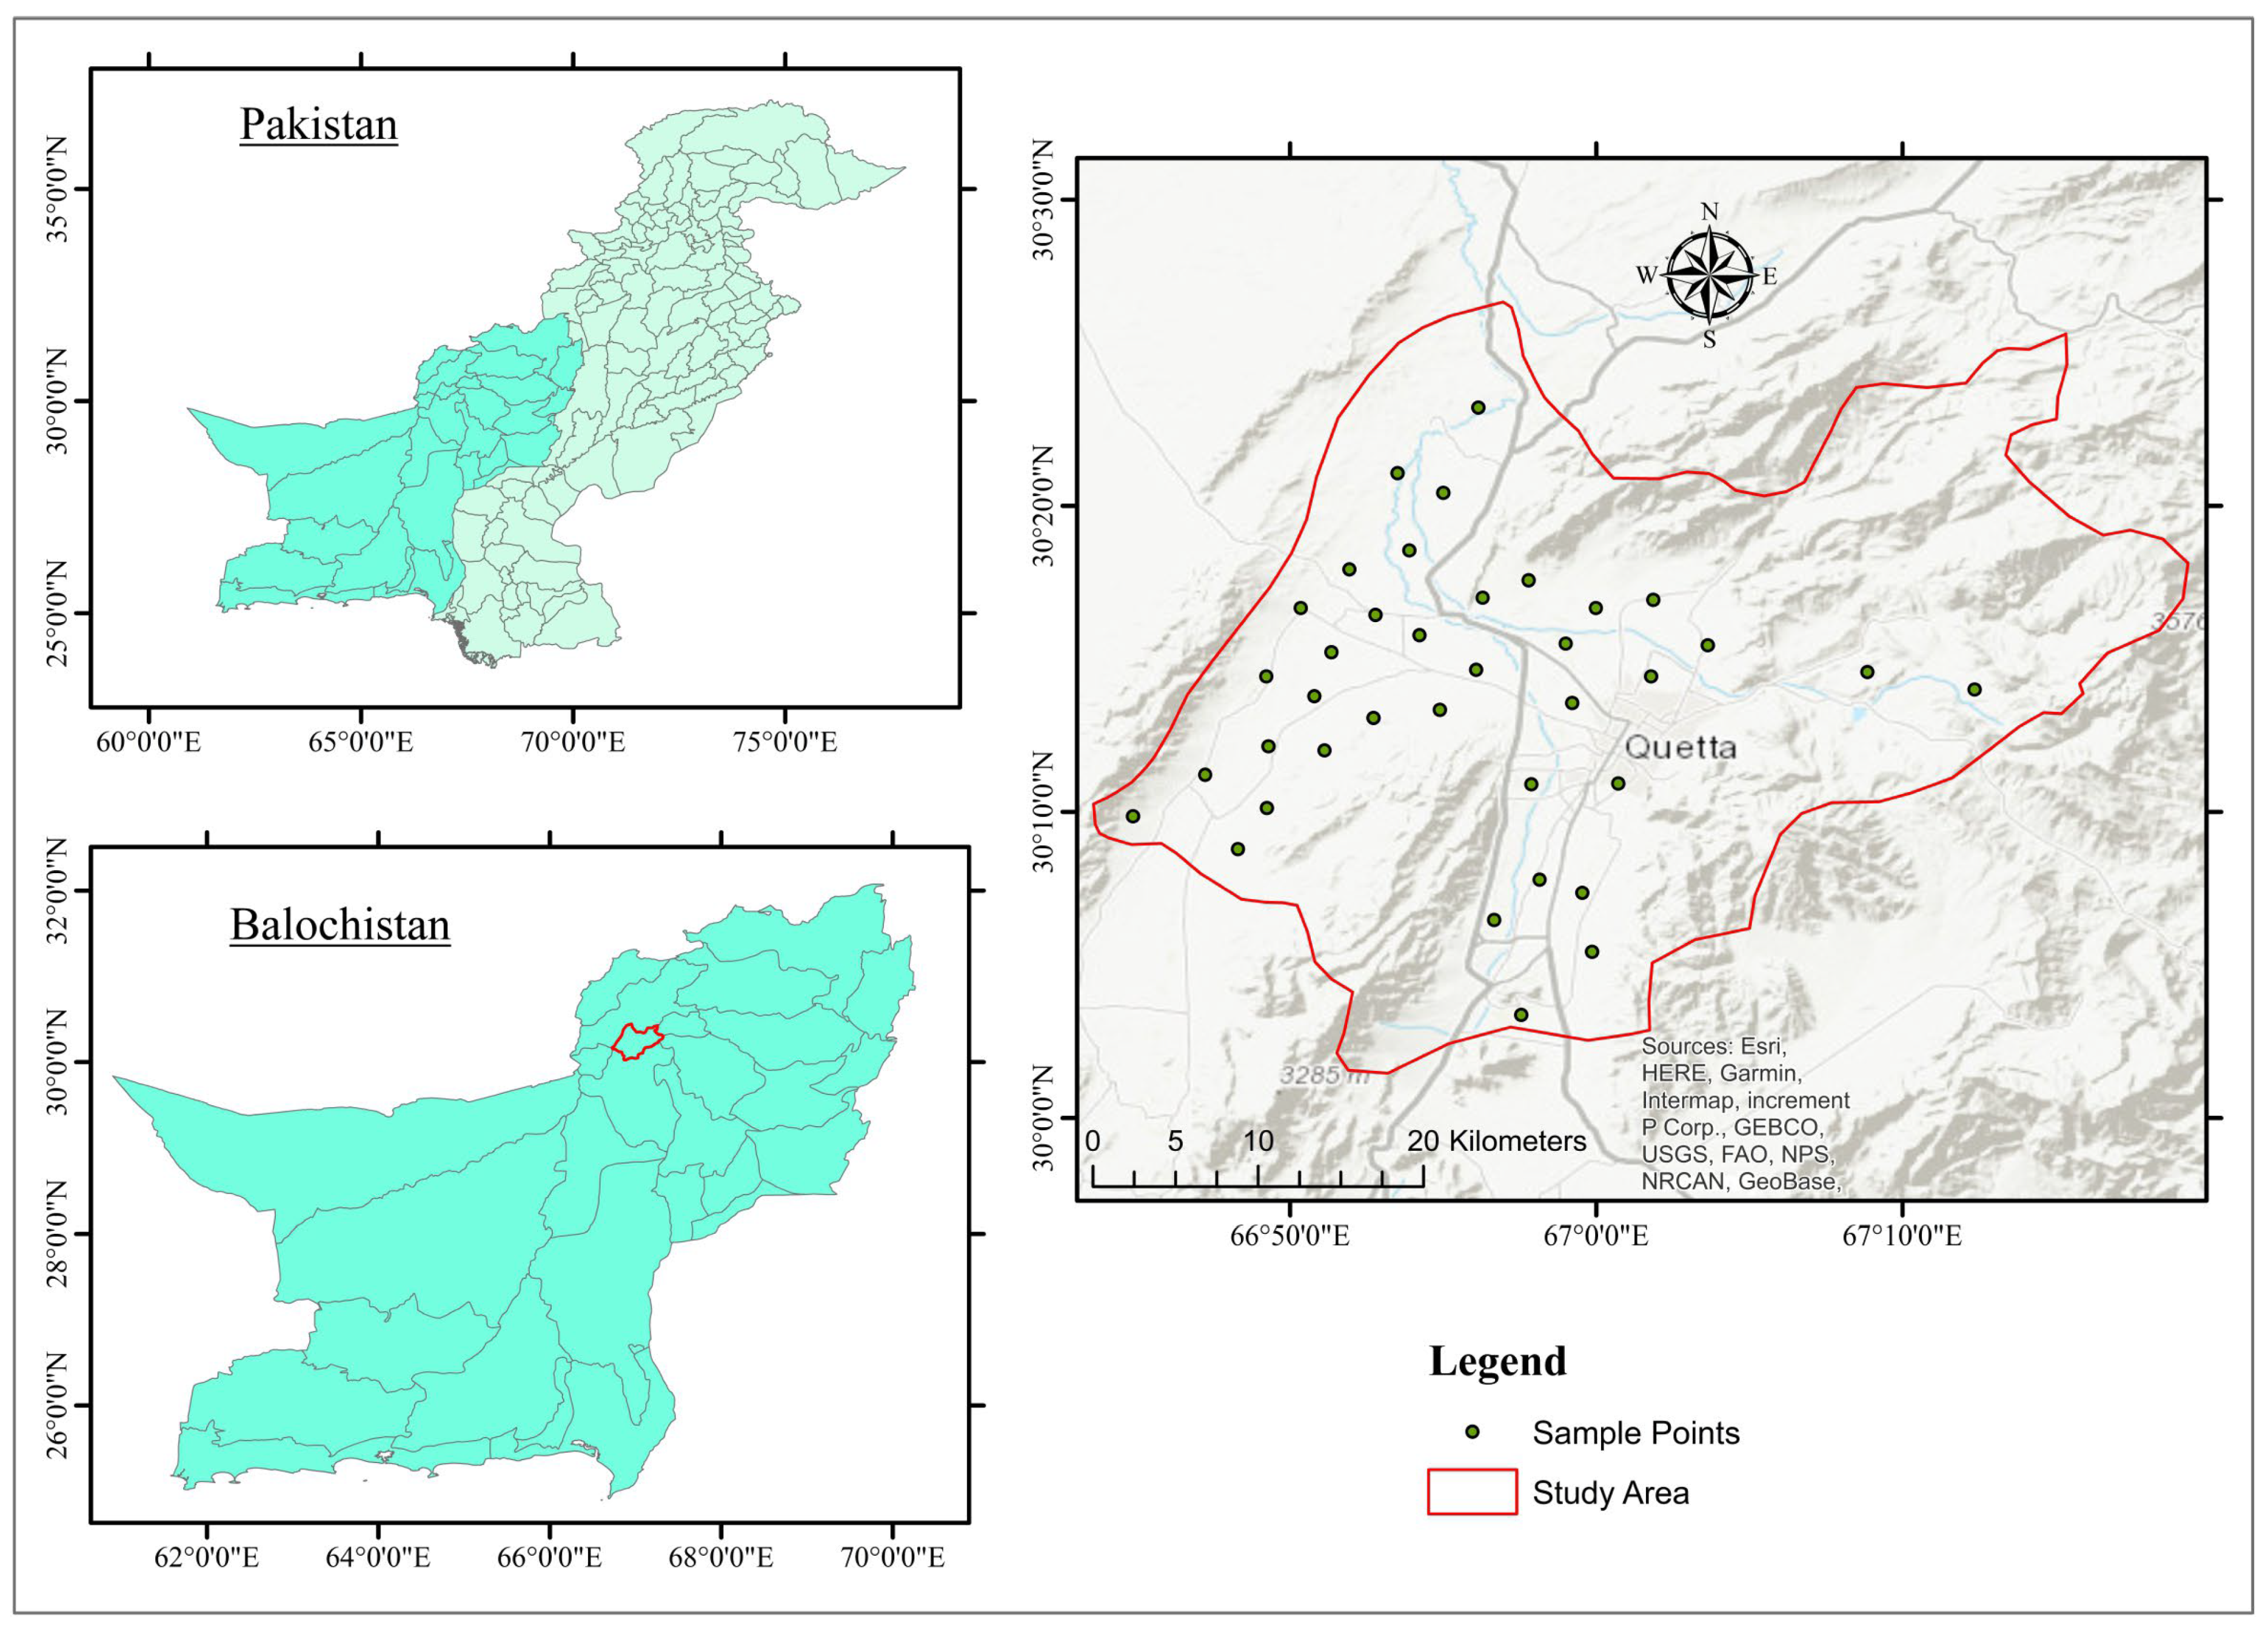
2. Study Area
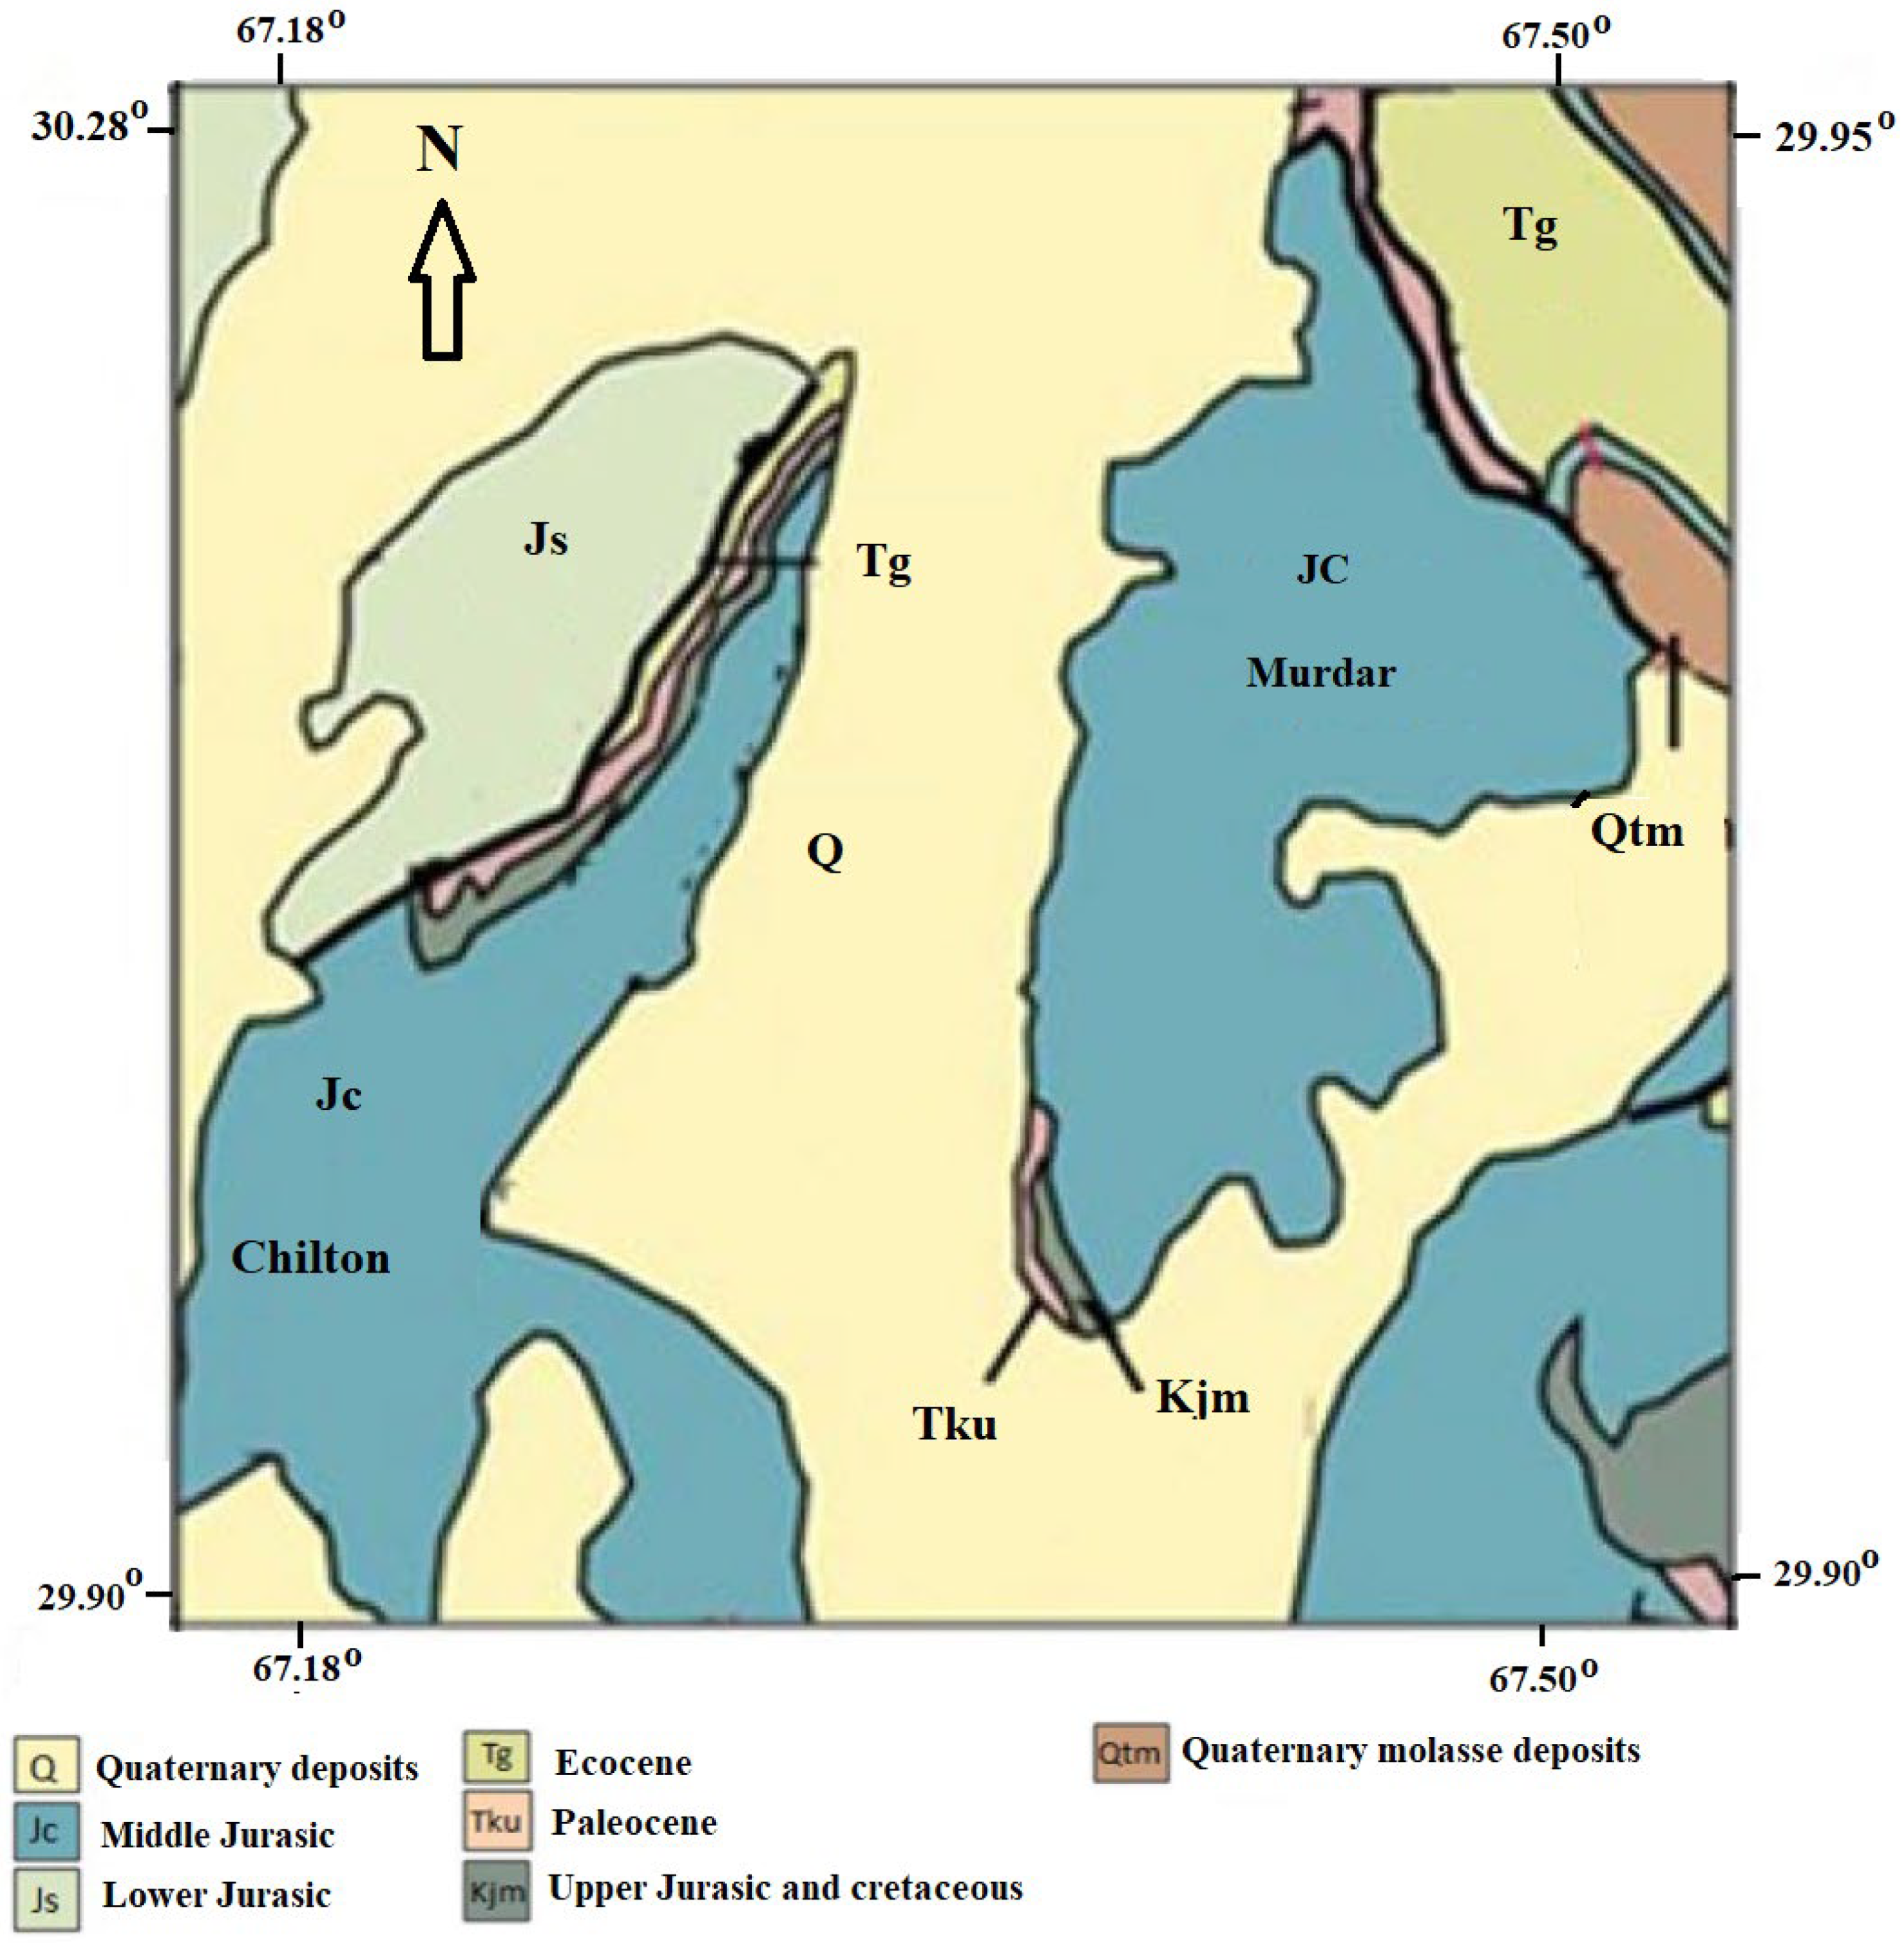
2.1. Geography and Geology
2.2. Hydrogeology and Lithology
3. Material and Methods
3.1. Sampling and Analysis
3.2. Quality Assurance and Quality Control
3.3. Statistical Analysis
3.3.1. Principal Component Analysis
3.3.2. Correlation Analysis
3.3.3. Saturation Indices
3.3.4. Water Type
3.3.5. Water Quality Analysis for Drinking
3.3.6. Health Risk Assessment
4. Results and Discussion
4.1. Groundwater Composition
4.2. Fluoride Contamination in Groundwater
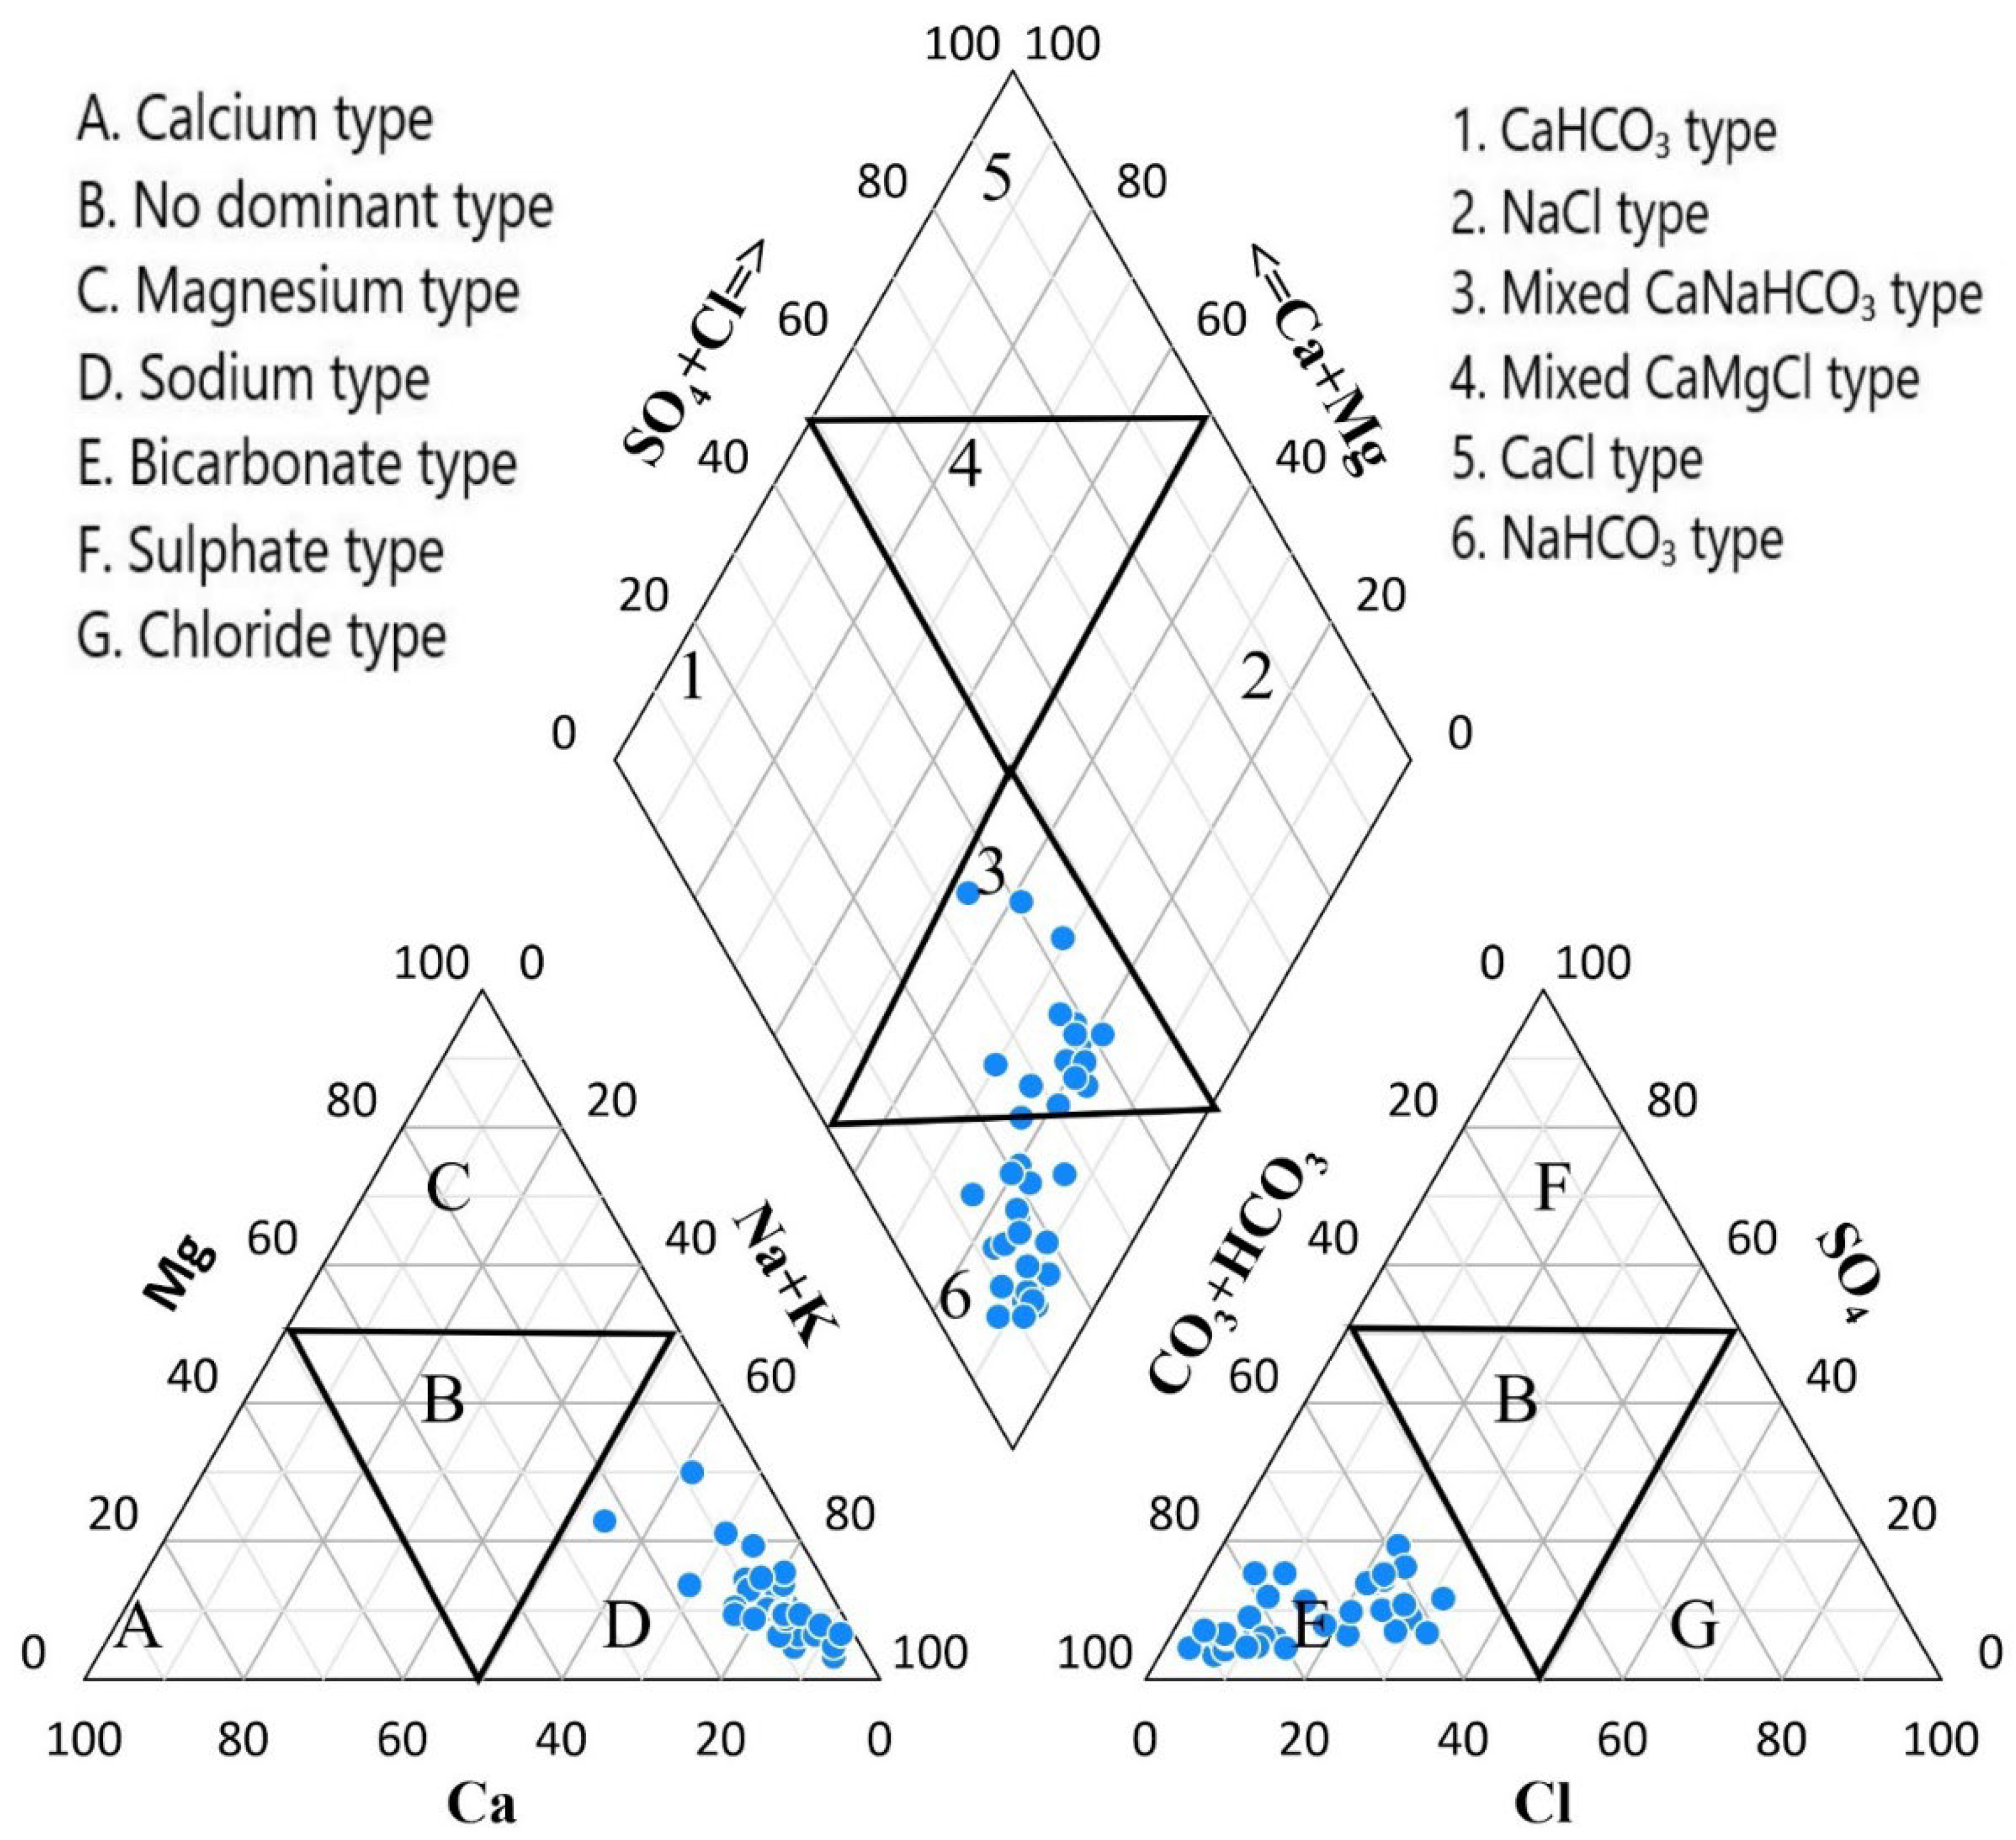
4.3. Hydrochemical Facies
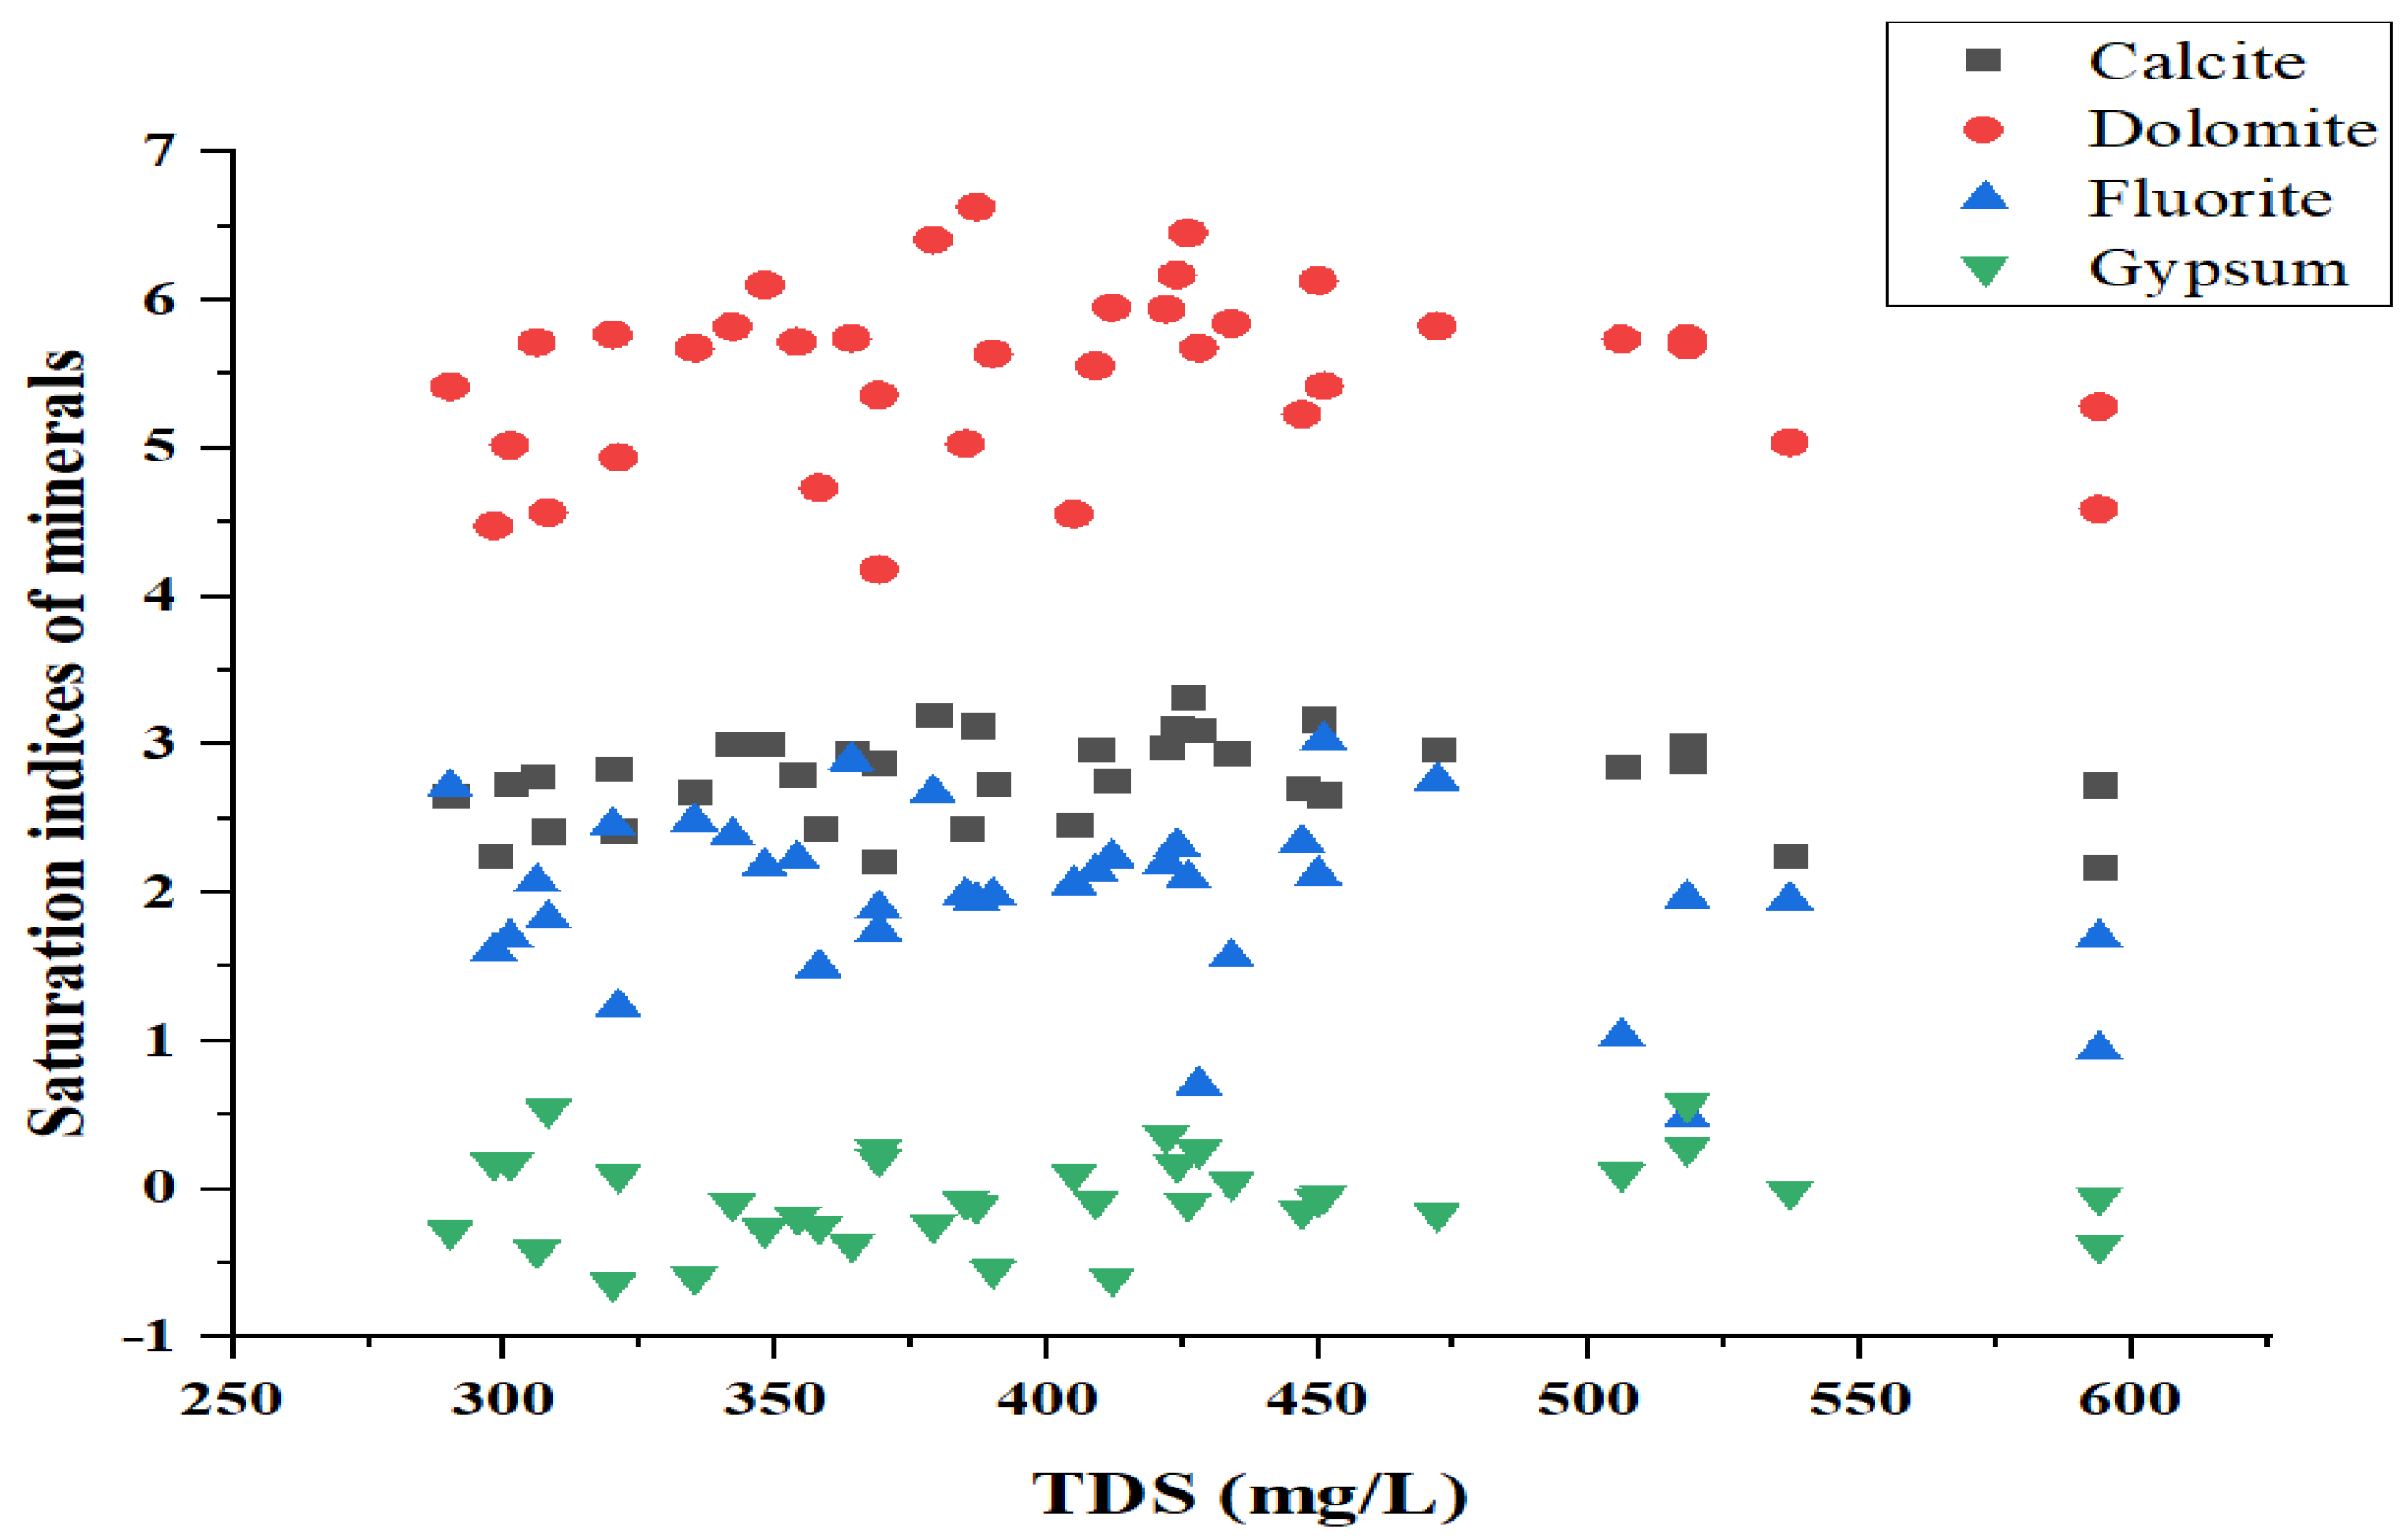
4.4. Mineral Phases of Groundwater
4.5. Principal Component Analysis
4.6. Health Risk Assessment
4.7. Suitability Assessment of Drinking Groundwater
5. Conclusions
Author Contributions
Funding
Institutional Review Board Statement
Informed Consent Statement
Data Availability Statement
Acknowledgments
Conflicts of Interest
References
- Rashid, A.; Guan, D.-X.; Farooqi, A.; Khan, S.; Zahir, S.; Jehan, S.; Khattak, S.A.; Khan, M.S.; Khan, R. Fluoride prevalence in groundwater around a fluorite mining area in the flood plain of the River Swat, Pakistan. Sci. Total Environ. 2018, 635, 203–215. [Google Scholar] [CrossRef] [PubMed] [Green Version]
- Su, H.; Kang, W.; Kang, N.; Liu, J.; Li, Z. Hydrogeochemistry and health hazards of fluoride-enriched groundwater in the Tarim Basin, China. Environ. Res. 2021, 200, 111476. [Google Scholar] [CrossRef] [PubMed]
- Hourieh Fallah, S.; Bakaeian, M.; Parsian, H.; Amouei, A.; Asgharnia, H.; Ghanbarian, M.; Mousapour, A.; Tabarinai, H.; Oskoei, V.; Miri, S.A. Potentially harmful heavy metal contamination in Babolrood river: Evaluation for risk assessment in the Mazandaran province, Iran. Int. J. Environ. Anal. Chem. 2020, 1–15. [Google Scholar] [CrossRef]
- Nizam, S.; Virk, H.S.; Sen, I.S. High levels of fluoride in groundwater from Northern parts of Indo-Gangetic plains reveals detrimental fluorosis health risks. Environ. Adv. 2022, 8, 100200. [Google Scholar] [CrossRef]
- Ali, S.; Ali, H.; Pakdel, M.; Ghale Askari, S.; Mohammadi, A.A.; Rezania, S. Spatial analysis and probabilistic risk assessment of exposure to fluoride in drinking water using GIS and Monte Carlo simulation. Environ. Sci. Pollut. Res. 2022, 29, 5881–5890. [Google Scholar] [CrossRef]
- Solanki, Y.S.; Agarwal, M.; Gupta, A.; Gupta, S.; Shukla, P. Fluoride occurrences, health problems, detection, and remediation methods for drinking water: A comprehensive review. Sci. Total Environ. 2022, 807, 150601. [Google Scholar] [CrossRef]
- Meng, X.; Yao, Y.; Ma, Y.; Zhong, N.; Alphonse, S.; Pei, J. Effect of fluoride in drinking water on the level of 5-methylcytosine in human and rat blood. Environ. Toxicol. Pharmacol. 2021, 81, 103511. [Google Scholar] [CrossRef]
- Mohammadpour, A.; Tabatabaee, Z.; Dehbandi, R.; Khaksefidi, R.; Golaki, M.; Gharechahi, E.; Samaei, M.R.; Mohammadpour, R.; Sheibani, A.; Badeenezhad, A. Concentration, distribution and probabilistic health risk assessment of exposure to fluoride in drinking water of Hormozgan province, Iran. Stoch. Environ. Res. Risk Assess. 2022, 36, 1035–1047. [Google Scholar] [CrossRef]
- Liyanage, D.; Diyabalanage, S.; Dunuweera, S.; Rajapakse, S.; Rajapakse, R.; Chandrajith, R. Significance of Mg-hardness and fluoride in drinking water on chronic kidney disease of unknown etiology in Monaragala, Sri Lanka. Environ. Res. 2022, 203, 111779. [Google Scholar] [CrossRef]
- Kodsup, P.; Godebo, T.R.; Nyachoti, S. Associations Between Essential Elements in Fingernails and Bone Quality in Populations Exposed to Chronic Fluoride in Drinking Water. Expo. Health 2022, 14, 475–485. [Google Scholar] [CrossRef]
- Golaki, M.; Azhdarpoor, A.; Mohamadpour, A.; Derakhshan, Z.; Conti, G.O. Health risk assessment and spatial distribution of nitrate, nitrite, fluoride, and coliform contaminants in drinking water resources of kazerun, Iran. Environ. Res. 2022, 203, 111850. [Google Scholar] [CrossRef] [PubMed]
- Jha, S.K.; Mishra, V.K.; Sharma, D.K.; Damodaran, T. Fluoride in the environment and its metabolism in humans. Rev. Environ. Contam. Toxicol. 2011, 211, 121–142. [Google Scholar] [PubMed]
- Ghanbarian, M.; Ghanbarian, M.; Tabatabaie, T.; Ghanbarian, M.; Ghadiri, S.-K. Distributing and assessing fluoride health risk in urban drinking water resources in Fars Province, Iran, using the geographical information system. Environ. Geochem. Health 2022, 44, 771–781. [Google Scholar] [CrossRef] [PubMed]
- Srivastava, S.; Flora, S. Fluoride in drinking water and skeletal fluorosis: A review of the global impact. Curr. Environ. Health Rep. 2020, 7, 140–146. [Google Scholar] [CrossRef]
- Akuno, M.; Nocella, G.; Milia, E.; Gutierrez, L. Factors influencing the relationship between fluoride in drinking water and dental fluorosis: A ten-year systematic review and meta-analysis. J. Water Health 2019, 17, 845–862. [Google Scholar] [CrossRef]
- Li, Y.; Wang, F.; Feng, J.; Lv, J.-P.; Liu, Q.; Nan, F.-R.; Zhang, W.; Qu, W.-Y.; Xie, S.-L. Long term spatial-temporal dynamics of fluoride in sources of drinking water and associated health risks in a semiarid region of Northern China. Ecotoxicol. Environ. Saf. 2019, 171, 274–280. [Google Scholar] [CrossRef]
- Mridha, D.; Priyadarshni, P.; Bhaskar, K.; Gaurav, A.; De, A.; Das, A.; Joardar, M.; Chowdhury, N.R.; Roychowdhury, T. Fluoride exposure and its potential health risk assessment in drinking water and staple food in the population from fluoride endemic regions of Bihar, India. Groundw. Sustain. Dev. 2021, 13, 100558. [Google Scholar] [CrossRef]
- Fernando, W.; Nanayakkara, N.; Gunarathne, L.; Chandrajith, R. Serum and urine fluoride levels in populations of high environmental fluoride exposure with endemic CKDu: A case–control study from Sri Lanka. Environ. Geochem. Health 2020, 42, 1497–1504. [Google Scholar] [CrossRef]
- Rasool, A.; Farooqi, A.; Xiao, T.; Ali, W.; Noor, S.; Abiola, O.; Ali, S.; Nasim, W. A review of global outlook on fluoride contamination in groundwater with prominence on the Pakistan current situation. Environ. Geochem. Health 2018, 40, 1265–1281. [Google Scholar] [CrossRef]
- Alam, I.; Rehman, J.U.; Nazir, S.; Nazeer, A.; Akram, M.; Batool, Z.; Ullah, H.; Hameed, A.; Hussain, A.; Hussain, A. Health risk assessment in different age-group due to nitrate, fluoride, nitrite and geo-chemical parameters in drinking water in Ahmadpur East, Punjab, Pakistan. Hum. Ecol. Risk Assess. Int. J. 2021, 27, 1747–1763. [Google Scholar] [CrossRef]
- Ullah, Z.; Talib, M.A.; Rashid, A.; Ghani, J.; Shahab, A.; Irfan, M.; Rauf, A.; Bawazeer, S.; Almarhoon, Z.M.; Mabkhot, Y.N. Hydrogeochemical investigation of elevated arsenic based on entropy modeling, in the aquifers of District Sanghar, Sindh, Pakistan. Water 2021, 13, 3477. [Google Scholar] [CrossRef]
- Iqbal, J.; Su, C.; Rashid, A.; Yang, N.; Baloch, M.Y.J.; Talpur, S.A.; Ullah, Z.; Rahman, G.; Rahman, N.U.; Sajjad, M.M. Hydrogeochemical assessment of groundwater and suitability analysis for domestic and agricultural utility in Southern Punjab, Pakistan. Water 2021, 13, 3589. [Google Scholar] [CrossRef]
- Rashid, A.; Farooqi, A.; Gao, X.; Zahir, S.; Noor, S.; Khattak, J.A. Geochemical modeling, source apportionment, health risk exposure and control of higher fluoride in groundwater of sub-district Dargai, Pakistan. Chemosphere 2020, 243, 125409. [Google Scholar] [CrossRef] [PubMed]
- Rafique, T.; Naseem, S.; Usmani, T.H.; Bashir, E.; Khan, F.A.; Bhanger, M.I. Geochemical factors controlling the occurrence of high fluoride groundwater in the Nagar Parkar area, Sindh, Pakistan. J. Hazard. Mater. 2009, 171, 424–430. [Google Scholar] [CrossRef]
- Ullah, R.; Malik, R.N.; Qadir, A. Assessment of groundwater contamination in an industrial city, Sialkot, Pakistan. Afr. J. Environ. Sci. Technol. 2009, 3, 12. [Google Scholar]
- Rafique, T.; Naseem, S.; Ozsvath, D.; Hussain, R.; Bhanger, M.I.; Usmani, T.H. Geochemical controls of high fluoride groundwater in Umarkot sub-district, Thar Desert, Pakistan. Sci. Total Environ. 2015, 530, 271–278. [Google Scholar] [CrossRef]
- Naseem, S.; Rafique, T.; Bashir, E.; Bhanger, M.I.; Laghari, A.; Usmani, T.H. Lithological influences on occurrence of high-fluoride groundwater in Nagar Parkar area, Thar Desert, Pakistan. Chemosphere 2010, 78, 1313–1321. [Google Scholar] [CrossRef]
- Alam, K.; Ahmad, N. Determination of aquifer geometry through geophysical methods: A case study from Quetta Valley, Pakistan. Acta Geophys. 2014, 62, 142–163. [Google Scholar] [CrossRef]
- WAPDA. Individual Basinal Reports of Balochistan, Hydrogeology Project, Quetta, 1982–2000, Pakistan. In Water and Power Development Authority; WAPDA: Lahore, Pakistan, 2001. [Google Scholar]
- Sagintayev, Z.; Sultan, M.; Khan, S.; Khan, S.; Mahmood, K.; Yan, E.; Milewski, A.; Marsala, P. A remote sensing contribution to hydrologic modelling in arid and inaccessible watersheds, Pishin Lora basin, Pakistan. Hydrol. Processes 2012, 26, 85–99. [Google Scholar] [CrossRef]
- Kazmi, A.; Abbas, G.; Younas, S. Water resources and hydrogeology of Quetta Basin, Balochistan, Pakistan. Geol. Surv. Pak. Quetta 2005. [Google Scholar]
- Durrani, I.H.; Adnan, S.; Ahmad, M.; Khair, S.; Kakar, E. Observed long-term climatic variability and its impacts on the ground water level of Quetta alluvial. Iran. J. Sci. Technol. Trans. A Sci. 2018, 42, 589–600. [Google Scholar] [CrossRef]
- Khair, S.M.; Mushtaq, S.; Reardon-Smith, K. Groundwater Governance in a Water-Starved Country: Public Policy, Farmers’ Perceptions, and Drivers of Tubewell Adoption in Balochistan, Pakistan. Groundwater 2015, 53, 626–637. [Google Scholar] [CrossRef] [PubMed] [Green Version]
- Iqbal, Z.; Imran, M.; Rahman, G.; Miandad, M.; Shahid, M.; Murtaza, B. Spatial distribution, health risk assessment, and public perception of groundwater in Bahawalnagar, Punjab, Pakistan: A multivariate analysis. Environ. Geochem. Health 2022, 1–11. [Google Scholar] [CrossRef] [PubMed]
- Muhammad, S.; Ullah, I. Spatial and seasonal variation of water quality indices in Gomal Zam Dam and its tributaries of south Waziristan District, Pakistan. Environ. Sci. Pollut. Res. 2022, 29, 29141–29151. [Google Scholar] [CrossRef]
- Lanjwani, M.F.; Khuhawar, M.Y.; Khuhawar, T.M.J.; Memon, S.Q.; Samtio, M.S.; Lanjwani, A.H.; Rind, I.K. Spatial distribution of hydrochemistry and characterization of groundwater of taluka Bakrani, Larkana, Sindh, Pakistan. Arab. J. Geosci. 2022, 15, 380. [Google Scholar] [CrossRef]
- Rehman, F.; Siddique, J.; Shahab, A.; Azeem, T.; Bangash, A.A.; Naseem, A.A.; Riaz, O.; ur Rehman, Q. Hydrochemical appraisal of fluoride contamination in groundwater and human health risk assessment at Isa Khel, Punjab, Pakistan. Environ. Technol. Innov. 2022, 27, 102445. [Google Scholar] [CrossRef]
- Khattak, J.A.; Farooqi, A.; Hussain, I.; Kumar, A.; Singh, C.K.; Mailloux, B.J.; Bostick, B.; Ellis, T.; van Geen, A. Groundwater fluoride across the Punjab plains of Pakistan and India: Distribution and underlying mechanisms. Sci. Total Environ. 2022, 806, 151353. [Google Scholar] [CrossRef]
- Siddique, J.; Menggui, J.; Shah, M.H.; Shahab, A.; Rehman, F.; Rasool, U. Integrated approach to hydrogeochemical appraisal and quality assessment of groundwater from Sargodha District, Pakistan. Geofluids 2020, 2020, 6621038. [Google Scholar] [CrossRef]
- Rashid, A.; Ayub, M.; Khan, S.; Ullah, Z.; Ali, L.; Gao, X.; Li, C.; El-Serehy, H.A.; Kaushik, P.; Rasool, A. Hydrogeochemical assessment of carcinogenic and non-carcinogenic health risks of potentially toxic elements in aquifers of the Hindukush ranges, Pakistan: Insights from groundwater pollution indexing, GIS-based, and multivariate statistical approaches. Environ. Sci. Pollut. Res. 2022, 1–25. [Google Scholar] [CrossRef]
- Rashid, A.; Ayub, M.; Ullah, Z.; Ali, A.; Khattak, S.A.; Ali, L.; Gao, X.; Li, C.; Khan, S.; El-Serehy, H.A. Geochemical Modeling Source Provenance, Public Health Exposure, and Evaluating Potentially Harmful Elements in Groundwater: Statistical and Human Health Risk Assessment (HHRA). Int. J. Environ. Res. Public Health 2022, 19, 6472. [Google Scholar] [CrossRef]
- Deeba, F.; Abbas, N.; Butt, M.; Irfan, M. Ground water quality of selected areas of Punjab and Sind Provinces, Pakistan: Chemical and microbiological aspects. Chem. Int. 2019, 5, 241–246. [Google Scholar] [CrossRef] [Green Version]
- Khalid, S. An assessment of groundwater quality for irrigation and drinking purposes around brick kilns in three districts of Balochistan province, Pakistan, through water quality index and multivariate statistical approaches. J. Geochem. Explor. 2019, 197, 14–26. [Google Scholar]
- Khalid, S.; Murtaza, B.; Shaheen, I.; Ahmad, I.; Ullah, M.I.; Abbas, T.; Rehman, F.; Ashraf, M.R.; Khalid, S.; Abbas, S. Assessment and public perception of drinking water quality and safety in district Vehari, Punjab, Pakistan. J. Clean. Prod. 2018, 181, 224–234. [Google Scholar] [CrossRef]
- Iqbal, M.M.; Shoaib, M.; Agwanda, P.; Lee, J.L. Modeling approach for water-quality management to control pollution concentration: A case study of Ravi River, Punjab, Pakistan. Water 2018, 10, 1068. [Google Scholar] [CrossRef] [Green Version]
- Ahmad, W.; Iqbal, J.; Nasir, M.J.; Ahmad, B.; Khan, M.T.; Khan, S.N.; Adnan, S. Impact of land use/land cover changes on water quality and human health in district Peshawar Pakistan. Sci. Rep. 2021, 11, 16526. [Google Scholar] [CrossRef]
- Khan, M.H.; Nafees, M.; Muhammad, N.; Ullah, U.; Hussain, R.; Bilal, M. Assessment of drinking water sources for water quality, human health risks, and pollution sources: A case study of the district Bajaur, Pakistan. Arch. Environ. Contam. Toxicol. 2021, 80, 41–54. [Google Scholar] [CrossRef]
- Samtio, M.S.; Rajper, K.H.; Mastoi, A.S.; Sadaf, R.; Rajper, R.H.; Hakro, A.A.; Agheem, M.H.; Lanjwani, M.F. Hydrochemical assessment of groundwater from taluka Dahili, Thar Desert, Pakistan, for irrigation purpose using water quality indices. Int. J. Environ. Anal. Chem. 2021, 1–17. [Google Scholar] [CrossRef]
- Bashir, S.; Aslam, Z.; Niazi, N.K.; Khan, M.I.; Chen, Z. Impacts of water quality on human health in Pakistan. In Water Resources of Pakistan; Springer: Berlin/Heidelberg, Germany, 2021; pp. 225–247. [Google Scholar]
- Lanjwani, M.F.; Khuhawar, M.Y.; Jahangir Khuhawar, T.M.; Lanjwani, A.H.; Soomro, W.A. Evaluation of hydrochemistry of the Dokri groundwater, including historical site Mohenjo-Daro, Sindh, Pakistan. Int. J. Environ. Anal. Chem. 2021, 1–25. [Google Scholar] [CrossRef]
- Masood, N.; Batool, S.; Farooqi, A. Groundwater pollution in Pakistan. In Global Groundwater; Elsevier: Amstermdam, The Netherlands, 2021; pp. 309–322. [Google Scholar]
- Aziz, F.; Din, I.; Khan, S.; Khan, M.; Mustafa, G.; Nawab, F.; Khan, F.; Ahmad, K. Fluorides in drinking water and its health risk assessment in district Malakand, Khyber Pakhtunkhwa, Pakistan. Arab. J. Geosci. 2021, 14, 762. [Google Scholar] [CrossRef]
- Fuoco, I.; Apollaro, C.; Criscuoli, A.; De Rosa, R.; Velizarov, S.; Figoli, A. Fluoride polluted groundwaters in Calabria region (Southern Italy): Natural source and remediation. Water 2021, 13, 1626. [Google Scholar] [CrossRef]
- Chae, G.-T.; Yun, S.-T.; Kim, K.; Mayer, B. Hydrogeochemistry of sodium-bicarbonate type bedrock groundwater in the Pocheon spa area, South Korea: Water–rock interaction and hydrologic mixing. J. Hydrol. 2006, 321, 326–343. [Google Scholar] [CrossRef]
- Chae, G.-T.; Yun, S.-T.; Kwon, M.-J.; Kim, Y.-S.; Mayer, B. Batch dissolution of granite and biotite in water: Implication for fluorine geochemistry in groundwater. Geochem. J. 2006, 40, 95–102. [Google Scholar] [CrossRef] [Green Version]
- Mwiathi, N.F.; Gao, X.; Li, C.; Rashid, A. The occurrence of geogenic fluoride in shallow aquifers of Kenya Rift Valley and its implications in groundwater management. Ecotoxicol. Environ. Saf. 2022, 229, 113046. [Google Scholar] [CrossRef]
- LaFayette, G.N.; Knappett, P.S.; Li, Y.; Loza-Aguirre, I.; Polizzotto, M.L. Geogenic sources and chemical controls on fluoride release to groundwater in the Independence Basin, Mexico. Appl. Geochem. 2020, 123, 104787. [Google Scholar] [CrossRef]
- Xiao, Y.; Hao, Q.; Zhang, Y.; Zhu, Y.; Yin, S.; Qin, L.; Li, X. Investigating sources, driving forces and potential health risks of nitrate and fluoride in groundwater of a typical alluvial fan plain. Sci. Total Environ. 2022, 802, 149909. [Google Scholar] [CrossRef]
- Fuoco, I.; Marini, L.; De Rosa, R.; Figoli, A.; Gabriele, B.; Apollaro, C. Use of reaction path modelling to investigate the evolution of water chemistry in shallow to deep crystalline aquifers with a special focus on fluoride. Sci. Total Environ. 2022, 830, 154566. [Google Scholar] [CrossRef]


| Parameters | Minimum | Maximum | Mean | Std. Deviation | WHO Limit |
|---|---|---|---|---|---|
| pH | 7.1 | 8.1 | 7.7 | 0.3 | 6.6–8.5 |
| TDS (mg/L) | 290 | 594 | 404.6 | 79.8 | 1000 |
| EC (µs/cm) | 261 | 705 | 500.3 | 121.6 | 400 |
| Depth (feet) | 70 | 135 | 96.8 | 15.7 | - |
| Turbidity NTU | 0.5 | 3.7 | 1.7 | 0.7 | 5 |
| HCO3− (mg/L) | 143 | 532 | 289.5 | 125.6 | 250 |
| Ca2+ (mg/L) | 17 | 78 | 47.5 | 18.1 | 200 |
| Mg2+ (mg/L) | 15 | 73 | 30.6 | 13.3 | 150 |
| Na+ (mg/L) | 135 | 549 | 283.3 | 122.8 | 200 |
| SO42− (mg/L) | 13 | 90 | 34.9 | 17.5 | 250 |
| NO3− (mg/L) | 0 | 4 | 1.0 | 0.9 | 10 |
| K+ (mg/L) | 1 | 4 | 1.6 | 1.0 | 12 |
| Cl− (mg/L) | 12 | 89 | 25.6 | 17.3 | 250 |
| Fe2+ (mg/L) | 0.01 | 0.2 | 0.01 | 0.0 | 0.3 |
| F− (mg/L) | 0.19 | 6.21 | 1.8 | 1.4 | 1.5 |
| Parameters | F1 | F2 | F3 | F4 | F5 |
|---|---|---|---|---|---|
| pH | 0.28 | 0.57 | −0.04 | −0.05 | −0.15 |
| TDS | −0.24 | 0.52 | 0.60 | −0.21 | −0.32 |
| EC | −0.17 | 0.55 | −0.02 | −0.13 | 0.26 |
| Depth | 0.18 | −0.43 | 0.09 | 0.15 | −0.70 |
| Turbidity | −0.44 | 0.35 | −0.07 | 0.57 | 0.00 |
| HCO3− | 0.96 | 0.08 | −0.03 | −0.03 | 0.09 |
| Ca2+ | −0.68 | −0.12 | 0.13 | 0.26 | 0.43 |
| Mg2+ | 0.04 | −0.28 | 0.54 | −0.36 | 0.28 |
| Na+ | 0.91 | 0.14 | −0.12 | −0.11 | 0.12 |
| SO42− | 0.19 | −0.37 | 0.81 | 0.13 | −0.03 |
| NO3− | 0.23 | −0.44 | −0.31 | 0.52 | 0.06 |
| K+ | 0.29 | 0.43 | 0.11 | 0.33 | 0.16 |
| Cl− | 0.35 | −0.11 | 0.51 | 0.29 | 0.35 |
| Fe2+ | −0.02 | −0.38 | −0.34 | −0.46 | 0.27 |
| F− | 0.92 | 0.10 | 0.01 | 0.15 | 0.05 |
| Total | 3.75 | 2.00 | 1.84 | 1.34 | 1.20 |
| % of Variance | 24.98 | 13.35 | 12.27 | 8.91 | 8.00 |
| Cumulative % | 24.98 | 38.33 | 50.60 | 59.51 | 67.51 |
| Parameters | pH | TDS | EC | Depth | Turbidity | HCO3 | Ca | Mg | Na | SO4 | NO3 | K | Cl | Fe | F |
|---|---|---|---|---|---|---|---|---|---|---|---|---|---|---|---|
| pH | 1 | ||||||||||||||
| TDS | 0.16 | 1 | |||||||||||||
| EC | 0.271 | 0.25 | 1 | ||||||||||||
| Depth | −0.029 | −0.065 | −0.272 | 1 | |||||||||||
| Turbidity | −0.058 | 0.148 | 0.04 | −0.187 | 1 | ||||||||||
| HCO3 | 0.25 | −0.194 | −0.099 | 0.048 | −0.356 | 1 | |||||||||
| Ca | −0.218 | −0.011 | 0.084 | −0.207 | 0.311 | −0.607 ** | 1 | ||||||||
| Mg | −0.171 | 0.089 | −0.079 | −0.076 | −0.193 | 0.045 | 0.049 | 1 | |||||||
| Na | 0.246 | −0.235 | −0.125 | −0.06 | −0.324 | 0.934 ** | −0.604 ** | 0.05 | 1 | ||||||
| SO4 | −0.071 | 0.223 | −0.289 | 0.248 | −0.197 | 0.13 | 0.056 | 0.407 * | 0.003 | 1 | |||||
| NO3 | −0.058 | −0.523 ** | −0.092 | 0.182 | −0.036 | 0.19 | −0.049 | −0.09 | 0.072 | 0.054 | 1 | ||||
| K | 0.245 | 0.09 | −0.043 | −0.079 | 0.17 | 0.267 | 0.013 | −0.07 | 0.253 | 0.032 | −0.125 | 1 | |||
| Cl | 0.002 | −0.024 | 0.114 | 0.043 | −0.152 | 0.27 | 0.003 | 0.066 | 0.17 | 0.502 ** | 0.095 | 0.084 | 1 | ||
| Fe | −0.109 | −0.308 | −0.126 | 0.014 | −0.275 | −0.018 | 0.083 | 0 | −0.023 | −0.125 | −0.047 | −0.088 | −0.092 | 1 | |
| F | 0.186 | −0.168 | −0.123 | 0.143 | −0.246 | 0.903 ** | −0.550 ** | −0.035 | 0.815 ** | 0.121 | 0.172 | 0.378 | 0.367 | −0.078 | 1 |
| Sample ID | F (mg/L) | ADD Child | ADD Female | ADD Male | HQ Child | HQ Female | HQ Male |
|---|---|---|---|---|---|---|---|
| S1 | 3.62 | 0.188 | 0.139 | 0.132 | 3.14 | 2.32 | 2.19 |
| S2 | 0.9 | 0.047 | 0.035 | 0.033 | 0.78 | 0.58 | 0.55 |
| S3 | 1.9 | 0.099 | 0.073 | 0.069 | 1.65 | 1.22 | 1.15 |
| S4 | 0.62 | 0.032 | 0.024 | 0.023 | 0.54 | 0.40 | 0.38 |
| S5 | 0.72 | 0.037 | 0.028 | 0.026 | 0.62 | 0.46 | 0.44 |
| S6 | 0.19 | 0.010 | 0.007 | 0.007 | 0.16 | 0.12 | 0.12 |
| S7 | 4.65 | 0.242 | 0.179 | 0.169 | 4.03 | 2.98 | 2.82 |
| S8 | 2.49 | 0.129 | 0.096 | 0.091 | 2.16 | 1.60 | 1.51 |
| S9 | 3.65 | 0.190 | 0.140 | 0.133 | 3.16 | 2.34 | 2.21 |
| S10 | 2.79 | 0.145 | 0.107 | 0.101 | 2.42 | 1.79 | 1.69 |
| S11 | 1.25 | 0.065 | 0.048 | 0.045 | 1.08 | 0.80 | 0.76 |
| S12 | 0.85 | 0.044 | 0.033 | 0.031 | 0.74 | 0.54 | 0.52 |
| S13 | 0.67 | 0.035 | 0.026 | 0.024 | 0.58 | 0.43 | 0.41 |
| S14 | 1.71 | 0.089 | 0.066 | 0.062 | 1.48 | 1.10 | 1.04 |
| S15 | 0.5 | 0.026 | 0.019 | 0.018 | 0.43 | 0.32 | 0.30 |
| S16 | 1.6 | 0.083 | 0.062 | 0.058 | 1.39 | 1.03 | 0.97 |
| S17 | 3.92 | 0.204 | 0.151 | 0.143 | 3.40 | 2.51 | 2.38 |
| S18 | 0.7 | 0.036 | 0.027 | 0.025 | 0.61 | 0.45 | 0.42 |
| S19 | 1.9 | 0.099 | 0.073 | 0.069 | 1.65 | 1.22 | 1.15 |
| S20 | 6.21 | 0.323 | 0.239 | 0.226 | 5.38 | 3.98 | 3.76 |
| S21 | 4.51 | 0.235 | 0.173 | 0.164 | 3.91 | 2.89 | 2.73 |
| S22 | 0.5 | 0.026 | 0.019 | 0.018 | 0.43 | 0.32 | 0.30 |
| S23 | 1.6 | 0.083 | 0.062 | 0.058 | 1.39 | 1.03 | 0.97 |
| S24 | 0.2 | 0.010 | 0.008 | 0.007 | 0.17 | 0.13 | 0.12 |
| S25 | 1.4 | 0.073 | 0.054 | 0.051 | 1.21 | 0.90 | 0.85 |
| S26 | 2.1 | 0.109 | 0.081 | 0.076 | 1.82 | 1.35 | 1.27 |
| S27 | 1.7 | 0.088 | 0.065 | 0.062 | 1.47 | 1.09 | 1.03 |
| S28 | 0.8 | 0.042 | 0.031 | 0.029 | 0.69 | 0.51 | 0.48 |
| S29 | 1.7 | 0.088 | 0.065 | 0.062 | 1.47 | 1.09 | 1.03 |
| S30 | 0.3 | 0.016 | 0.012 | 0.011 | 0.26 | 0.19 | 0.18 |
| S31 | 1.2 | 0.062 | 0.046 | 0.044 | 1.04 | 0.77 | 0.73 |
| S32 | 0.7 | 0.036 | 0.027 | 0.025 | 0.61 | 0.45 | 0.42 |
| S33 | 1.56 | 0.081 | 0.060 | 0.057 | 1.35 | 1.00 | 0.95 |
| S34 | 1.2 | 0.062 | 0.046 | 0.044 | 1.04 | 0.77 | 0.73 |
| S35 | 1.9 | 0.099 | 0.073 | 0.069 | 1.65 | 1.22 | 1.15 |
| S36 | 0.8 | 0.0416 | 0.030769 | 0.029091 | 0.69 | 0.51 | 0.48 |
| S37 | 3.2 | 0.1664 | 0.123077 | 0.116364 | 2.77 | 2.05 | 1.94 |
| Min | 0.19 | 0.00988 | 0.007308 | 0.006909 | 0.16467 | 0.121795 | 0.115152 |
| Max | 6.21 | 0.32292 | 0.238846 | 0.225818 | 5.382 | 3.980769 | 3.763636 |
| Average | 1.789459 | 0.093052 | 0.068825 | 0.065071 | 1.55086 | 1.147089 | 1.084521 |
| WQI | Water Type | No. of Samples | % of Samples |
|---|---|---|---|
| (<50) | Excellent | 3 | 8.10 |
| (>50) | Good | 18 | 48.64 |
| (>100) | Poor | 16 | 43.24 |
| (>200) | Very poor | 00 | 00 |
| (>300) | Unsuitable for drinking | 00 | 00 |
Publisher’s Note: MDPI stays neutral with regard to jurisdictional claims in published maps and institutional affiliations. |
© 2022 by the authors. Licensee MDPI, Basel, Switzerland. This article is an open access article distributed under the terms and conditions of the Creative Commons Attribution (CC BY) license (https://creativecommons.org/licenses/by/4.0/).
Share and Cite
Ullah, Z.; Xu, Y.; Zeng, X.-C.; Rashid, A.; Ali, A.; Iqbal, J.; Almutairi, M.H.; Aleya, L.; Abdel-Daim, M.M.; Shah, M. Non-Carcinogenic Health Risk Evaluation of Elevated Fluoride in Groundwater and Its Suitability Assessment for Drinking Purposes Based on Water Quality Index. Int. J. Environ. Res. Public Health 2022, 19, 9071. https://doi.org/10.3390/ijerph19159071
Ullah Z, Xu Y, Zeng X-C, Rashid A, Ali A, Iqbal J, Almutairi MH, Aleya L, Abdel-Daim MM, Shah M. Non-Carcinogenic Health Risk Evaluation of Elevated Fluoride in Groundwater and Its Suitability Assessment for Drinking Purposes Based on Water Quality Index. International Journal of Environmental Research and Public Health. 2022; 19(15):9071. https://doi.org/10.3390/ijerph19159071
Chicago/Turabian StyleUllah, Zahid, Yifan Xu, Xian-Chun Zeng, Abdur Rashid, Asmat Ali, Javed Iqbal, Mikhlid H. Almutairi, Lotfi Aleya, Mohamed M. Abdel-Daim, and Muddaser Shah. 2022. "Non-Carcinogenic Health Risk Evaluation of Elevated Fluoride in Groundwater and Its Suitability Assessment for Drinking Purposes Based on Water Quality Index" International Journal of Environmental Research and Public Health 19, no. 15: 9071. https://doi.org/10.3390/ijerph19159071
APA StyleUllah, Z., Xu, Y., Zeng, X.-C., Rashid, A., Ali, A., Iqbal, J., Almutairi, M. H., Aleya, L., Abdel-Daim, M. M., & Shah, M. (2022). Non-Carcinogenic Health Risk Evaluation of Elevated Fluoride in Groundwater and Its Suitability Assessment for Drinking Purposes Based on Water Quality Index. International Journal of Environmental Research and Public Health, 19(15), 9071. https://doi.org/10.3390/ijerph19159071