Article

Effects of Risk Perception of Pests and Diseases on Tea Famers’ Green Control Techniques Adoption

1
School of Marxism, Sichuan Agricultural University, Chengdu 611130, China
2
Southwestern Poverty Reduction and Development Research Center, Sichuan Agricultural University, Chengdu 611130, China
3
College of Economics, Sichuan Agricultural University, Chengdu 611130, China
*
Author to whom correspondence should be addressed.
Int. J. Environ. Res. Public Health 2022, 19(14), 8465; https://doi.org/10.3390/ijerph19148465
Submission received: 5 June 2022 / Revised: 7 July 2022 / Accepted: 8 July 2022 / Published: 11 July 2022

Abstract

:
Green control techniques support the concept of green plant protection, advocate for the safe and reasonable use of pesticides, and finally achieve the goal of controlling pests and diseases and protecting the environment. The purpose of this study is to explore the effect of risk perception of pests and diseases on farmers’ usage intention of green control techniques. Based on 747 samples of tea farmers in Sichuan province, China, introducing the Unified Theory of Acceptance and Use of Technology (UTAUT) framework and using the Partial Least Square–Structural Equation Modeling (PLS-SEM) approach, this paper found that risk perception has a negative impact on behavioral intention. Performance expectancy, effort expectancy, and social influence can positively affect behavioral intention, and facilitating conditions can also positively influence usage behavior. Moreover, the mediating analysis indicated that the higher the risk perception is, the less performance expectancy of green control techniques and the weaker the behavioral intention. Meanwhile, risk perception also plays a mediating effect on the relationship between effort expectancy and behavioral intention. This study could help to provide references for policymaking to improve the adoption of green control techniques.

1. Introduction

China is a major tea-producing country, and tea has a long history in China [1,2]. As an important cash crop, tea is the basis for many rural farmers to sustain their livelihoods. Therefore, the development of the tea industry is crucial for tea farmers. However, tea plants are susceptible to a variety of pests such as nematodes, termites, cockchafer grub, stem pests, stem borer, leaf pests, and all mite species. If these pests and diseases are not effectively controlled, they could cause 10% to 20% of yield losses [3,4]. Since tea farmers are risk-averse, they have to apply pesticides to rapidly control pests and diseases for reducing production losses [5,6]. However, excessive usage of pesticides for reducing losses has created a serious problem of agricultural pollution. Some of the pesticide residues enter the ecosystem through the atmosphere, soil, and groundwater, causing incalculable damage to the ecosystem [7], and the pesticide residues on tea leaves can affect human health when brewed [4].
To curb the excessive use of chemical pesticides and ensure food quality and safety and ecological sustainability, the Chinese government emphasizes the promotion and application of green control techniques. Similar to integrated pest management (IPM) [8], green control techniques enable the effective control of crop pests and diseases by reducing chemical pesticide use and adopting techniques such as agricultural control, physical control, biological control, ecological regulation, and the scientific pesticide use to ensure the agricultural production safety, quality safety, and agroecological environment safety, as well as to improve farmers’ welfare. However, data from the Ministry of Agriculture and Rural Development showed that by the end of 2021, the adoption rate of green control techniques in China still had not reached 50%. The reasons for the low adoption rate can be attributed to several aspects. First, although the adoption of green control techniques can bring positive environmental effects, their effectiveness in controlling pests and diseases is not immediate compared to the traditional means of applying chemical pesticides [6]. Second, the adoption of green control techniques requires farmers to learn the knowledge and operational skills and even to shoulder the high cost of technology transfer and usage risk [9]. Finally, farmers have insufficient knowledge about pesticide application and weak awareness of ecological environment protection [5].
Moreover, many studies have shown that risk perception is one of the main factors influencing farmers’ adoption of agricultural techniques. For example, Liu and Huang [10] found that risk-averse farmers tended to apply more pesticides. Fernandez-Cornejo et al. [11] pointed out that farmers who adopted the IPM tended to be less risk-averse compared to non-adopters. Li et al. [12] found that risk perception positively mediated the relationship between farmer differences and soil and water conservation techniques. Pingali et al. [13] argued that the greater the risk farmers perceived, the more they intend to adopt pest control. The high risk of pests and diseases could lead to crop yield reduction, thus affecting their choice of control techniques. To our knowledge, although studies have discussed the impact of risk perception on pesticide use and sustainable technique adoption in agriculture, there is little literature examining the impact of risk perception of pests and diseases on the usage behavior and behavioral intentions of green control techniques. In recent years, many countries have emphasized sustainable and green development in agriculture. The development of green agriculture implies the transformation of agricultural production methods, and the transformation of control methods is also a key to it. It is well known that the promotion and application of green control techniques have a positive effect on the improvement of the ecological environment and agricultural product quality. Therefore, it is important to explore the influence of risk perception of pests and diseases on the adoption of green control techniques by tea farmers for the development of policies related to the promotion of green agricultural techniques. As alluded above, this paper involves the risk perception of pests and diseases in the Unified Theory of Acceptance and Use of Technology (UTAUT) framework, using the micro-data of tea farmers from Sichuan province, China, attempting to explore the impact and mechanism of risk perception on tea farmers’ adoption of green control techniques. We found that risk perception of pests and diseases has a negative effect on the behavioral intention of green control techniques. Additionally, performance expectancy, effort expectancy, and social influence have positive effects on behavioral intention, and facilitating conditions could positively affect usage behavior. Furthermore, performance expectancy can mediate the influence of risk perception on behavioral intention, and risk perception can mediate the effect of effort expectancy on behavioral intention.
This paper has some contributions. First, although the UTAUT has been used to study farmers’ adoption of electronic commerce, communication technologies, Internet of Things technologies, and project payments [14,15,16,17,18,19,20], they have been rarely applied in the context of green agricultural techniques. In this paper, we introduce risk perception of pests and diseases into the original UTAUT framework in an attempt to explore the effect of risk perception on farmers’ behavioral intention and usage behavior of green control techniques and contribute to the existing literature. Second, the data used in this paper are more representative because Sichuan is a major tea-producing province [4], and sufficient samples can also improve the estimation results under the structural equation model (SEM). Third, we also identified mediating effects of risk perception and performance expectancy. On the one hand, risk perception plays a mediating role between effort expectancy and behavioral intention. On the other hand, performance expectancy also mediates the relationship between risk perception and behavioral intention. These results are new findings for relevant studies and help us to understand the impact of risk perception of pests and diseases on the adoption of green control techniques at a deeper level. Fourth, our findings can provide policy implications for the government in making policies for the promotion of green control techniques as well as green agriculture development.
The remainder of this paper is shown as follows: Section 2 explains the theory and hypotheses; Section 3 introduces the questionnaire and data source; Section 4 and Section 5 report and discuss the results, respectively; Section 6 states the conclusions, limitations, and future research.

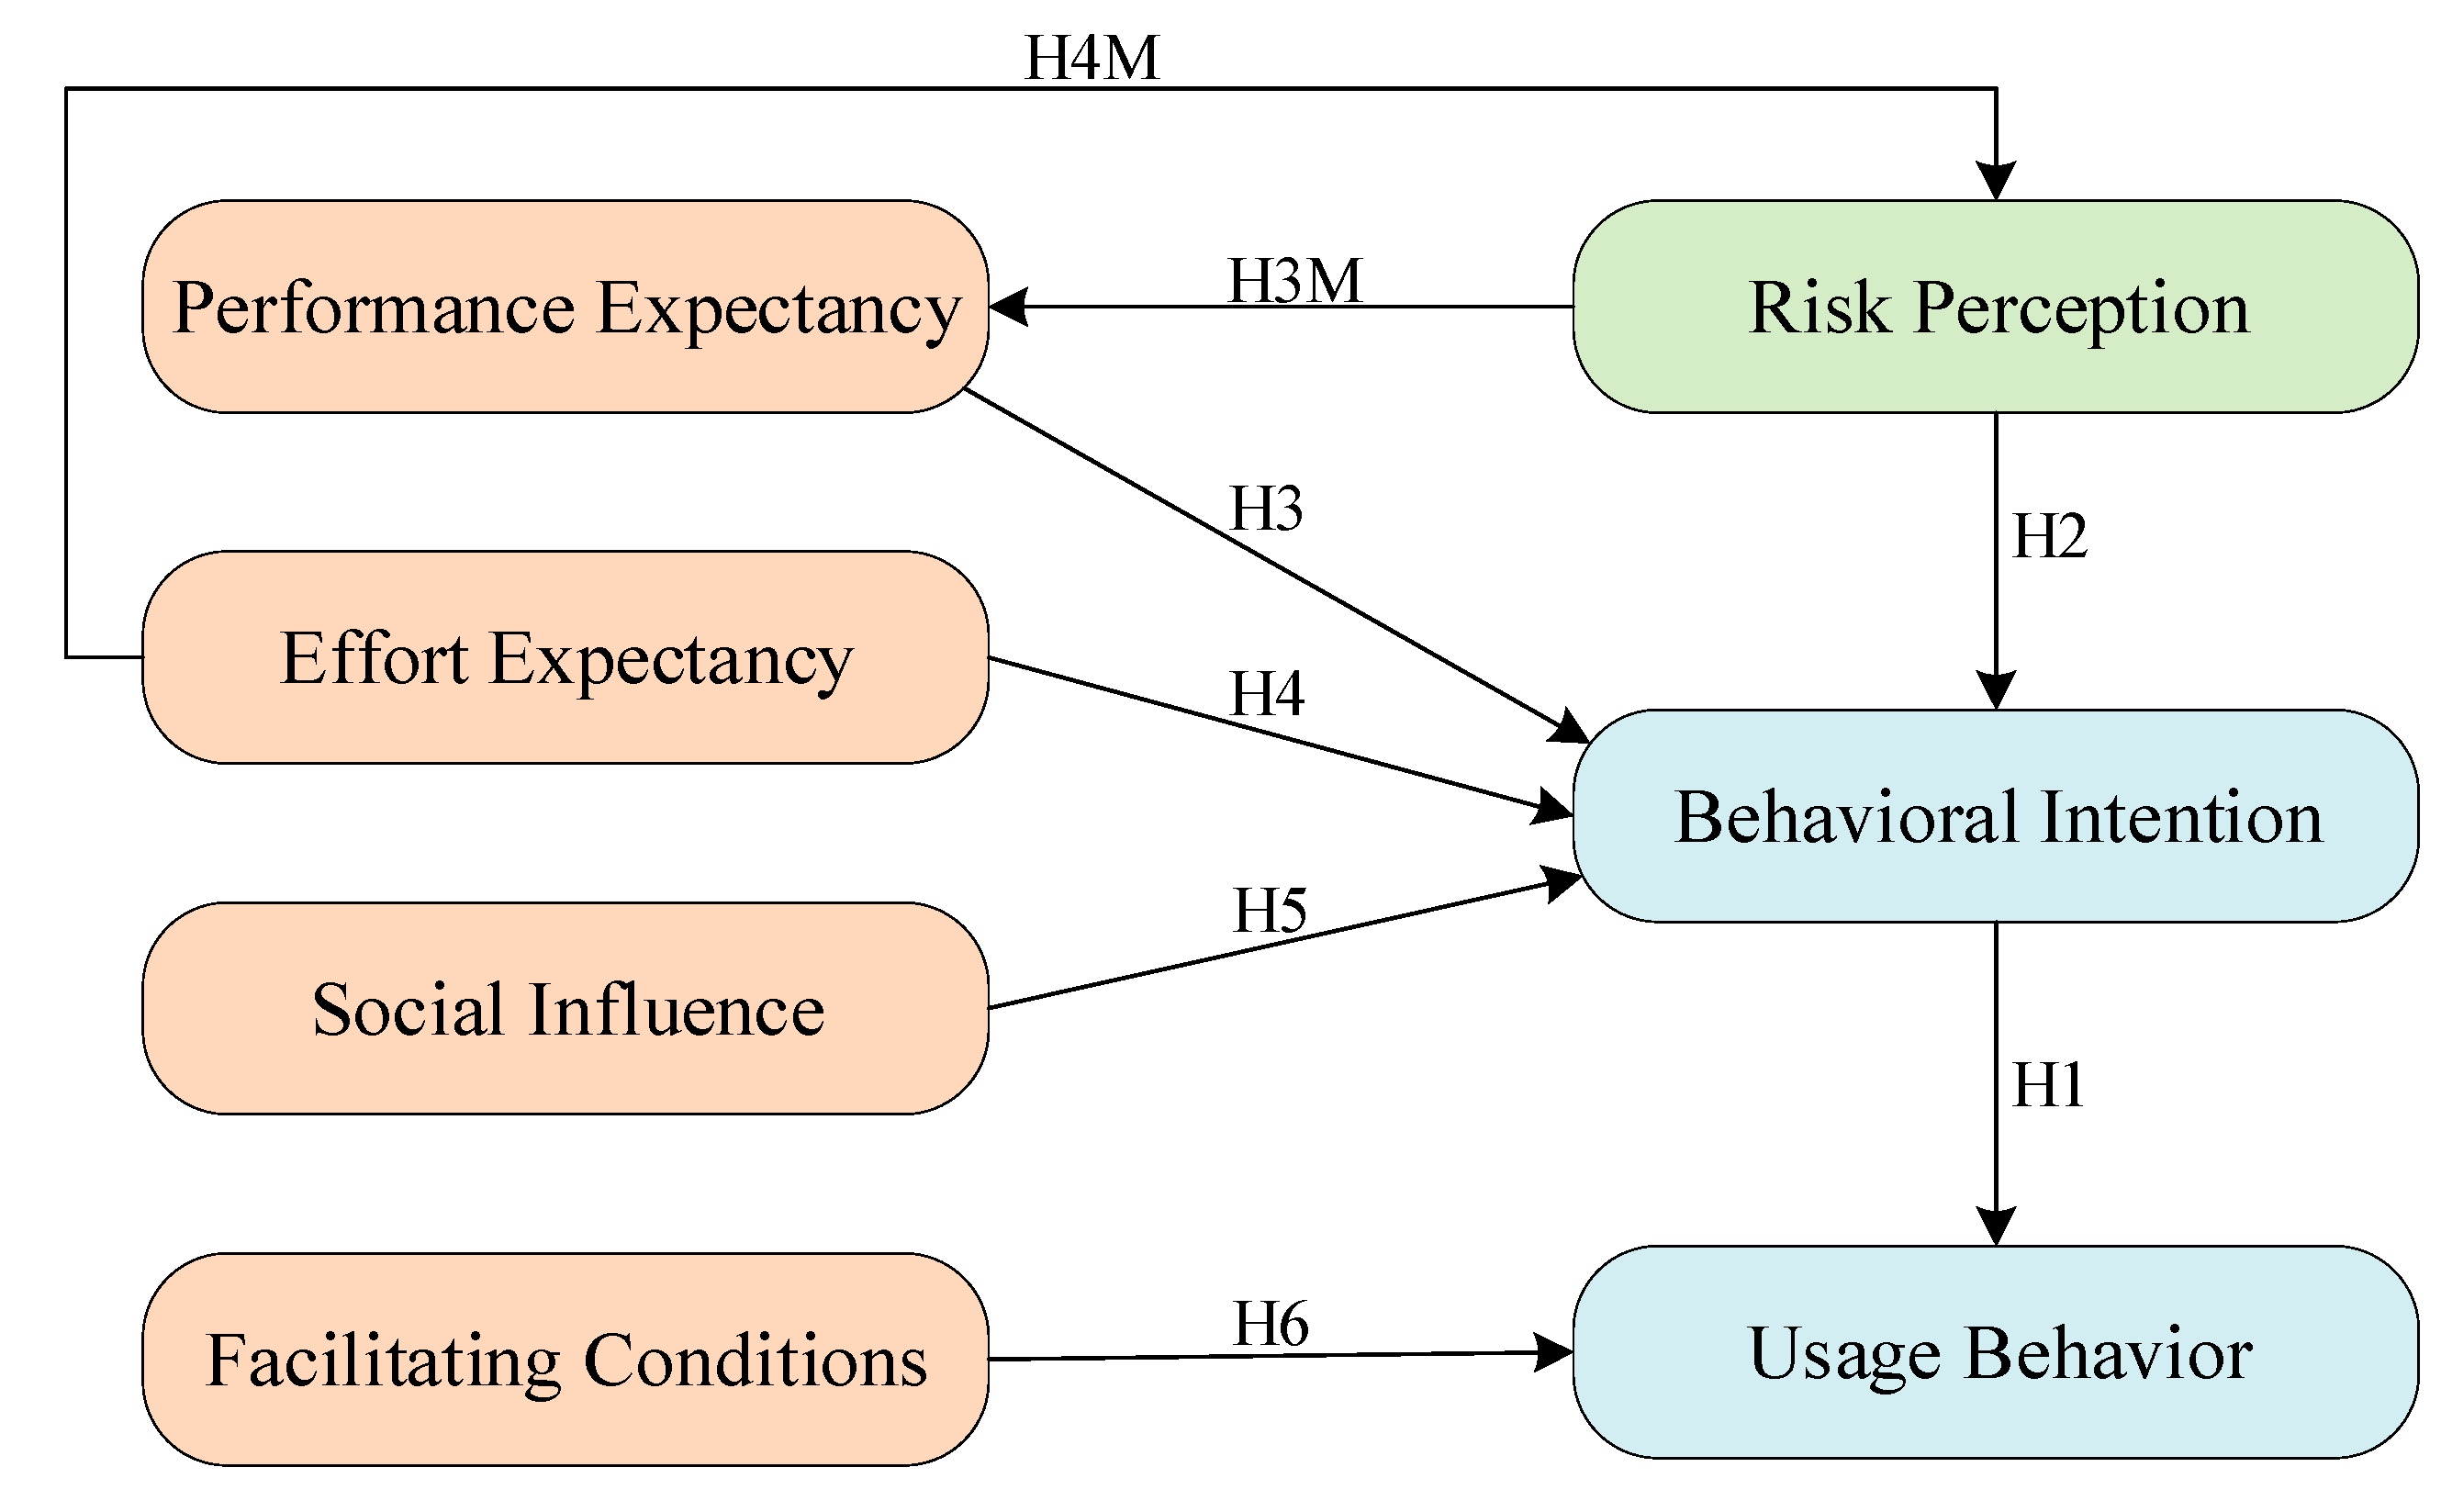
2. Theory and Hypotheses

2.1. Unified Theory of Acceptance and Use of Technology

The Unified Theory of Acceptance and Use of Technology (UTAUT) is often used to determine the predictors affecting technology acceptance. This model has been proven to have good predictability [21]. There are many factors related to technology adoption that can affect usage behavior. It involves four key determinants: performance expectancy, effort expectancy, social influence, and facilitating conditions. Behavioral intention is determined by three factors: performance expectation, effect expectation, and social influence. In addition, facilitating conditions affect usage behavior. The main model [22] is rooted in the traditional technology acceptance model (TAM) [23]. Based on the conceptual and empirical similarity of the eight classical models [19], they are integrated into a single model, making the UTAUT an important model for studying the adoption of technology [24,25]. In agriculture, the UTAUT has been used to study farmers’ intentions and behavior in using technologies such as Internet of Things technologies [17,18], electronic commerce [15,20], communication technologies [14,16], smartphone [26], and energy project payments [19]. However, to our knowledge, the UTAUT has rarely been applied in the field of green agricultural techniques, so this area is worth exploring. Therefore, this paper contributes to the literature in this area by using the UTAUT to study the intention and behavior of Chinese tea farmers in adopting green control techniques. More importantly, this paper introduces the risk perception of pests and diseases based on the original UTAUT to analyze the effect of risk perception on the adoption of green control techniques. Figure 1 shows the conceptual framework.

2.2. Behavioral Intention and Usage Behavior

Behavioral intention means the intention degree of using and applying new techniques, which is also defined as the probability for someone to make a conscious plan to achieve future certain behaviors [27]. Usage behavior refers to the actual degree of users’ technique adoption [22]. In many behavioral theoretical models, behavioral intention is a good factor for behavioral prediction [23,28,29]. The increasing studies confirmed that when people have a stronger intention to use technology, they are more likely to use it [17,19,22,24]). Thus, this study puts forward a hypothesis as follows:
Hypothesis 1 (H1).
Behavioral intention has a positive effect on farmers’ usage behavior of green control techniques.

2.3. Risk Perception

Risk perception is defined as the perception of adverse consequences caused by an individual engaging in a specific activity (such as using a specific technique) under uncertain conditions [30,31]. It is regarded as an important factor in predicting human behavior. Some scholars introduced the variable of risk perception into the UTAUT framework and discussed the effect. For instance, Khatimah [32] added the variable of risk perception into the UTAUT model, indicating that risk perception would have an impact on people’s behavioral intentions. Chen [33] studied the potential application of mobile payment and found that the risk perception of people is the direct reason why they have the intention to use mobile phones.
Pest disease is considered to be the one of biggest risks faced by farmers because it will have a decisive impact on their output and income. To control pests and diseases and reduce yield losses, they will apply pesticides. Pingali [34] studied the rice production behavior of farmers in the Philippines and found that farmers often apply excessive pesticides to avoid the risk of pests and diseases. Liu and Huang [35] also indicated that farmers with higher risk perception would choose to apply more pesticides in planting. However, such behavior would cause great damage to the environment. That is, in the face of greater risks, farmers’ lower awareness of environmental protection may be one of the reasons for the low intention to adopt green control techniques. Additionally, the research of Chu and Li [36] showed that the degree of farmers’ risk preference also affects their behavior in adopting green control techniques. Preferred risk farmers can accept the uncertainty of adopting new techniques and have more intention to apply them. Therefore, this study adds the variable of risk perception of pests and diseases into the UTAUT framework to understand farmers’ techniques adoption behavior. The hypothesis is proposed as follows:
Hypothesis 2 (H2).
Risk perception has a negative effect on the behavioral intention of green control techniques.

2.4. Performance Expectancy

Performance expectancy is the degree to which farmers believe that the use of green control technologies can help them obtain benefits [22]. Performance expectation is the one of strongest predictors of behavior intention of techniques adoption. It is important in predicting farmers’ adoption of techniques [37,38]. Many studies confirmed that performance expectancy can positively influence people’s technology adoption [39,40,41,42,43,44]. For example, Hans et al. [45] showed that if techniques can bring higher efficiency, the intention of farmers to adopt it will be stronger. Liu and Wang [10] found that the more useful farmers feel when using techniques, the stronger their behavioral intention.
Moreover, farmers generally have limited knowledge of green control techniques, and they are uncertain about their performance. For instance, Martins et al. [46] indicated that when people perceive a high risk, they may think the convenience brought by Internet banking is not so strong, so their behavioral intention is low. Tai and Ku [47] believed that when stock investors trade stocks through mobile devices, they are required to provide some private information, which may be used by some hackers for improper operations. Therefore, when investors are aware of the risks, they may decide to give up the potential benefits of using mobile stock trading. Most of the current studies have shown that when people perceive a high risk of using such a system or technology, they feel that the benefits of the system will decline. In this study, if farmers perceive a higher risk of pests and diseases, they would not believe that green control techniques produce significant performance effects, thereby leading to a lower intention to use them. Therefore, this study presents two hypotheses as follows:
Hypothesis 3 (H3).
Performance expectancy has a positive effect on behavioral intention to use green control techniques.
Hypothesis 3M (H3M).
Performance expectancy of green control techniques mediates the effect of risk perception on the behavioral intention of green control techniques.

2.5. Effort Expectancy

Effort expectancy is the perceived ease associated with the use of techniques [22]. It comes from the TAM model and is adapted from “perceived ease of use”. Some scholars found that effort expectancy positively impacts behavioral intention [43,48,49]. Davis et al. [50] and Sorebo and Eikebrokk [51] found that farmers’ intentions would be higher when they think that the difficulty of applying the techniques is small. Paul et al. [52] found that technical training can help farmers to learn how to use new techniques, make farmers have more confidence in adopting green control techniques, and improve their intention to use them. Liu et al. [53] believed that when farmers’ efforts to use this technology are low, they will have more intention to adopt it. In this study, when farmers feel that the techniques are easier to use, they could be more inclined to continue to use the techniques.
However, risk perception might play a mediating role in the effect of effort expectancy on behavioral intention. If farmers believe that tea plants are greatly susceptible to pests and diseases, they would take strong measures to control them. That is, they would apply more chemical pesticides to protect tea plants from pests and diseases rather than adopting green control techniques. Although tea farmers perceive that green control techniques are easy to use, they also believe that green control techniques are not very effective in controlling pests and diseases due to their strong risk perception. Therefore, two hypotheses are proposed as follows:
Hypothesis 4 (H4).
Effort expectancy has a positive effect on the behavioral intention of green control techniques.
Hypothesis 4M (H4M).
Risk Perception of pests and diseases mediates the effect of effort expectancy on the behavioral intention of green control techniques.

2.6. Social Influence

Social influence is the influence of important people around you or people who have a great influence on you to use techniques. Social influence has been confirmed that it has a significant effect on the behavioral intention of technique use [54,55,56], and it is an important driver for technique adoption [57]. Zeng et al. [58] stated that the popularization of green techniques is the formation of social consensus. Wu et al. [59] found that farmers who are more affected by the behavior of the agricultural techniques extension department and neighbors have a greater intention to adopt green techniques. Moreover, the long-term interaction between farmers enhances the sense of identity in techniques. They are more vulnerable to the influence of their neighbors’ behavior because of the existence of connecting power. Tzeling et al. [60] indicated that the frequency of communicating with neighbors would significantly affect their behavior and decision making. Liu et al. [53] indicated that neighbors have an impact on farmers’ intention to adopt green control techniques. That is, farmers, government, agricultural technicians, rural neighborhoods, and so on will have an impact on farmers’ adoption intention. Therefore, a hypothesis is posed as follows:
Hypothesis 5 (H5).
Social influence has a positive effect on the behavioral intention of green control techniques.

2.7. Facilitating Conditions

Facilitating conditions refer to a system that individuals think has certain technical and organizational conditions to facilitate the use of the system [22]. In the UTAUT framework, it has a smaller impact on behavioral intention [22], but it has an impact on the actual use of the system or techniques [48,61]. When the government provides equipment and technical support, farmers will be inclined to use the techniques. The agricultural subsidy policies implemented by the government can greatly influence the green production behavior of farmers [62,63]. That is, green control techniques may be widely implemented in tea planting if there are available facilities and resources to support farmers’ use. Thus, this study puts forward a hypothesis as follows:
Hypothesis 6 (H6).
Facilitating conditions have a positive effect on farmers’ behavioral intention of green control techniques.

3. Methodology

3.1. Questionnaire Design

The questionnaire consists of three parts: the first part is the basic information on demographic characteristics, and their planting and technology adoption behavior will be investigated. The second part is the core of the questionnaire, and questions are set under each of the 7 items. The third part mainly enquires about the tea harvest and income as well as the feeling of using green control techniques. The investigation design of four constructions (performance expectancy, effort expectancy, social influence, facilitating conditions) of the UTAUT is designed by referring to the research of previous literature [22,64,65]. Each item is designed with about 4 to 5 questions, using seven variables of a 5-point Likert scale (1 = strongly agree, 5 = strongly disagree). Due to commonly used in behavioral research, the Likert scale is chosen to organize the perception and subjective evaluation of technology adoption of respondents, and the structural equation model (SEM) is used in further statistical analysis. Appendix A presents the details of the questionnaire.

3.2. Data Collection

During the period between May and October 2019, this paper used stratified random sampling to randomly select nine prefecture-level cities from the main tea-producing regions in Sichuan, including Chengdu, Yaan, Leshan, Mianyang, Yibin, Bazhong, Meishan, Leshan, and Guangyuan. Then, two or three counties with a high concentration of business entities are selected in each city, and one or two townships are chosen in each county. The survey initially targeted two groups of tea farmers: green control techniques adopters and non-adopters, and the two-stage stratified random sampling procedure was applied. In the first step, using the information offered by the agricultural departments of the townships, the villages in each sample township were divided into two categories: green prevention and control demonstration villages and non-demonstration villages. Based on the principle of stratified random sampling, we selected one or two green prevention and control demonstration villages in each sample township for sampling. To ensure strong comparability between the two types of villages, we also considered the economic conditions, transportation conditions, and tea production potential of each village. In the second step, we obtained the list of all tea growers in each sample village with the help of the village committee. We randomly selected ten tea farmers from the demonstration villages of green prevention and control and ten tea farmers from the non-demonstration villages. Professionally trained investigators interviewed tea farmers one-on-one and recorded questionnaire information. Finally, we received 800 questionnaires in total, and 747 valid questionnaires remained after removing invalid questionnaires.

3.3. Data Analysis

The Smart-PLS 3.0 application is used to model a structural equation in this study. PLS-SEM (partial lead squares structural equation modeling) offered a structural equation modeling method, which integrates the advantages of principal component analysis, linear regression analysis, and typical correlation analysis. It is suitable for small data and large correlations. It has a higher statistical function, which is more conducive to the exploration and development of theoretical models. In addition, it takes into account the sample size, measurement range, and residual distribution. We divide it into two parts: the first part measures the validity and reliability of the research model and determines the fit. The second part is to test the structural relationship between latent variables to verify our hypotheses.

4. Results

4.1. Sample Characteristics

A total of 747 valid samples (Table 1) were collected from people from all over China, including 442 males (59.2%) and 691 middle-aged and elderly people over 49 (65.7%). Of these, 444 (59.5%) respondents have less than nine years of education, which accounts for more than half of the sample size. Most of the respondents were not cadres (92.6%). According to the results of mean and variance (see Table 2), respondents tend to associate high effort expectations with tea planting (M = 3.704, SD = 0.628) because their mean value is the highest and standard deviation is the lowest. There is little difference between the mean values of risk perception (M = 2.772, SD = 0.863), performance expectancy (M = 3.214, d = 0.880), and social influence (M = 2.301, SD = 0.705), and the standard deviation is relatively small. The mean value and standard deviation of intention are relatively small, indicating that respondents’ intention to use green control techniques is not so strong (M = 2.183, SD = 0.766).

4.2. Reliability and Validity
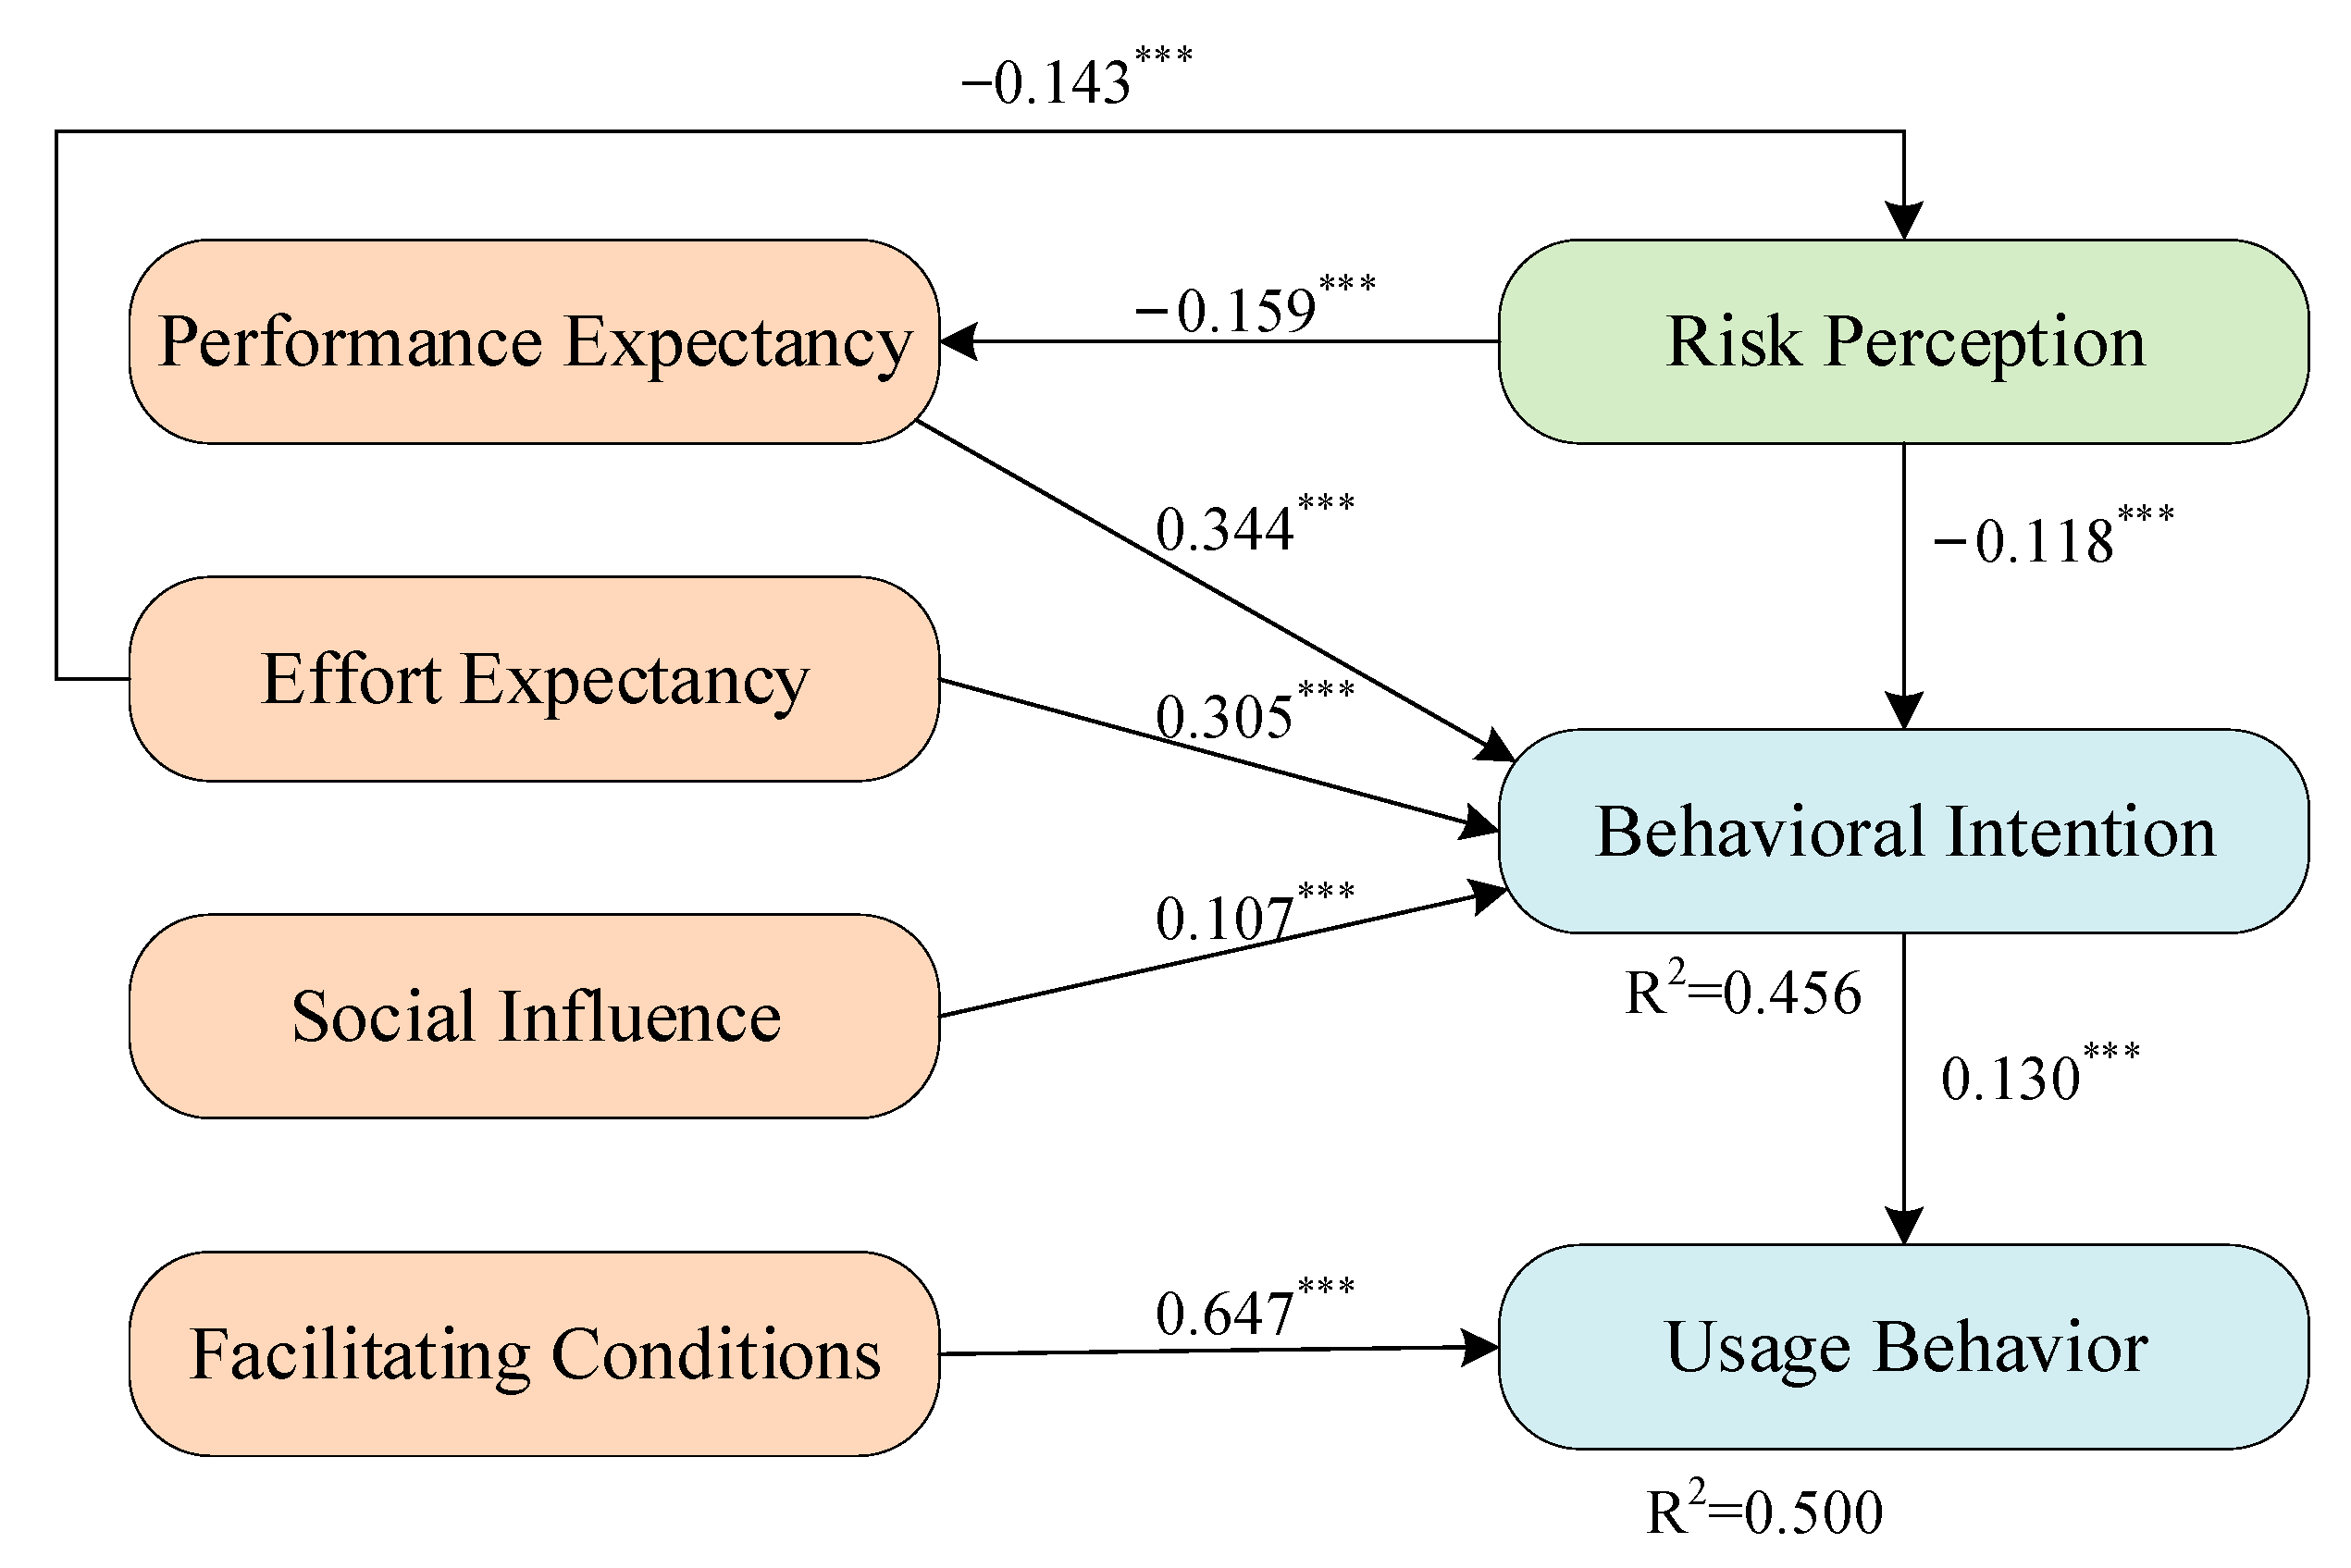
Table 3 presents the results of descriptive statistics. Cronbach’s Alpha (CA) is a good parameter to measure the model’s internal consistency. When the CA value is greater than 0.7, it is proved to be reliable [66]. According to the results, the CA values of all constructs are greater than 0.7, confirming that the model is consistent and reliable. The Composite Reliability (CR) value can also be used to measure the reliability of constructs, which is considered to be more advisable for measuring reliability than CA while using the PLS-SEM model [67]. In Table 3, all CR values are over 0.8, which meets the critical value standard of 0.7, indicating good reliability [68]. In addition, convergence validity can be used to test the degree of aggregation or correlation among indicators of the same construct, and greater than 0.5 indicates convergence validity. All AVE values except risk perception (0.582) in the results are bigger than 0.7, suggesting the results have a good convergence validity. The Fornell–Larcker criterion is often applied to judge discrimination reliability [69]. The bold part of the diagonal is the root sign value of AVE, which is required to be greater than the correlation coefficient with other constructs. According to these results, all of them conform to this rule, showing there is no evidence for the lack of discrimination validity.
Moreover, we obtain the autocorrelation result between each construct by checking the multicollinearity of them [67]. Variance Inflation Factor (VIF) is an indicator to measure the degree of multicollinearity in the multiple linear regression model. The VIF value greater than 5 indicates strong multicollinearity. Therefore, we eliminated the questionnaire items that do not meet the VIF standard. Finally, the coefficient of VIF of all variables is greater than 0.2 and less than 5, and the multicollinearity problem can be avoided.

4.3. Path Analysis

Path analysis was carried out by the SEM, and the results of path analysis are reported in Table 4 and Figure 2. First, the coefficient value of behavioral intention (H1) is 0.130 (p < 0.000), suggesting that behavioral intention has a positive effect on usage behavior. Its f2 value is 0.029, meaning that the effect is small. Second, risk perception (H2) is 0.118 (p < 0.000), which also confirms that risk perception harms behavioral intention. Its f2 value is 0.025, indicating that it has a small influence on behavioral intention. Third, the coefficient value of performance expectancy (H3) is 0.344 (p < 0.000), which means it can positively affect behavioral intention. The f2 value of performance expectancy is 0.128, indicating that performance expectancy has a moderate impact on behavioral intention. Fourth, the coefficient value of effort expectancy (H4) is 0.305 (p < 0.000) with an f2 value of 0.09, implying that effort expectancy positively affects behavioral intention, but the impact is weaker. Lastly, social influence (H5) has a small impact on behavioral intention because the coefficient value of 0.107 with an f2 value of 0.015 is the lowest. The R2 of behavioral intention suggests that risk perception, performance expectancy, effort expectancy, and social influence explain the 45.3% effect of green control techniques adoption intention.
Concerning usage behavior, we found that facilitating conditions have a significant positive influence on usage behavior (H6). The coefficient is the highest at 0.647 (p < 0.000), and its f2 value is also the highest at 0.712, suggesting a strong influence on usage behavior. In addition, the coefficient value of behavioral intention to usage behavior is 0.130 (p < 0.000), meaning that it can positively impact usage behavior but the impact is weak because of the small f2 value. The standardized regression coefficients indicate that both facilitating conditions and behavioral intention could positively impact the usage behavior significantly, but the effect of facilitating conditions is higher than expected.

4.4. Mediating Effect

In the mediating model, we put forward two hypotheses and show their indirect effect coefficients and confidence intervals. Bootstrap (n = 5000) is used to test the mediating effect of effort expectancy mediating risk perception on behavioral intention and effort expectancy mediating risk perception on behavioral intention. The standard of the test is to see whether the confidence interval contains 0. If it does, the original hypothesis should be rejected. Results indicate that significant moderations were triggered by performance effort on the paths between risk perception and behavioral intention. Risk perception also mediates the relationship between effort expectancy and behavioral intention. As shown in Table 5 and Figure 2, risk perception (H3M) has a significant indirect effect on behavioral intention (95% CI −0.237 to −0.078), and the hypothesis is accepted. Additionally, performance expectancy negatively moderates the interaction between risk perception and behavioral intention with an f2 value of 0.023. H4M also confirmed that the indirect effect of effort expectancy on behavioral intention can be mediated by risk perception, which is also statistically significant (95% CI −0.222 to −0.062). Both hypotheses of the mediation effect are proved.

5. Discussion

In China, pesticide overuse has become a major source of environmental pollution. As the main users of pesticides, farmers’ pesticide use behavior is directly related to environmental pollution. Generally speaking, most farmers are risk-averse and have little knowledge about the safe use of pesticides, which encourages farmers to use pesticides in excess [6]. Data from the National Bureau of Statistics show that before 2015, pesticide use in China was on a trend of increasing year by year. In order to curb the excessive use of chemical pesticides and ensure the quality and safety of agricultural products and ecological sustainability, the government introduced the Zero Growth Action Plan for Pesticide Use by 2020 in 2015, which clearly stated that it was necessary to accelerate the transformation of pest prevention and control methods and vigorously promote green control techniques. Although the policy of pesticide use reduction has generated significant benefits in the past five years, farmers have not been very active in adopting green control techniques. This may be because green control techniques are a new alternative technique to green agriculture, requiring farmers to have the relevant knowledge and operational skills. However, the diffusion of green control techniques is difficult. In the case of the tea industry, most tea production areas are in the mountains. Due to the closed information, farmers cannot keep informed of the outside world’s environmental protection concepts and new agricultural technologies. At the same time, most farmers have a low level of education and have great difficulties in learning new knowledge and mastering new techniques. Tea is one of the special agricultural products in China, with a high economic value. Tea plants are vulnerable to pests and diseases, causing huge production losses. However, excessive use of pesticides can lead to excessive pesticide residues in tea, which brings disadvantages to farmers’ income and ecological environment. Therefore, it is important to study the intention and behavior of tea farmers to adopt green control techniques for the development of the tea industry and green agriculture.
This paper examines Chinese tea farmers’ intention and behavior to use green control techniques in the extended UTAUT framework and obtains some useful findings. First, performance expectancy, effort expectancy, and social influence have a positive effect on farmers’ behavioral intention to use green control technologies, which is consistent with the prediction of the classical UTAUT [10,19,42,43,44,70]. That is, the usefulness of techniques, perceived ease, and the influence of surrounding people will affect their adoption intention. In addition, risk perception of pests and diseases can reduce farmers’ behavioral intention to adopt green control techniques. Most farmers are risk-averse, and if they perceive a high pest threat, they would take strong measures to control pests and diseases (e.g., applying large amounts of pesticides) rather than adopting new green control techniques with uncertainty [34,36]. In addition, facilitating conditions can promote farmers to use green control techniques, which is consistent with the findings of Venkatesh et al. [22], Sykes et al. [61], and Nistor et al. [48]. Facilitating conditions including infrastructure, technical support, and financial subsidies can encourage farmers to use green control techniques [62,63]. Furthermore, this paper also tests two mediating mechanisms. On the one hand, the effect of risk perception on behavioral intention is mediated by performance expectancy. When the perceived risk is high (pests and diseases seriously threaten the quality and yield of tea), farmers tend to perceive green control techniques as being of little use [46,47]. Therefore, technicians need to focus on improving the performance of green control techniques to effectively prevent pests and diseases while protecting the environment. On the other hand, the effect of effort expectancy on behavioral intentions is mediated by risk perception. Easier use of the technique can lead tea farmers to perceive it as not effective enough for control, thus reducing their intention to adopt it.
Therefore, the government should strengthen policy incentives to promote the effective implementation of green control techniques. For example, appropriate subsidies and support should be given to farmers who use green control techniques, thereby enhancing their adoption intention of green agricultural techniques [71,72]. In addition, they should also pay attention to the introduction and promotion of green control techniques, expanding farmers’ scope of adopting new techniques, and improving farmers’ acceptance and recognition. Moreover, technology training should be conducted to reduce the usage difficulty of green control techniques. The most effective way to promote agricultural techniques is to carry out field schools [73]. Furthermore, the social learning function and information channel function of the social network is very important for adoption behavior [74]. Thus, it is also necessary to establish a good social learning network in the local area.

6. Conclusions

This paper explores the intention and behavior of tea farmers to use green control techniques in the UTAUT framework. The results showed that risk perception of pests and diseases can negatively impact the behavioral intention of green control techniques. Performance effect, effort expectancy, and social influence can enhance behavioral intention significantly, and facilitating conditions has a positive on usage behavior. In addition, performance expectancy plays a mediating role between risk perception and behavioral intention, while risk perception mediates the effect of effort expectancy on behavioral intention. Finally, some policy implications for promoting the diffusion and application of green control techniques are presented in the discussion section based on these findings.
Of course, the findings of our study may not be exactly generalizable, but they could at least provide some policy insights for promoting green agriculture in Asian countries with predominantly small-scale agriculture. Moreover, we have to acknowledge that this study has some limitations. First, this study is one of the few contributing to research on green control techniques adoption in tea planting. Some studies about green control techniques added factors such as environmental policy, environmental tax, carbon emissions, supply chain, and so on, and this paper mainly considers the risk perception from farmers’ perspectives. Therefore, we can also consider new factors to study farmers’ micro behavior in the future. Second, some of the population characteristics in this study are relatively dense. For example, most of the samples are middle-aged people and people who are not cadres, so future research can be more decentralized in selecting samples. Third, due to the complexity of China’s agricultural management system, the types of farmers are mainly small farmers, family farms, and agricultural cooperatives. Their intention toward the adoption of green control techniques would be different. As a result, different types of farmers could be studied in the future.

Author Contributions

Conceptualization, H.H. and H.L.; methodology, H.L.; software, H.H.; validation, H.L., H.H. and A.C.; formal analysis, A.C. and S.C.; investigation, H.H.; resources, H.H.; data curation, S.C.; writing—original draft preparation, S.C. and A.C.; writing—review and editing, H.H., H.L. and A.C.; visualization, A.C.; supervision, H.H. and H.L.; project administration, H.H. and H.L.; funding acquisition, H.H. All authors have read and agreed to the published version of the manuscript.

Funding

This work research was funded by a project of the National Social Science Foundation of China (21BGL022); a project of Sichuan Center for Rural Development Research: Study on the mechanism and welfare effect of farmers’ adoption of green prevention and control technology (CR2108).

Institutional Review Board Statement

Not applicable.

Informed Consent Statement

Not applicable.

Data Availability Statement

The data presented in this study are available within the article.

Conflicts of Interest

The authors declare no conflict of interest.

Appendix A

Table A1. Survey Instrument.
CodeQuestions
Performance Expectancy (1. Strongly Disagree to 5. Strongly Agree)
PE-1I think green control techniques can reduce pesticide residues in tea
PE-2I think the use of green control techniques can improve the quality of tea
PE-3I think the use of green control techniques can reduce environmental pollution
PE-4I think using green control techniques is good for my health and safety
PE-5I think the use of green control techniques can effectively control pests and diseases
Effort Expectancy (1. Strongly Disagree to 5. Strongly Agree)
EE-1I think it’s useful to use green control techniques
EE-2I think green control techniques are easy to use
EE-3I can easily learn to use green control techniques
EE-4I think it’s easy for me to know how to use green control techniques through the manual
EE-5I think it’s easy to learn how to use green control techniques from skilled people
Social Influence (1. Strongly Disagree to 5. Strongly Agree)
SI-1My neighbors all suggested that I use green control techniques
SI-2Family members also supported me in using green control techniques
SI-3My close friends also helped me use green control techniques
SI-4Relevant government personnel also encouraged me to use green control techniques
SI-5Because other tea farmers are also using green control techniques, I also want to use
Facilitating Conditions (1. Strongly Disagree to 5. Strongly Agree)
FC-1I have the necessary knowledge to use green control techniques
FC-2I have the necessary resources to use green control techniques
FC-3The government provided me with enough green control techniques training
FC-4If I encounter difficulties in using green control techniques, someone or an organization will assist me
FC-5I often learn about green control techniques in mass media such as TV, the Internet, or radio
Risk Perception (1. Strongly Disagree to 5. Strongly Agree)
RP-1Pest diseases are frequent in my area
RP-2Pest disease in my area will threaten the quality of tea
RP-3Pest disease in my area will threaten tea production
RP-4Pest diseases in my area are difficult to control
Behavior Intention (1. Strongly Disagree to 5. Strongly Agree)
BI-1I would love to use green control techniques
BI-2For me, using green control techniques is a good thing
BI-3It’s a pleasure for me to use green control techniques
BI-4For me, using green control techniques is a wise thing
BI-5I will try to recommend green control techniques to others
Use Behavior (1. Strongly Disagree to 5. Strongly Agree)
UB-1I often use green control techniques in the process of tea production
UB-2I will always summarize the experience of using green control techniques
UB-3I have mastered the use skills of green control techniques
UB-4I have the intention to guide others to use green control techniques
UB-5I will continue to use green control techniques in the future

References

  1. Benn, J.A. Tea in China: A Religious and Cultural History; University of Hawaii Press: Honolulu, HI, USA, 2015. [Google Scholar]
  2. Nair, K.P. Tea (Camellia sinensis L.). In Tree Crops; Springer: Berlin/Heidelberg, Germany, 2021. [Google Scholar]
  3. Mamun, M.S.A.; Ahmed, M.; Paul, S.K. Integrated approaches in tea pest management for sustainable tea production. In Proceedings of the Workshop on Tea Production Technology Updated, Dhaka, Bangladesh, 24 December 2014; Bangladesh Tea Research Institute: Dhaka, Bangladesh; Srimangal, Moulvibazar and Krishi Gobeshona Foundation: Dhaka, Bangladesh; BARC Campus: Dhaka, Bangladesh, 2014; Volume 24, pp. 18–32. [Google Scholar]
  4. Ye, G.-Y.; Xiao, Q.; Chen, M.; Chen, X.-X.; Yuan, Z.-J.; Stanley, D.W.; Hu, C. Tea: Biological control of insect and mite pests in China. Biol. Control 2014, 68, 73–91. [Google Scholar] [CrossRef]
  5. Khan, M.; Mahmood, H.Z.; Damalas, C.A. Pesticide use and risk perceptions among farmers in the cotton belt of Punjab, Pakistan. Crop Prot. 2015, 67, 184–190. [Google Scholar] [CrossRef]
  6. Khan, M.; Damalas, C.A. Factors preventing the adoption of alternatives to chemical pest control among Pakistani cotton farmers. Int. J. Pest Manag. 2014, 61, 9–16. [Google Scholar] [CrossRef]
  7. Koleva, N.G.; Schneider, U.A.; Mccarl, B.A. Pesticide externalities from the US agricultural sector–The impact of internalization, reduced pesticide application rates, and climate change. Procedia Environ. Sci. 2011, 6, 153–161. [Google Scholar] [CrossRef] [Green Version]
  8. Timprasert, S.; Datta, A.; Ranamukhaarachchi, S. Factors determining adoption of integrated pest management by vegetable growers in Nakhon Ratchasima Province, Thailand. Crop Prot. 2014, 62, 32–39. [Google Scholar] [CrossRef]
  9. Matthews, G.; Pesticides, A. IPM and training. Phytoparasitica 1999, 27, 253–256. [Google Scholar] [CrossRef]
  10. Liu, Y.F.; Wang, X.L. Effects of risk aversion and income on farmer adoption of integrated pest management (IPM) technology. Jiangsu Agric. Sci. 2013, 41, 396–398. (In Chinese) [Google Scholar]
  11. Fernandez-Cornejo, J.; Beach, E.D.; Huang, W.-Y. The Adoption of IPM Techniques By Vegetable Growers in Florida, Michigan and Texas. J. Agric. Appl. Econ. 1994, 26, 158–172. [Google Scholar] [CrossRef] [Green Version]
  12. Li, L.; Dingyi, S.; Xiaofang, L.; Zhide, J. Influence of peasant household differentiation and risk perception on soil and water conservation tillage technology adoption- an analysis of moderating effects based on government subsidies. J. Clean. Prod. 2020, 288, 125092. [Google Scholar] [CrossRef]
  13. Pingali, P.L.; Marquez, C.B.; Palis, F.G. Pesticides and Philippine Rice Farmer Health: A Medical and Economic Analysis. Am. J. Agric. Econ. 1994, 76, 587–592. [Google Scholar] [CrossRef]
  14. Kahenya, W.D.; Sakwa, M.; Iravo, M. Assessing use of information communication technologies among agricultural extension workers in Kenya using modified UTAUT model. Int. J. Sci. Basic Appl. Res. 2014, 16, 11–22. [Google Scholar]
  15. Malima, G.; Bukaza, C.; Faustine, K. Farmers’ acceptance behaviour in using mobile phones for agricultural marketing in Iringa Region, Tanzania. Int. J. Manag. 2015, 4, 20–45. [Google Scholar] [CrossRef]
  16. Mahamood, A.F.; Mohammed, R.; Ahmad, M.K.; Ridzuan, A.H.; Hamzah, M.R.; Abdullah, S.; Shaffril, H.A. Applying diffusion of innovation theory and unified theory of acceptance and use of technology (UTAUT) on farmers’ use of communication technology. J. Hum. Dev. Commun. 2016, 5, 27–40. [Google Scholar]
  17. Ronaghi, M.H.; Forouharfar, A. A contextualized study of the usage of the Internet of things (IoTs) in smart farming in a typical Middle Eastern country within the context of Unified Theory of Acceptance and Use of Technology model (UTAUT). Technol. Soc. 2020, 63, 101415. [Google Scholar] [CrossRef]
  18. Kang, D.B.; Chang, K.J.; Lee, Y.K.; Jeong, M.U. A study on the effects of changes in smart farm introduction conditions on willingness to accept agriculture-application of extended UTAUT model. Korean J. Org. Agric. 2020, 28, 119–138. [Google Scholar]
  19. He, K.; Zhang, J.; Zeng, Y. Households’ willingness to pay for energy utilization of crop straw in rural China: Based on an improved UTAUT model. Energy Policy 2020, 140, 111373. [Google Scholar] [CrossRef]
  20. Dongsheng, L.I.; Yulian, Y. Research on Farmers’ Adoption Intention to E-Commerce of Agricultural Products Based on UTAUT Model. Converter 2021, 7, 947–957. [Google Scholar]
  21. Williams, M.D.; Rana, N.P.; Dwivedi, Y.K. The unified theory of acceptance and use of technology (UTAUT): A literature review. J. Enterp. Inf. Manag. 2015, 28, 443–488. [Google Scholar] [CrossRef] [Green Version]
  22. Venkatesh, V.; Morris, M.G.; Davis, G.B.; Davis, F.D. User acceptance of information technology: Toward a unified view. MIS Q. 2003, 27, 425–478. [Google Scholar] [CrossRef] [Green Version]
  23. Davis, F.D. Perceived usefulness, perceived ease of use, and user acceptance of information technology. MIS Q. 1989, 13, 319–340. [Google Scholar] [CrossRef] [Green Version]
  24. Keong, M.L.; Ramayah, T.; Kurnia, S.; Chiun, L.M. Explaining intention to use an enterprise resource planning (ERP) system: An extension of the UTAUT model. Bus. Strat. Ser. 2012, 13, 173–180. [Google Scholar] [CrossRef]
  25. Oh, J.-C.; Yoon, S.-J. Predicting the use of online information services based on a modified UTAUT model. Behav. Inf. Technol. 2014, 33, 716–729. [Google Scholar] [CrossRef]
  26. Michels, M.; Bonke, V.; Musshoff, O. Understanding the adoption of smartphone apps in crop protection. Precis. Agric. 2020, 21, 1209–1226. [Google Scholar] [CrossRef]
  27. Warshaw, P.R.; Davis, F.D. Disentangling behavioral intention and behavioral expectation. J. Exp. Soc. Psychol. 1985, 21, 213–228. [Google Scholar] [CrossRef]
  28. Fishbein, M.; Ajzen, I. Belief, Attitude, Intention, and Behavior: An Introduction to Theory and Research. Philos. Rhetor. 1977, 6, 244–245. [Google Scholar]
  29. Ajzen, I. The theory of planned behaviour. Organ. Behav. Hum. Decis. Processes 1991, 50, 179–211. [Google Scholar] [CrossRef]
  30. Forsythe, S.; Liu, C.; Shannon, D.; Gardner, L.C. Development of a scale to measure the perceived benefits and risks of online shopping. J. Interact. Mark. 2006, 20, 55–75. [Google Scholar] [CrossRef]
  31. Im, I.; Kim, Y.; Han, H.-J. The effects of perceived risk and technology type on users’ acceptance of technologies. Inf. Manag. 2008, 45, 1–9. [Google Scholar] [CrossRef]
  32. Khatimah, H.; Halim, F. Consumers’ intention to use e-money in Indonesia based on Unified Theory of Acceptance and Use of Technology (UTAUT). Am.-Eurasian J. Sustain. Agric. 2014, 8, 34–40. [Google Scholar]
  33. Chen, L.D. A model of consumer acceptance of mobile payment. Int. J. Mob. Commun. 2008, 6, 32–52. [Google Scholar] [CrossRef]
  34. Pingali, P.L. Impact of Pesticides on Farmer Health and the Rice Environment: An Overview of Results from a Multidisciplinary Study in the Philippines. In Natural Resource Management and Policy; Springer: Berlin/Heidelberg, Germany, 1995; pp. 3–21. [Google Scholar] [CrossRef]
  35. Liu, E.M.; Huang, J. Risk preferences and pesticide use by cotton farmers in China. J. Dev. Econ. 2013, 103, 202–215. [Google Scholar] [CrossRef] [Green Version]
  36. Chu, Y.; Li, H. An empirical analysis of the willingness of farmers to adopt integrated pest control technology: A case study of 402 farmers in Anhui Province. Cai Mao Yan Jiu 2014, 3, 57–65. (In Chinese) [Google Scholar]
  37. Ramayah, T.; Suki, N.M. Intention to use mobile PC among MBA Students: Implications for technology integration in the learning curriculum. UNITAR E-J. 2006, 2, 30–39. [Google Scholar]
  38. Tarhini, A.; Alalwan, A.A.; Al-Qirim, N.; Algharabat, R.; Masa’Deh, R. An Analysis of the Factors Influencing the Adoption of Online Shopping. Int. J. Technol. Diffus. 2018, 9, 68–87. [Google Scholar] [CrossRef]
  39. Moghavvemi, S.; Salleh, N.A.M.; Zhao, W.; Mattila, M. The entrepreneur’s perception on information technology innovation adoption: An empirical analysis of the role of precipitating events on usage behavior. Innovation 2012, 14, 231–246. [Google Scholar] [CrossRef]
  40. Lakhal, S.; Khechine, H.; Pascot, D. Student behavioural intentions to use desktop video conferencing in a distance course: Integration of autonomy to the UTAUT model. J. Comput. High. Educ. 2013, 25, 93–121. [Google Scholar] [CrossRef]
  41. Al-Qeisi, K.; Dennis, C.; Alamanos, E.; Jayawardhena, C. Website design quality and usage behavior: Unified Theory of Acceptance and Use of Technology. J. Bus. Res. 2014, 67, 2282–2290. [Google Scholar] [CrossRef] [Green Version]
  42. Faaeq, M.K.; Alqasa, K.; Al-Matari, E.M. Technology Adoption and Innovation of E-Government in Republic of Iraq. Asian Soc. Sci. 2014, 11, 135–145. [Google Scholar] [CrossRef] [Green Version]
  43. Awwad, M.S. Electronic library services acceptance and use: An empirical validation of unified theory of acceptance and use of technology. Electron. Libr. 2015, 33, 1100–1120. [Google Scholar] [CrossRef]
  44. Lu, N.L.; Nguyen, V.T. Online tax filing—E-Government service adoption case of Vietnam. Mod. Econ. 2016, 7, 1498–1504. [Google Scholar] [CrossRef] [Green Version]
  45. Bauer, H.H.; Reichardt, T.; Barnes, S.J.; Neumann, M.M. Driving consumer acceptance of mobile marketing: A theoretical framework and empirical study. J. Electron. Commer. Res. 2015, 6, 181–192. [Google Scholar]
  46. Martins, C.; Oliveira, T.; Popovič, A. Understanding the Internet banking adoption: A unified theory of acceptance and use of technology and perceived risk application. Int. J. Inf. Manag. 2014, 34, 1–13. [Google Scholar] [CrossRef]
  47. Tai, Y.M.; Ku, Y.C. Will stock investors use mobile stock trading? A benefit-risk assessment based on a modified UTAUT model. J. Electron. Commer. Res. 2013, 14, 67. [Google Scholar]
  48. Nistor, N.; Gŏğüş, A.; Lerche, T. Educational technology acceptance across national and professional cultures: A European study. Educ. Technol. Res. Dev. 2013, 61, 733–749. [Google Scholar] [CrossRef]
  49. Dwivedi, Y.K.; Shareef, M.A.; Simintiras, A.C.; Lal, B.; Weerakkody, V. A generalized adoption model for services: Across-country comparison of mobile health (m-health). Gov. Inf. Q. 2016, 33, 174–187. [Google Scholar] [CrossRef] [Green Version]
  50. Davis, F.D.; Bagozzi, R.P.; Warshaw, P.R. User acceptance of computer technology: A comparison of two theoretical models. Manag. Sci. 1989, 35, 982–1003. [Google Scholar] [CrossRef] [Green Version]
  51. Sørebø, Ø.; Eikebrokk, T.R. Explaining IS continuance in environments where usage is mandatory. Comput. Hum. Behav. 2008, 24, 2357–2371. [Google Scholar] [CrossRef]
  52. Paul, J.; Sierra, J.; Causeret, F.; Guindé, L.; Blazy, J.-M. Factors affecting the adoption of compost use by farmers in small tropical Caribbean islands. J. Clean. Prod. 2017, 142, 1387–1396. [Google Scholar] [CrossRef]
  53. Liu, Y.; Xiong, X.P.; Liu, H.Q.; Liu, E.Q. Research on Farmers willingness to adopt green control techniques and influencing factors: Empirical evidence from 348 farmers in Hunan Province. J. China Agric. Univ. 2015, 20, 263–271. (In Chinese) [Google Scholar]
  54. Nistor, N.; Baltes, B.; Dascălu, M.; Mihăilă, D.; Smeaton, G.; Trăuşan-Matu, Ş. Participation in virtual academic communities of practice under the influence of technology acceptance and community factors. A learning analytics application. Comput. Hum. Behav. 2014, 34, 339–344. [Google Scholar] [CrossRef] [Green Version]
  55. Khalilzadeh, J.; Ozturk, A.B.; Bilgihan, A. Security-related factors in extended UTAUT model for NFC based mobile payment in the restaurant industry. Comput. Hum. Behav. 2017, 70, 460–474. [Google Scholar] [CrossRef]
  56. Lian, J.-W.; Yen, D.C. Online shopping drivers and barriers for older adults: Age and gender differences. Comput. Hum. Behav. 2014, 37, 133–143. [Google Scholar] [CrossRef]
  57. Robinson, S.A.; Rai, V. Determinants of spatio-temporal patterns of energy technology adoption: An agent-based modeling approach. Appl. Energy 2015, 151, 273–284. [Google Scholar] [CrossRef] [Green Version]
  58. Zeng, Y.; Dong, P.; Shi, Y.; Wang, L.; Li, Y. Analyzing the co-evolution of green technology diffusion and consumers’ pro-environmental attitudes: An agent-based model. J. Clean. Prod. 2020, 256, 120384. [Google Scholar] [CrossRef]
  59. Wu, X.L.; Zhang, J.B.; He, K. Farmers’ willingness to adopt the effective pesticide spraying technology: Influencing factors and group heterogeneity. Zhongguo Nong Ye Da Xue Xue Bao 2016, 21, 137–148. (In Chinese) [Google Scholar]
  60. Tzeling, N.; Eheart, J.; Cai, X.M. An agent-based model of farmer decision-making and water quality impacts at the water shed scale under markets for carbon allowances and a second-generation biofuel crop. Water Resour. Res. 2011, 47, 113–120. [Google Scholar]
  61. Sykes, T.A.; Venkatesh, V.; Gosain, S. Model of Acceptance with Peer Support: A Social Network Perspective to Understand Employees’ System Use. MIS Q. 2009, 33, 371. [Google Scholar] [CrossRef]
  62. Espinosa-Goded, M.; Barreiro-Hurle, J.; Ruto, E. What Do Farmers Want from Agri-Environmental Scheme Design? A Choice Experiment Approach. J. Agric. Econ. 2010, 61, 259–273. [Google Scholar] [CrossRef]
  63. Chatzimichael, K.; Genius, M.; Tzouvelekas, V. Informational cascades and technology adoption: Evidence from Greek and German organic growers. Food Policy 2014, 49, 186–195. [Google Scholar] [CrossRef] [Green Version]
  64. Duyck, P.; Pynoo, B.; Devolder, P.; Voet, T.; Adang, L.; Vercruysse, J. User acceptance ofa picture archiving and communication system. Applying the unified theory of acceptance and use of technology in a radiological setting. Methods Inf. Med. 2008, 47, 149–156. [Google Scholar]
  65. Venkatesh, V.; Zhang, X. Unified theory of acceptance and use of technology: U.S. Vs. China. J. Glob. Inf. Technol. Manag. 2010, 13, 5–27. [Google Scholar] [CrossRef]
  66. Ros, E.X.R.; Field, A. Discovering Statistics Using SPSS. London: SAGE Publications. Anu. Psicol. UB J. Psychol. 2006, 37, 189–196. [Google Scholar]
  67. Hair, J.F.; Ringle, C.M.; Sarstedt, M. Partial Least Squares Structural Equation Modeling: Rigorous Applications, Better Results and Higher Acceptance. Long Range Plan. 2013, 46, 1–12, Erratum in Long Range Plan. 2014, 47, 392. [Google Scholar] [CrossRef]
  68. Hair, J.F.; Ringle, C.M.; Sarstedt, M. PLS-SEM: Indeed a silver bullet. J. Mark. Theory Pract. 2011, 19, 139–152. [Google Scholar] [CrossRef]
  69. Fornell, C.; Larcker, D.F. Structural equation models with unobservable variables and measurement error: Algebra and statistics. J. Mark. Res. 1981, 18, 382–388. [Google Scholar] [CrossRef]
  70. Venkatesh, V.; Thong, J.Y.; Xu, X. Consumer acceptance and use of information technology: Extending the unified theory of acceptance and use of technology. MIS Q. 2012, 36, 157–178. [Google Scholar] [CrossRef] [Green Version]
  71. Sunding, D.; Zilberman, D. The Agricultural Innovation Process: Research and Technology Adoption in a Changing Agricultural Sector. In Handbook of Agricultural Economics; Chapter 4; Elsevier: New York, NY, USA, 2001. [Google Scholar]
  72. Millock, K.; Xabadia, A.; Zilberman, D. Policy for the adoption of new environmental monitoring technologies to manage stock externalities. J. Environ. Econ. Manag. 2012, 64, 102–116. [Google Scholar] [CrossRef]
  73. Godtland, E.M.; Sadoulet, E.; de Janvry, A.; Murgai, R.; Ortiz, O. The Impact of Farmer Field Schools on Knowledge and Productivity: A Study of Potato Farmers in the Peruvian Andes. Econ. Dev. Cult. Chang. 2004, 53, 63–92. [Google Scholar] [CrossRef] [Green Version]
  74. Genius, M.; Koundouri, P.; Nauges, C.; Tzouvelekas, V. Information Transmission in Irrigation Technology Adoption and Diffusion: Social Learning, Extension Services, and Spatial Effects. Am. J. Agric. Econ. 2013, 96, 328–344. [Google Scholar] [CrossRef] [Green Version]
Figure 1. Conceptual framework.
Ijerph 19 08465 g001
Figure 2. Path coefficients. Note: *** represents p < 0.01.
Ijerph 19 08465 g002
Table 1. Sample characteristics.
VariablesDefinitionsFrequencyProportion
GenderFemale44259.2%
Male30540.8%
AgeBetween 18 and 28 years old50.7%
Between 29 and 38 years old516.8%
Between 39 and 48 years old19926.8%
Between 49 and 58 years old26134.9%
59 years old and above23130.8%
Education3 schooling years and below719.5%
Between 3 and 6 schooling years16121.6%
Between 6 and 9 schooling years28337.9%
9 schooling years and above23231.0%
CadreCadre557.4%
Non-cadre69292.6%
Table 2. Descriptive statistics.
VariablesNo. ItemsMeanSD
Risk Perception42.7720.863
Performance Expectancy53.2140.880
Effort Expectancy53.7040.628
Social Influence42.3010.705
Facilitating Conditions52.5760.797
Behavior Intention32.1830.766
Usage Behavior43.2001.068
Note: SD represents the standard deviation.
Table 3. Construct correlation matrix and reliability measurement.
CACRAVEVIFUBBIRPPEEESIFC
UB0.9360.9540.839-0.916
BI0.9020.9390.8371.1720.3780.915
RP0.7330.8350.5821.0310.109−0.2140.763
PE0.9160.9270.7501.7040.4040.599−0.1500.866
EE0.9090.9320.7341.8850.4780.591−0.1350.6270.856
SI0.9170.9410.8001.3930.5970.412−0.0240.4240.5110.894
FC0.9250.9440.7701.1720.6960.3830.0150.5110.5650.6830.878
Note: UB: Usage Behavior; BI: Behavioral Intention; RP: Risk Perception; PE: Performance Expectancy; EE: Effort Expectancy; SI: Social Influence; FC: Facilitating Conditions; CA: Cronbach’s Alpha; CR: Composite Reliability; AVE: Average Variance Extracted; VIF: Variance Inflation Factors. The bolded values on the diagonal are the square root of AVE.
Table 4. Path coefficient.
HypothesesBetap-ValueR2f2Decision
H1: BI-UB0.1300.0000.5000.029Accept
H6: FC-UB0.6470.0000.712Accept
H2: RP-BI−0.1180.0000.4560.025Accept
H3: PE-BI0.3440.0000.128Accept
H4: EE-BI0.3050.0000.090Accept
H5: SI-BI0.1070.0000.015Accept
Note: UB: Usage Behavior; BI: Behavioral Intention; RP: Risk Perception; PE: Performance Expectancy; EE: Effort Expectancy; SI: Social Influence; FC: Facilitating Conditions.
Table 5. Results of mediation.
HypothesesBetaLLCIALSOResults
H3M: PE mediates the relationship between RP and BI−0.159−0.237−0.078Mediation
H4M: RP mediates the relationship between EE and BI−0.143−0.222−0.062Mediation
Note: PE: Performance Expectancy; RP: Risk Perception; BI: Behavioral Intention; EE: Effort Expectancy.
Publisher’s Note: MDPI stays neutral with regard to jurisdictional claims in published maps and institutional affiliations.

