
The Servqual Method as an Assessment Tool of the Quality of Medical Services in Selected Asian Countries


Abstract
:1. Introduction
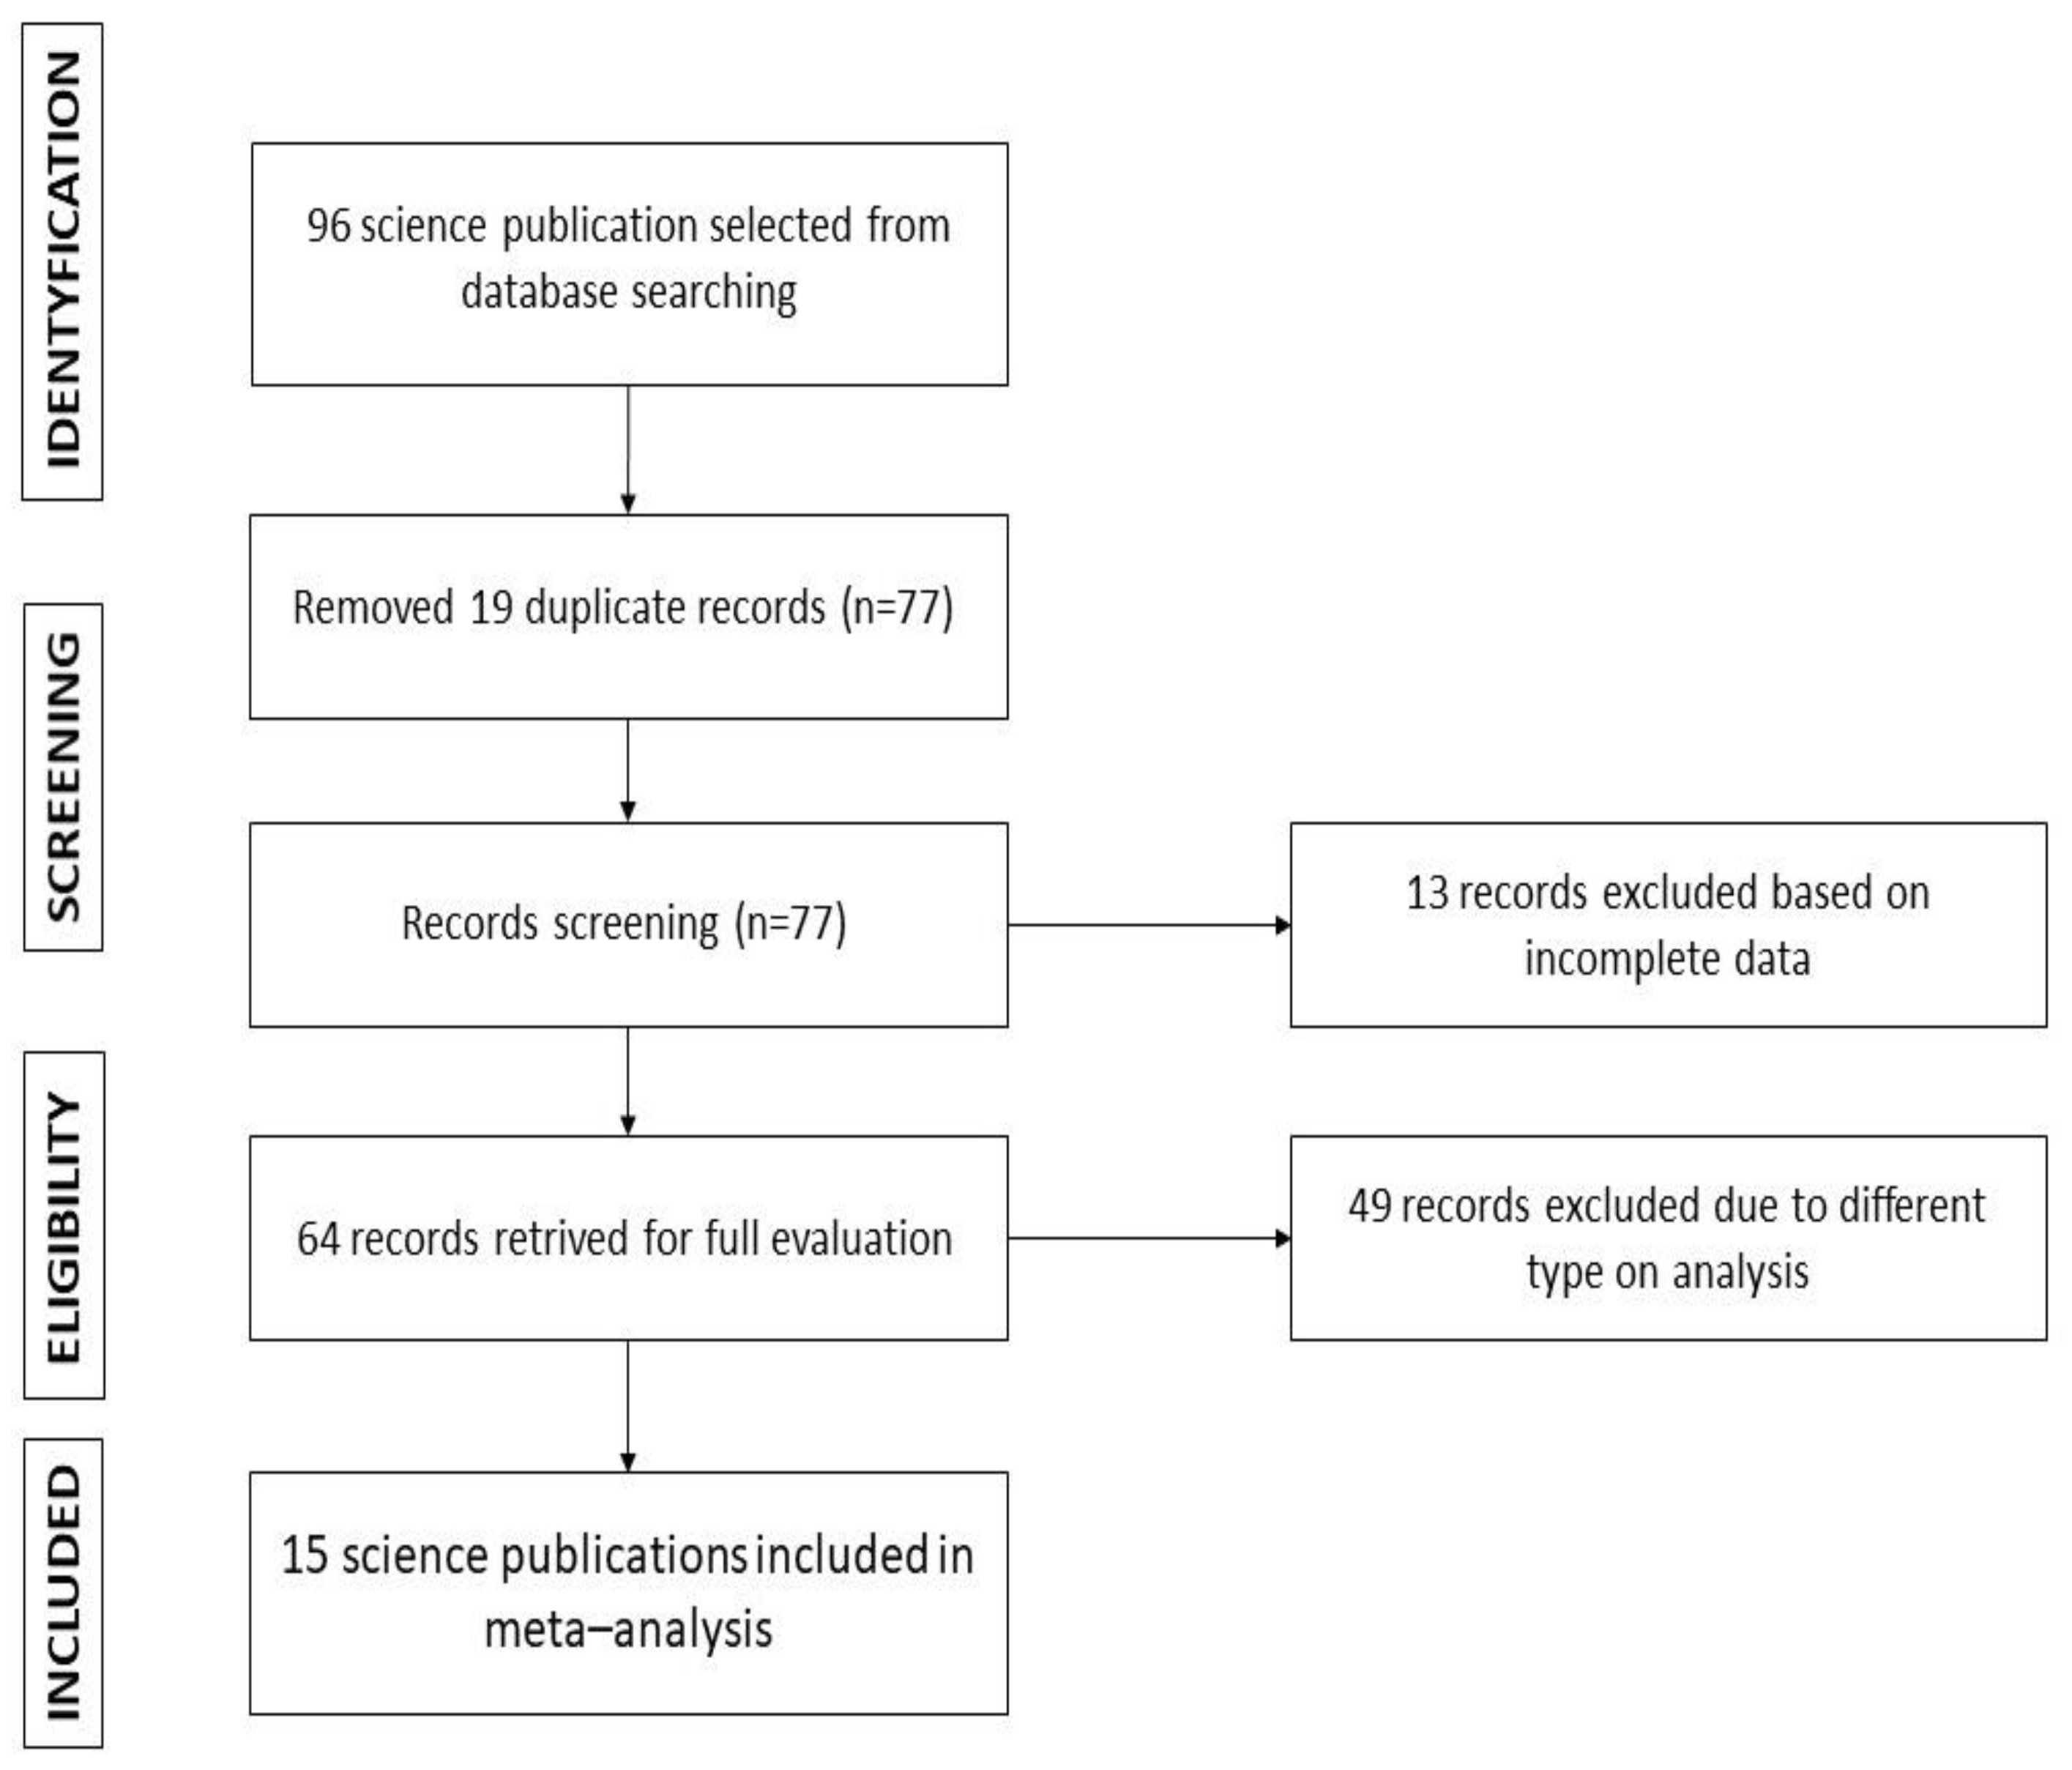
2. Materials and Methods
2.1. Eligibility Criteria
2.2. Statistical Analysis
3. Results
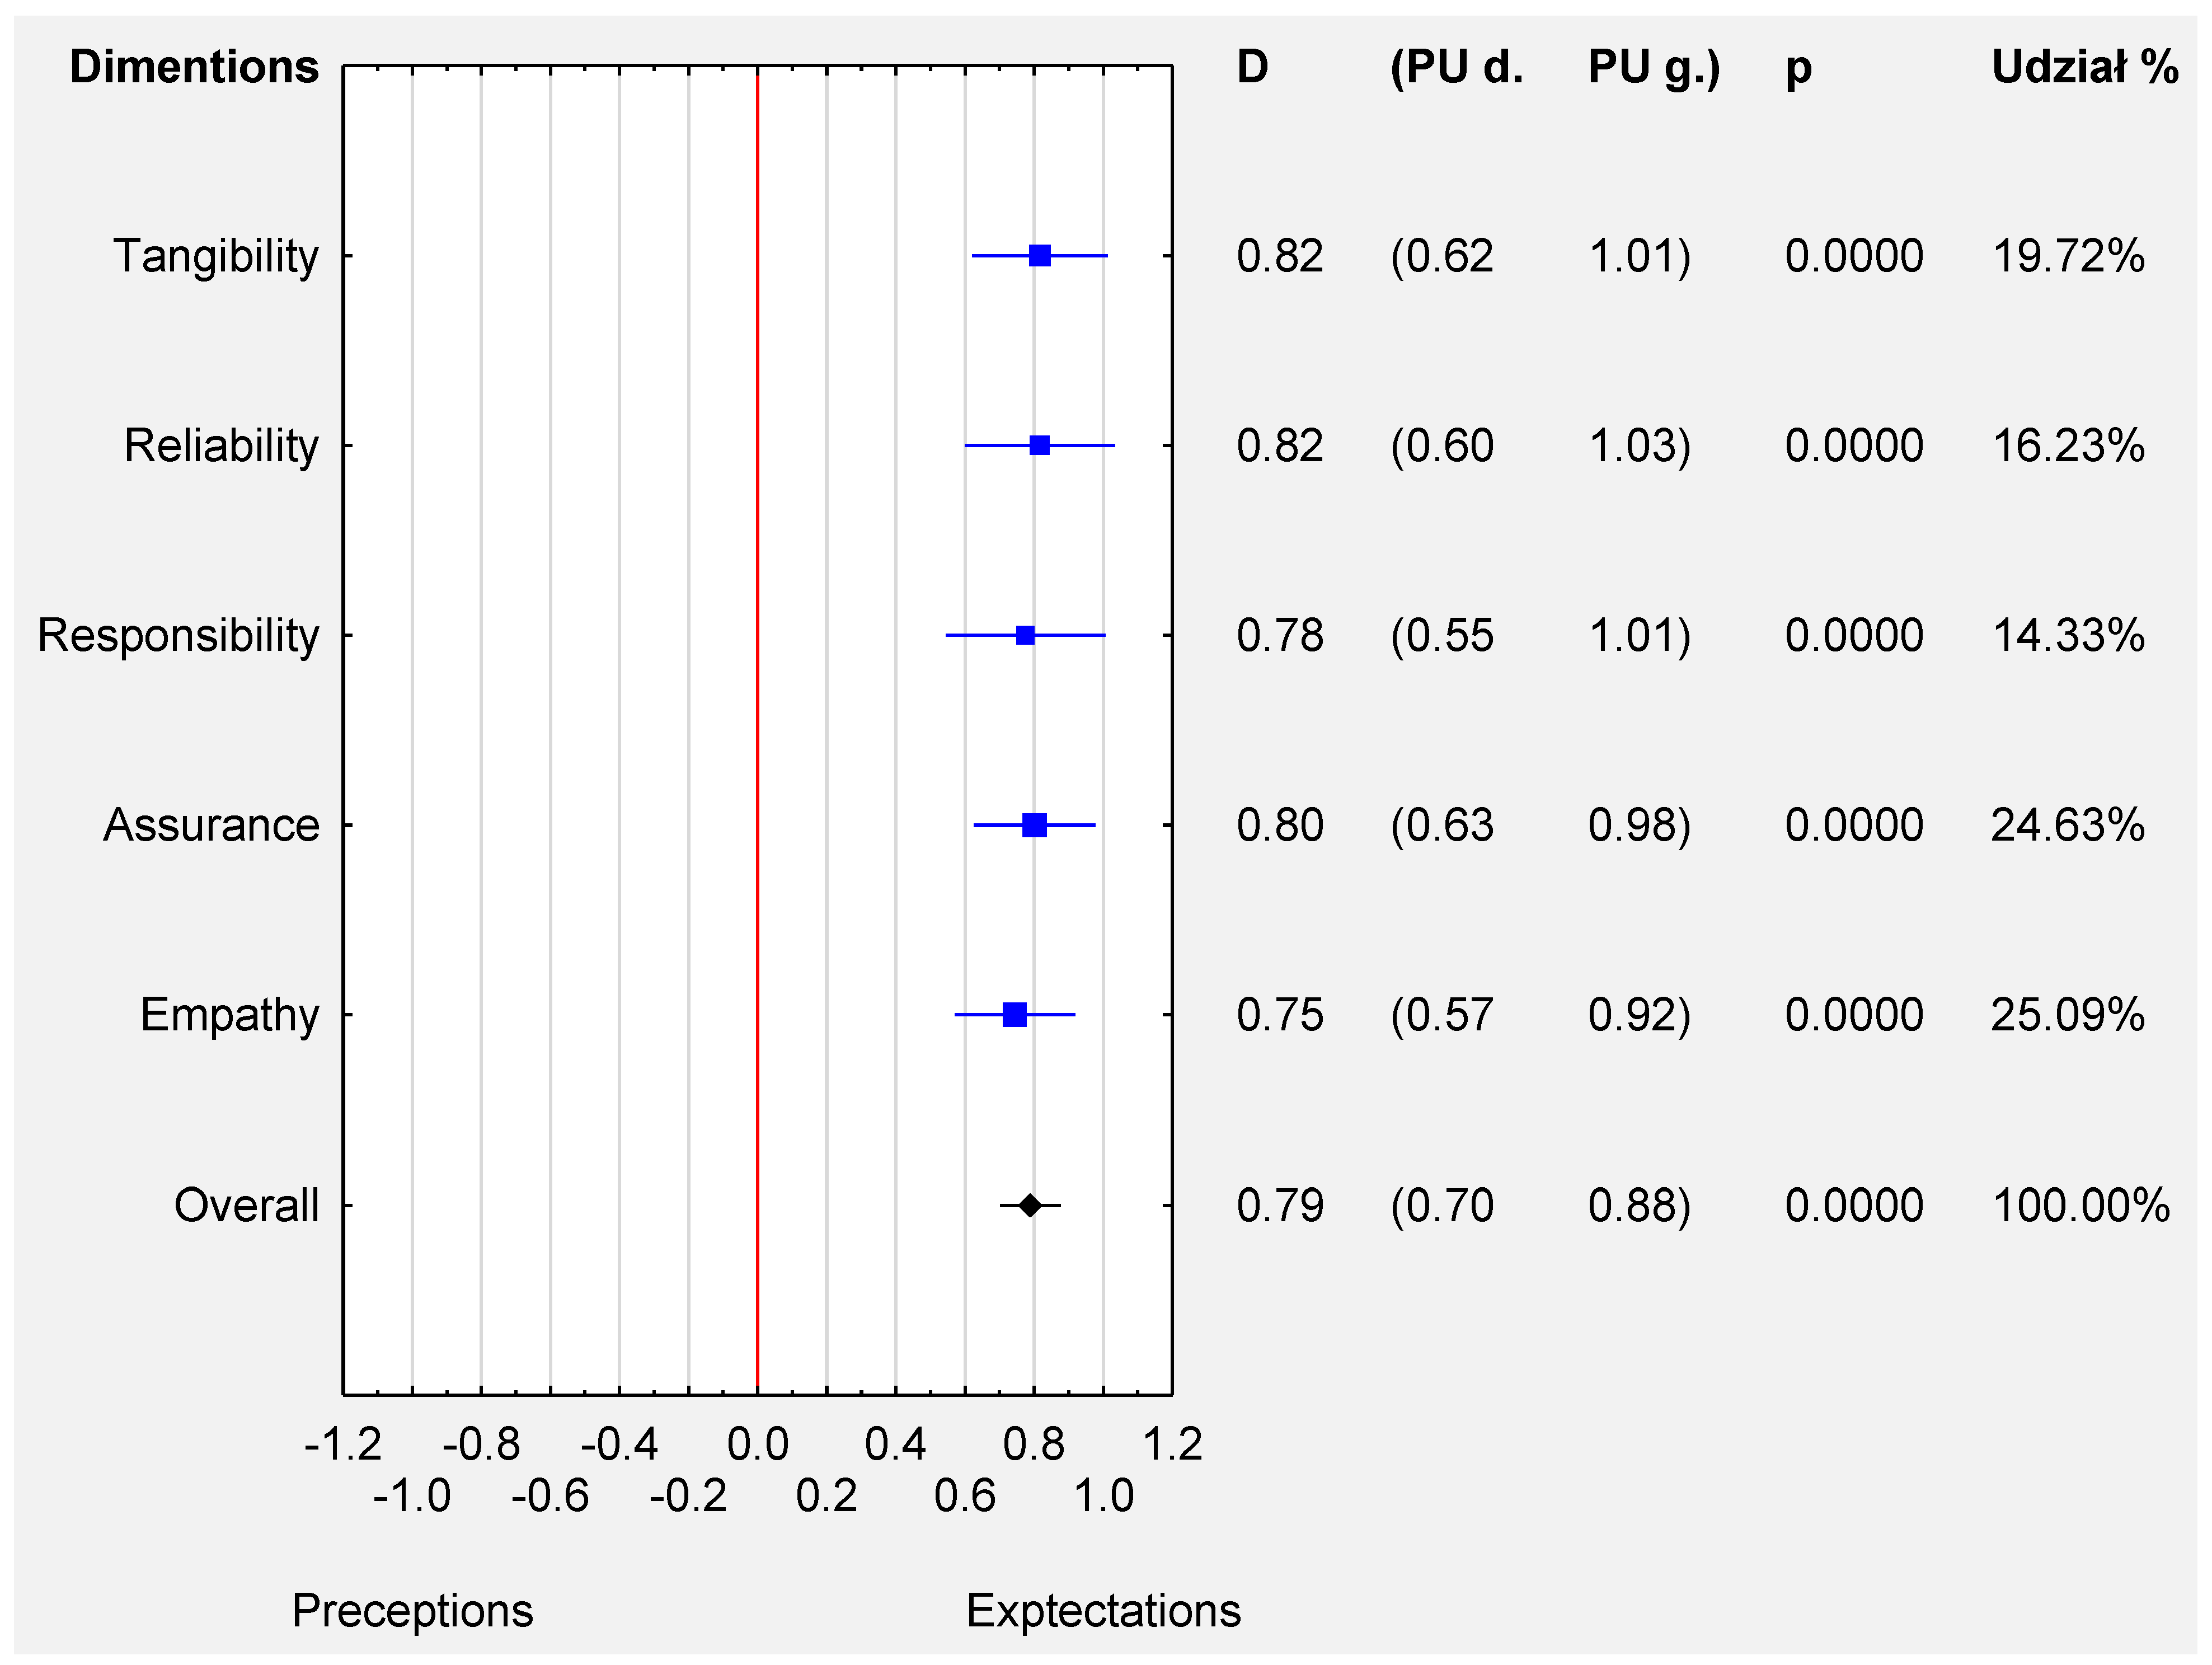
Dimensions
4. Discussion
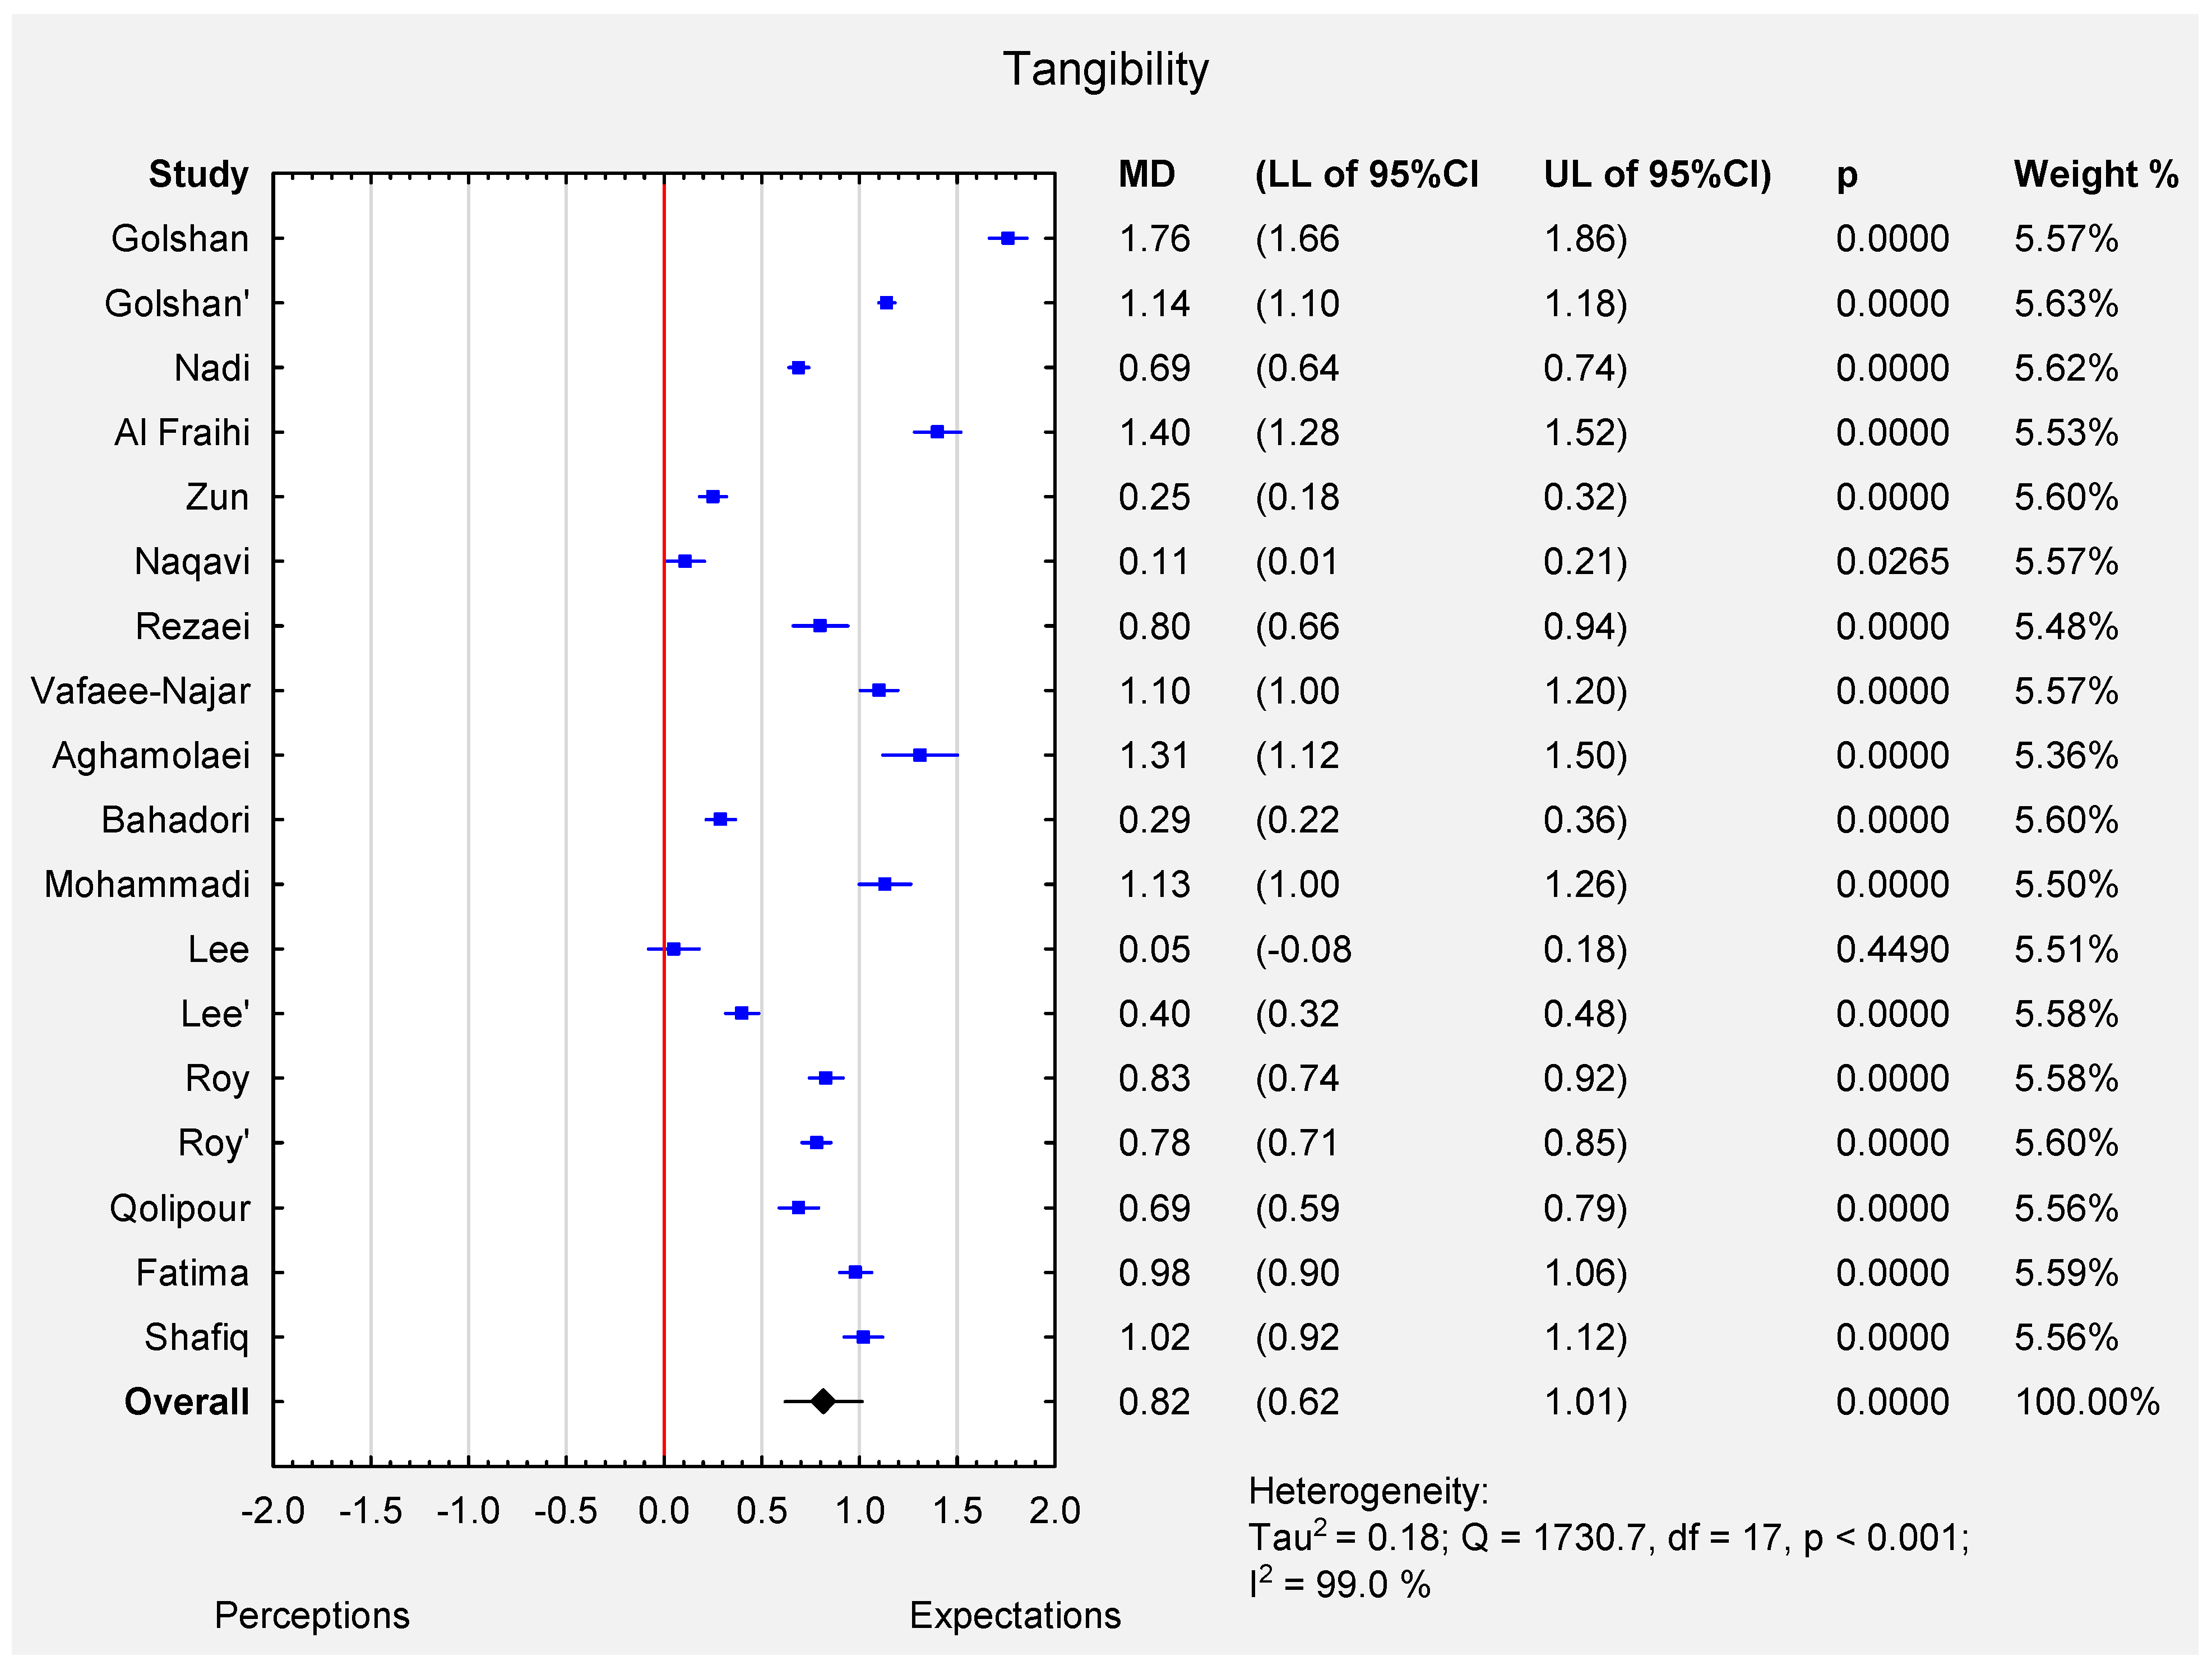
5. Tangibility
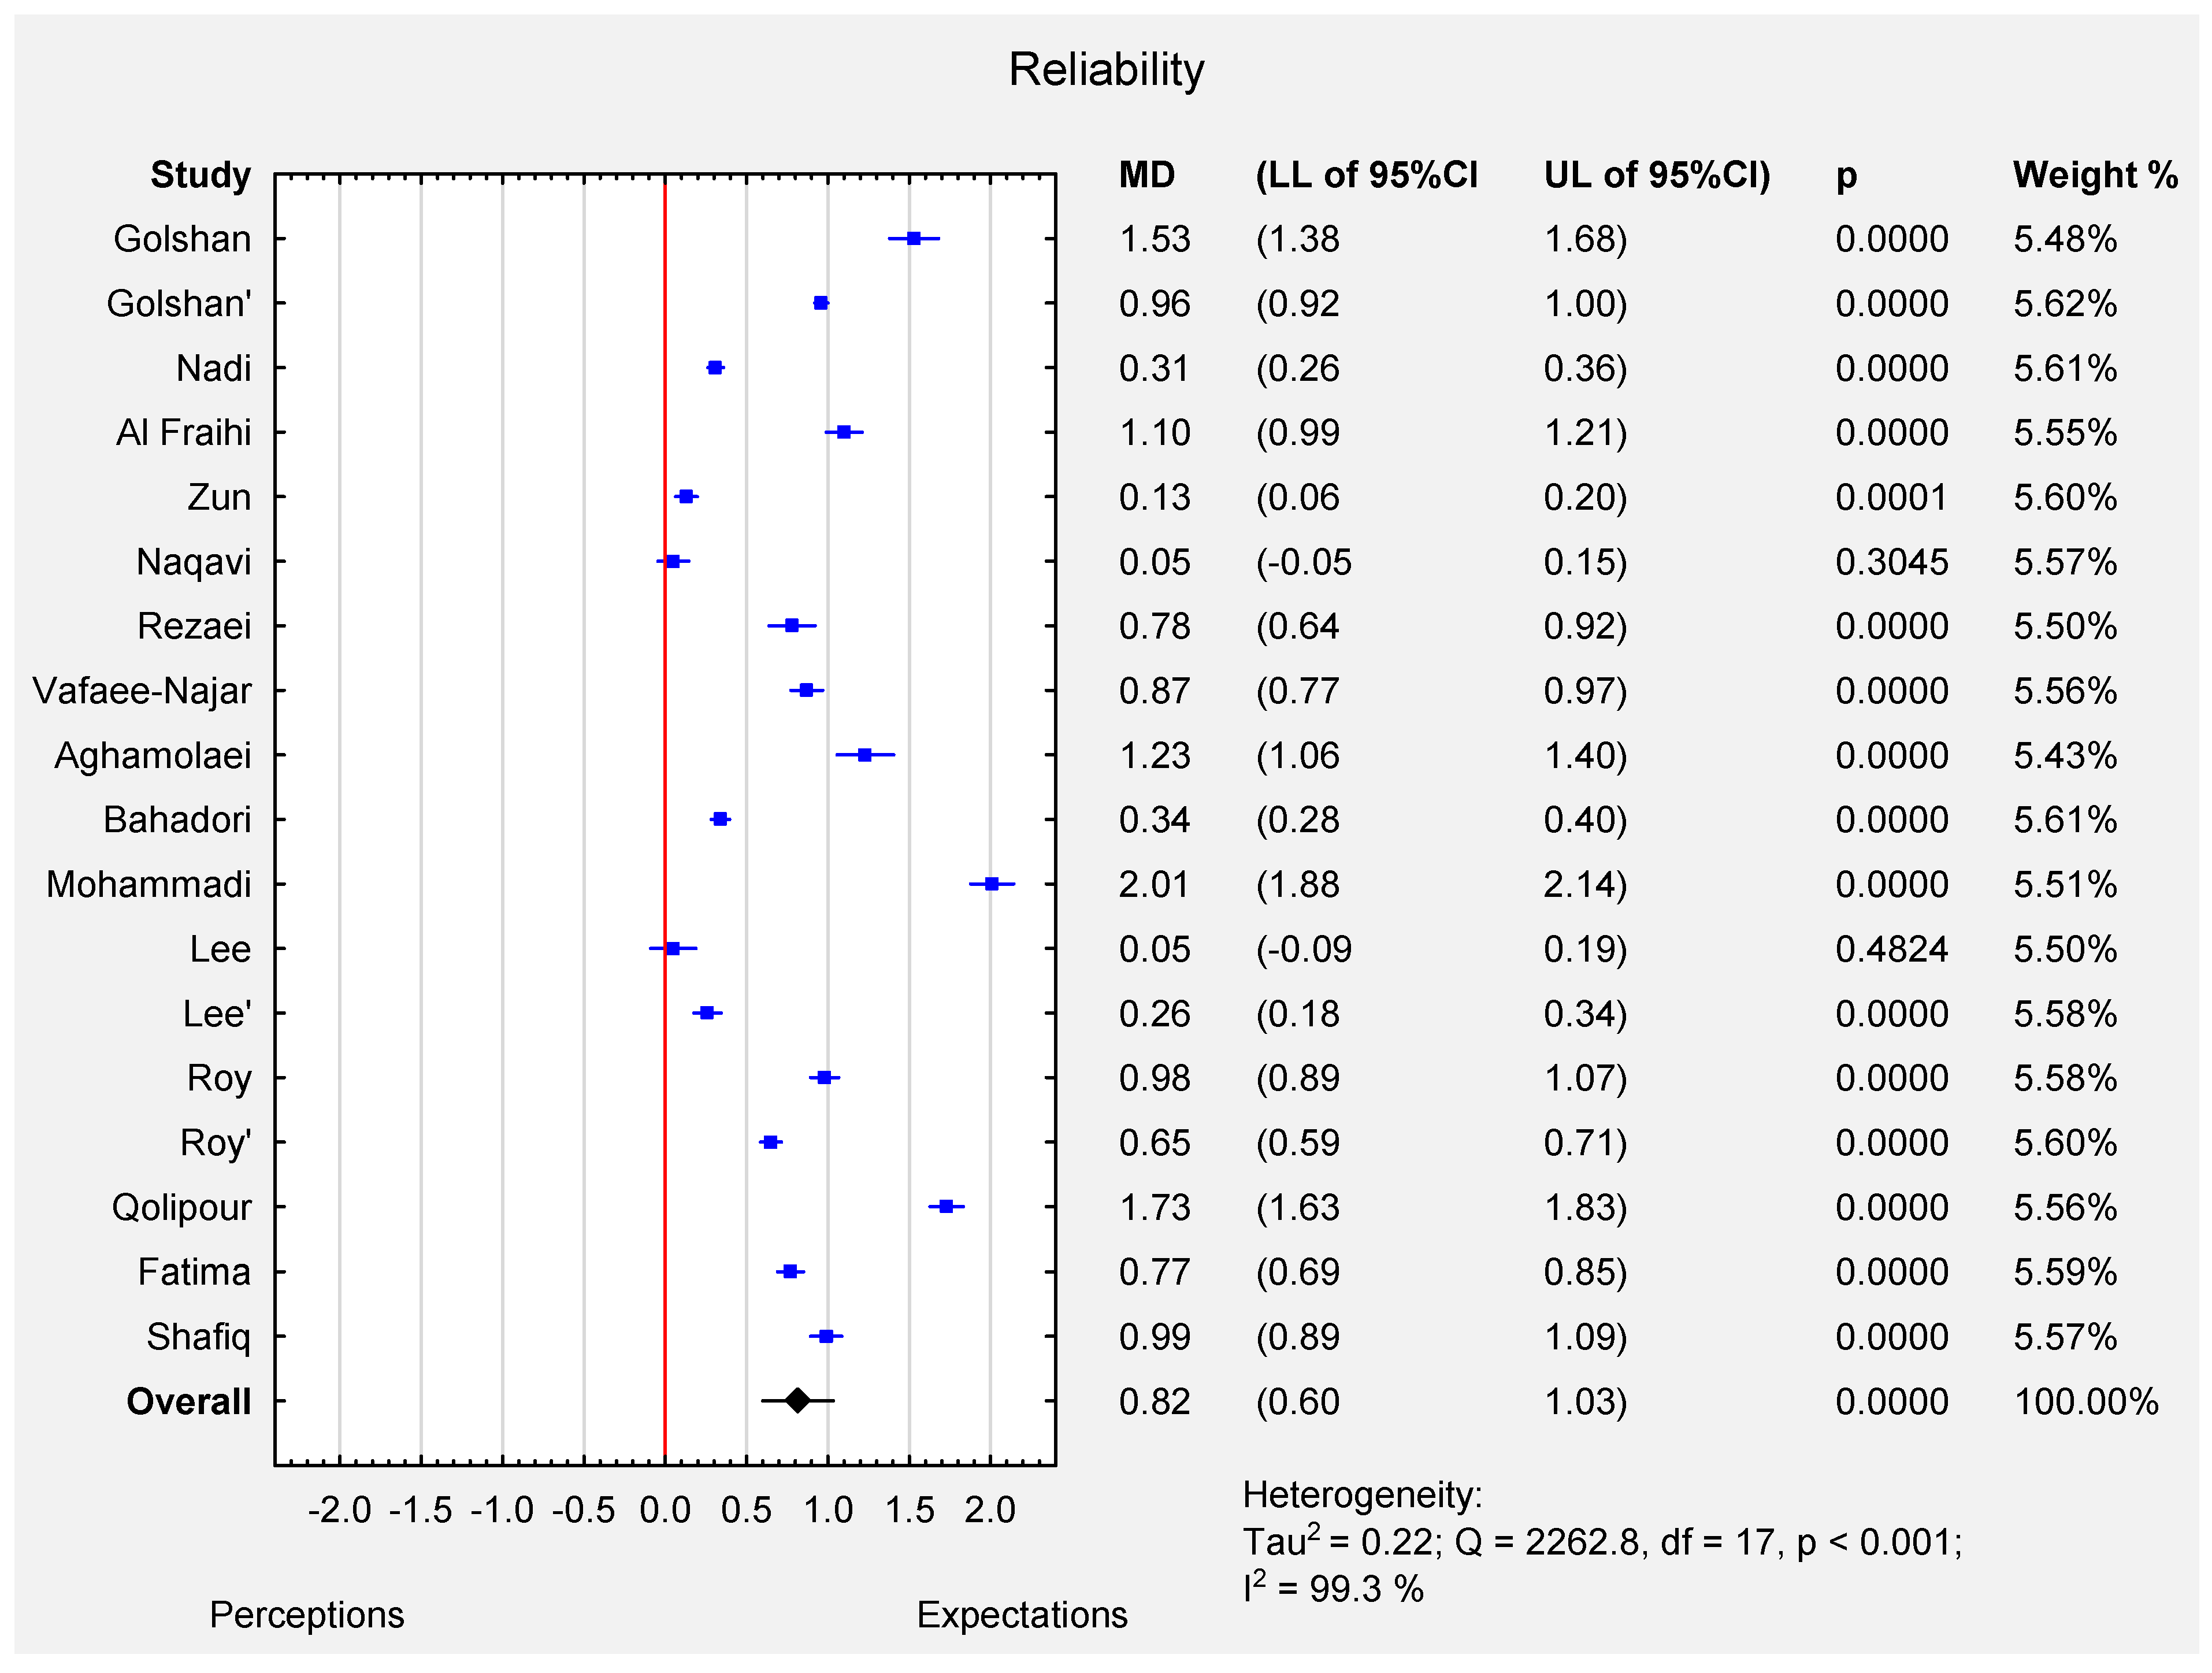
6. Reliability
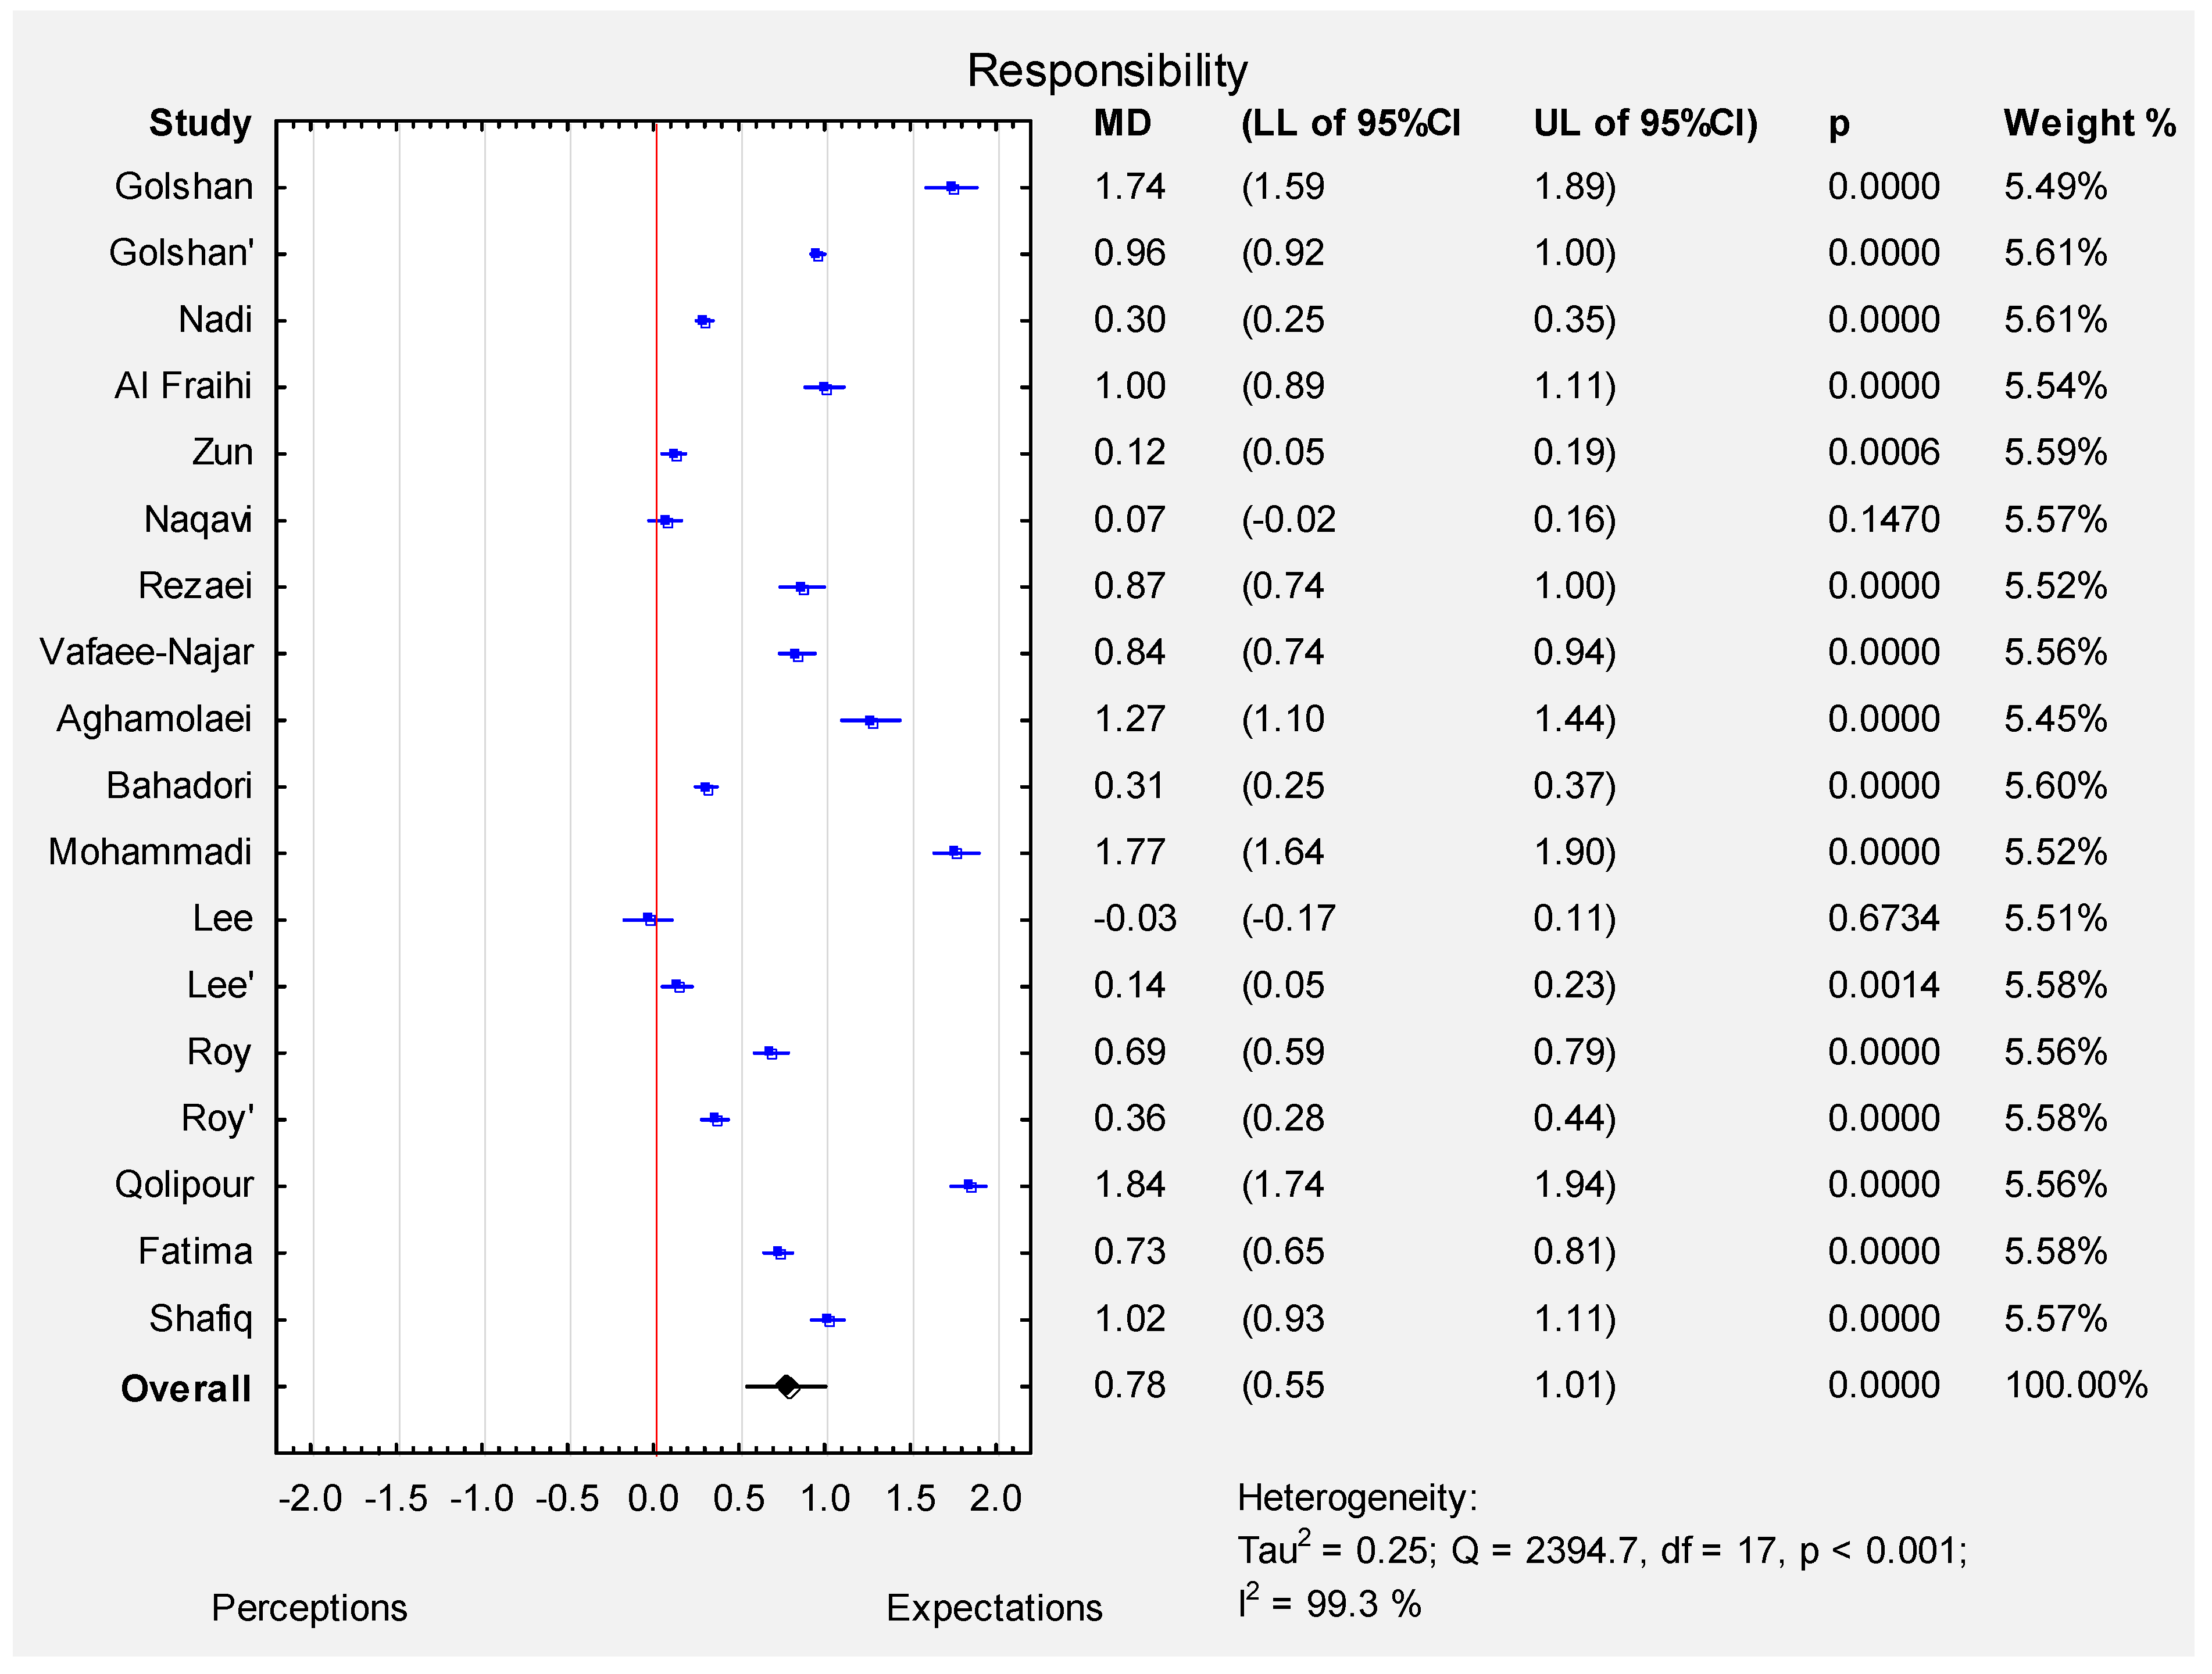
7. Responsiveness
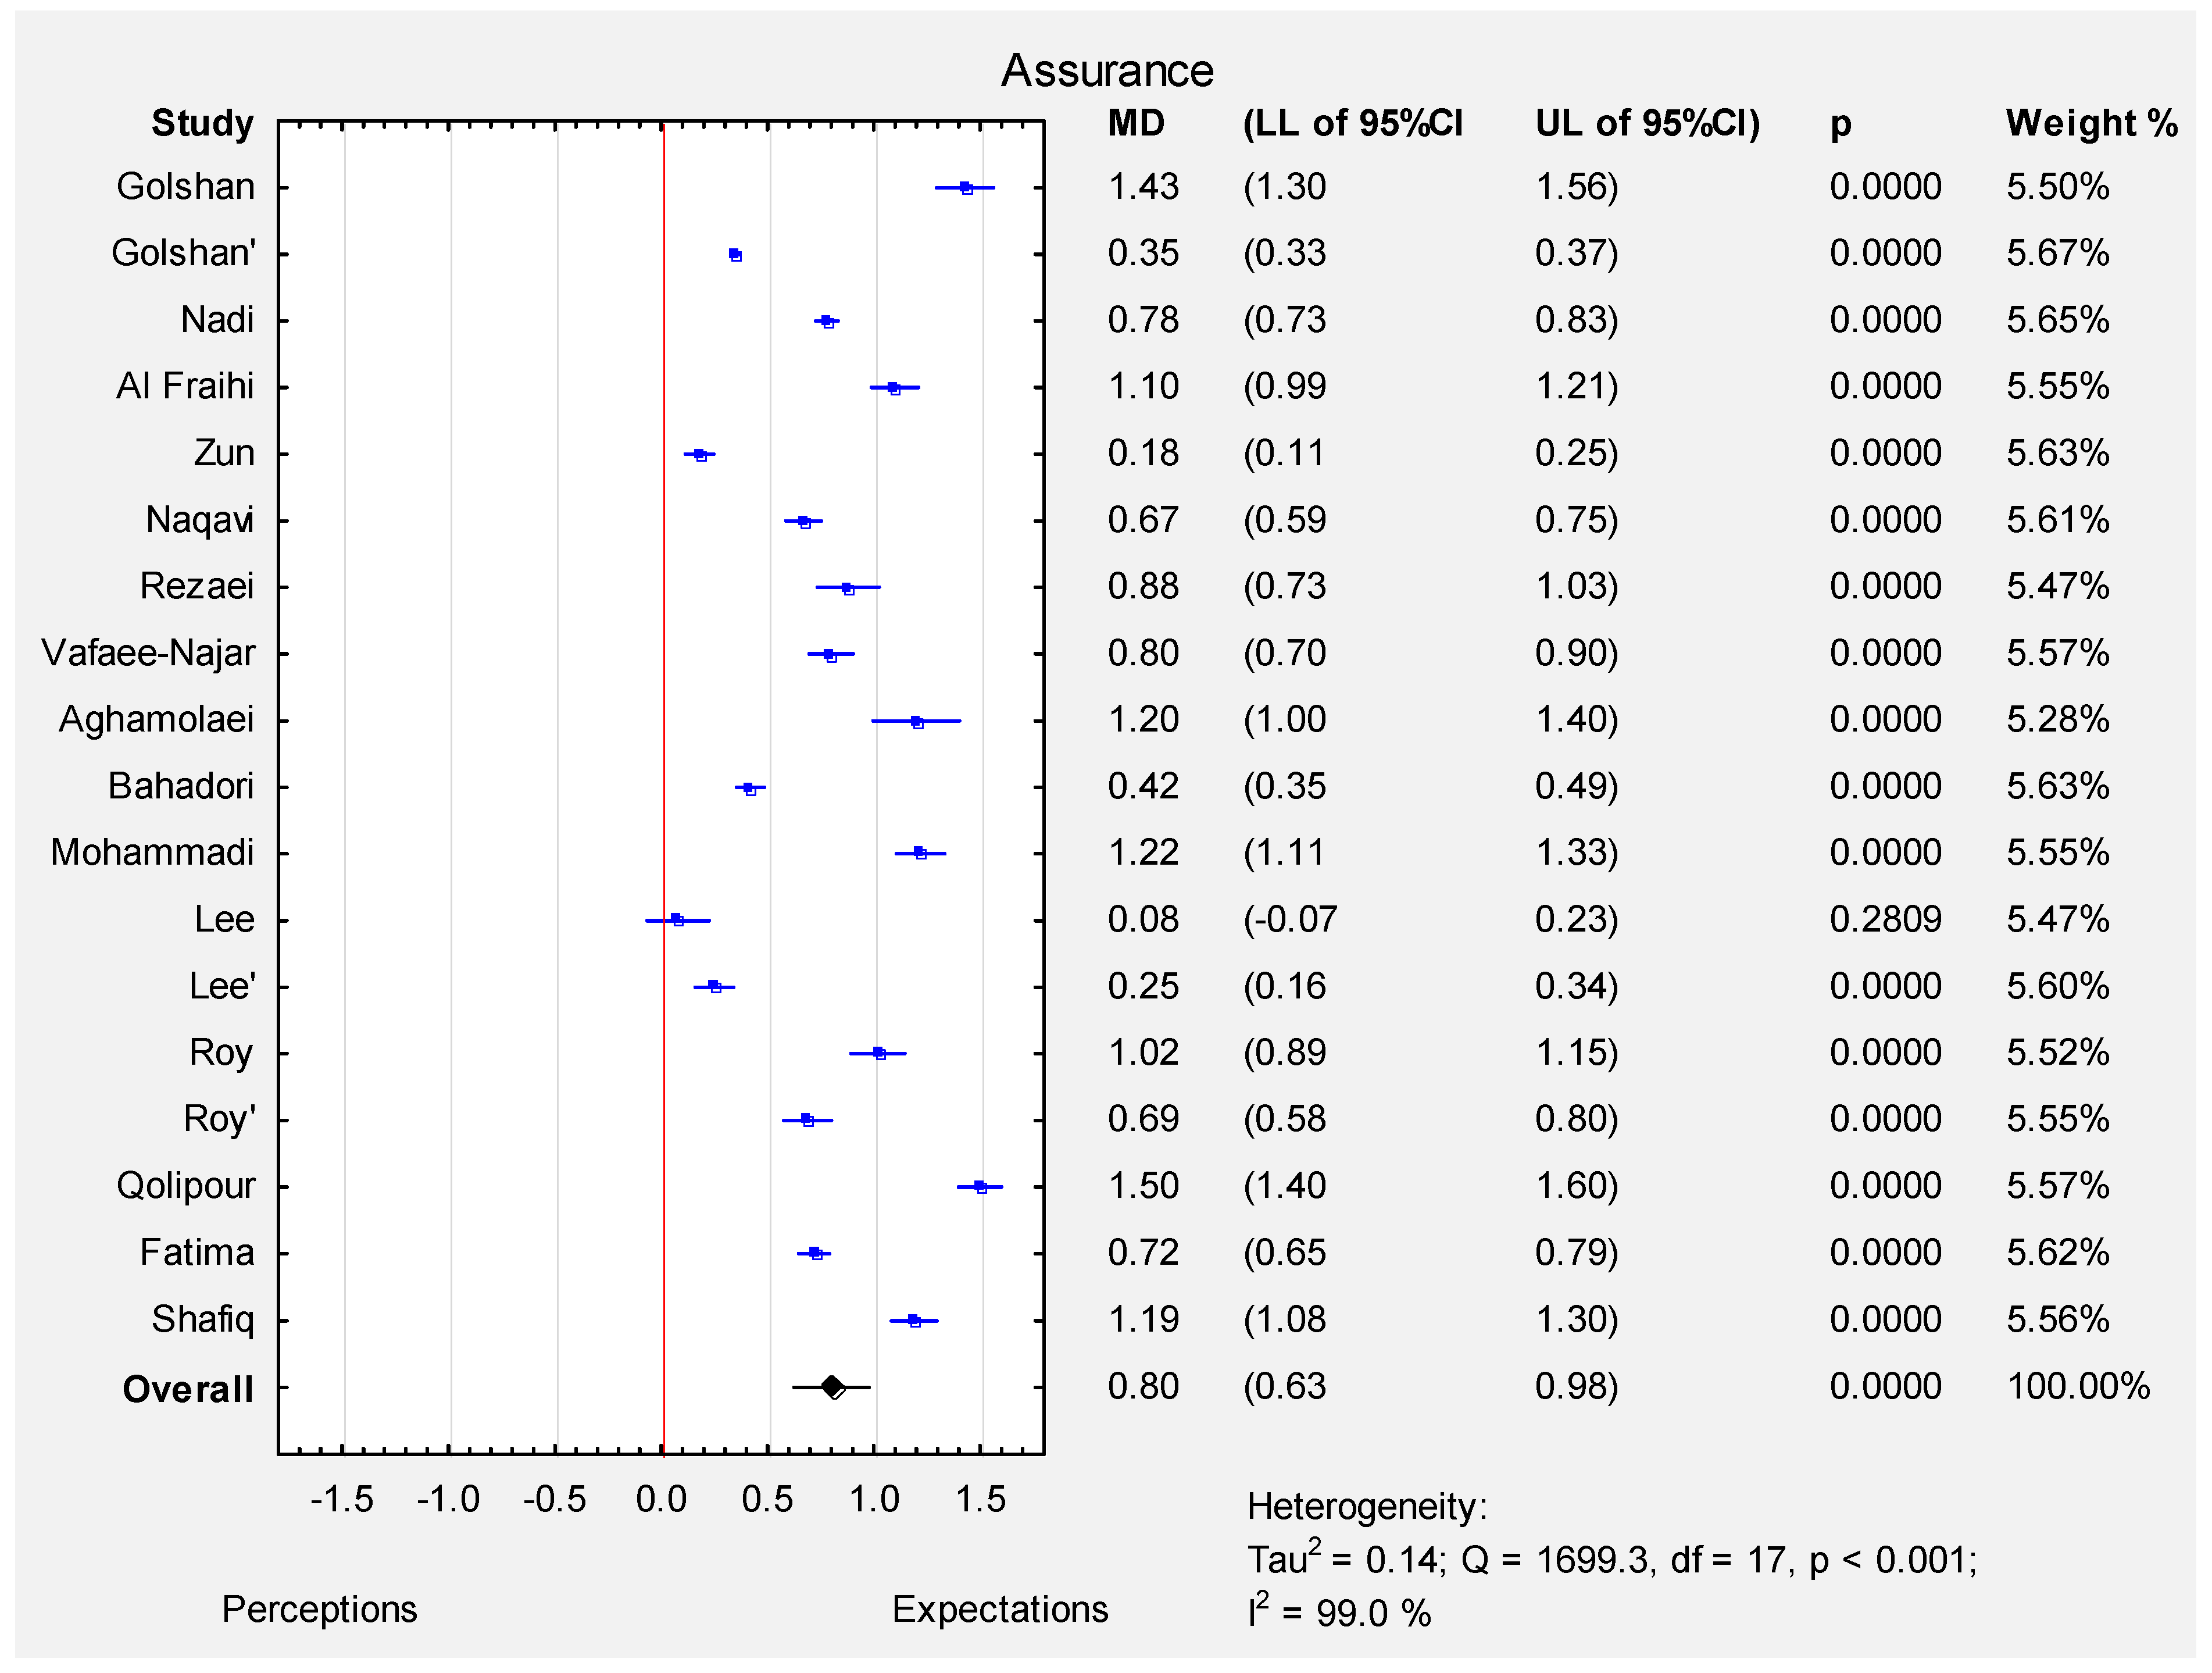
8. Assurance
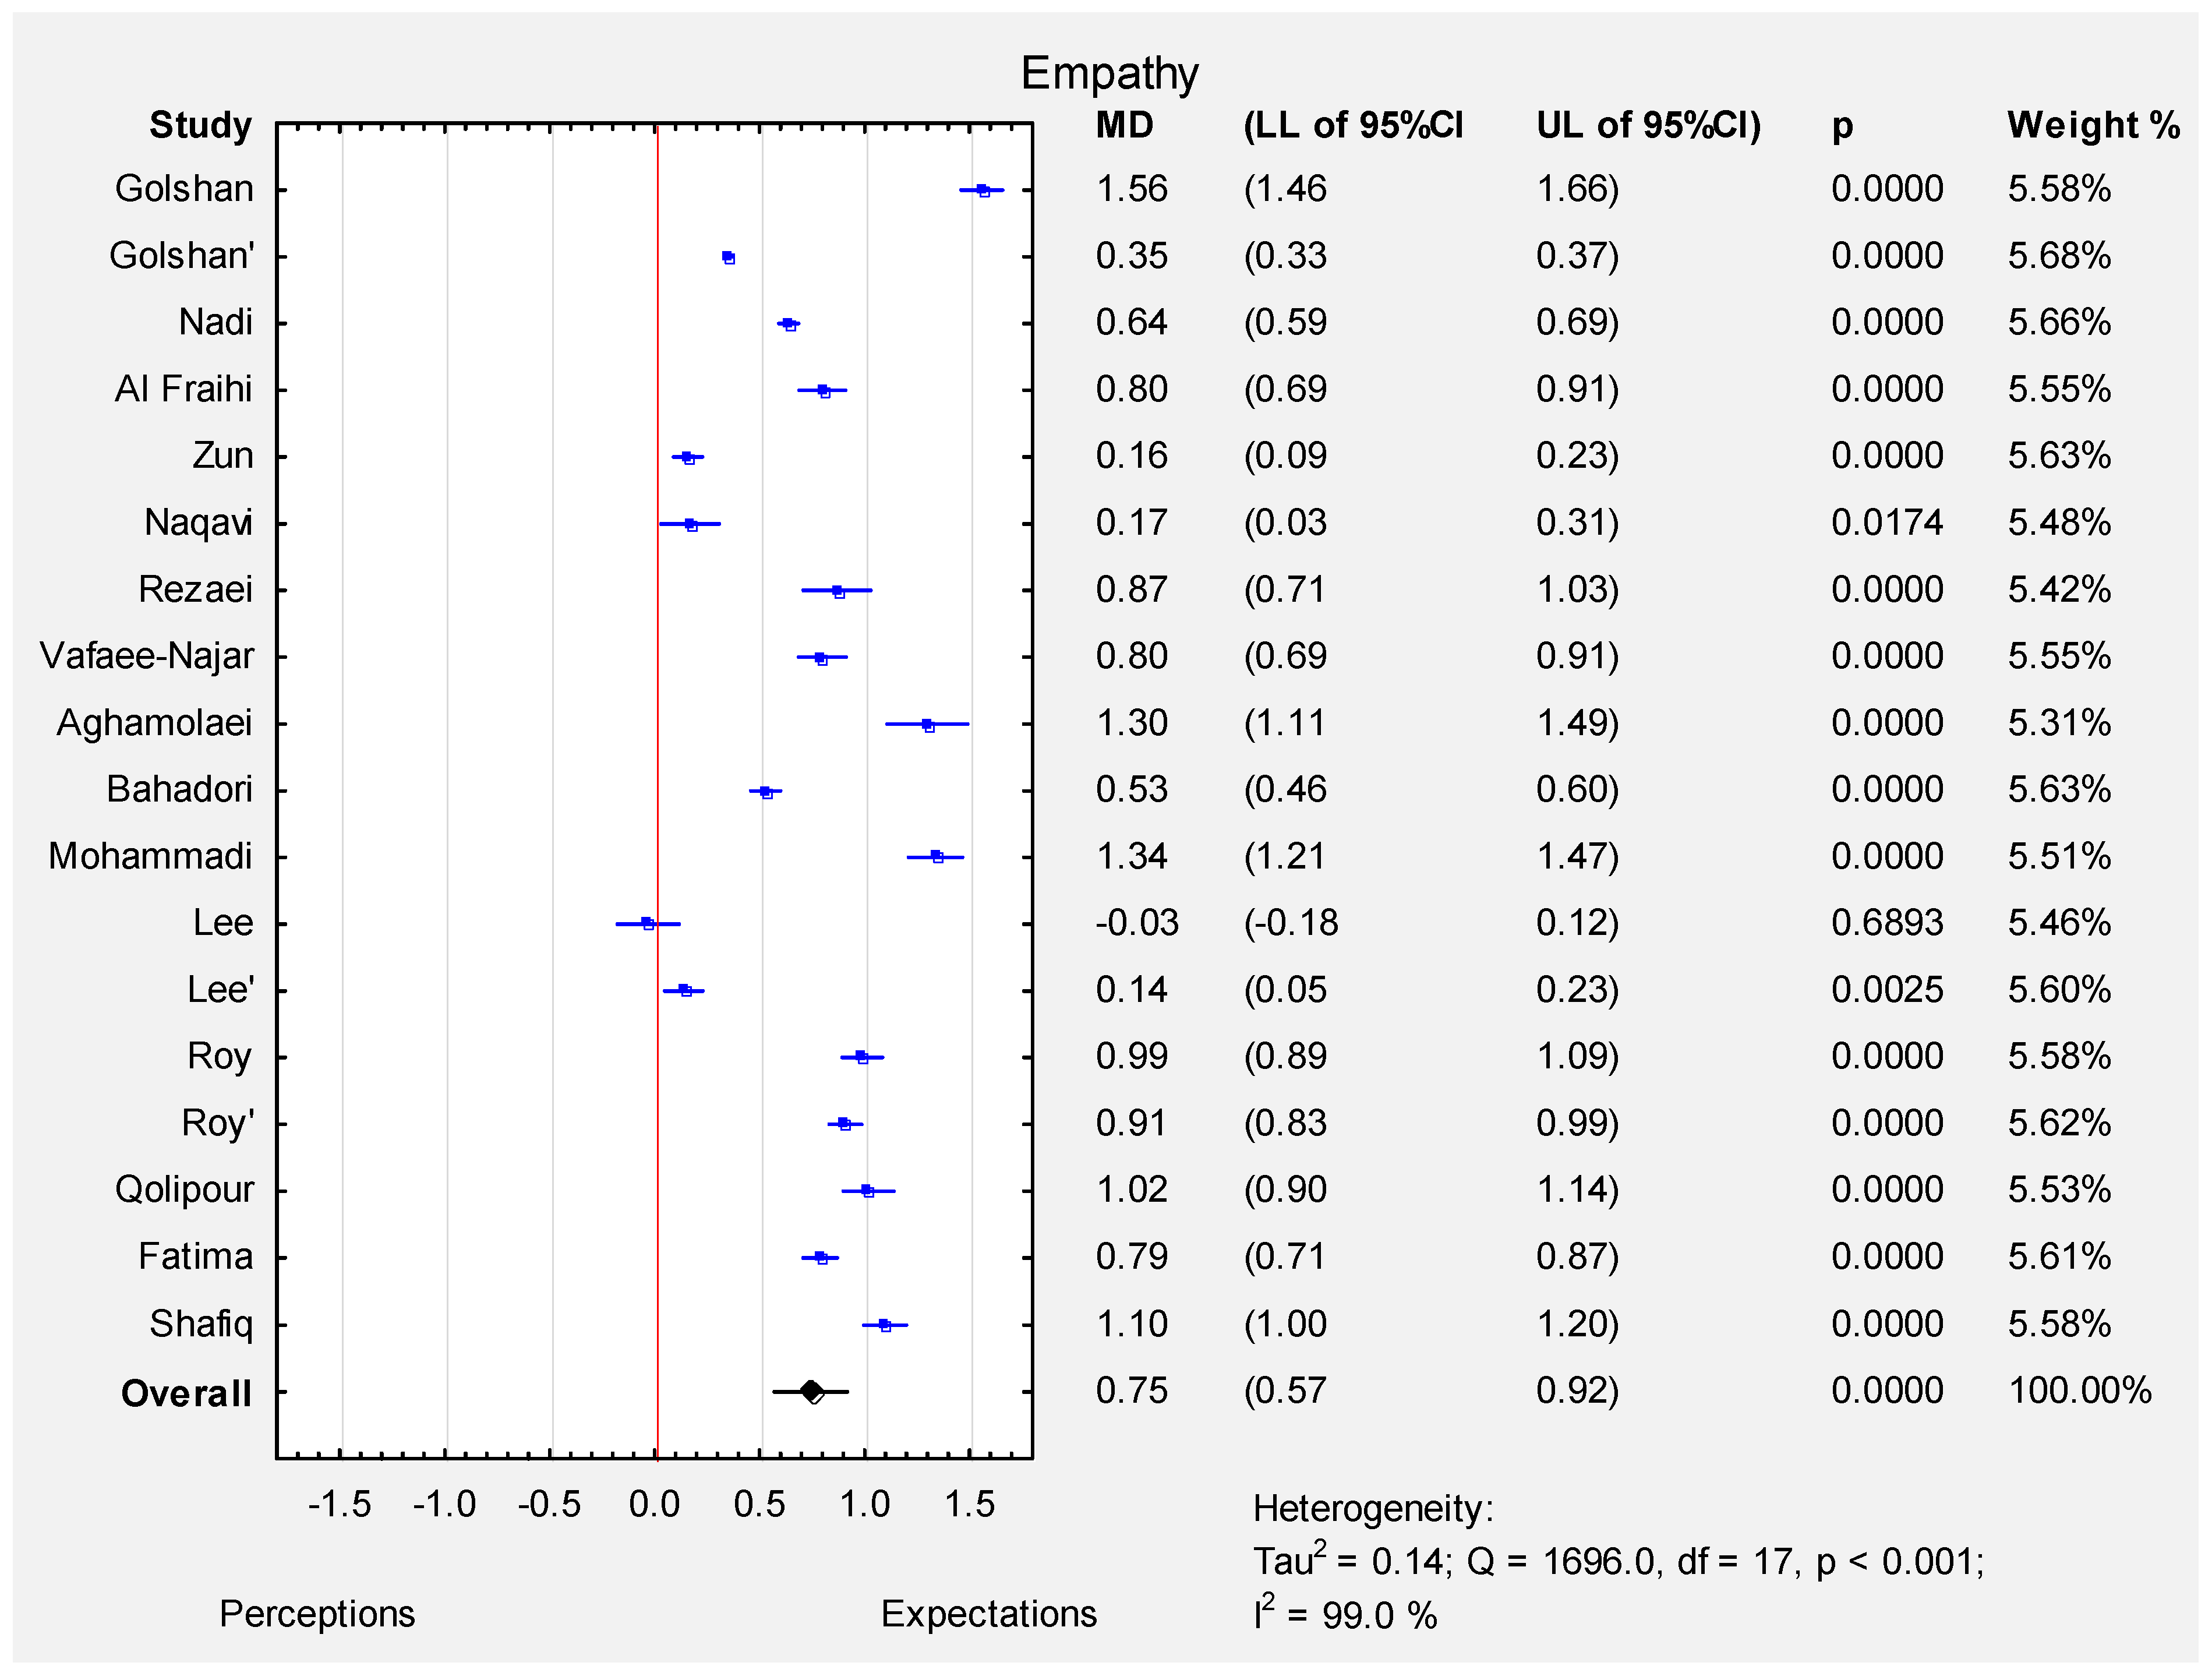
9. Empathy
10. Conclusions
- The Servqual method is broadly used in various regions to assess the quality of medical services provided.
- The study demonstrated that patients had significantly higher expectations from offered medical services in the five analysed dimensions.
- The results, obtained through the Servqual method, may help improve the quality of services provided by different institutions.
- In the publications analysed, it was noted in all the cases that respondents had higher expectations of quality than the quality level they had received. In only two cases (not statistically significant) were the expectations comparable to the quality of service received. The difference was observed in South Korea and Saudi Arabia, where both countries demonstrate high standards of living. Patients most often make use of public health care institutions and want the services provided by them to be of high quality. However, high quality is not always ensured at every level at public health care entities. Gaps in one dimension may have an impact on the final quality of medical services, thus contributing to their under-rating by patients. In order to improve the quality of medical services, one should focus not only on the areas with the biggest gaps.
- Medical facilities should take measures to reduce differences in the quality of provided services. Differences in the quality of services should compel those responsible for management to take specific actions after any problems are identified. Depending on the country and facility surveyed, gaps in the quality of medical services provided were identified in different areas, primarily empathy/communication, medical equipment and facilities, and the waiting times for service delivery. The quality of healthcare services provided may improve the patients’ adherence to treatment and care recommendations [6]. On the basis of the analyses carried out, it is concluded that the problem of communication is one of the most frequently mentioned issues in the analysed works [7,8,9,10,11,12,13,14,15,16,17,18,25,26]. The authors pay particular attention to the need for training in interpersonal and intergroup communication in order to meet the needs arising from the treatment process and to ensure the quality of this treatment.
Supplementary Materials
Author Contributions
Funding
Institutional Review Board Statement
Informed Consent Statement
Data Availability Statement
Conflicts of Interest
References
- Parasuraman, A.; Zeithaml, V.A.; Berry, L.L. A Conceptual Model of Service Quality and Its Implications for Future Research. Berry Source. J. Mark. 1985, 49, 41–50. [Google Scholar] [CrossRef]
- Parasuraman, A.; Zeithaml, V.; Berry, L. Servqual: A multiple-item scale for measuring consumer perceptions of service quality. Retail. Crit. Concepts 2002, 64, 140. [Google Scholar]
- Rezaei, S.; Hajizadeh, M.; Zandian, H.; Fathi, A.; Nouri, B. Service quality in Iranian hospitals: A systematic review and meta-analysis. Med. J. Islam. Repub. Iran 2018, 32, 344–351. [Google Scholar] [CrossRef] [PubMed]
- Al Fraihi, K.J.; Famco, D.; Famco, F.; Latif, S.A. Evaluation of outpatient service quality in Eastern Saudi Arabia: Patient’s expectations and perceptions. Saudi Med. J. 2016, 37, 420–428. [Google Scholar] [CrossRef]
- Naqavi, M.R.; Refaiee, R.; Baneshi, M.R.; Nakhaee, N. Analysis of Gap in Service Quality in Drug Addiction Treatment Centers of Kerman, Iran, Using SERVQUAL Model. Addict. Heal. 2015, 6, 85–92. [Google Scholar]
- Nadi, A.; Shojaee, J.; Abedi, G.; Siamian, H.; Abedini, E.; Rostami, A. Patients’ Expectations and Perceptions of Service Quality in the Selected Hospitals. Med. Arch. 2016, 70, 135–139. [Google Scholar] [CrossRef] [Green Version]
- Moher, D.; Liberati, A.; Tetzlaff, J.; Altman, D.G.; PRISMA Group. Preferred reporting items for systematic reviews and meta-analyses: The PRISMA statement. PLoS Med. 2009, 6, e1000097. [Google Scholar] [CrossRef] [Green Version]
- Bahadori, M.K.; Raadabadi, M.; Jamebozorgi, M.H.; Salesi, M.; Ravangard, R. Measuring the Quality of Provided Services for Patients With Chronic Kidney Disease. Nephro-Urol. Mon. 2014, 6, e21810. [Google Scholar] [CrossRef] [Green Version]
- Qolipour, M.; Torabipour, A.; Khiavi, F.F.; Malehi, A.S. Assessing Medical Tourism Services Quality Using SERVQUAL Model: A Patient’s Perspective. Iran. J. Public Health 2018, 47, 103–110. [Google Scholar]
- Shafiq, M.; Naeem, M.A.; Munawar, Z.; Fatima, I. Service Quality Assessment of Hospitals in Asian Context: An Empirical Evidence From Pakistan. Inq. J. Heal. Care Organ. Provis. Financ. 2017, 54. [Google Scholar] [CrossRef] [Green Version]
- Fatima, I.; Humayun, A.; Anwar, M.I.; Iftikhar, A.; Aslam, M.; Shafiq, M. How Do Patients Perceive and Expect Quality of Surgery, Diagnostics, and Emergency Services in Tertiary Care Hospitals? An Evidence of Gap Analysis From Pakistan. Oman Med. J. 2017, 32, 297–305. [Google Scholar] [CrossRef] [PubMed]
- Lee, M.A.; Yom, Y.-H. A comparative study of patients’ and nurses’ perceptions of the quality of nursing services, satisfaction and intent to revisit the hospital: A questionnaire survey. Int. J. Nurs. Stud. 2007, 44, 545–555. [Google Scholar] [CrossRef] [PubMed]
- Mohammadi, A.; Mohammadi, J. Evaluating quality of health services in health centres of Zanjan district of Iran. Indian J. Public Heal. 2012, 56, 308–313. [Google Scholar] [CrossRef]
- Zun, A.B.; Ibrahim, M.I.; Hamid, A.A. Level of Satisfaction on Service Quality Dimensions Based on SERVQUAL Model Among Patients Attending 1 Malaysia Clinic in Kota Bharu, Malaysia. Oman Med. J. 2018, 33, 416–422. [Google Scholar] [CrossRef] [PubMed]
- Roy, A.; Van Der Weijden, T.; De Vries, N. Predictors and consequences of rural clients’ satisfaction level in the district public-private mixed health system of Bangladesh. Glob. Heal. Res. Policy 2017, 2, 31. [Google Scholar] [CrossRef] [PubMed] [Green Version]
- Golshan, S.; Feizy, T.; Tavasoli, S.; Basiri, A. Service quality and urolithiasis patient adherence. Int. J. Heal. Care Qual. Assur. 2019, 32, 2–10. [Google Scholar] [CrossRef]
- Rezaei, S.; Matin, B.K.; Moradi, K.; Bijan, B.; Fallahi, M.; Shokati, B.; Saeidi, H. Measurement of Quality of Educational Hospital Services by the servqual Model: The Iranian Patients’ Perspective. Electron. Physician 2016, 8, 2101–2106. [Google Scholar] [CrossRef] [Green Version]
- Vafaee-Najar, A.; Nejatzadegan, Z.; Pourtaleb, A.; Kaffashi, S.; Vejdani, M.; Molavi-Taleghani, Y.; Ebrahimipour, H. The quality assessment of family physician service in rural regions, Northeast of Iran in 2012. Int. J. Heal. Policy Manag. 2014, 2, 137–142. [Google Scholar] [CrossRef]
- Aghamolaei, T.; Eftekhaari, T.E.; Rafati, S.; Kahnouji, K.; Ahangari, S.; Shahrzad, M.E.; Kahnouji, A.; Hoseini, S.H. Service quality assessment of a referral hospital in Southern Iran with SERVQUAL technique: Patients’ perspective. BMC Health Serv. Res. 2014, 14, 322. [Google Scholar] [CrossRef] [Green Version]
- Zarei, E.; Daneshkohan, A.; Khabiri, R.; Arab, M. The Effect of Hospital Service Quality on Patient’s Trust. Iran. Red Crescent Med. J. 2014, 17, e17505. [Google Scholar] [CrossRef] [PubMed] [Green Version]
- Butt, M.M.; de Run, C.C. Private healthcare quality: Applying a SERVQUAL model. Int. J. Health Care Qual. Assur. 2010, 23, 658–673. [Google Scholar] [CrossRef] [PubMed]
- Al-Hawary, S.I.S. Health care services quality at private hospitals, from patients’ perspective: A comparative study between Jordan and Saudi Arabia. Afr. J. Bus. Manag. 2012, 6, 6516. [Google Scholar] [CrossRef]
- Hercos, B.V.S.; Berezovsky, A. Quality of the ophthalmological service to outpatients of the public and private healthcare systems. Arq. Bras. Oftalmol. 2017, 80, 350–354. [Google Scholar] [CrossRef] [PubMed]
- Goula, A.; Stamouli, M.-A.; Alexandridou, M.; Vorreakou, L.; Galanakis, A.; Theodorou, G.; Stauropoulos, E.; Kelesi, M.; Kaba, E. Public Hospital Quality Assessment. Evidence from Greek Health Setting Using SERVQUAL Model. Int. J. Environ. Res. Public Health 2021, 18, 3418. [Google Scholar] [CrossRef] [PubMed]
- Hayati, I.N.; Azimatun, N.A.; Rozita, H.; Ezat, W.S. MR A. Inpatient’s satisfaction in the medical and surgical wards-A comparison between accreditted and non accreditated hospital in the state of Selangor. J. Kesihat. Masyarakat 2010, 16, 60–68. [Google Scholar]
- Ganasegeran, K.; Perianayagam, W.; Manaf, M.R.A.; Jadoo, S.A.A.; Al-Dubai, S. Patient Satisfaction in Malaysia’s Busiest Outpatient Medical Care. Sci. World J. 2015, 2015, 1–6. [Google Scholar] [CrossRef] [Green Version]
- Al-Momani, M.M. Gap Analysis between Perceptions and Expectations of Medical-Surgical Patients in a Public Hospital in Saudi Arabia. Med. Princ. Pract. 2015, 25, 79–84. [Google Scholar] [CrossRef] [PubMed]
- Bodur, S.; Özdemir, Y.E.; Kara, F. Outpatient satisfaction with health centres in Urban Areas. Turk. J. Med. Sci. 2002, 32, 409–414. [Google Scholar]
- Padma, P.; Rajendran, C.; Lokachari, P.S. Service quality and its impact on customer satisfaction in Indian hospitals: Perspectives of patients and their attendants. Benchmark. Int. J. 2010, 17, 807–841. [Google Scholar] [CrossRef]
- Suki, N.M.; Lian, J.C.C.; Suki, N.M. A Comparison of Human Elements and Nonhuman Elements in Private Health Care Settings: Customers’ Perceptions and Expectations. J. Hosp. Mark. Public Relat. 2009, 19, 113–128. [Google Scholar] [CrossRef]
- Rose, R.C.; Uli, J.; Abdul, M.; Ng, K.L. Hospital service quality: A managerial challenge. Int. J. Health Care Qual. Assur. Inc. Lead-Ersh Health Serv. 2004, 17, 146–159. [Google Scholar] [CrossRef] [PubMed]
- Wysong, P.R.; Driver, E. Patients’ perceptions of nurses’ skill. Crit. Care Nurse 2009, 29, 24–37. [Google Scholar] [CrossRef] [PubMed] [Green Version]
- Khamis, K.; Njau, B. Patients’ level of satisfaction on quality of health care at Mwananyamala hospital in Dar es Salaam, Tanzania. BMC Health Serv. Res. 2014, 14, 400. [Google Scholar] [CrossRef] [PubMed] [Green Version]


| Author | Year | Country | Place of Research | No. of Participants (n) | Gender | Age [Years] | Marital Status | Comments | |||||||
|---|---|---|---|---|---|---|---|---|---|---|---|---|---|---|---|
| Women | Men | Single | Married | ||||||||||||
| n | % | n | % | Mean | SD | n | % | n | % | ||||||
| Golshan [16] | 2019 | Iran | Hospital | 51 | 20 | 39.2 | 31 | 60.8 | 44.7 | 4.39 | 109 | 20.5 | 422 | 79.5 | Urolithiasis patients adherence |
| Golshan [16] | 2019 | Iran | Hospital | 531 | 172 | 32.4 | 359 | 67.6 | 51.03 | 11.05 | 9 | 17.6 | 42 | 82.4 | Urolithiasis patients non-adherence |
| Nadi [6] | 2016 | Iran | Hospital | 600 | 439 | 73.2 | 161 | 26.8 | 39.94 | 10.99 | 64 | 10.7 | 536 | 89.3 | The study population included patients with at least 24 h hospitalisation period at internal, surgical, gynaecological and paediatricsectors |
| Al Fraihi [4] | 2016 | Saudi Arabia | Hospital | 306 | 117 | 38.2 | 189 | 61.8 | NR | NR | NR | NR | NR | NR | Patients, patients in emergency condition |
| Zun [14] | 2018 | Malaysia | Public Clinic | 386 | 202 | 52.3 | 184 | 47.7 | 37.3 | 13.5 | NR | NR | NR | NR | Patients at the registration |
| Naqavi [5] | 2014 | Iran | Treatment centres | 260 | 32 | 12.3 | 228 | 87.7 | 37 | 9.4 | NR | NR | NR | NR | Drug addiction therapy |
| Rezaei [17] | 2016 | Iran | Hospital | 400 | 148 | 37 | 252 | 63 | 38.5 | 23.6 | NR | NR | NR | NR | Patients who were hospitalized for at least two days |
| Vafaee-Najar [18] | 2014 | Iran | Healthcare centre | 435 | 387 | 89 | 48 | 11 | 30.30 | 10.37 | 33 | 7.58 | 401 | 92.18 | Patients from physicians’ programmes |
| Aghamolaei [19] | 2014 | Iran | Hospital | 89 | 32 | 36 | 57 | 64 | 32.9 | 10.05 | NR | NR | NR | NR | Hospitalised patients |
| Bahadori [8] | 2014 | Iran | Haemodialysis centre | 184 | 75 | 40.8 | 109 | 59.2 | NR | NR | 67 | 36.4 | 117 | 63.6 | Chronic kidney disease |
| Mohammadi [13] | 2010 | Iran | Healthcare centre | 300 | 300 | 100 | 0 | 0 | 28.4 | NR | 0 | 0 | 300 | 100 | Patients of health care centres |
| Lee [12] | 2006 | South Korea | Hospital | 272 | 121 | 44.5 | 151 | 52.6 | NR | NR | NR | NR | NR | NR | Patients |
| Lee [12] | 2006 | South Korea | Hospital | 282 | 282 | 100 | 0 | 0 | NR | NR | NR | NR | NR | NR | Nurses |
| Roy [15] | 2017 | Bangladesh | Healthcare centre | 200 | 90 | 45 | 110 | 55 | NR | NR | NR | NR | NR | NR | Patients of public healthcare centres |
| Roy [15] | 2017 | Bangladesh | Healthcare centre | 200 | 92 | 46 | 108 | 54 | NR | NR | NR | NR | NR | NR | Patients of private healthcare centres |
| Qolipour [9] | 2018 | Iraq | Hospital | 250 | 77 | 30.8 | 173 | 69.2 | 39.0 | 2.2 | 70 | 28 | 180 | 72 | Iraqi tourists evaluating Iranian hospital services |
| Fatima [11] | 2017 | Pakistan | Hospital | 817 | 423 | 51.8 | 394 | 48.2 | 37.4 | 16.6 | NR | NR | NR | NR | Patients of Emergency, Surgical or Diagnostic Department |
| Shafiq [10] | 2017 | Pakistan | Hospital | 340 | NR | NR | NR | NR | NR | NR | NR | NR | NR | NR | Patients |
| TOTAL | - | - | - | 5903 | 3009 | 54 | 2554 | 46 | 37.9 | 11.2 | 59 | 17 | 285 | 83 | - |
| Author | Expectations | Perceptions | ||||||||||||||||||
|---|---|---|---|---|---|---|---|---|---|---|---|---|---|---|---|---|---|---|---|---|
| Tangibility | Reliability | Responsiveness | Assurance | Empathy | Tangibility | Reliability | Responsiveness | Assurance | Empathy | |||||||||||
| M | SD | M | SD | M | SD | M | SD | M | SD | M | SD | M | SD | M | SD | M | SD | M | SD | |
| Golshan [16] (Urolithiasis patients adherence) | 5.00 | - | 4.79 | - | 5.00 | - | 5.00 | - | 5.00 | - | 3.24 | 0.35 | 3.26 | 0.54 | 2.82 | 0.50 | 3.57 | 0.49 | 3.44 | 0.36 |
| Golshan [16] (Urolithiasis patients non-adherence) | 5.00 | - | 5.00 | - | 5.00 | - | 5.00 | - | 5.00 | - | 3.86 | 0.48 | 4.04 | 0.48 | 4.22 | 0.48 | 4.65 | 0.23 | 4.65 | 0.23 |
| Nadi [6] | 4.62 | 0.47 | 4.62 | 0.47 | 4.61 | 0.48 | 4.60 | 0.46 | 4.61 | 0.47 | 3.93 | 0.43 | 4.31 | 0.36 | 3.89 | 0.46 | 3.82 | 0.48 | 3.97 | 0.34 |
| Al Fraihi [4] | 4.60 | 0.56 | 4.60 | 0.54 | 4.50 | 0.60 | 4.60 | 0.54 | 4.70 | 0.53 | 3.20 | 0.90 | 3.50 | 0.82 | 3.20 | 0.83 | 3.50 | 0.83 | 3.90 | 0.84 |
| Zun [14] | 4.44 | 0.44 | 4.49 | 0.44 | 4.48 | 0.46 | 4.50 | 0.46 | 4.56 | 0.46 | 4.19 | 0.53 | 4.36 | 0.51 | 4.35 | 0.50 | 4.32 | 0.49 | 4.40 | 0.51 |
| Naqavi [5] | 4.26 | 0.55 | 4.40 | 0.54 | 4.42 | 0.53 | 4.45 | 0.43 | 4.27 | 0.90 | 4.15 | 0.58 | 4.35 | 0.57 | 4.27 | 0.60 | 3.78 | 0.53 | 4.10 | 0.72 |
| Rezaei [17] | 4.61 | 0.90 | 4.43 | 0.80 | 4.52 | 0.51 | 4.70 | 0.65 | 4.65 | 0.34 | 3.81 | 1.12 | 3.65 | 1.21 | 3.96 | 1.45 | 3.82 | 1.33 | 3.78 | 1.60 |
| Vafaee-Najar [18] | 4.53 | 0.56 | 4.48 | 0.57 | 4.45 | 0.65 | 4.48 | 0.62 | 4.27 | 0.71 | 3.43 | 0.86 | 3.61 | 0.88 | 3.39 | 0.95 | 3.68 | 0.90 | 3.47 | 0.97 |
| Aghamolaei [19] | 4.73 | 0.40 | 4.72 | 0.43 | 4.76 | 0.38 | 4.76 | 0.47 | 4.69 | 0.47 | 3.42 | 0.83 | 3.49 | 0.72 | 3.34 | 0.81 | 3.56 | 0.86 | 3.39 | 0.80 |
| Bahadori [8] | 4.30 | 0.35 | 4.60 | 0.22 | 4.57 | 0.29 | 4.72 | 0.27 | 4.37 | 0.35 | 4.01 | 0.38 | 4.26 | 0.32 | 4.21 | 0.35 | 4.30 | 0.36 | 3.84 | 0.34 |
| Mohammadi [13] | 4.33 | 0.76 | 4.56 | 0.66 | 4.32 | 0.63 | 4.28 | 0.72 | 4.17 | 0.71 | 3.20 | 0.89 | 2.55 | 0.98 | 2.49 | 0.96 | 3.06 | 0.70 | 2.83 | 0.89 |
| Lee [12] (patients) | 3.48 | 0.75 | 3.75 | 0.84 | 3.67 | 0.84 | 3.75 | 0.88 | 3.60 | 0.89 | 3.43 | 0.79 | 3.70 | 0.82 | 3.61 | 0.84 | 3.67 | 0.85 | 3.63 | 0.86 |
| Lee [12] (nurses) | 3.96 | 0.48 | 4.12 | 0.51 | 4.00 | 0.53 | 4.03 | 0.54 | 3.99 | 0.57 | 3.56 | 0.54 | 3.86 | 0.51 | 3.79 | 0.53 | 3.78 | 0.55 | 3.85 | 0.53 |
| Roy [15] (Patients of public healthcare centres) | 4.22 | 0.33 | 4.84 | 0.31 | 4.55 | 0.45 | 4.64 | 0.49 | 4.67 | 0.34 | 3.39 | 0.53 | 3.86 | 0.54 | 3.31 | 0.99 | 3.62 | 0.77 | 3.68 | 0.61 |
| Roy [15] (Patients of private healthcare centres) | 4.60 | 0.39 | 4.86 | 0.30 | 4.57 | 0.44 | 4.64 | 0.49 | 4.71 | 0.33 | 3.82 | 0.37 | 4.21 | 0.36 | 3.71 | 0.89 | 3.95 | 0.64 | 3.80 | 0.45 |
| Qolipour [9] | 4.61 | 0.41 | 4.73 | 0.39 | 4.84 | 0.35 | 4.76 | 0.38 | 4.82 | 0.33 | 3.92 | 0.70 | 3.00 | 0.73 | 2.94 | 0.74 | 3.26 | 0.73 | 3.80 | 0.92 |
| Fatima [11] | 4.66 | 0.64 | 4.65 | 0.66 | 4.61 | 0.73 | 4.68 | 0.59 | 4.65 | 0.67 | 3.68 | 1.00 | 3.88 | 0.96 | 3.88 | 0.99 | 3.96 | 0.89 | 3.86 | 0.99 |
| Shafiq [10] | 4.69 | 0.46 | 4.65 | 0.47 | 4.68 | 0.44 | 4.66 | 0.47 | 4.69 | 0.46 | 3.67 | 0.81 | 3.66 | 0.77 | 3.62 | 0.82 | 3.47 | 0.89 | 3.59 | 0.83 |
| Total | 4.48 | 0.53 | 4.57 | 0.51 | 4.53 | 0.52 | 4.57 | 0.53 | 4.52 | 0.53 | 3.66 | 0.67 | 3.75 | 0.67 | 3.61 | 0.76 | 3.77 | 0.70 | 3.78 | 0.71 |
Publisher’s Note: MDPI stays neutral with regard to jurisdictional claims in published maps and institutional affiliations. |
© 2022 by the authors. Licensee MDPI, Basel, Switzerland. This article is an open access article distributed under the terms and conditions of the Creative Commons Attribution (CC BY) license (https://creativecommons.org/licenses/by/4.0/).
Share and Cite
Jonkisz, A.; Karniej, P.; Krasowska, D. The Servqual Method as an Assessment Tool of the Quality of Medical Services in Selected Asian Countries. Int. J. Environ. Res. Public Health 2022, 19, 7831. https://doi.org/10.3390/ijerph19137831
Jonkisz A, Karniej P, Krasowska D. The Servqual Method as an Assessment Tool of the Quality of Medical Services in Selected Asian Countries. International Journal of Environmental Research and Public Health. 2022; 19(13):7831. https://doi.org/10.3390/ijerph19137831
Chicago/Turabian StyleJonkisz, Aleksandra, Piotr Karniej, and Dorota Krasowska. 2022. "The Servqual Method as an Assessment Tool of the Quality of Medical Services in Selected Asian Countries" International Journal of Environmental Research and Public Health 19, no. 13: 7831. https://doi.org/10.3390/ijerph19137831
APA StyleJonkisz, A., Karniej, P., & Krasowska, D. (2022). The Servqual Method as an Assessment Tool of the Quality of Medical Services in Selected Asian Countries. International Journal of Environmental Research and Public Health, 19(13), 7831. https://doi.org/10.3390/ijerph19137831