
Peaking Industrial CO2 Emission in a Typical Heavy Industrial Region: From Multi-Industry and Multi-Energy Type Perspectives


Abstract
:1. Introduction
2. Materials and Methods
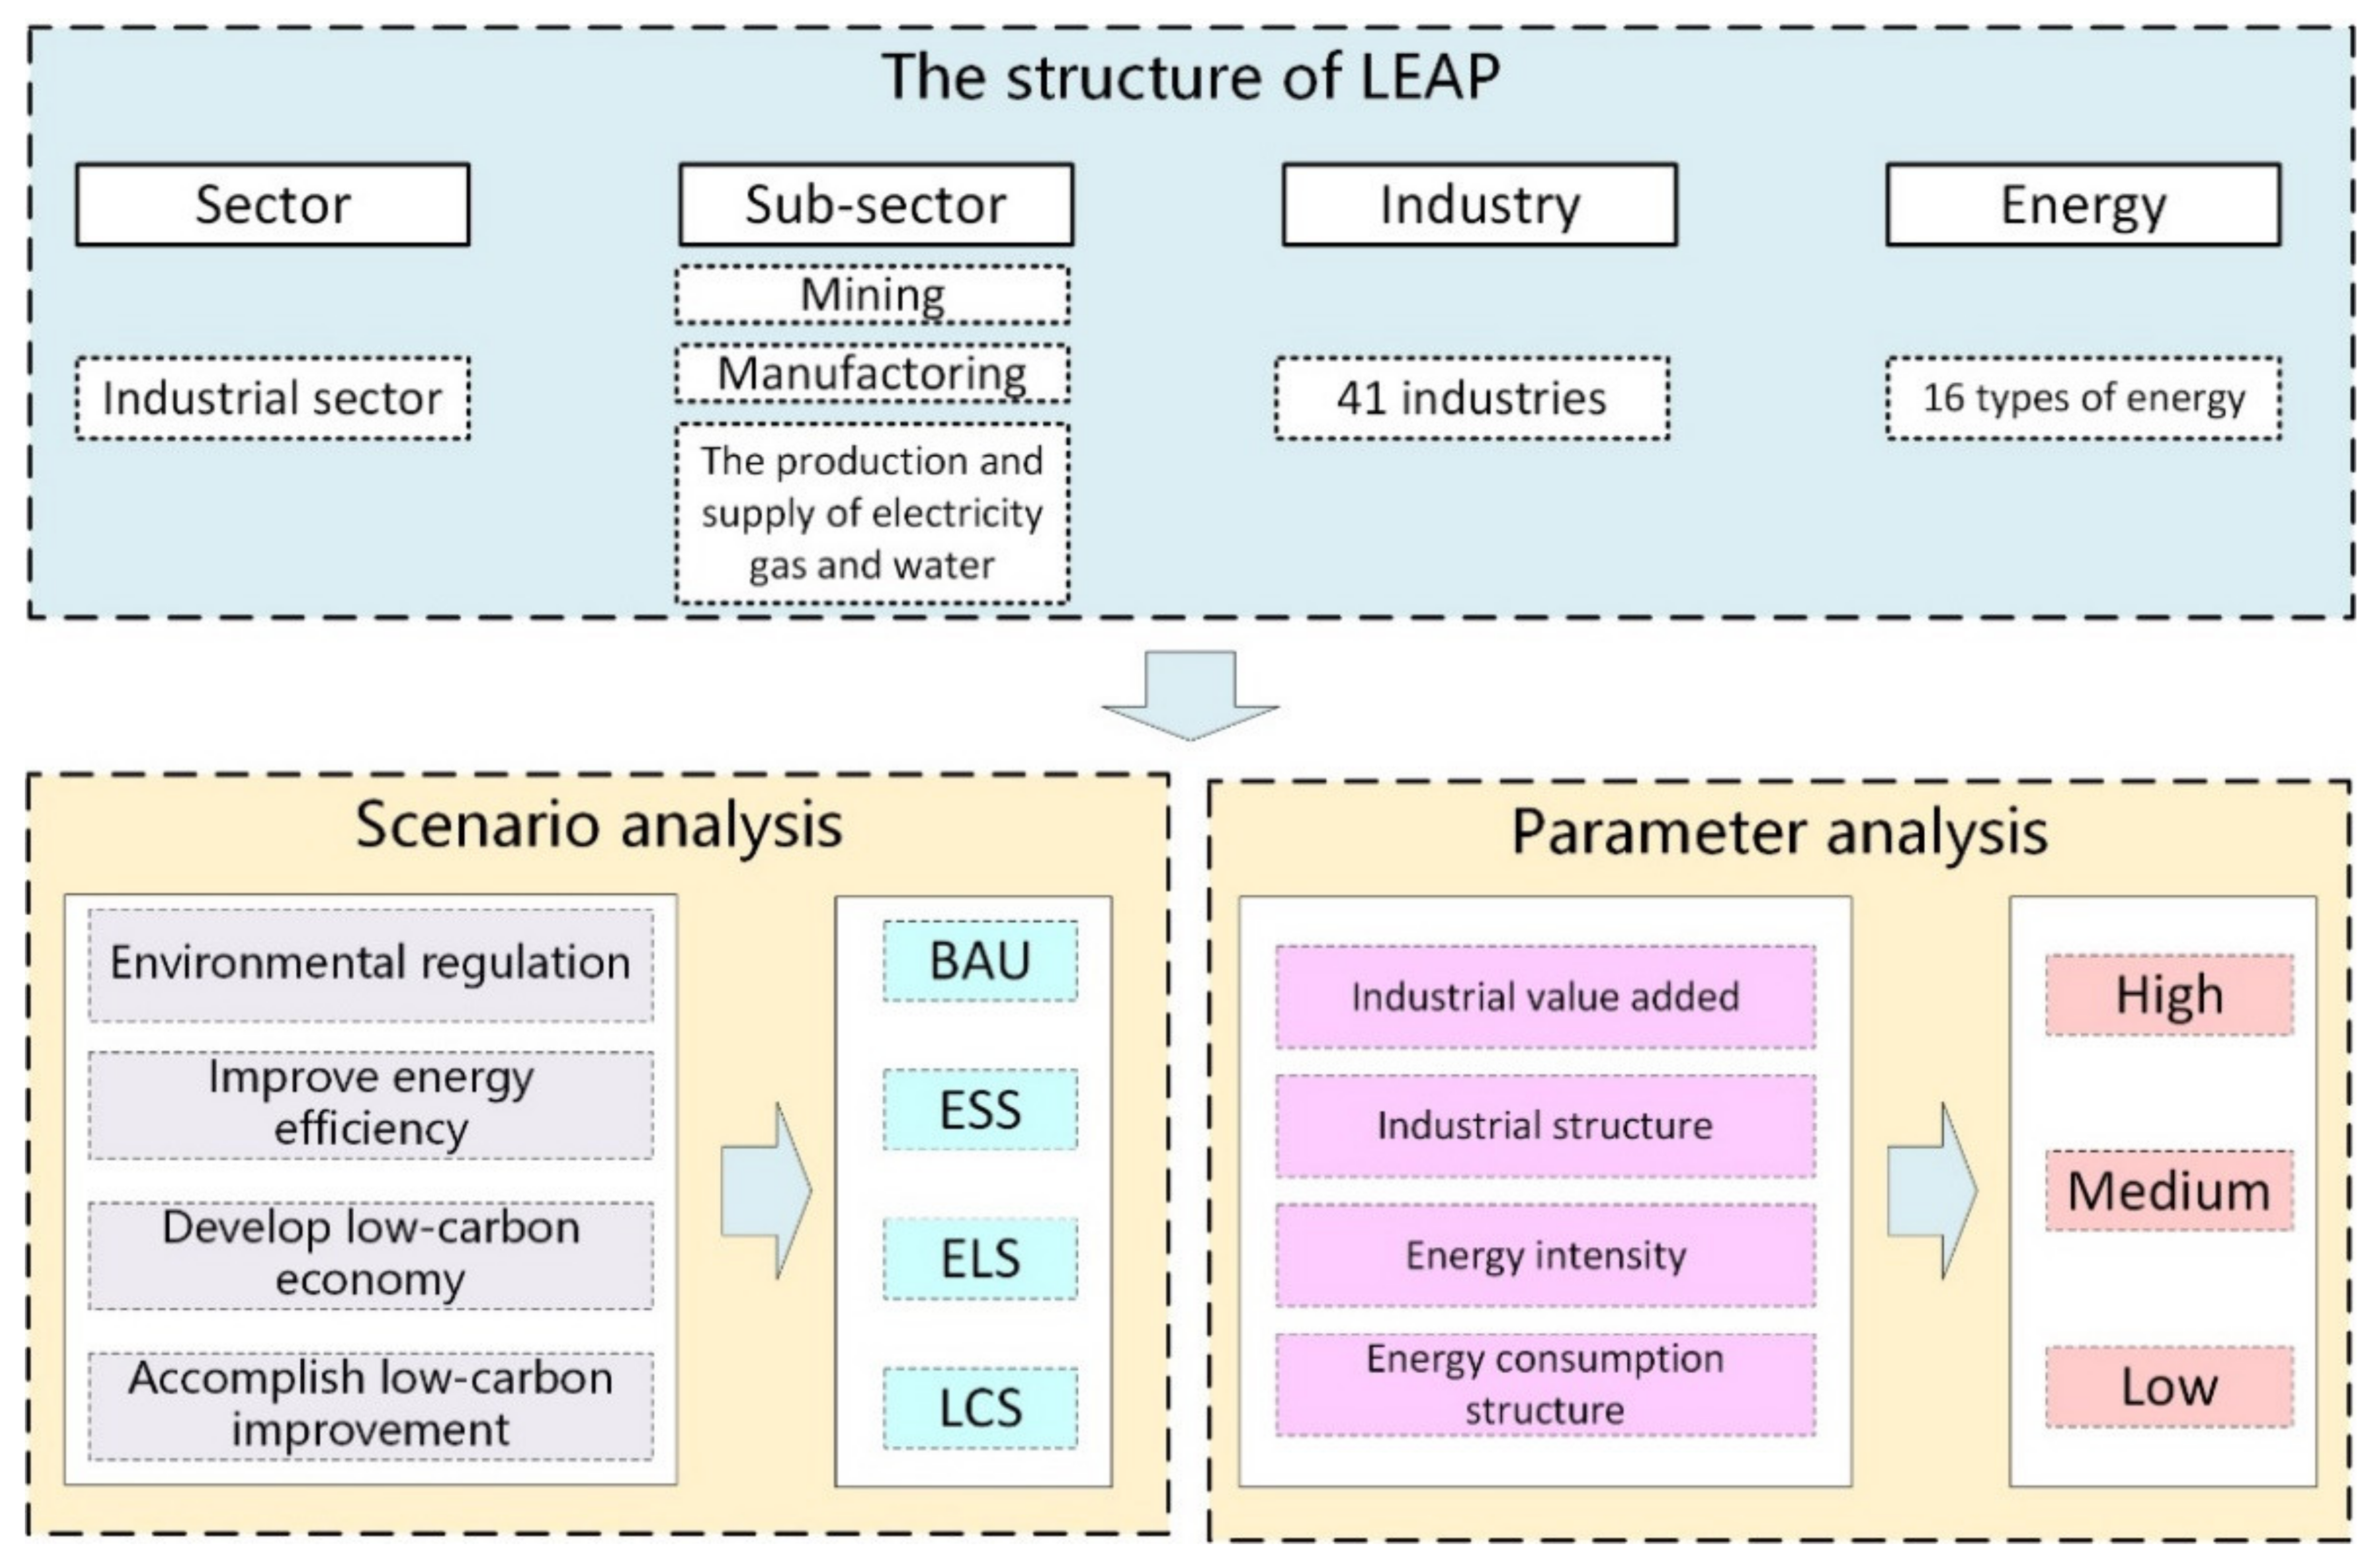
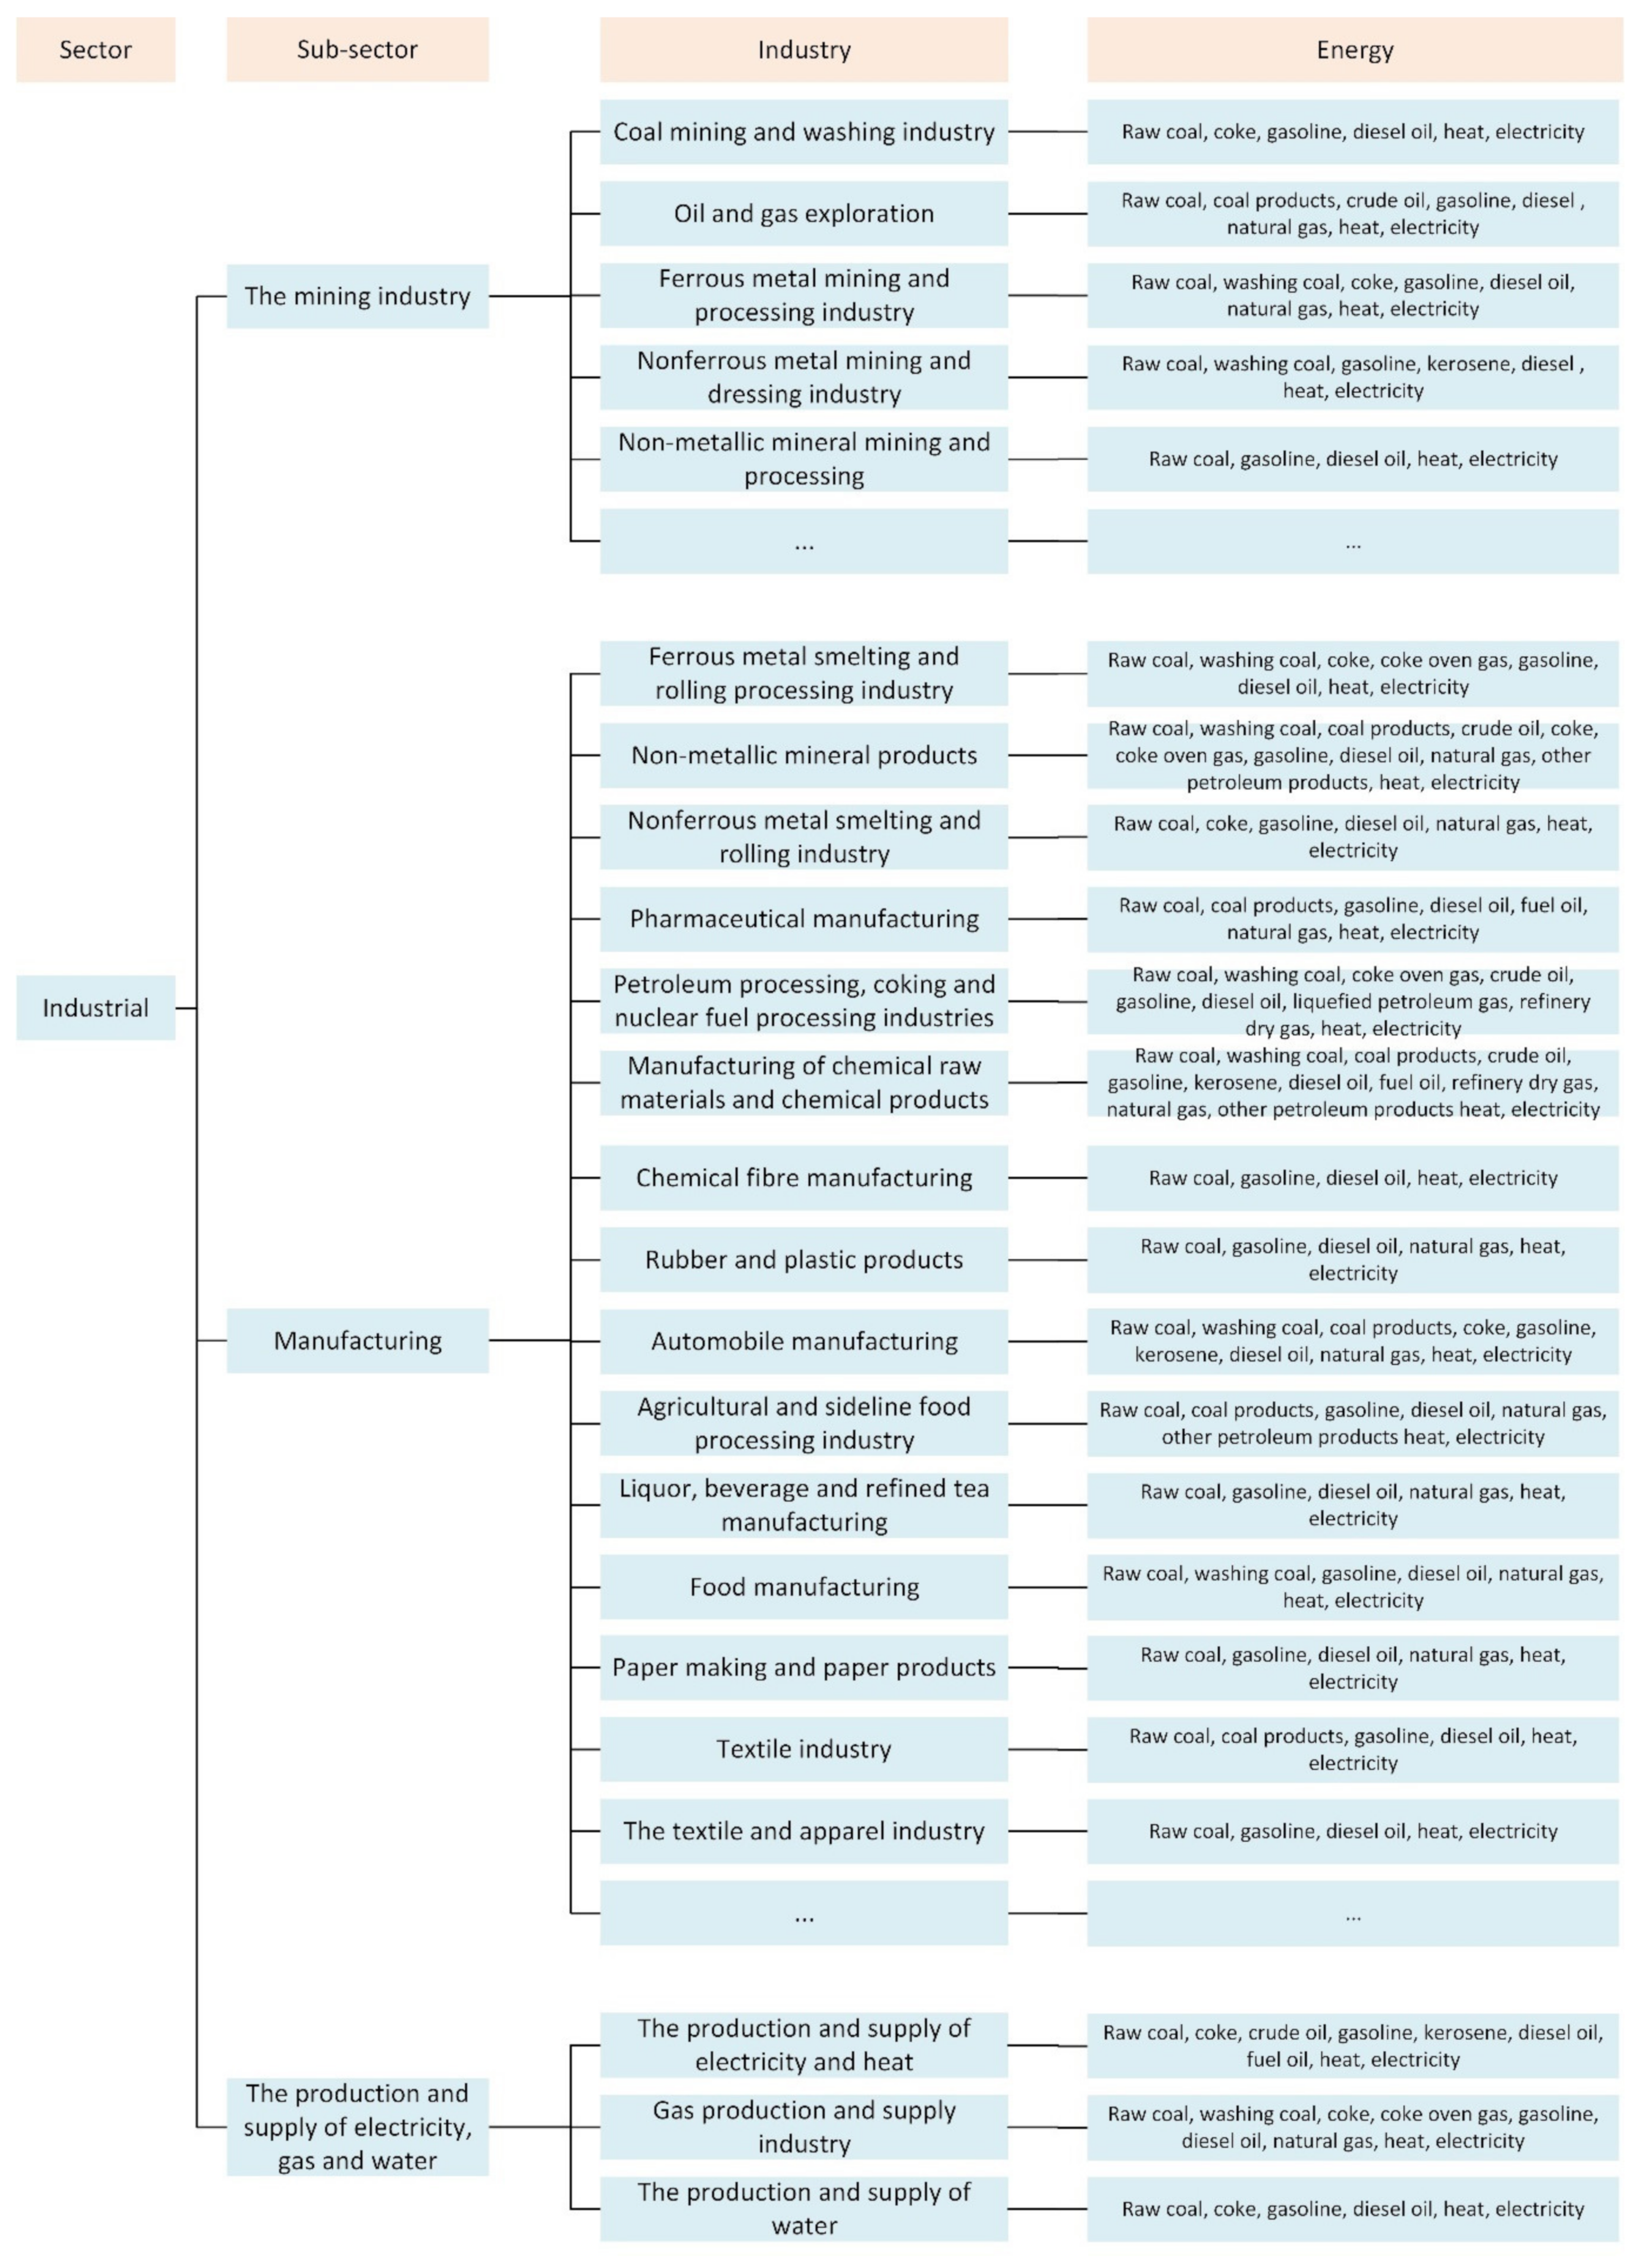
2.1. LEAP Model
2.2. Calculation Method of CO2 Emission
3. Case Study
3.1. Study Area
3.2. Scenarios
3.2.1. Business-as-Usual Scenario (BAU)
3.2.2. Energy-Saving Scenario (ESS)
3.2.3. Energy-Saving and Low-Carbon Scenario (ELS)
3.2.4. Low-Carbon Scenario (LCS)
3.3. Parameter Setting
3.4. Data
4. Results
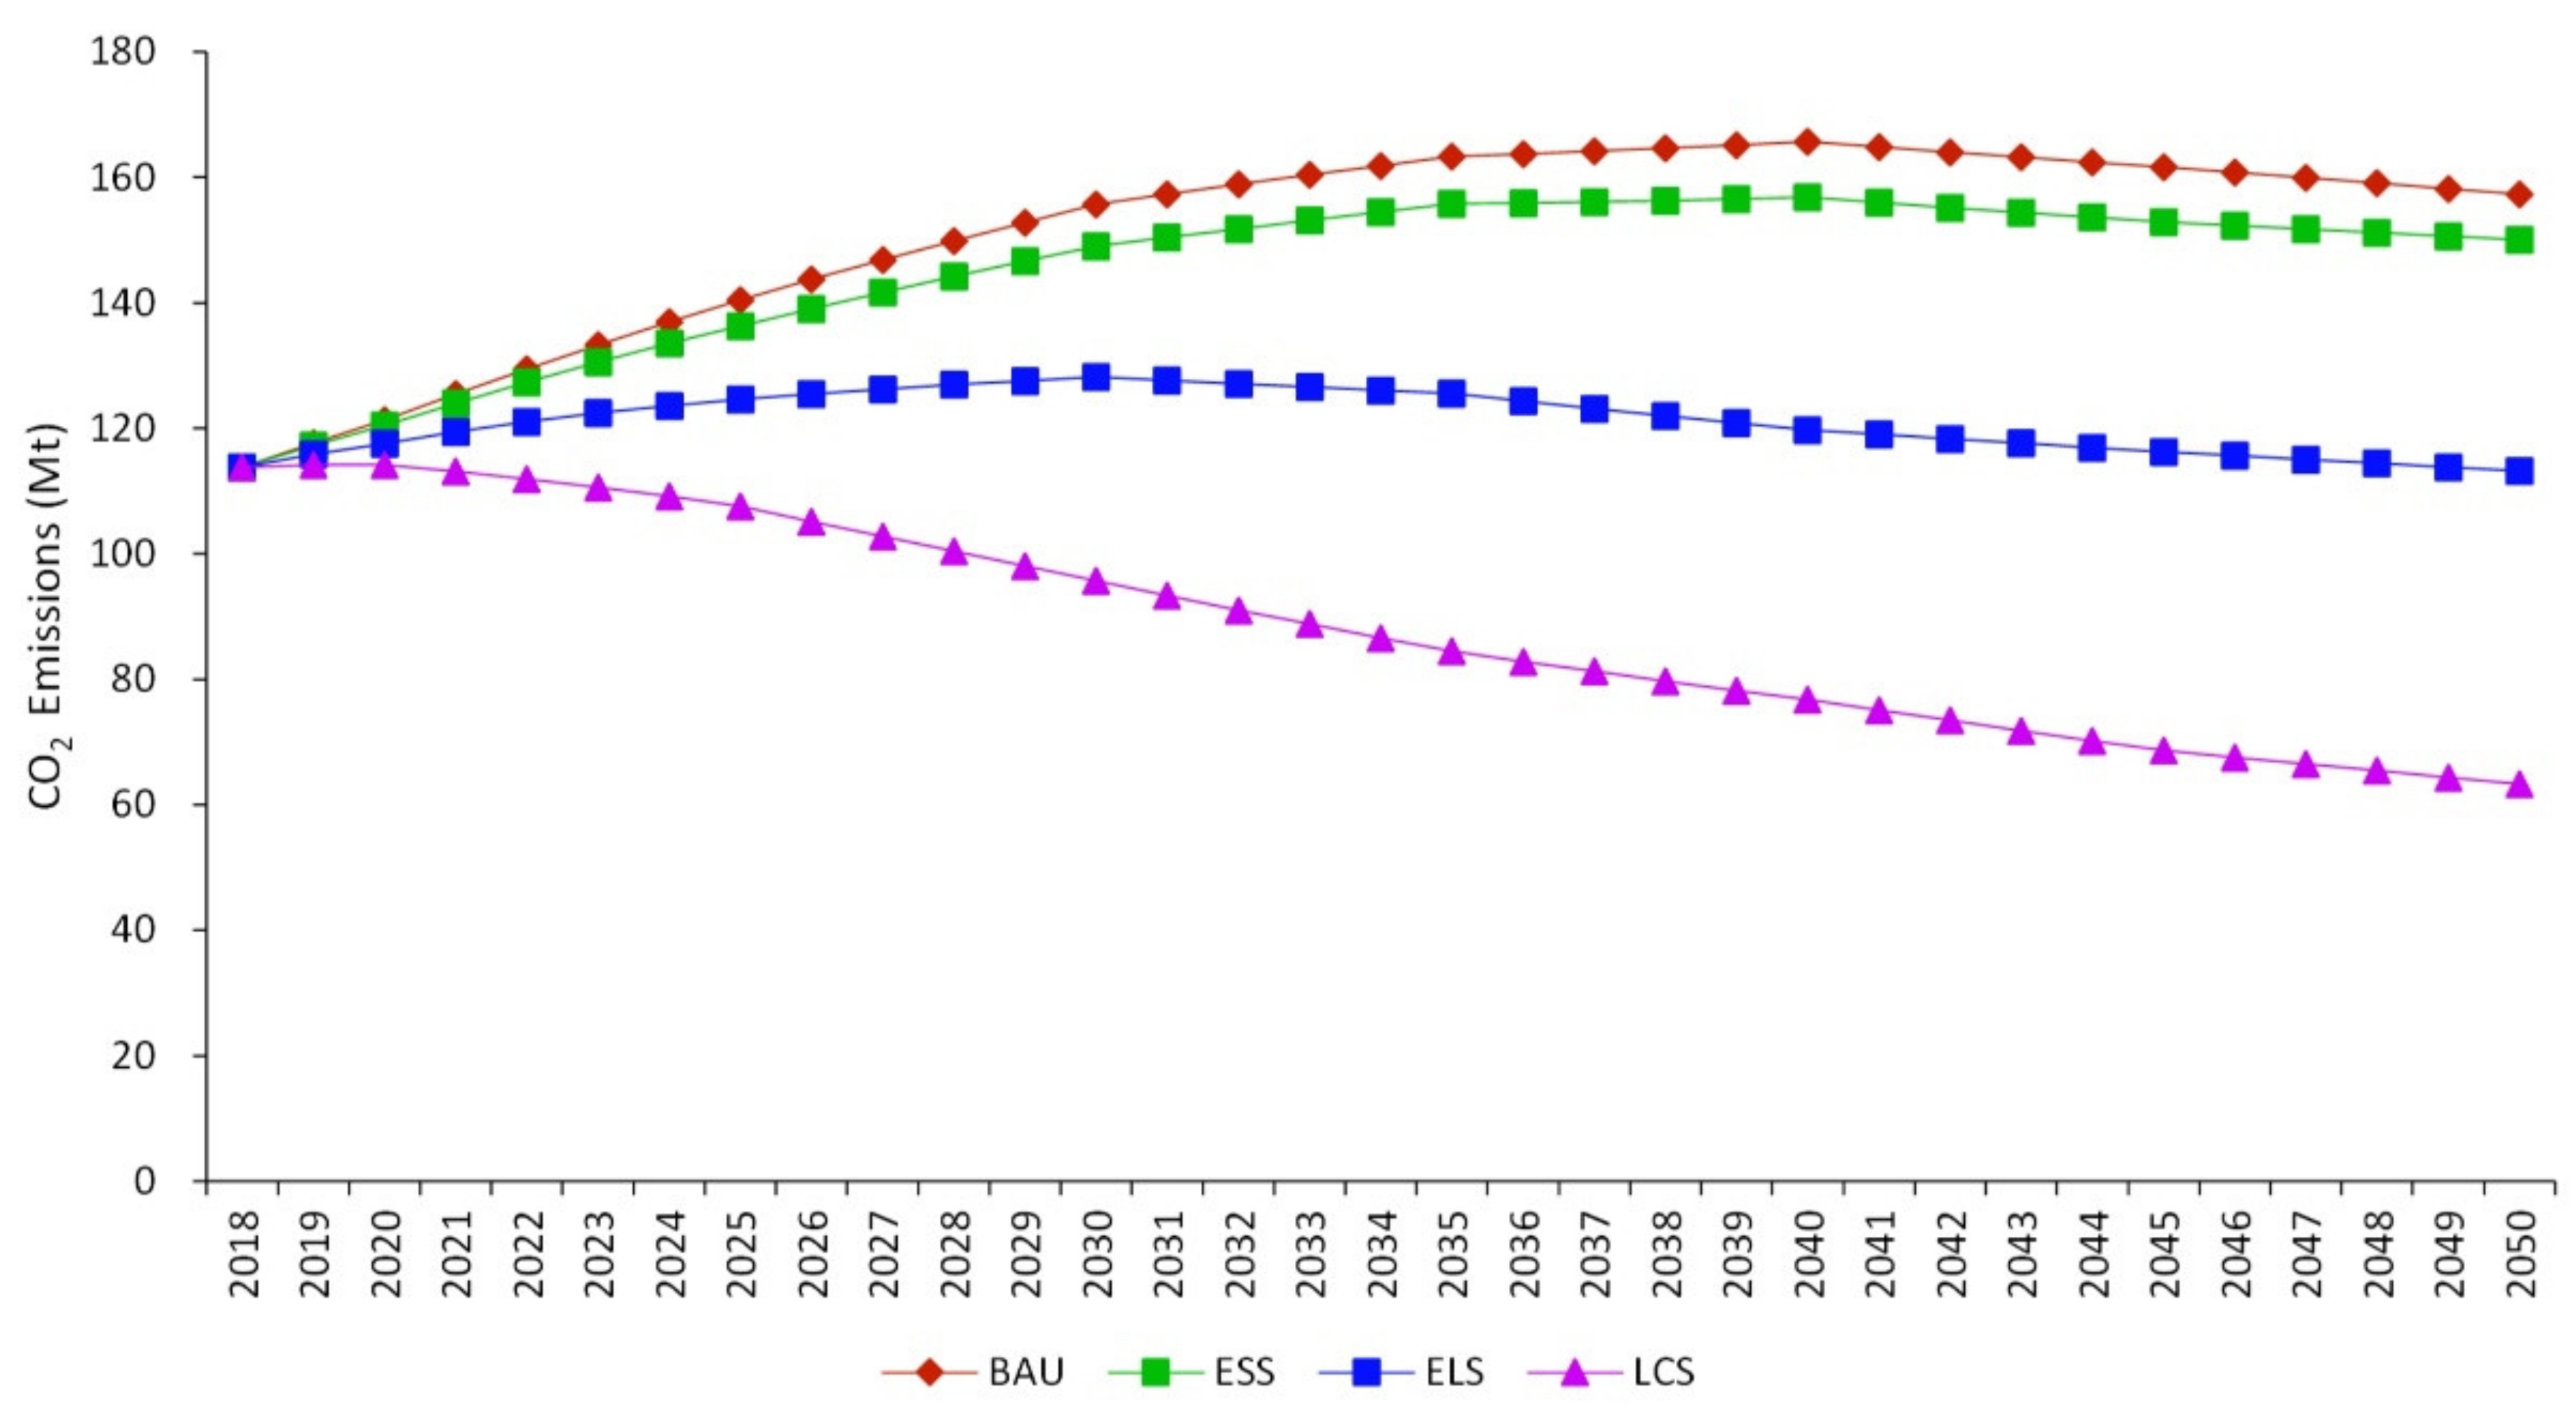
4.1. Analysis of CO2 Emission Reduction Potential of Industrial Sector
4.2. Optimal Scenario Selection
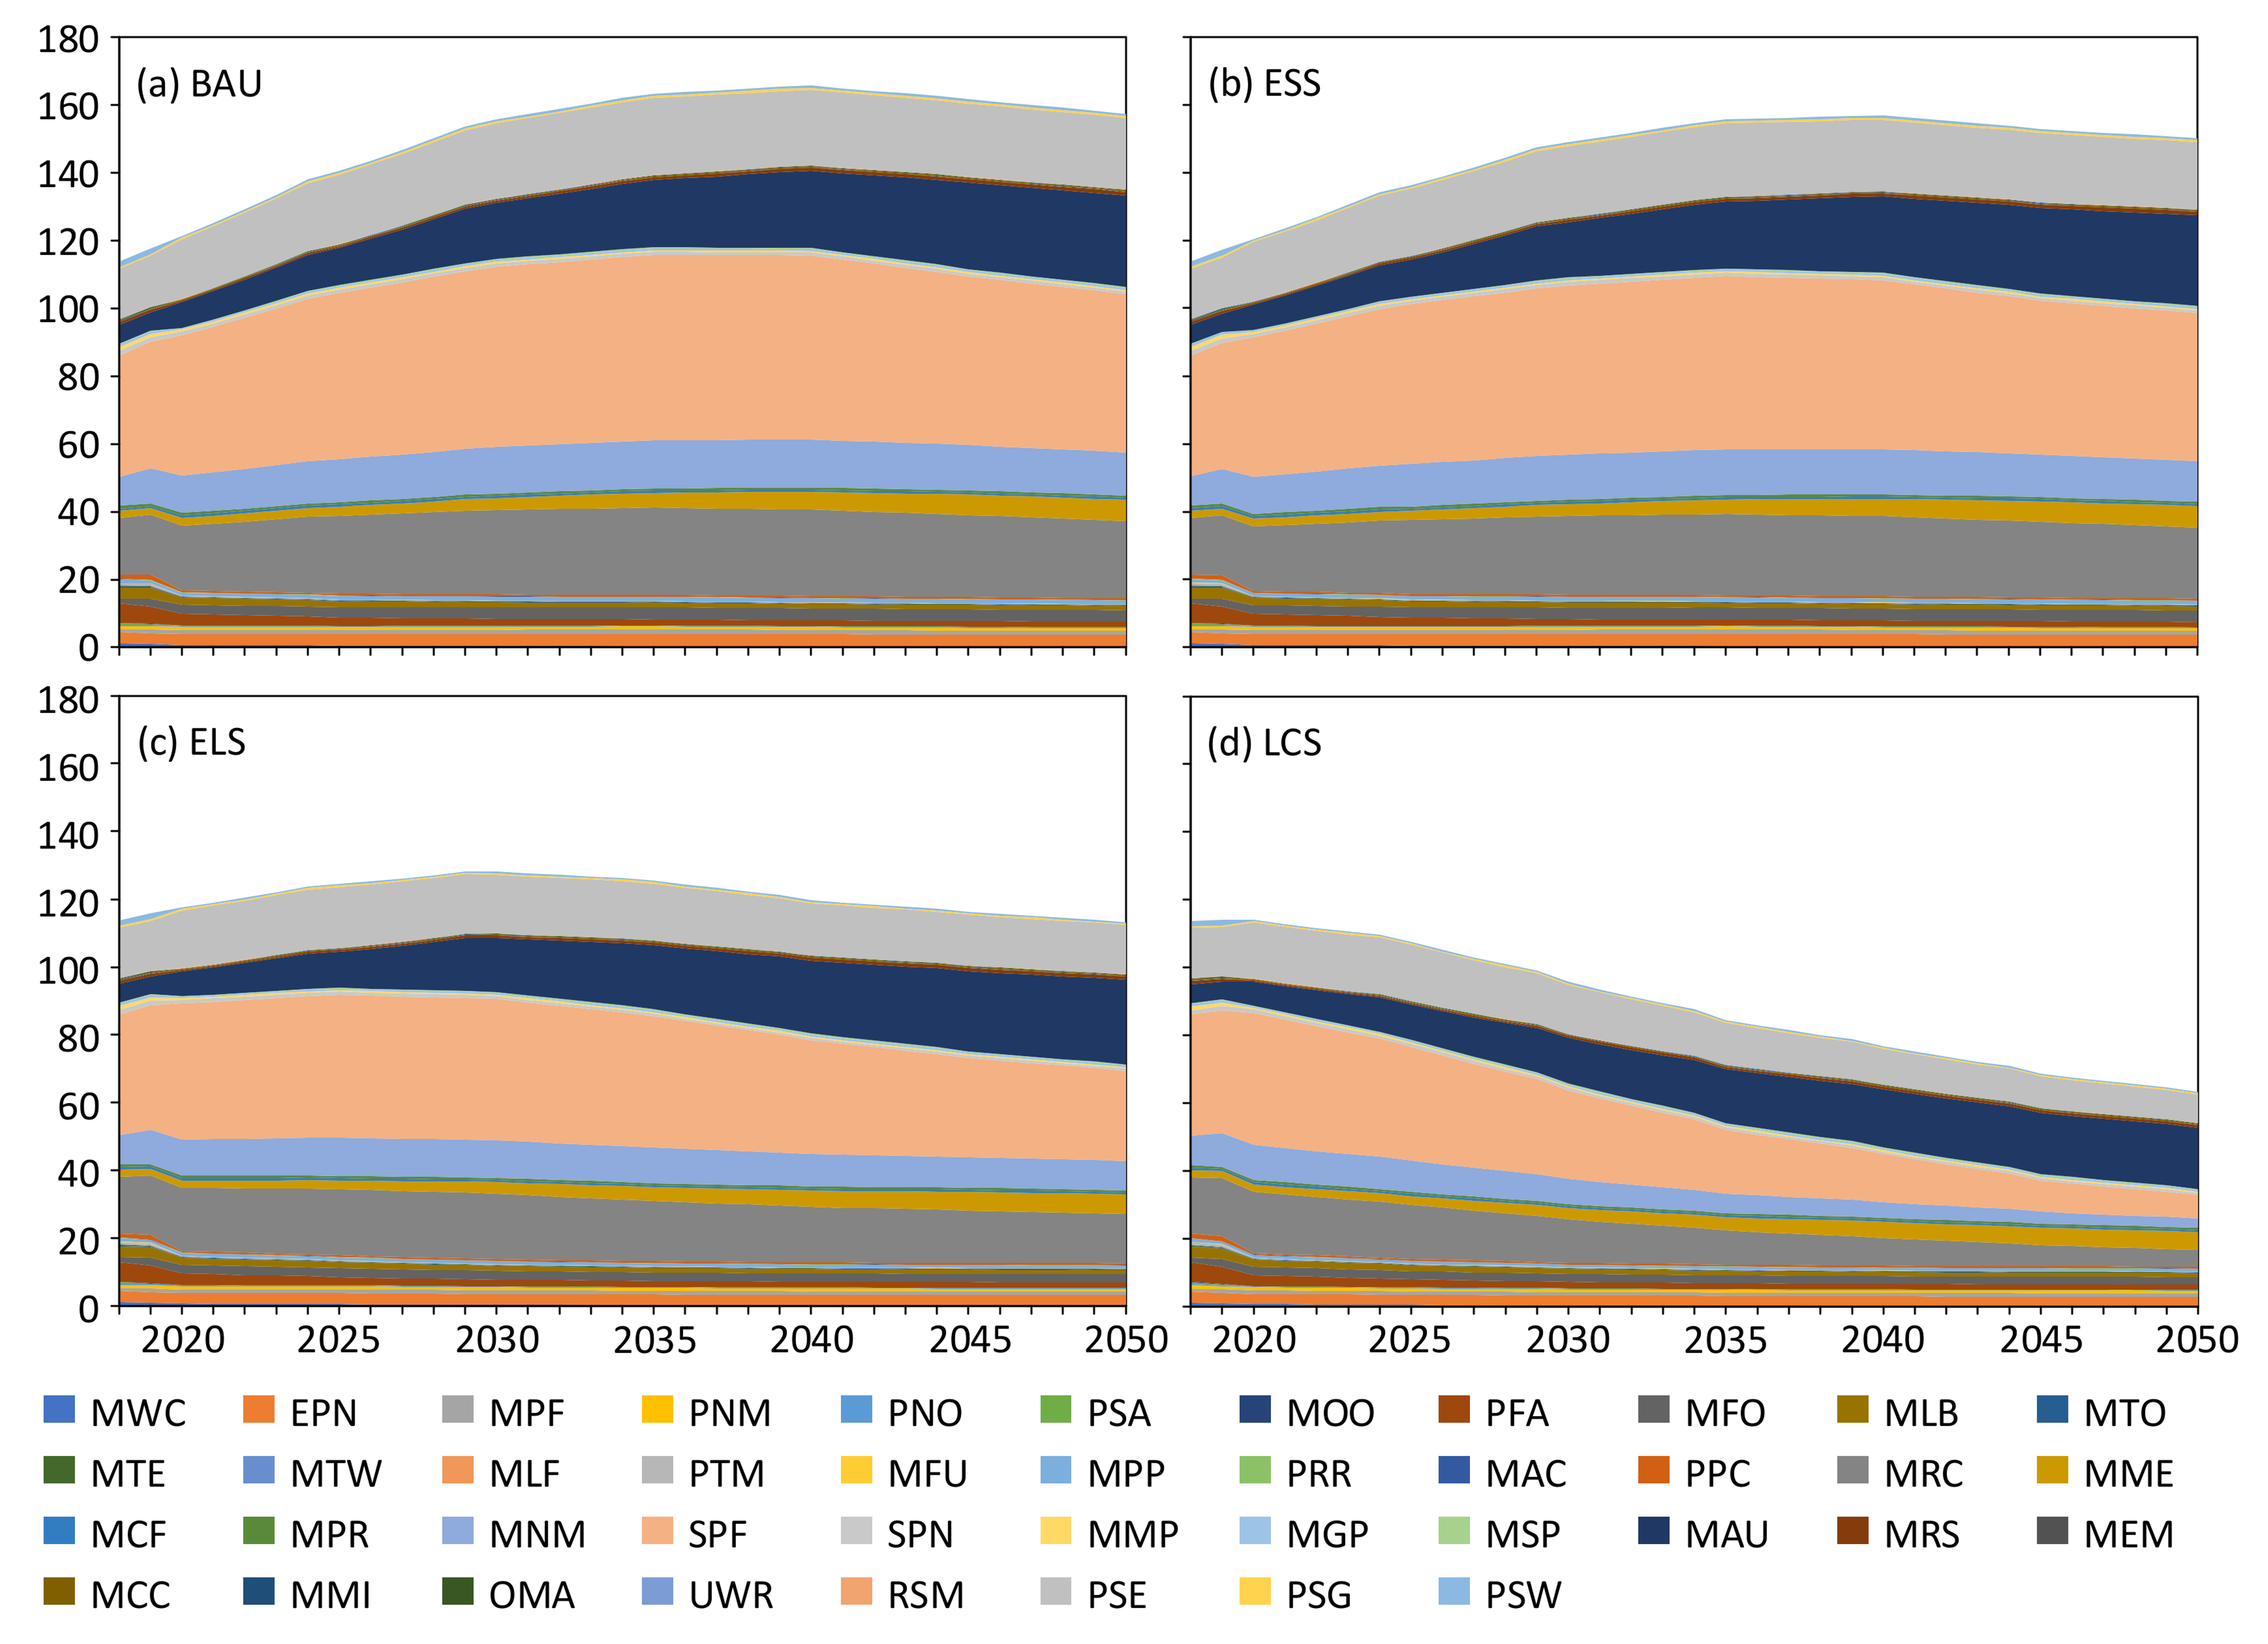
4.3. Multi-Industry CO2 Emission
4.3.1. Multi- Industry CO2 Emission under the BAU Scenario
4.3.2. Multi-Industry CO2 Emission under the ESS Scenario
4.3.3. Multi-Industry CO2 Emission under the ELS Scenario
4.3.4. Multi-Industry CO2 Emission under the LCS Scenario
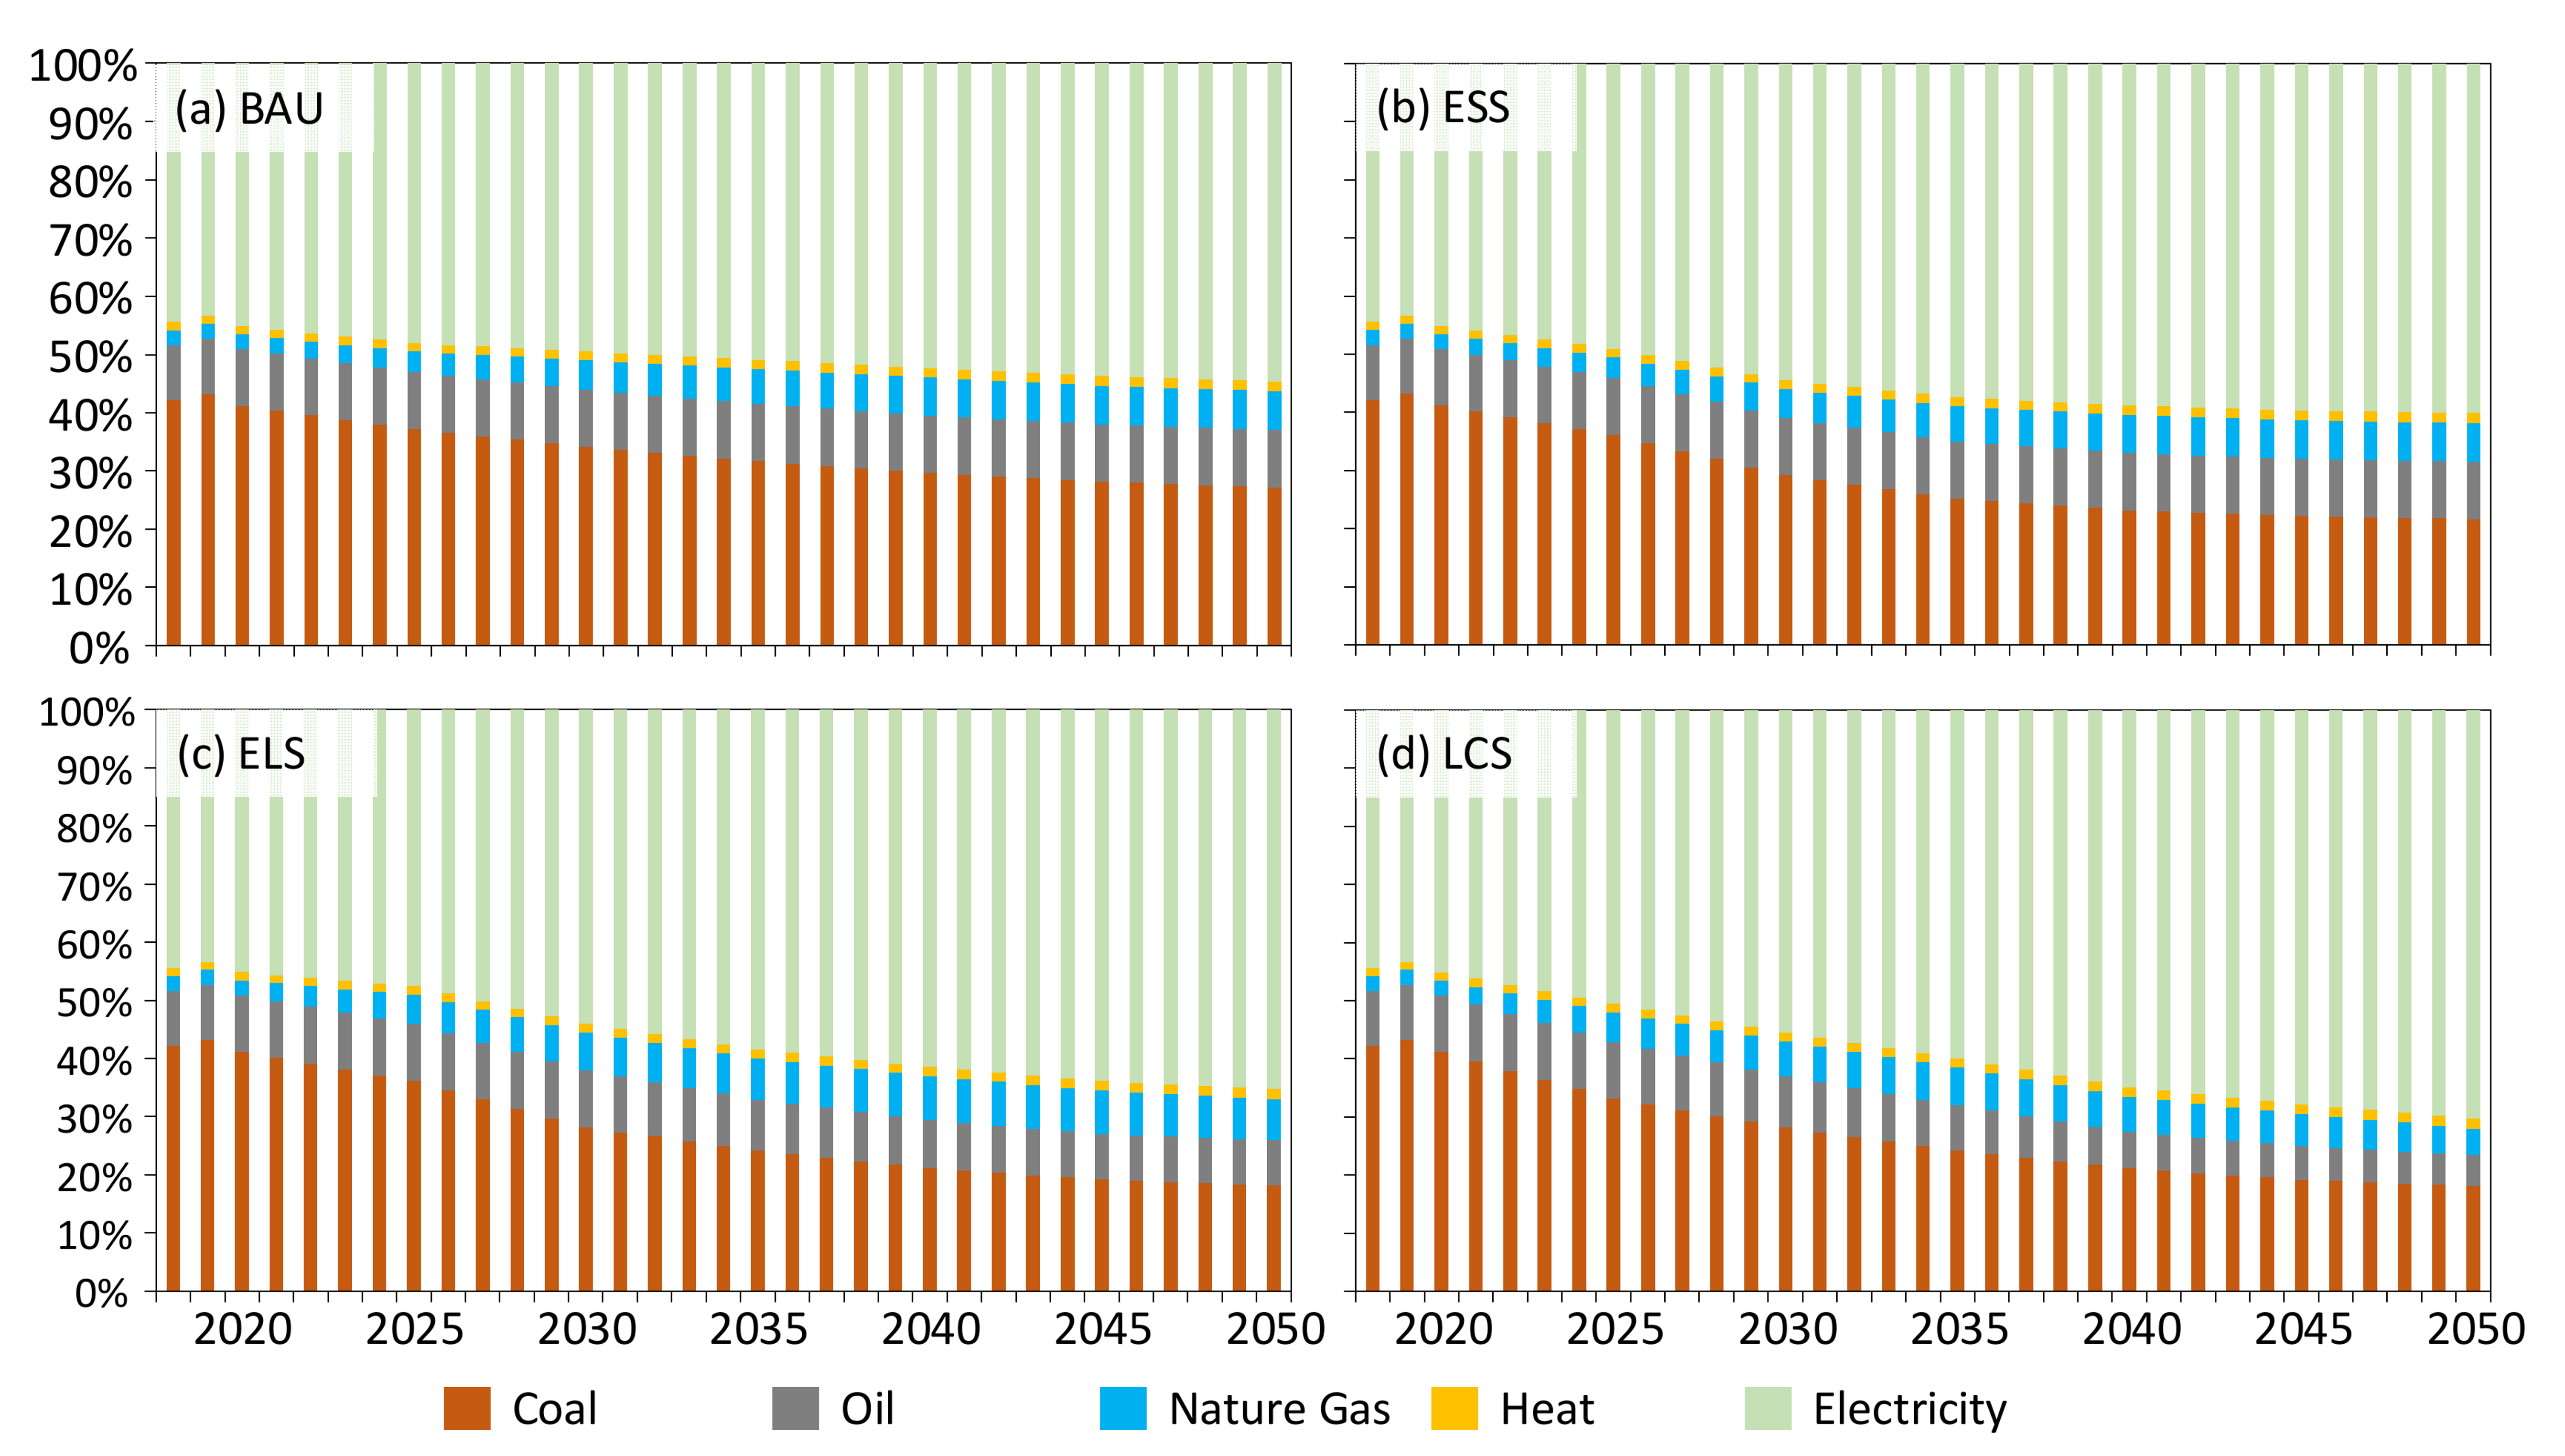
4.4. CO2 Emission of Industrial Sector from Multi-Energy Types in Four Scenarios
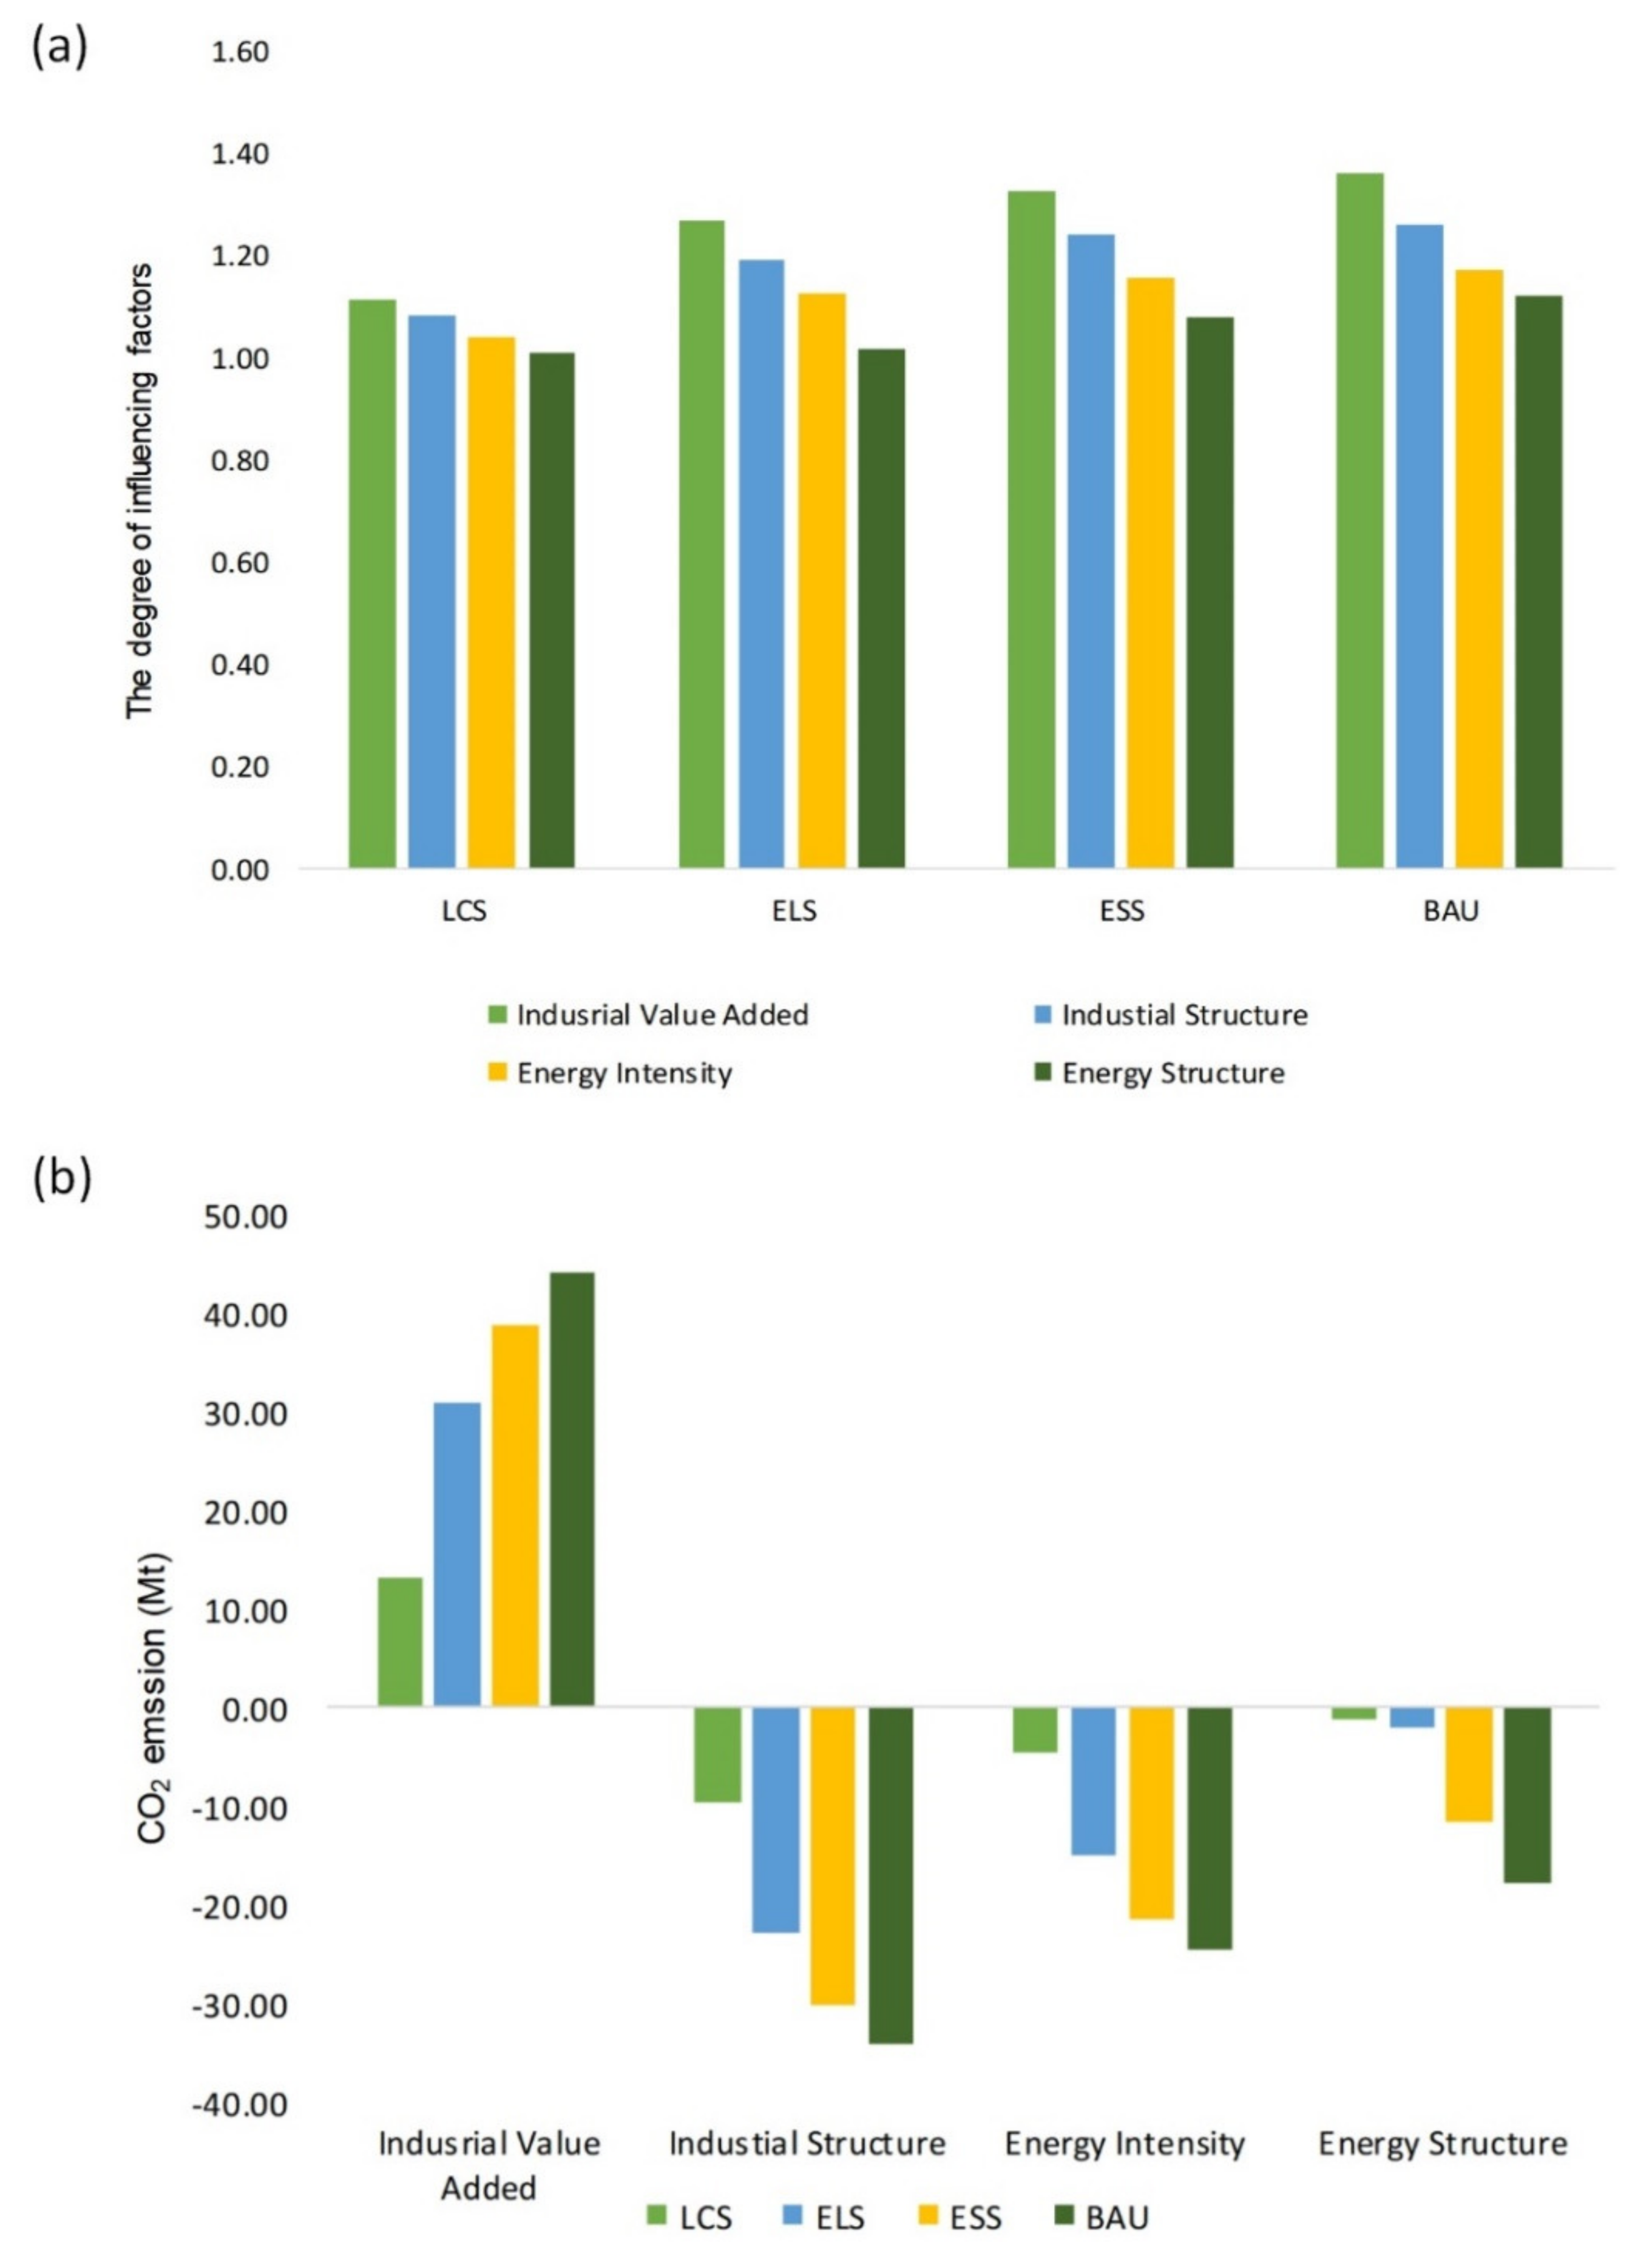
4.5. Analyze Influencing Factor of CO2 Emission from Industrial Sector
4.5.1. Comparative Analysis of Peak Value
4.5.2. Comparative Analysis of Peak Time
5. Discussion and Policy Implications
6. Conclusions
- (1)
- The peak times in the BAU, the ESS, the ELS, and the LCS, are 2040, 2040, 2030 and 2020 respectively, and the corresponding peak values are 165.65 Mt, 156.80 Mt, 128.16 Mt, and 114.17 Mt.
- (2)
- ELS is the optimal scenario to coordinate the conflict between CO2 emission reduction and economic development with peak value 156.80 Mt in 2030.
- (3)
- Under the ELS, the CO2 emissions of ferrous metal smelting and rolling processing industry, chemical raw materials and chemical products manufacturing, non-metallic mineral products industry, electric power and heat production and supply industry will experience a small increase (about 5%) during the 14th Five-Year Plan period, and will peak in 2025.
- (4)
- Taking the ELS as an example, the influence degree of the four factors is as follows: industrial value added (1.27) > industrial structure (1.19) > energy intensity of each industry (1.12) > energy consumption types of each industry (1.02).
Author Contributions
Funding
Conflicts of Interest
Appendix A

| Scenarios | Parameter Descriptions | References |
|---|---|---|
| BAU | The specific manifestations of the BAU are rapid industrial development, rapid growth of industrial value added, traditional industries with high energy dependence account for a large proportion of industrial added value, high energy intensity, limited energy efficiency level, and coal and oil in the final energy consumption. The proportion of other fossil energy sources is relatively high. Among them, the industrial added value increased steadily at 6% in accordance with the 13th Five-Year Development Plan of Jilin Province, and the energy intensity and energy consumption type remained at the current level. In 2030, the proportion of transportation equipment manufacturing industry will be 32.14%; the proportion of raw coal in the agricultural and sideline food processing industry will reach 81.18%, and the proportion of non-fossil energy consumption in the industrial sector will increase to more than 15% | Jilin Province Action Plan for Promoting Steady Growth of Industrial Economy [59]. The 13th Five-Year Development Plan for Industry of Jilin Province [57]. The 14th Five-Year Development Plan for Industry of Jilin Province [60]. The 14th Five-Year Plan for the National Economy of Jilin Province [61]. |
| ESS | The growth rate of industrial value added and the state of industrial structure are basically the same as those in the BAU scenario. Compared with the base year, the energy intensity will be reduced by 14.6–52.5% in multiple industries by 2050; the proportion of fossil energy will be decreased to 6.17–95.28% by industries. Compared with BAU, it will further improve energy utilization efficiency and promote the application of energy-saving technologies. | Natural Gas Utilization Plan of Jilin Province (2016–2025) [62]. Jilin Province Action Plan for Promoting Steady Growth of Industrial Economy [59]. The 14th Five-Year Development Plan for Industry of Jilin Province [60]. The 14th Five-Year Plan for the National Economy of Jilin Province [61]. The 13th Five-Year Development Plan for Industry of Jilin Province [57]. |
| ELS | Based on the state in the ESS, further promote the use of clean energy, vigorously develop industries with low energy consumption and high added value, and reduce the proportion of industrial added value in traditional energy-dependent industries. The proportion of fossil energy will further be reduce to 4.62–95.14% by different industries. By 2050, the proportion of transportation equipment manufacturing industry will increase to 34.53%, the proportion of communication equipment, computer and other electronic equipment manufacturing industry will increase to 0.72%, and the proportion of ferrous metal mining and dressing industry will decrease to 0.37%. | The 14th Five-Year Plan for the Development of the Petrochemical Industry in Jilin Province [63]. Jilin Province Action Plan for Promoting Steady Growth of Industrial Economy [59]. The 14th Five-Year Development Plan for Industry of Jilin Province [60]. The 14th Five-Year Plan for the Development of Metallurgical Building Materials Industry in Jilin Province [64]. The 14th Five-Year Industrial Green Development Plan [65]. |
| LCS | The growth rate of industrial value added will further decrease. Compared with the base year, the energy intensity of various industries in the industrial sector will drop by 24.97%–65.47% by 2050; the proportion of industries with low pollution and high added value will continue to increase; the energy structure will be further adjusted, and the proportion of clean energy will be basically stable at a relatively high level. By 2050, the proportion of ferrous metal smelting and rolling processing industry will decrease from 4.59% in the base year to 0.46%; the proportion of chemical raw materials and chemical products manufacturing industry will decrease to 1.55%. | New Energy Vehicle Industry Development Plan (2021–2035) [66]. The 14th Five-Year Plan for Scientific and Technological Innovation in the Energy Sector [67]. Jilin Province Action Plan for Promoting Steady Growth of Industrial Economy [59]. The 14th Five-Year Development Plan for Industry of Jilin Province [60]. The 14th Five-Year Industrial Green Development Plan [65]. |
Appendix B. Industrial Value Added
| Mode | 2018 | 2020 | 2025 | 2030 | 2035 | 2040 | 2045 | 2050 |
|---|---|---|---|---|---|---|---|---|
| High Mode | 6794 | 7160 | 9022 | 10,736 | 11,917 | 12,513 | 12,263 | 11,895 |
| Medium Mode | 6794 | 7000 | 8610 | 9902 | 10,496 | 10,391 | 10,183 | 9776 |
| Low Mode | 6794 | 6840 | 7866 | 8180 | 8017 | 7696 | 7234 | 6656 |
Appendix C. Industrial Structure
| Industries | Low Mode | Medium Mode | High Mode | ||||||||||||||||||
|---|---|---|---|---|---|---|---|---|---|---|---|---|---|---|---|---|---|---|---|---|---|
| 2020 | 2025 | 2030 | 2035 | 2040 | 2045 | 2050 | 2020 | 2025 | 2030 | 2035 | 2040 | 2045 | 2050 | 2020 | 2025 | 2030 | 2035 | 2040 | 2045 | 2050 | |
| Coal mining and washing industry | −5.4% | −25% | −36% | −45% | −54% | −61% | −67% | −4.9% | −24% | −35% | −45% | −54% | −62% | −68% | −4.3% | −22% | −34% | −44% | −54% | −63% | −70% |
| Ferrous metal mining and dressing industry | −5.4% | −25% | −36% | −45% | −54% | −61% | −67% | −4.9% | −24% | −35% | −45% | −54% | −62% | −68% | −4.3% | −22% | −34% | −44% | −54% | −63% | −70% |
| Non−ferrous metal mining and dressing industry | −5.4% | −25% | −36% | −45% | −54% | −61% | −67% | −4.9% | −24% | −35% | −45% | −54% | −62% | −68% | −4.3% | −22% | −34% | −44% | −54% | −63% | −70% |
| Mining ancillary activities | −5.4% | −25% | −36% | −45% | −54% | −61% | −67% | −4.9% | −24% | −35% | −45% | −54% | −62% | −68% | −4.3% | −22% | −34% | −44% | −54% | −63% | −70% |
| Nonmetallic Mining and Dressing Industry | −5.4% | −25% | −36% | −45% | −54% | −61% | −67% | −4.9% | −24% | −35% | −45% | −54% | −62% | −68% | −4.3% | −22% | −34% | −44% | −54% | −63% | −70% |
| Oil and Gas Extraction Industry | −5.4% | −25% | −36% | −45% | −54% | −61% | −67% | −4.9% | −24% | −35% | −45% | −54% | −62% | −68% | −4.3% | −22% | −34% | −44% | −54% | −63% | −70% |
| Other mining industry | 0.0% | −1% | −2% | −3% | −5% | −7% | −10% | 0.5% | 1% | 0% | −3% | −6% | −16% | −13% | 1.2% | 3% | 2% | −1% | −5% | −13% | −18% |
| Transportation Equipment Manufacturing | 3.0% | 14% | 20% | 24% | 26% | 27% | 26% | 3.6% | 17% | 23% | 28% | 30% | 30% | 29% | 4.3% | 20% | 26% | 31% | 33% | 29% | 28% |
| Agricultural and sideline food processing industry | 0.0% | −1% | −2% | −3% | −5% | −7% | −10% | 0.5% | 1% | 0% | −3% | −6% | −9% | −13% | 1.2% | 3% | 2% | −1% | −5% | −13% | −18% |
| Chemical raw materials and chemical products manufacturing | −3.6% | −18% | −26% | −34% | −41% | −48% | −54% | −8.7% | −39% | −51% | −61% | −66% | −70% | −74% | −11.4% | −50% | −64% | −74% | −81% | −86% | −90% |
| Non-metallic mineral products industry | 1.6% | 7% | 9% | 10% | 10% | 9% | 7% | 2.1% | 9% | 11% | 13% | 13% | 12% | 9% | 3.2% | 14% | 16% | 17% | 16% | 9% | 5% |
| Wine, Beverage and Refined Tea Manufacturing | 0.0% | −1% | −2% | −3% | −5% | −7% | −10% | 0.5% | 1% | 0% | −3% | −6% | −9% | −13% | −8.1% | −38% | −50% | −61% | −68% | −13% | −18% |
| Ferrous metal smelting and rolling industry | −5.3% | −25% | −36% | −45% | −54% | −61% | −67% | −8.7% | −39% | −51% | −61% | −69% | −74% | −79% | −11.4% | −50% | −64% | −74% | −82% | −87% | −90% |
| Wood processing and wood, bamboo, rattan, palm and grass products industry | −3.6% | −18% | −26% | −34% | −41% | −48% | −54% | −3.2% | −16% | −25% | −34% | −41% | −49% | −55% | −2.6% | −14% | −23% | −32% | −41% | −51% | −58% |
| Petroleum processing, coking and nuclear fuel processing industries | −3.6% | −18% | −26% | −34% | −41% | −48% | −54% | −3.2% | −16% | −25% | −34% | −41% | −49% | −55% | −2.6% | −14% | −23% | −32% | −41% | −51% | −58% |
| Special equipment manufacturing | 3.9% | 20% | 30% | 41% | 51% | 62% | 73% | 7.0% | 36% | 55% | 76% | 97% | 115% | 134% | 12.6% | 69% | 102% | 139% | 179% | 211% | 241% |
| food manufacturing | 0.0% | −1% | −2% | −3% | −5% | −7% | −10% | 0.5% | 1% | 0% | −3% | −6% | −9% | −13% | 1.2% | 3% | 2% | −1% | −5% | −13% | −18% |
| Pharmaceutical Manufacturing | 12.7% | 72% | 124% | 191% | 276% | 383% | 517% | 13.3% | 75% | 127% | 193% | 273% | 374% | 500% | 14.2% | 79% | 133% | 198% | 276% | 355% | 466% |
| General equipment manufacturing | 3.9% | 20% | 30% | 41% | 51% | 62% | 73% | 7.0% | 36% | 55% | 76% | 87% | 98% | 109% | 12.6% | 69% | 102% | 139% | 179% | 211% | 241% |
| Electrical machinery and equipment manufacturing | 3.9% | 20% | 30% | 41% | 51% | 62% | 73% | 4.5% | 22% | 32% | 41% | 59% | 73% | 83% | 5.2% | 25% | 35% | 44% | 60% | 66% | 73% |
| metal products industry | 3.9% | 20% | 30% | 41% | 51% | 62% | 73% | 4.5% | 22% | 32% | 41% | 50% | 59% | 68% | 5.2% | 25% | 35% | 44% | 52% | 53% | 59% |
| Chemical fiber manufacturing | 0.0% | −1% | −2% | −3% | −5% | −7% | −10% | 0.5% | 1% | 0% | −3% | −6% | −9% | −13% | 1.2% | 3% | 2% | −1% | −5% | −13% | −18% |
| Textile and apparel industry | 0.0% | −1% | −2% | −3% | −5% | −7% | −10% | 0.5% | 1% | 0% | −3% | −6% | −9% | −13% | 1.2% | 3% | 2% | −1% | −5% | −13% | −18% |
| Paper and paper products industry | −3.6% | −18% | −26% | −34% | −41% | −48% | −54% | −3.2% | −16% | −25% | −34% | −41% | −49% | −55% | −2.6% | −14% | −23% | −32% | −41% | −51% | −58% |
| textile industry | 0.0% | −1% | −2% | −3% | −5% | −7% | −10% | 0.5% | 1% | 0% | −3% | −6% | −9% | −13% | 1.2% | 3% | 2% | −1% | −5% | −13% | −18% |
| Communication equipment, computer and other electronic equipment manufacturing | 6.0% | 31% | 49% | 69% | 91% | 114% | 139% | 6.6% | 34% | 51% | 70% | 89% | 110% | 132% | 7.3% | 37% | 55% | 73% | 91% | 101% | 119% |
| furniture manufacturing | 0.0% | −1% | −2% | −3% | −5% | −7% | −10% | 0.5% | 1% | 0% | −3% | −6% | −9% | −13% | 1.2% | 3% | 2% | −1% | −5% | −13% | −18% |
| Printing and recording media reproduction industry | 0.0% | −1% | −2% | −3% | −5% | −7% | −10% | 0.5% | 1% | 0% | −3% | −6% | −9% | −13% | 1.2% | 3% | 2% | −1% | −5% | −13% | −18% |
| Non-ferrous metal smelting and calendaring industry | −5.3% | −25% | −36% | −45% | −54% | −61% | −67% | −4.9% | −24% | −35% | −45% | −54% | −62% | −68% | −4.3% | −22% | −34% | −44% | −54% | −63% | −70% |
| Rubber and plastic products industry | 0.0% | −1% | −2% | −3% | −5% | −7% | −10% | 0.5% | 1% | 0% | −3% | −6% | −9% | −13% | 1.2% | 3% | 2% | −1% | −5% | −13% | −18% |
| Instrumentation Manufacturing | 3.9% | 20% | 30% | 41% | 51% | 62% | 73% | 4.5% | 22% | 32% | 41% | 50% | 59% | 68% | 5.2% | 25% | 35% | 44% | 52% | 53% | 59% |
| Tobacco Products Industry | 0.0% | −1% | −2% | −3% | −5% | −7% | −10% | 0.5% | 1% | 0% | −3% | −6% | −9% | −13% | 1.2% | 3% | 2% | −1% | −5% | −13% | −18% |
| Cultural and educational, industrial beauty, sports and entertainment products manufacturing | 0.0% | −1% | −2% | −3% | −5% | −7% | −10% | 0.5% | 1% | 0% | −3% | −6% | −9% | −13% | 1.2% | 3% | 2% | −1% | −5% | −13% | −18% |
| Other manufacturing | 0.0% | −1% | −2% | −3% | −5% | −7% | −10% | 0.5% | 1% | 0% | −3% | −6% | −9% | −13% | 1.2% | 3% | 2% | −1% | −5% | −13% | −18% |
| Leather, fur, feathers and their products and footwear | 0.0% | −1% | −2% | −3% | −5% | −7% | −10% | 0.5% | 1% | 0% | −3% | −6% | −9% | −13% | 1.2% | 3% | 2% | −1% | −5% | −13% | −18% |
| Comprehensive utilization of waste resources | 0.0% | −1% | −2% | −3% | −5% | −7% | −10% | 0.5% | 1% | 0% | −3% | −6% | −9% | −13% | 1.2% | 3% | 2% | −1% | −5% | −13% | −18% |
| Repair of metal products, machinery and equipment | 0.0% | −1% | −2% | −3% | −5% | −7% | −10% | 0.5% | 1% | 0% | −3% | −6% | −9% | −13% | 1.2% | 3% | 2% | −1% | −5% | −13% | −18% |
| Water production and supply industry | 0.0% | −1% | −2% | −3% | −5% | −7% | −10% | 0.5% | 1% | 0% | −3% | −6% | −9% | −13% | 1.2% | 3% | 2% | −1% | −5% | −13% | −18% |
| Electricity and heat production and supply industry | 1.2% | 5% | 9% | 6% | 5% | 3% | 0% | 1.7% | 7% | 8% | 8% | 7% | 5% | 3% | 2.8% | 12% | 14% | 15% | 13% | 7% | 3% |
| Gas production and supply industry | 0.0% | −1% | 1% | −3% | −5% | −7% | −10% | 0.5% | 1% | 0% | −3% | −6% | −9% | −13% | 1.2% | 3% | 2% | −1% | −5% | −13% | −18% |
Appendix D. Energy Intensity of Various Industries
| Energy Intensity | High Mode | Medium Mode | Low Mode | |||
|---|---|---|---|---|---|---|
| 2030 | 2050 | 2030 | 2050 | 2030 | 2050 | |
| Coal mining and washing industry | −38.62% | −56.08% | −34.18% | −48.67% | −24.68% | −31.97% |
| Oil and Gas Extraction Industry | −38.62% | −56.08% | −31.89% | −44.58% | −24.68% | −31.97% |
| Ferrous metal mining and dressing industry | −16.95% | −24.97% | −11.54% | −14.60% | −7.32% | −10.52% |
| Non-ferrous metal mining and dressing industry | −24.65% | −39.93% | −19.57% | −30.27% | −14.27% | −19.32% |
| Nonmetallic Mining and Dressing Industry | −34.18% | −48.67% | −29.54% | −40.22% | −24.68% | −31.63% |
| Agricultural and sideline food processing industry | −34.18% | −48.67% | −29.54% | −40.22% | −24.68% | −31.63% |
| food manufacturing | −44.90% | −65.47% | −36.43% | −52.50% | −27.14% | −35.58% |
| Wine, Beverage and Refined Tea Manufacturing | −24.65% | −39.93% | −19.57% | −30.27% | −14.27% | −19.32% |
| textile industry | −34.18% | −48.67% | −29.54% | −40.22% | −24.68% | −31.63% |
| Wood processing and wood, bamboo, rattan, palm and grass products industry | −34.18% | −48.67% | −29.54% | −40.22% | −24.68% | −31.63% |
| Paper and paper products industry | −34.18% | −48.67% | −29.54% | −40.22% | −24.68% | −31.63% |
| Printing and recording media reproduction industry | −16.95% | −24.97% | −11.54% | −14.60% | −7.32% | −10.52% |
| Petroleum processing, coking and nuclear fuel processing industries | −16.95% | −24.97% | −11.54% | −14.60% | −7.32% | −10.52% |
| Chemical raw materials and chemical products manufacturing | −16.95% | −24.97% | −11.54% | −14.60% | −7.32% | −10.52% |
| Pharmaceutical Manufacturing | −16.95% | −24.97% | −11.54% | −14.60% | −7.32% | −10.52% |
| Chemical fiber manufacturing | −24.65% | −39.93% | −19.57% | −30.27% | −14.27% | −19.32% |
| Rubber and plastic products industry | −16.95% | −24.97% | −11.54% | −14.60% | −7.32% | −10.52% |
| Non-metallic mineral products industry | −34.18% | −48.67% | −29.54% | −40.22% | −24.68% | −31.63% |
| Ferrous metal smelting and rolling industry | −24.65% | −39.93% | −19.57% | −30.27% | −14.27% | −19.32% |
| Non-ferrous metal smelting and calendaring industry | −44.90% | −65.47% | −36.43% | −52.50% | −27.14% | −35.56% |
| metal products industry | −34.18% | −48.67% | −29.54% | −40.22% | −24.68% | −31.63% |
| General equipment manufacturing | −24.65% | −39.93% | −19.57% | −30.27% | −14.27% | −19.32% |
| Special equipment manufacturing | −16.95% | −24.97% | −11.54% | −14.60% | −7.32% | −10.52% |
| Transportation Equipment Manufacturing | −16.95% | −24.97% | −11.54% | −14.60% | −7.32% | −10.52% |
| Electrical machinery and equipment manufacturing | −16.95% | −24.97% | −11.54% | −14.60% | −7.32% | −10.52% |
| Communication equipment, computer and other electronic equipment manufacturing | −16.95% | −24.97% | −11.54% | −14.60% | −7.32% | −10.52% |
| Electricity and heat production and supply industry | −34.18% | −48.67% | −29.54% | −40.22% | −24.68% | −31.63% |
| Water production and supply industry | −16.95% | −24.97% | −11.54% | −18.55% | −7.32% | −10.52% |
Appendix E. Energy Consumption Types of Diverse Industries
| Industries | Low Mode | Medium Mode | High Mode | |||
|---|---|---|---|---|---|---|
| 2030 | 2050 | 2030 | 2050 | 2030 | 2050 | |
| Coal mining and washing industry | 65.05% | 62.77% | 62.07% | 59.54% | 58.25% | 52.54% |
| Oil and Gas Extraction Industry | 75.19% | 76.79% | 76.12% | 79.54% | 78.10% | 81.91% |
| Ferrous metal mining and dressing industry | 71.31% | 71.89% | 69.40% | 69.17% | 68.59% | 67.16% |
| Non-ferrous metal mining and dressing industry | 69.71% | 73.81% | 65.86% | 68.15% | 62.16% | 63.15% |
| Agricultural and sideline food processing industry | 90.71% | 91.99% | 87.78% | 90.80% | 83.84% | 85.32% |
| food manufacturing | 73.67% | 70.73% | 70.75% | 66.00% | 67.99% | 62.60% |
| Wine, Beverage and Refined Tea Manufacturing | 48.69% | 44.17% | 45.77% | 38.38% | 42.97% | 33.28% |
| textile industry | 56.64% | 51.24% | 53.15% | 44.31% | 49.80% | 38.22% |
| Wood processing and wood, bamboo, rattan, palm and grass products industry | 89.18% | 86.29% | 87.02% | 82.94% | 84.63% | 80.88% |
| Paper and paper products industry | 79.26% | 77.36% | 76.58% | 74.98% | 73.01% | 68.43% |
| Petroleum processing, coking and nuclear fuel processing industries | 80.31% | 83.28% | 83.50% | 87.79% | 87.01% | 92.44% |
| Chemical raw materials and chemical products manufacturing | 58.17% | 56.85% | 58.87% | 59.40% | 59.12% | 59.53% |
| Pharmaceutical Manufacturing | 87.51% | 85.27% | 85.20% | 81.34% | 82.54% | 80.07% |
| Chemical fiber manufacturing | 8.24% | 8.61% | 8.72% | 9.78% | 9.05% | 10.15% |
| Rubber and plastic products industry | 70.04% | 69.85% | 71.81% | 72.36% | 73.95% | 75.31% |
| Non-metallic mineral products industry | 89.14% | 90.15% | 87.97% | 89.38% | 86.54% | 88.60% |
| Ferrous metal smelting and rolling industry | 94.82% | 95.23% | 95.46% | 95.58% | 95.95% | 95.14% |
| Non-ferrous metal smelting and calendaring industry | 62.59% | 58.70% | 62.11% | 57.41% | 61.99% | 55.44% |
| metal products industry | 54.28% | 52.06% | 54.69% | 54.54% | 54.20% | 51.32% |
| General equipment manufacturing | 81.03% | 79.05% | 79.85% | 77.31% | 78.12% | 76.09% |
| Special equipment manufacturing | 72.47% | 71.45% | 71.06% | 71.36% | 68.65% | 66.40% |
| Transportation Equipment Manufacturing | 42.17% | 40.66% | 41.64% | 39.03% | 41.48% | 37.78% |
| Electrical machinery and equipment manufacturing | 90.33% | 90.19% | 91.90% | 95.28% | 92.44% | 94.68% |
| Communication equipment, computer and other electronic equipment manufacturing | 3.35% | 2.85% | 3.13% | 2.44% | 2.92% | 2.09% |
| Electricity and heat production and supply industry | 60.16% | 58.09% | 57.44% | 55.18% | 53.94% | 48.76% |
| Water production and supply industry | 8.47% | 7.19% | 7.91% | 6.17% | 7.23% | 4.62% |
| Mode | Year | The Raw Coal | Washed Coal | Coal Products | Coke | Coke Oven Gas | Crude Oil | Gasoline | Kerosene | Diesel | Fuel Oil | LPG | Refinery Dry Gas | Other Petroleum Products | Natural Gas | The Thermal | Electric Power |
|---|---|---|---|---|---|---|---|---|---|---|---|---|---|---|---|---|---|
| Low rate mode | 2020 | 84.96% | 0.01% | 0.02% | - | - | - | 3.50% | 0.01% | 3.88% | - | - | - | - | 0.17% | 0.36% | 6.14% |
| 2025 | 82.84% | 0.01% | 0.02% | - | - | - | 3.95% | 0.01% | 4.39% | - | - | - | - | 0.17% | 0.36% | 6.94% | |
| 2030 | 81.18% | 0.01% | 0.02% | - | - | - | 4.43% | 0.01% | 4.91% | - | - | - | - | 0.17% | 0.36% | 7.78% | |
| 2035 | 79.96% | 0.01% | 0.02% | - | - | - | 4.91% | 0.01% | 5.45% | - | - | - | - | 0.17% | 0.36% | 8.63% | |
| 2040 | 79.16% | 0.01% | 0.02% | - | - | - | 5.41% | 0.01% | 6.00% | - | - | - | - | 0.17% | 0.36% | 9.50% | |
| 2045 | 78.77% | 0.01% | 0.02% | - | - | - | 5.89% | 0.01% | 6.54% | - | - | - | - | 0.17% | 0.36% | 10.35% | |
| 2050 | 78.37% | 0.01% | 0.02% | - | - | - | 6.36% | 0.01% | 7.06% | - | - | - | - | 0.17% | 0.36% | 11.18% | |
| Medium rate mode | 2020 | 83.21% | 0.01% | 0.02% | - | - | - | 3.59% | 0.01% | 3.99% | - | - | - | - | 0.17% | 0.36% | 6.31% |
| 2025 | 79.88% | 0.01% | 0.02% | - | - | - | 4.16% | 0.01% | 4.62% | - | - | - | - | 0.17% | 0.36% | 7.32% | |
| 2030 | 77.48% | 0.01% | 0.02% | - | - | - | 4.79% | 0.01% | 5.32% | - | - | - | - | 0.17% | 0.36% | 8.41% | |
| 2035 | 75.93% | 0.01% | 0.02% | - | - | - | 5.46% | 0.01% | 6.06% | - | - | - | - | 0.17% | 0.36% | 9.59% | |
| 2040 | 75.17% | 0.01% | 0.02% | - | - | - | 6.17% | 0.01% | 6.85% | - | - | - | - | 0.17% | 0.36% | 10.84% | |
| 2045 | 74.80% | 0.01% | 0.02% | - | - | - | 6.91% | 0.01% | 7.67% | - | - | - | - | 0.17% | 0.36% | 12.14% | |
| 2050 | 74.42% | 0.01% | 0.02% | - | - | - | 7.67% | 0.01% | 8.51% | - | - | - | - | 0.17% | 0.36% | 13.47% | |
| High rate mode | 2020 | 81.46% | 0.01% | 0.02% | - | - | - | 3.68% | 0.01% | 4.09% | - | - | - | - | 0.17% | 0.36% | 6.47% |
| 2025 | 76.57% | 0.01% | 0.02% | - | - | - | 4.38% | 0.01% | 4.86% | - | - | - | - | 0.17% | 0.36% | 7.70% | |
| 2030 | 72.74% | 0.01% | 0.02% | - | - | - | 5.17% | 0.01% | 5.74% | - | - | - | - | 0.17% | 0.36% | 9.08% | |
| 2035 | 69.83% | 0.01% | 0.02% | - | - | - | 6.05% | 0.01% | 6.72% | - | - | - | - | 0.17% | 0.36% | 10.63% | |
| 2040 | 67.74% | 0.01% | 0.02% | - | - | - | 7.02% | 0.01% | 7.79% | - | - | - | - | 0.17% | 0.36% | 12.33% | |
| 2045 | 66.38% | 0.01% | 0.02% | - | - | - | 8.07% | 0.01% | 8.96% | - | - | - | - | 0.17% | 0.36% | 14.18% | |
| 2050 | 65.72% | 0.01% | 0.02% | - | - | - | 9.20% | 0.01% | 10.21% | - | - | - | - | 0.17% | 0.36% | 16.16% |
| Mode | Year | The Raw Coal | Washed Coal | Coal Products | Coke | Coke Oven Gas | Crude Oil | Gasoline | Kerosene | Diesel | Fuel Oil | LPG | Refinery Dry Gas | Other Petroleum Products | Natural Gas | The Thermal | Electric Power |
|---|---|---|---|---|---|---|---|---|---|---|---|---|---|---|---|---|---|
| Low rate mode | 2020 | 8.28% | 2.31% | - | - | 0.88% | - | 0.79% | - | 3.06% | - | 27.01% | 15.29% | - | 18.33% | 0.69% | 21.91% |
| 2025 | 7.79% | 2.17% | - | - | 0.88% | - | 0.74% | - | 3.15% | - | 29.17% | 14.37% | - | 19.80% | 0.69% | 19.50% | |
| 2030 | 7.40% | 2.06% | - | - | 0.88% | - | 0.70% | - | 3.22% | - | 31.21% | 13.65% | - | 21.18% | 0.69% | 17.74% | |
| 2035 | 7.10% | 1.98% | - | - | 0.88% | - | 0.67% | - | 3.28% | - | 32.77% | 13.10% | - | 22.24% | 0.69% | 16.50% | |
| 2040 | 6.89% | 1.92% | - | - | 0.88% | - | 0.65% | - | 3.31% | - | 33.75% | 12.71% | - | 22.91% | 0.69% | 15.68% | |
| 2045 | 6.75% | 1.88% | - | - | 0.88% | - | 0.64% | - | 3.35% | - | 34.09% | 12.46% | - | 23.14% | 0.69% | 15.21% | |
| 2050 | 6.68% | 1.86% | - | - | 0.88% | - | 0.63% | - | 3.36% | - | 34.26% | 12.33% | - | 23.25% | 0.69% | 15.05% | |
| Medium rate mode | 2020 | 8.11% | 2.26% | - | - | 0.88% | - | 0.77% | - | 3.12% | - | 27.75% | 14.96% | - | 18.83% | 0.69% | 21.40% |
| 2025 | 7.46% | 2.08% | - | - | 0.88% | - | 0.71% | - | 3.28% | - | 30.80% | 13.76% | - | 20.91% | 0.69% | 18.62% | |
| 2030 | 6.94% | 1.93% | - | - | 0.88% | - | 0.66% | - | 3.41% | - | 33.89% | 12.80% | - | 23.00% | 0.69% | 16.57% | |
| 2035 | 6.52% | 1.82% | - | - | 0.88% | - | 0.62% | - | 3.54% | - | 36.60% | 12.03% | - | 24.84% | 0.69% | 15.08% | |
| 2040 | 6.19% | 1.73% | - | - | 0.88% | - | 0.59% | - | 3.65% | - | 38.43% | 11.43% | - | 26.08% | 0.69% | 14.03% | |
| 2045 | 5.95% | 1.66% | - | - | 0.88% | - | 0.56% | - | 3.76% | - | 38.43% | 10.97% | - | 26.08% | 0.69% | 13.32% | |
| 2050 | 5.77% | 1.61% | - | - | 0.88% | - | 0.55% | - | 3.84% | - | 38.43% | 10.64% | - | 26.08% | 0.69% | 12.92% | |
| High rate mode | 2020 | 7.93% | 2.21% | - | - | 0.88% | - | 0.75% | - | 3.18% | - | 28.50% | 14.63% | - | 19.34% | 0.69% | 20.90% |
| 2025 | 7.14% | 1.99% | - | - | 0.88% | - | 0.68% | - | 3.40% | - | 32.48% | 13.17% | - | 22.05% | 0.69% | 17.76% | |
| 2030 | 6.49% | 1.81% | - | - | 0.88% | - | 0.62% | - | 3.61% | - | 36.71% | 11.98% | - | 24.91% | 0.69% | 15.46% | |
| 2035 | 5.97% | 1.66% | - | - | 0.88% | - | 0.57% | - | 3.82% | - | 39.64% | 11.02% | - | 26.90% | 0.69% | 13.76% | |
| 2040 | 5.56% | 1.55% | - | - | 0.88% | - | 0.53% | - | 4.02% | - | 42.02% | 10.25% | - | 28.52% | 0.69% | 12.52% | |
| 2045 | 5.22% | 1.46% | - | - | 0.88% | - | 0.50% | - | 4.22% | - | 42.44% | 9.64% | - | 28.80% | 0.69% | 11.64% | |
| 2050 | 4.96% | 1.38% | - | - | 0.88% | - | 0.47% | - | 4.34% | - | 42.44% | 9.15% | - | 28.80% | 0.69% | 11.06% |
| Mode | Year | The Raw Coal | Washed Coal | Coal Products | Coke | Coke Oven Gas | Crude Oil | Gasoline | Kerosene | Diesel | Fuel Oil | LPG | Refinery Dry Gas | Other Petroleum Products | Natural Gas | The Thermal | Electric Power |
|---|---|---|---|---|---|---|---|---|---|---|---|---|---|---|---|---|---|
| Low rate mode | 2020 | 11.59% | 2.51% | 0.01% | - | - | 0.28% | 0.41% | - | 0.60% | 4.63% | - | 6.88% | 26.65% | 7.26% | 31.37% | 5.89% |
| 2025 | 10.32% | 2.36% | 0.01% | - | - | 0.28% | 0.41% | - | 0.60% | 4.35% | - | 7.09% | 27.45% | 6.47% | 32.32% | 5.53% | |
| 2030 | 9.39% | 2.24% | 0.01% | - | - | 0.28% | 0.41% | - | 0.60% | 4.13% | - | 7.23% | 28.00% | 5.88% | 32.96% | 5.26% | |
| 2035 | 8.73% | 2.15% | 0.01% | - | - | 0.28% | 0.41% | - | 0.60% | 3.97% | - | 7.38% | 28.56% | 5.47% | 33.62% | 5.05% | |
| 2040 | 8.29% | 2.09% | 0.01% | - | - | 0.28% | 0.41% | - | 0.60% | 3.85% | - | 7.45% | 28.85% | 5.20% | 33.96% | 4.90% | |
| 2045 | 8.05% | 2.05% | 0.01% | - | - | 0.28% | 0.41% | - | 0.60% | 3.77% | - | 7.52% | 29.14% | 5.04% | 34.30% | 4.80% | |
| 2050 | 7.96% | 2.03% | 0.01% | - | - | 0.28% | 0.41% | - | 0.60% | 3.73% | - | 7.56% | 29.28% | 4.99% | 34.47% | 4.75% | |
| Medium rate mode | 2020 | 11.32% | 2.46% | 0.01% | - | - | 0.28% | 0.41% | - | 0.60% | 4.53% | - | 7.02% | 27.17% | 7.10% | 31.98% | 5.76% |
| 2025 | 9.85% | 2.26% | 0.01% | - | - | 0.28% | 0.41% | - | 0.60% | 4.16% | - | 7.37% | 28.53% | 6.18% | 33.58% | 5.30% | |
| 2030 | 8.77% | 2.10% | 0.01% | - | - | 0.28% | 0.41% | - | 0.60% | 3.87% | - | 7.66% | 29.67% | 5.50% | 34.93% | 4.93% | |
| 2035 | 7.98% | 1.98% | 0.01% | - | - | 0.28% | 0.41% | - | 0.60% | 3.64% | - | 7.97% | 30.86% | 5.00% | 36.32% | 4.63% | |
| 2040 | 7.42% | 1.88% | 0.01% | - | - | 0.28% | 0.41% | - | 0.60% | 3.46% | - | 8.21% | 31.78% | 4.65% | 37.41% | 4.40% | |
| 2045 | 7.05% | 1.80% | 0.01% | - | - | 0.28% | 0.41% | - | 0.60% | 3.32% | - | 8.45% | 32.74% | 4.42% | 38.53% | 4.23% | |
| 2050 | 6.84% | 1.75% | 0.01% | - | - | 0.28% | 0.41% | - | 0.60% | 3.22% | - | 8.62% | 33.39% | 4.29% | 39.31% | 4.10% | |
| High rate mode | 2020 | 11.06% | 2.40% | 0.01% | - | - | 0.28% | 0.41% | - | 0.60% | 4.43% | - | 7.15% | 27.69% | 6.93% | 32.59% | 5.63% |
| 2025 | 9.40% | 2.16% | 0.01% | - | - | 0.28% | 0.41% | - | 0.60% | 3.98% | - | 7.65% | 29.35% | 5.89% | 34.55% | 5.07% | |
| 2030 | 8.18% | 1.97% | 0.01% | - | - | 0.28% | 0.41% | - | 0.60% | 3.63% | - | 8.11% | 30.82% | 5.13% | 36.28% | 4.61% | |
| 2035 | 7.28% | 1.81% | 0.01% | - | - | 0.28% | 0.41% | - | 0.60% | 3.34% | - | 8.60% | 32.05% | 4.56% | 37.73% | 4.24% | |
| 2040 | 6.62% | 1.68% | 0.01% | - | - | 0.28% | 0.41% | - | 0.60% | 3.10% | - | 9.03% | 33.01% | 4.15% | 38.86% | 3.95% | |
| 2045 | 6.16% | 1.58% | 0.01% | - | - | 0.28% | 0.41% | - | 0.60% | 2.92% | - | 9.48% | 34.00% | 3.86% | 40.02% | 3.71% | |
| 2050 | 5.85% | 1.50% | 0.01% | - | - | 0.28% | 0.41% | - | 0.60% | 2.77% | - | 9.76% | 34.68% | 3.67% | 40.82% | 3.53% |
Appendix F. Industry Code Comparison Table
| Industry Code | Industry Name |
|---|---|
| MWC | Coal mining and washing industry |
| EPN | Oil and Gas Extraction Industry |
| MPF | Ferrous metal mining and dressing industry |
| PNM | Non-ferrous metal mining and dressing industry |
| PNO | Nonmetallic Mining and Dressing Industry |
| PSA | Mining Professional and Auxiliary Activities |
| MOO | Other mining industry |
| PFA | Agricultural and sideline food processing industry |
| MFO | food manufacturing |
| MLB | Wine, Beverage and Refined Tea Manufacturing |
| MTO | Tobacco Products Industry |
| MTE | textile industry |
| MTW | Textile and apparel industry |
| MLF | Leather, fur, feathers and their products and footwear |
| PTM | Wood processing and wood, bamboo, rattan, palm and grass products industry |
| MFU | furniture manufacturing |
| MPP | Paper and paper products industry |
| PRR | Printing and recording media reproduction industry |
| MAC | Cultural and educational, industrial beauty, sports and entertainment products manufacturing |
| PPC | Petroleum, coal and other fuel processing industries |
| MRC | Chemical raw materials and chemical products manufacturing |
| MME | Pharmaceutical Manufacturing |
| MCF | Chemical fiber manufacturing |
| MPR | Rubber and plastic products industry |
| MNM | Non-metallic mineral products industry |
| SPF | Ferrous metal smelting and rolling industry |
| SPN | Non-ferrous metal smelting and calendering industry |
| MMP | metal products industry |
| MGP | General equipment manufacturing |
| MSP | Special equipment manufacturing |
| MAU | Automotive Manufacturing |
| MRS | Railway, marine, aerospace and other transportation equipment manufacturing |
| MEM | Electrical machinery and equipment manufacturing |
| MCC | Computer, communications and other electronic equipment manufacturing |
| MMI | Instrumentation Manufacturing |
| OMA | Other manufacturing |
| UWR | Comprehensive utilization of waste resources |
| RSM | Repair of metal products, machinery and equipment |
| PSE | Electricity and heat production and supply industry |
| PSG | Gas production and supply industry |
| PSW | Water production and supply industry |
References
- Ma, M.; Cai, W.; Cai, W.G.; Dong, L. Whether carbon intensity in the commercial building sector decouples from economic development in the service industry? Empirical evidence from the top five urban agglomerations in China. J. Clean. Prod. 2019, 222, 193–205. [Google Scholar] [CrossRef]
- Mi, Z.F.; Zheng, J.L.; Green, F.; Guan, D.B.; Meng, J.; Feng, K.S.; Liang, S.; Wang, S.Y. Decoupling without outsourcing? How China’s consumption-based CO2 emissions have plateaued. Cell Isc. 2021, 24, 103130. [Google Scholar] [CrossRef] [PubMed]
- World Bank. 2010. Available online: https://databank.worldbank.org/home.aspx (accessed on 24 June 2021).
- EIA (U.S. Energy Information Administration). 2018. Available online: https://www.eia.gov/state/ (accessed on 17 May 2018).
- British Petroleum (BP). BP Statistical Review of World Energy 2014 Workbook; British Petroleum: London, UK, 2014. [Google Scholar]
- Duan, H.Y.; Chen, S.Y.; Song, J.N. Characterizing regional building energy consumption under joint climatic and socioeconomic impacts. Energy 2022, 245, 123290. [Google Scholar] [CrossRef]
- Wang, X.E.; Qin, B.Y.; Wang, H.N.; Dong, X.Z.; Duan, H.Y. Carbon Mitigation Pathways of Urban Transportation under Cold Climatic Conditions. Int. J. Environ. Res. Public Health 2022, 19, 4570. [Google Scholar] [CrossRef]
- Liu, X.Y.; Wang, X.E.; Song, J.N.; Duan, H.Y.; Wang, S. Why Are the Carbon Footprints of China’s Urban Households Rising? An Input–Output Analysis and Structural Decomposition Analysis. Sustainability 2019, 11, 7157. [Google Scholar] [CrossRef] [Green Version]
- Liu, F.; Tang, L.; Liao, K.; Ruan, L.; Liu, P. Spatial distribution and regional difference of carbon emissions efficiency of industrial energy in China. Sci. Rep. 2021, 11, 19419. [Google Scholar] [CrossRef]
- Shao, S.; Yang, L.; Yu, M.; Yu, M. Estimation, characteristics, and determinants of energy-related industrial CO2 emission in Shanghai (China), 1994–2009. Energy Policy 2019, 39, 6476–6494. [Google Scholar] [CrossRef]
- Ouyang, X.; Lin, B. An analysis of the driving forces of energy-related carbon dioxide emission in China’s industrial sector. Renew. Sustain. Energy Rev. 2015, 45, 838–849. [Google Scholar] [CrossRef] [Green Version]
- Lin, B.; Tan, R. Sustainable development of China’s energy intensive industries: From the aspect of carbon dioxide emission reduction. Renew. Sustain. Energy Rev. 2017, 77, 386–394. [Google Scholar] [CrossRef]
- Zhao, J.; Jiang, Q.Z.; Dong, X.C.; Dong, K.Y.; Jiang, H.J. How does industrial structure adjustment reduce CO2 emissions? Spatial and mediation effects analysis for China. Energy Econ. 2022, 105, 105704. [Google Scholar] [CrossRef]
- Feng, J.C.; Zeng, X.L.; Yu, Z.; Bian, Y.; Wang, Y. Decoupling and driving forces of industrial carbon emission in a coastal city of Zhuhai, China. Energy Rep. 2019, 5, 1589–1602. [Google Scholar] [CrossRef]
- Lin, B.Q.; Xu, B. Growth of industrial CO2 emission in shanghai city: Evidence from a dynamic vector autoregression analysis. Energy 2018, 151, 167–177. [Google Scholar] [CrossRef]
- Zhu, X.H.; Zou, J.W.; Chao, F. Analysis of industrial energy-related CO2 emission and the reduction potential of cities in the Yangtze River delta region. J. Clean. Prod. 2017, 168, 791–802. [Google Scholar] [CrossRef]
- Wang, Q.W.; Hang, Y.; Zhou, P.; Wang, Y.Z. Decoupling and attribution analysis of industrial carbon emissions in Taiwan. Energy 2016, 113, 728–738. [Google Scholar] [CrossRef]
- You, J.; Zhang, W. How heterogeneous technological progress promotes industrial structure upgrading and industrial carbon efficiency? Evidence from China’s industries. Energy 2022, 247, 123386. [Google Scholar] [CrossRef]
- Wang, C.J.; Zhang, X.L.; Wang, F. Decomposition of energy-related carbon emissions in Xinjiang and relative mitigation policy recommendations. Front. Earth Sci. 2015, 9, 65–76. [Google Scholar] [CrossRef]
- Qin, J.C.; Tao, H.; Cheng, C.; Brindha, K.; Zhan, M.; Ding, J. Analysis of factors influencing carbon emissions in the energy base, Xinjiang autonomous region, China. Sustainability 2020, 12, 1089. [Google Scholar] [CrossRef] [Green Version]
- Chen, J.; Xu, C.; Gao, M. Carbon peak and its mitigation implications for China in the post-pandemic era. Sci. Rep. 2022, 12, 3473. [Google Scholar] [CrossRef]
- Yu, S.; Zheng, S.; Li, X.; Li, L. China can peak its energy-related carbon emission before 2025: Evidence from industry restructuring. Energy Econ. 2018, 73, 91–107. [Google Scholar] [CrossRef]
- Liu, D.; Xiao, B. Can China achieve its carbon emission peaking? A scenario analysis based on STIRPAT and system dynamics model. Ecol. Indic. 2018, 93, 647–657. [Google Scholar] [CrossRef]
- Sun, Z.R.; Liu, Y.D.; Yu, Y.N. China’s carbon emission peak pre-2030: Exploring multi-scenario optimal low-carbon behaviors for China’s regions. J. Clean. Prod. 2019, 231, 963–979. [Google Scholar] [CrossRef]
- Zhang, X.Y.; Chen, Y.H.; Jiang, P.; Liu, L.P. Sectoral peak CO2 emission measurements and a long-term alternative CO2 mitigation roadmap: A case study of Yunnan, China. J. Clean. Prod. 2019, 247, 119171. [Google Scholar] [CrossRef]
- Lin, J.Y.; Kang, J.F.; Khanna, N.; Shi, L.Y.; Zhao, X.F.; Liao, J.F. Scenario analysis of urban GHG peak and mitigation co-benefits: A case study of Xiamen city, China. J. Clean. Prod. 2018, 171, 972–983. [Google Scholar] [CrossRef]
- Mi, Z.F.; Wei, Y.M.; Wang, B.; Meng, J.; Liu, Z.; Shan, Y.L. Socioeconomic impact assessment of China’s CO2 emissions peak prior to 2030. J. Clean. Prod. 2017, 142, 2227–2236. [Google Scholar] [CrossRef] [Green Version]
- Duan, Z.Y.; Wang, X.E.; Dong, X.Z.; Duan, H.Y.; Song, J.N. Peaking industrial energy-related CO2 emission in typical transformation region: Paths and mechanism. Sustainability 2020, 12, 791. [Google Scholar] [CrossRef] [Green Version]
- Zhang, X.; Zhao, X.; Jiang, Z.; Shao, S. How to achieve the 2030 CO2 emission-reduction targets for China’s industrial sector: Retrospective decomposition and prospective trajectories. Glob. Environ. Change 2017, 44, 83–97. [Google Scholar] [CrossRef]
- Liu, L.; Wang, K.; Wang, S.; Zhang, R.; Tang, X. Exploring the Driving Forces and Reduction Potential of Industrial Energy-Related CO2 Emissions during 2001–2030: A Case Study for Henan Province. China. Sustainability 2019, 11, 1176. [Google Scholar] [CrossRef] [Green Version]
- Zhou, S.; Gu, A.; Tong, Q.; Guo, Y.; Wei, X. Multi-scenario simulation on reducing CO2 emissions from China’s major manufacturing industries targeting 2060. J. Ind. Ecol. 2021, 26, 1–12. [Google Scholar]
- Zhou, S.; Wang, Y.; Yuan, Z.Y.; Ou, X.M. Peak energy consumption and CO2 emissions in China’s industrial sector. Energy Strategy Rev. 2018, 20, 113–123. [Google Scholar] [CrossRef]
- Sujeetha, S.; Bundit, L.; Toshihiko, M.; Tatsuya, H.; Yuzuru, M. A quantitative analysis of Low Carbon Society (LCS) measures in Thai industrial sector. Renew. Sustain. Energy Rev. 2015, 43, 178–195. [Google Scholar]
- Nicolás, P.; José Antonio, M. Prospective scenarios on energy efficiency and CO2 emissions in the European Iron & Steel industry. Energy 2013, 54, 113–128. [Google Scholar]
- Stockholm Environment Institute. Long-Range Energy Alternatives Planning System User Guide. 2018. Available online: https://leap.sei.org/default.asp?action=home (accessed on 30 July 2020).
- Liu, L.; Wang, K.; Wang, S.; Zhang, R.; Tang, X. Assessing energy consumption, CO2 and pollutant emission and health benefits from China’s transport sector through 2050. Energy Policy 2018, 116, 382–396. [Google Scholar] [CrossRef]
- Yang, D.; Liu, B.; Ma, W.; Guo, Q.; Li, F.; Yang, D. Sectoral energy-carbon nexus and low-carbon policy alternatives: Acase study of Ningbo, China. J. Clean. Prod. 2017, 156, 480–490. [Google Scholar] [CrossRef]
- Liu, D.; Yang, D.; Huang, A. Leap-based greenhouse gases emission peak and low carbon pathways in China’s tourist industry. Int. J. Environ. Res. Public Health 2021, 18, 1218. [Google Scholar] [CrossRef]
- Wu, L.F.; Sun, L.W.; Qi, P.X.; Ren, X.W.; Sun, X.T. Energy endowment, industrial structure upgrading, and CO2 emissions in China: Revisiting resource curse in the context of carbon emissions. Resour. Policy 2021, 74, 102329. [Google Scholar] [CrossRef]
- Zuo, N.; Zhong, H. Can resource policy reverse the resource curse? Evidence from China. Resour. Policy 2020, 68, 101733. [Google Scholar] [CrossRef]
- Liu, X.Y.; Duan, Z.Y.; Shan, Y.L.; Duan, H.Y.; Wang, S.; Song, J.N. Low-carbon developments in northeast China: Evidence from cities. Appl. Energy 2019, 236, 1019–1033. [Google Scholar] [CrossRef] [Green Version]
- Xu, B.; Chen, J. How to achieve a low-carbon transition in the heavy industry? A nonlinear perspective. Renewable and Sustainable. Energy Rev. 2021, 140, 110708. [Google Scholar]
- Bureau of Statistics of Jilin. Jilin Statistical Yearbook 2012. Available online: http://tjj.jl.gov.cn/tjsj/tjnj/2012/ (accessed on 30 July 2021).
- Bureau of Statistics of Jilin. Jilin Statistical Yearbook 2013. Available online: http://tjj.jl.gov.cn/tjsj/tjnj/2013/ (accessed on 30 July 2021).
- Bureau of Statistics of Jilin. Jilin Statistical Yearbook 2014. Available online: http://tjj.jl.gov.cn/tjsj/tjnj/2014/ (accessed on 30 July 2021).
- Bureau of Statistics of Jilin. Jilin Statistical Yearbook 2015. Available online: http://tjj.jl.gov.cn/tjsj/tjnj/2015/ (accessed on 30 July 2021).
- Bureau of Statistics of Jilin. Jilin Statistical Yearbook 2016. Available online: http://tjj.jl.gov.cn/tjsj/tjnj/2016/ (accessed on 30 July 2021).
- Bureau of Statistics of Jilin. Jilin Statistical Yearbook 2017. Available online: http://tjj.jl.gov.cn/tjsj/tjnj/2017/ (accessed on 30 July 2021).
- Bureau of Statistics of Jilin. Jilin Statistical Yearbook 2018. Available online: http://tjj.jl.gov.cn/tjsj/tjnj/2018/ (accessed on 30 July 2021).
- Bureau of Statistics of Jilin. Jilin Statistical Yearbook 2019. Available online: http://tjj.jl.gov.cn/tjsj/tjnj/2019/ (accessed on 30 July 2021).
- Bureau of Statistics of Jilin. Jilin Statistical Yearbook 2020. Available online: http://tjj.jl.gov.cn/tjsj/tjnj/2020/ (accessed on 30 July 2021).
- General Administration of Quality Supervision, Inspection and Quarantine and National Standards Committee. Industrial Classification for National Economic Activities; General Administration of Quality Supervision, Inspection and Quarantine and National Standards Committee: Beijing, China, 2017. [Google Scholar]
- Fatima, T.; Xia, E.J.; Cao, Z.; Khan, D.; Fan, J.L. Decomposition analysis of energy-related CO2 emission in the industrial sector of China: Evidence from the LMDI approach. Environ. Sci. Pollut. Res. 2019, 26, 21736–21749. [Google Scholar] [CrossRef]
- National Center for Climate Change Strategy and International Cooperation (NCSC). Guidelines for Compiling Provincial Greenhouse Gas Inventories. Available online: http://www.ncsc.org.cn/ (accessed on 30 July 2021).
- National Bureau of Statistics of China. China Energy Statistical Yearbook 2020; National Bureau of Statistics of China: Beijing, China, 2020.
- National Center for Climate Change Strategy and International Cooperation (NCSC). General Principles for Calculation of Comprehensive Energy Consumption (GB/T 2589-2020). Available online: https://www.sosoarch.com/guifan/details.aspx?id=144 (accessed on 30 July 2021).
- The People’s Government of Jilin Province. The 13th Five-Year Development Plan for Industry of Jilin Province. Available online: http://gxt.jl.gov.cn/xxgk/zcwj/sgxtwj/201702/t20170208_2554078.html (accessed on 30 July 2020).
- The Intergovernmental Panel on Climate Change (IPCC). Climate Change 2014: Synthesis Report; IPCC: Geneva, Switzerland, 2014. [Google Scholar]
- The People’s Government of of Jilin Province. Jilin Province Action Plan for Promoting Steady Growth of Industrial Economy. Available online: http://xxgk.jl.gov.cn/szf/gkml/202203/t20220302_8404378.html (accessed on 3 March 2022).
- The People’s Government of Jilin Province. The 14th Five-Year Development Plan for Industry of Jilin Province. Available online: http://xxgk.jl.gov.cn/szf/gkml/202108/t20210830_8200808.html (accessed on 22 August 2021).
- The People’s Government of Jilin Province. The 14th Five-Year Plan for the National Economy of Jilin Province. Available online: http://jl.gov.cn/zw/yw/jlyw/202104/t20210424_8037957.html (accessed on 22 August 2021).
- The People’s Government of Jilin Province. Natural Gas Utilization Plan of Jilin Province (2016–2025). Available online: http://xxgk.jl.gov.cn/gljg/jgsw_98132/xxgkmlqy/202111/t20211105_8276455.html (accessed on 22 December 2021).
- The People’s Government of Jilin Province. The 14th Five-Year Plan for the Development of the Petrochemical Industry in Jilin Province. Available online: http://xxgk.jl.gov.cn/zcbm/fgw_97953/xxgkmlqy/202110/t20211008_8237440.html (accessed on 22 September 2021).
- Jilin Provincial Department of Industry and Information Technology. The 14th Five-Year Plan for the Development of Metallurgical Building Materials Industry in Jilin Province. Available online: http://gxt.jl.gov.cn/xxgk/zcwj/zcfg_zcjd/202109/t20210915_8218551.html (accessed on 22 September 2021).
- Ministry of Industry and Information Technology the 14th Five-Year Industrial Green Development Plan. Available online: http://www.gov.cn/zhengce/zhengceku/2021-12/03/content_5655701.htm (accessed on 22 September 2021).
- General Office of the State Council of the People’s Republic of China. New Energy Vehicle Industry Development Plan (2021–2035). Available online: http://www.gov.cn/zhengce/content/2020-11/02/content_5556716.htm (accessed on 30 July 2020).
- General Office of the State Council of the People’s Republic of China. The 14th Five-Year Plan for Scientific and Technological Innovation in the Energy Sector. Available online: http://www.gov.cn/zhengce/zhengceku/2022-04/03/content_5683361.htm (accessed on 3 December 2021).

| Category | References | Study Region | Issues Addressed | Method | Scenario |
|---|---|---|---|---|---|
| Studies on CO2 emissions in the holistic industrial sector | [29] | China | How to achieve the 2030 CO2 emission-reduction targets for China’s industrial sector | Extended LMDI model | BAU (the most possible to occur); N1 (higher efficiency improvement and stronger structural adjustment); N2 (higher efficiency improvement and weaker structural adjustment); N3 (lower efficiency improvement and stronger structural adjustment); N4 (lower efficiency improvement and weaker structural adjustment) |
| [28] | Jilin Province | Peaking Industrial Energy-Related CO2 Emissions in Typical Transformation Region: Paths and Mechanism | STIRPAT model | Baseline scenario (BAU); energy-saving scenario (ESS); energy-saving and low-carbon scenario (ELS); low-carbon scenario (LCS) | |
| [30] | Henan Province | Exploring the Driving Forces and Reduction Potential of Industrial Energy-Related CO2 Emissions during 2001–2030 | LMDI decomposition | Business as Usual (BAU); Efficiency Improvement (EI); Structural Optimization (SO); R&D Input (RD); Comprehensive Policy (CP) scenarios | |
| Studies on CO2 emissions by industries in the industrial sector | [31] | China | Multi-scenario simulation on reducing CO2 emissions from China’s major manufacturing industries targeting 2060 | based on China’s GHG inventory and uses Tier 2 of the IPCC | national determined contribution (NDC); carbon mitigation scenario (CMS); deep mitigation scenario (DMS) |
| [32] | China | Peak energy consumption and CO2 emissions in China’s industrial sector | Modified GCAM | Reference (REF) scenario; Low-carbon (LC) scenario | |
| [33] | Thailand | A quantitative analysis of Low Carbon Society (LCS) measures in Thai industrial sector | AIM/Enduse model | Business As Usual (BAU); LCS scenarios; emission tax scenarios and reduction target scenarios | |
| [34] | European Union | Prospective scenarios on energy efficiency and CO2 emissions in the European Iron & Steel industry | Energy and CO2 simulation model | Baseline scenario (BS); two alternative scenarios (AS1 and AS2) to study the sensitivity of fuel and resource prices and CO2 emission prices | |
| [27] | China | Socioeconomic impact assessment of China’s CO2 emissions peak prior to 2030 | an optimization model based on the input-output model | Peak in 2026; Peak in 2027; Peak in 2028; Peak in 2029; Peak in 2030 |
| Energy | Average Low Calorific Value (kJ/kg) | Carbon Content per Unit Calorific Value (tC/TJ) | Carbon Oxidation Rate (%) |
|---|---|---|---|
| NCVj | CCj | Oj | |
| Raw coal | 20,908 | 26.37 | 0.94 |
| Washed coal | 26,344 | 25.41 | 0.94 |
| Coal products | 10,454 | 25.8 | 0.94 |
| Coke | 28,435 | 29.5 | 0.93 |
| Coke oven gas | 17,355 | 12.1 | 0.98 |
| Crude oil | 41,816 | 20.1 | 0.98 |
| Gasoline | 43,070 | 18.9 | 0.98 |
| Kerosene | 43,070 | 19.6 | 0.98 |
| Diesel | 42,652 | 20.2 | 0.98 |
| Fuel oil | 41,816 | 21.1 | 0.98 |
| Liquefied petroleum gas | 50,179 | 17.2 | 0.98 |
| Refinery dry gas | 46,055 | 15.7 | 0.98 |
| Other petroleum products | 40,200 | 20 | 0.98 |
| Natural gas | 38,931 | 15.3 | 0.99 |
| Scenarios | Industrial Value Added | Industrial Structure | Energy Intensity | Energy Consumption Types |
|---|---|---|---|---|
| LCS | Low | High | High | High |
| ELS | Medium | Medium | Medium | High |
| ESS | High | Low | Medium | Medium |
| BAU | High | Low | Low | Low |
| Factor | Rate | LCS | ELS | ESS | BAU | ||||
|---|---|---|---|---|---|---|---|---|---|
| Year | Peak (Mt) | Year | Peak (Mt) | Year | Peak (Mt) | Year | Peak (Mt) | ||
| Industrial value added | Low | 2020 | 114.17 | 2021 | 114.85 | 2025 | 118.09 | 2025 | 121.68 |
| Medium | 2023 | 118.22 | 2030 | 128.15 | 2030 | 136.7 | 2030 | 142.82 | |
| High | 2035 | 127.23 | 2040 | 145.55 | 2040 | 156.8 | 2040 | 165.65 | |
| Industrial structure | Low | 2024 | 123.7 | 2030 | 142.36 | 2040 | 156.8 | 2040 | 165.65 |
| Medium | 2020 | 117.7 | 2030 | 128.15 | 2040 | 138.23 | 2040 | 144.94 | |
| High | 2020 | 114.17 | 2030 | 119.36 | 2035 | 126.53 | 2040 | 131.44 | |
| Energy intensity | Low | 2020 | 118.89 | 2030 | 136.04 | 2040 | 159.02 | 2040 | 165.65 |
| Medium | 2020 | 116.45 | 2030 | 128.15 | 2040 | 148.5 | 2040 | 155.72 | |
| High | 2020 | 114.17 | 2028 | 121.04 | 2035 | 137.62 | 2035 | 141.18 | |
| Energy consumption types | Low | 2021 | 115.31 | 2030 | 130.24 | 2040 | 157.27 | 2040 | 165.65 |
| Medium | 2021 | 115.13 | 2030 | 130.09 | 2040 | 156.8 | 2040 | 158.37 | |
| High | 2020 | 114.17 | 2030 | 128.15 | 2040 | 145.68 | 2035 | 147.82 | |
Publisher’s Note: MDPI stays neutral with regard to jurisdictional claims in published maps and institutional affiliations. |
© 2022 by the authors. Licensee MDPI, Basel, Switzerland. This article is an open access article distributed under the terms and conditions of the Creative Commons Attribution (CC BY) license (https://creativecommons.org/licenses/by/4.0/).
Share and Cite
Duan, H.; Dong, X.; Xie, P.; Chen, S.; Qin, B.; Dong, Z.; Yang, W. Peaking Industrial CO2 Emission in a Typical Heavy Industrial Region: From Multi-Industry and Multi-Energy Type Perspectives. Int. J. Environ. Res. Public Health 2022, 19, 7829. https://doi.org/10.3390/ijerph19137829
Duan H, Dong X, Xie P, Chen S, Qin B, Dong Z, Yang W. Peaking Industrial CO2 Emission in a Typical Heavy Industrial Region: From Multi-Industry and Multi-Energy Type Perspectives. International Journal of Environmental Research and Public Health. 2022; 19(13):7829. https://doi.org/10.3390/ijerph19137829
Chicago/Turabian StyleDuan, Haiyan, Xize Dong, Pinlei Xie, Siyan Chen, Baoyang Qin, Zijia Dong, and Wei Yang. 2022. "Peaking Industrial CO2 Emission in a Typical Heavy Industrial Region: From Multi-Industry and Multi-Energy Type Perspectives" International Journal of Environmental Research and Public Health 19, no. 13: 7829. https://doi.org/10.3390/ijerph19137829
APA StyleDuan, H., Dong, X., Xie, P., Chen, S., Qin, B., Dong, Z., & Yang, W. (2022). Peaking Industrial CO2 Emission in a Typical Heavy Industrial Region: From Multi-Industry and Multi-Energy Type Perspectives. International Journal of Environmental Research and Public Health, 19(13), 7829. https://doi.org/10.3390/ijerph19137829