
Correlation between Population Density and COVID-19 Cases during the Third Wave in Malaysia: Effect of the Delta Variant

 , , ,
, , ,
Abstract
:1. Introduction
2. Materials and Methods
2.1. Data Source
2.2. Data Analysis
3. Results
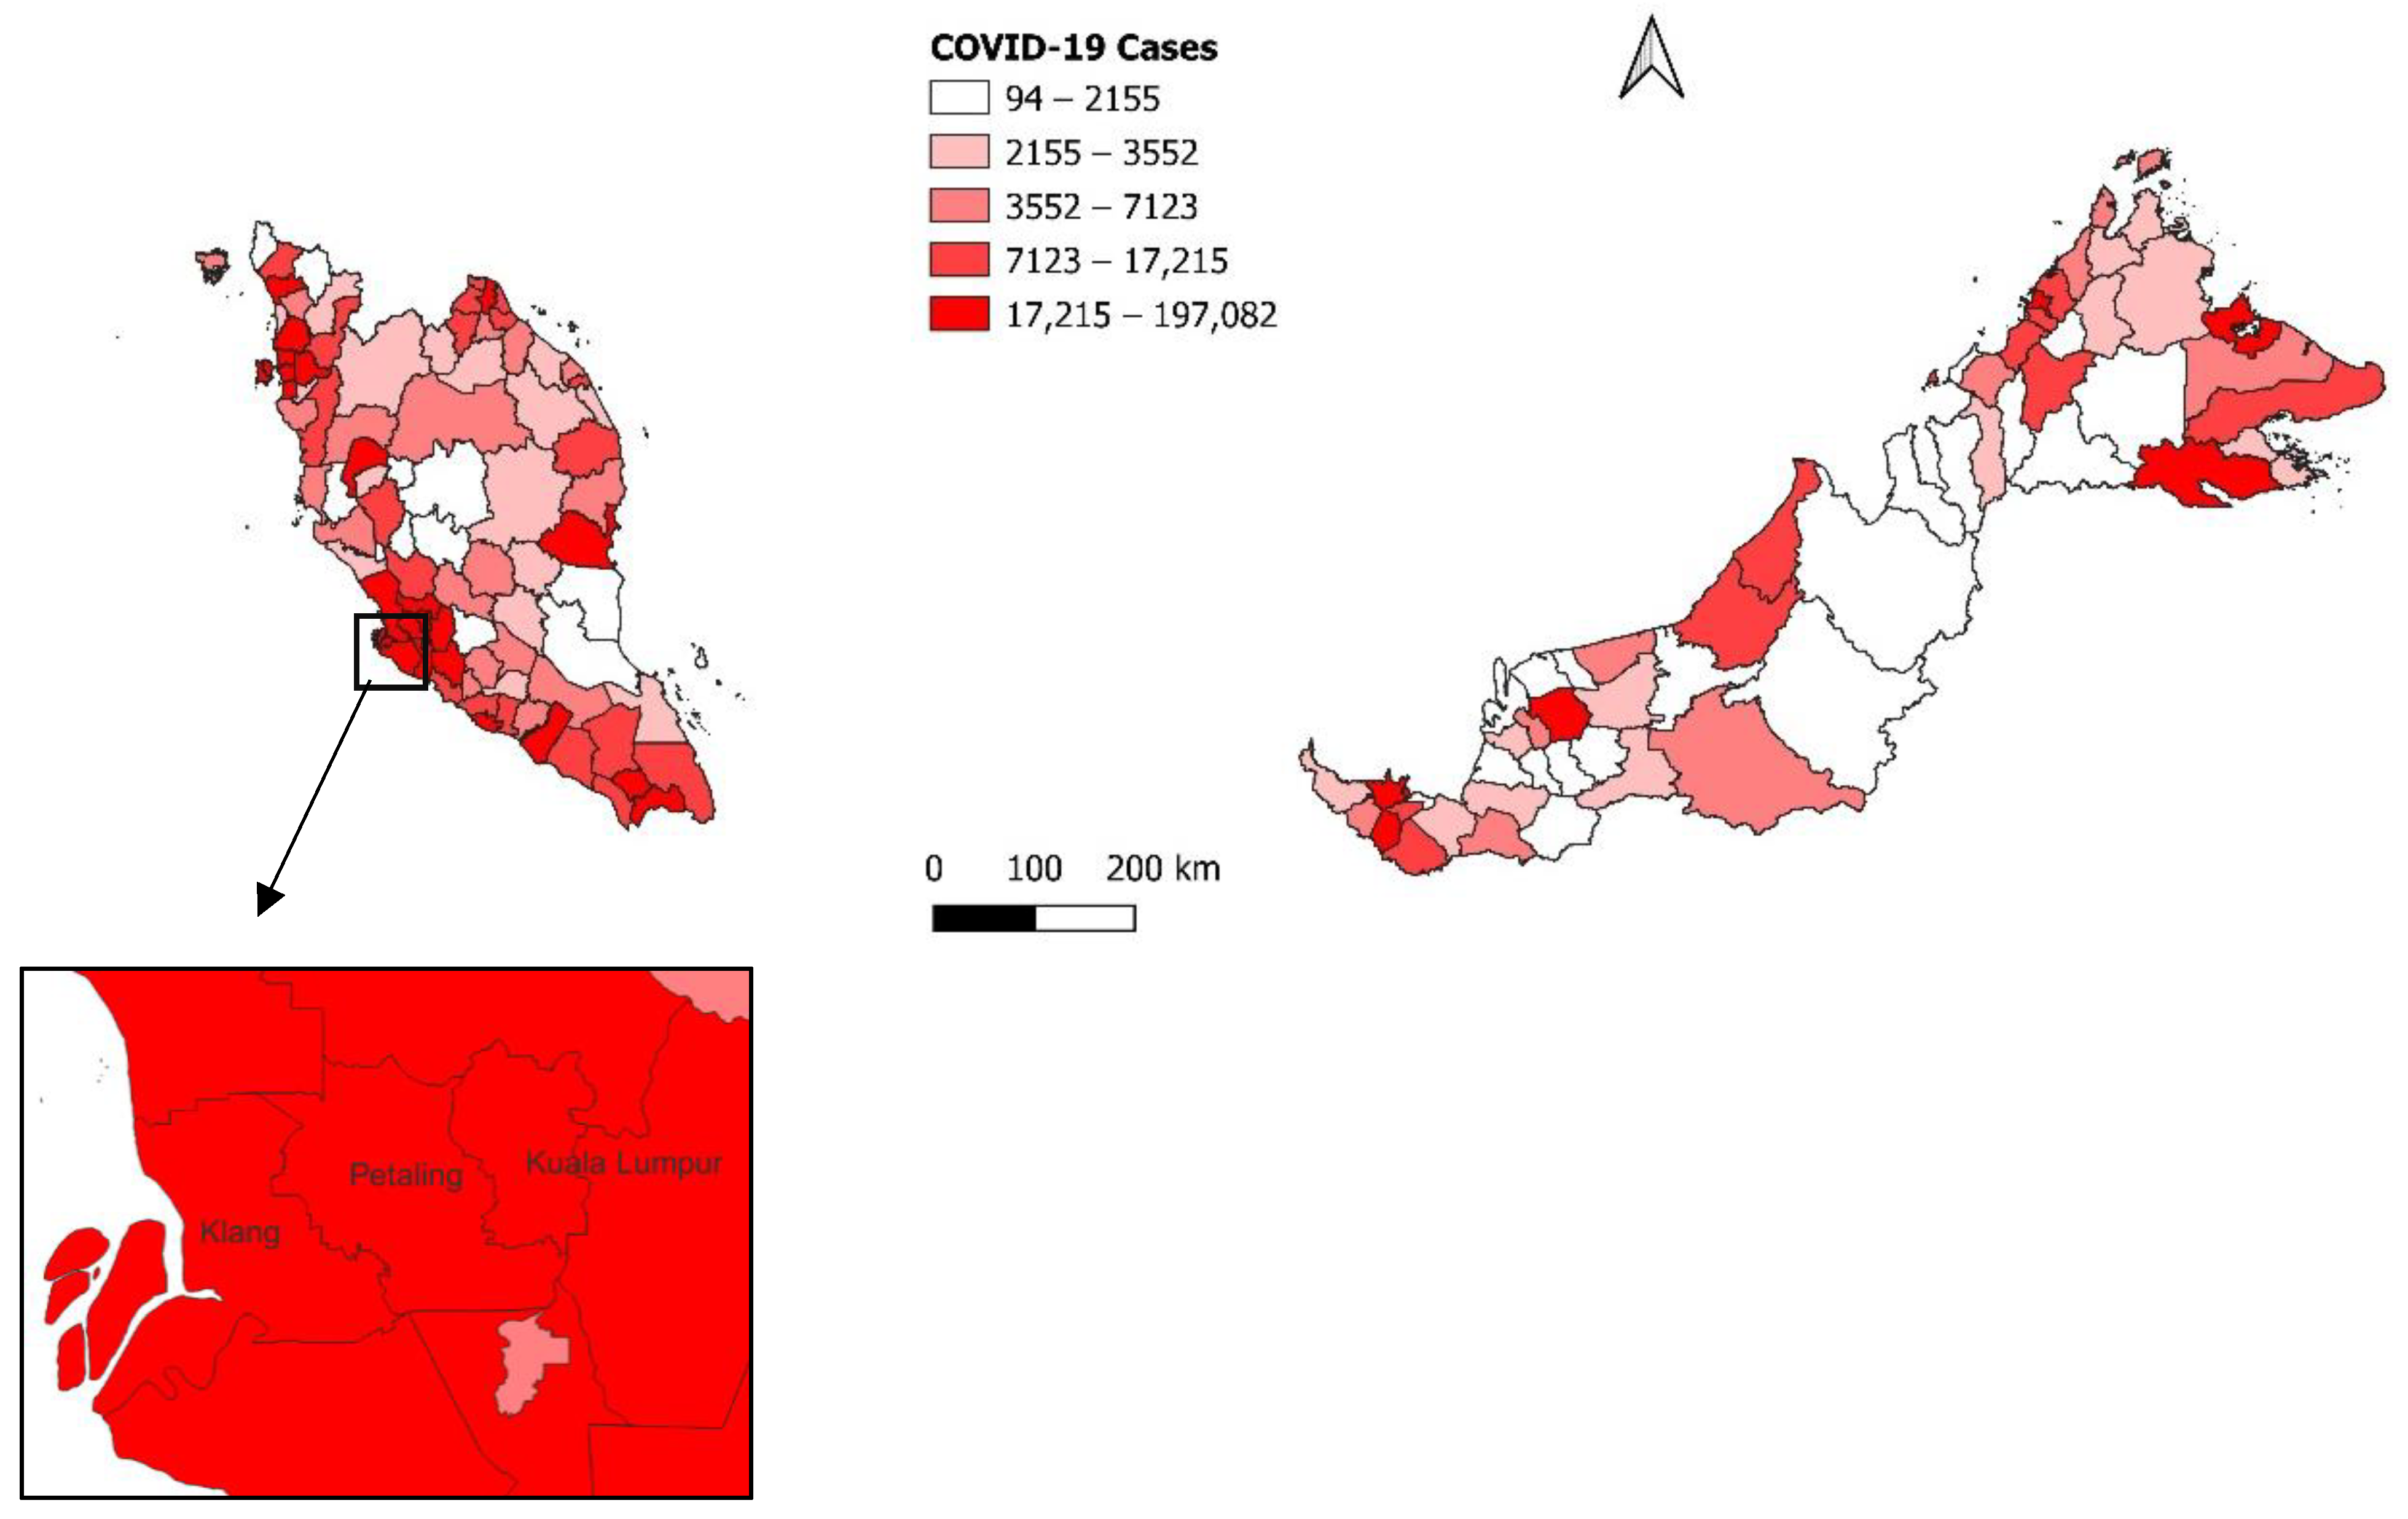
3.1. Characteristics of COVID-19 Cases in the Third Wave
3.2. Association between Sociodemographic Factors and Vaccination with COVID-19 Cases
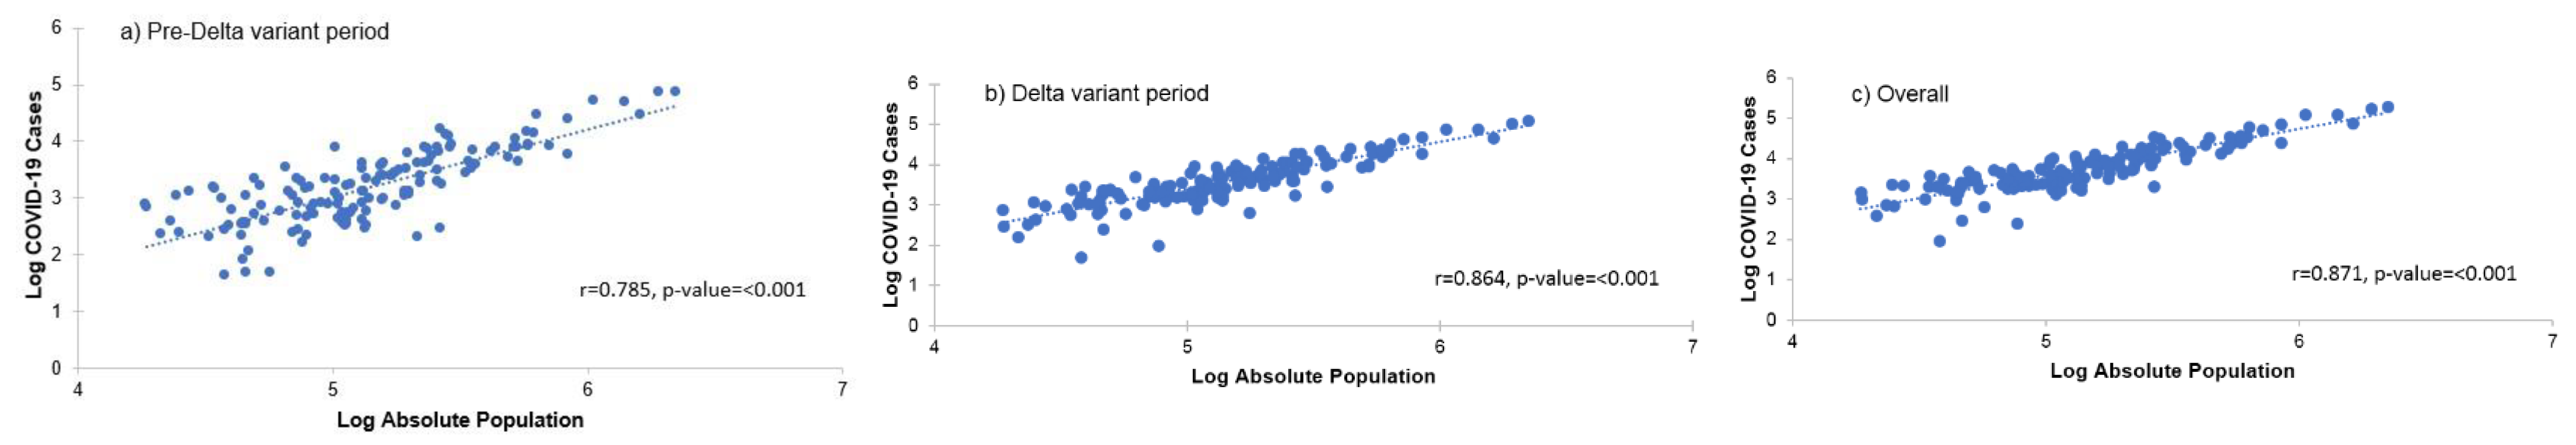
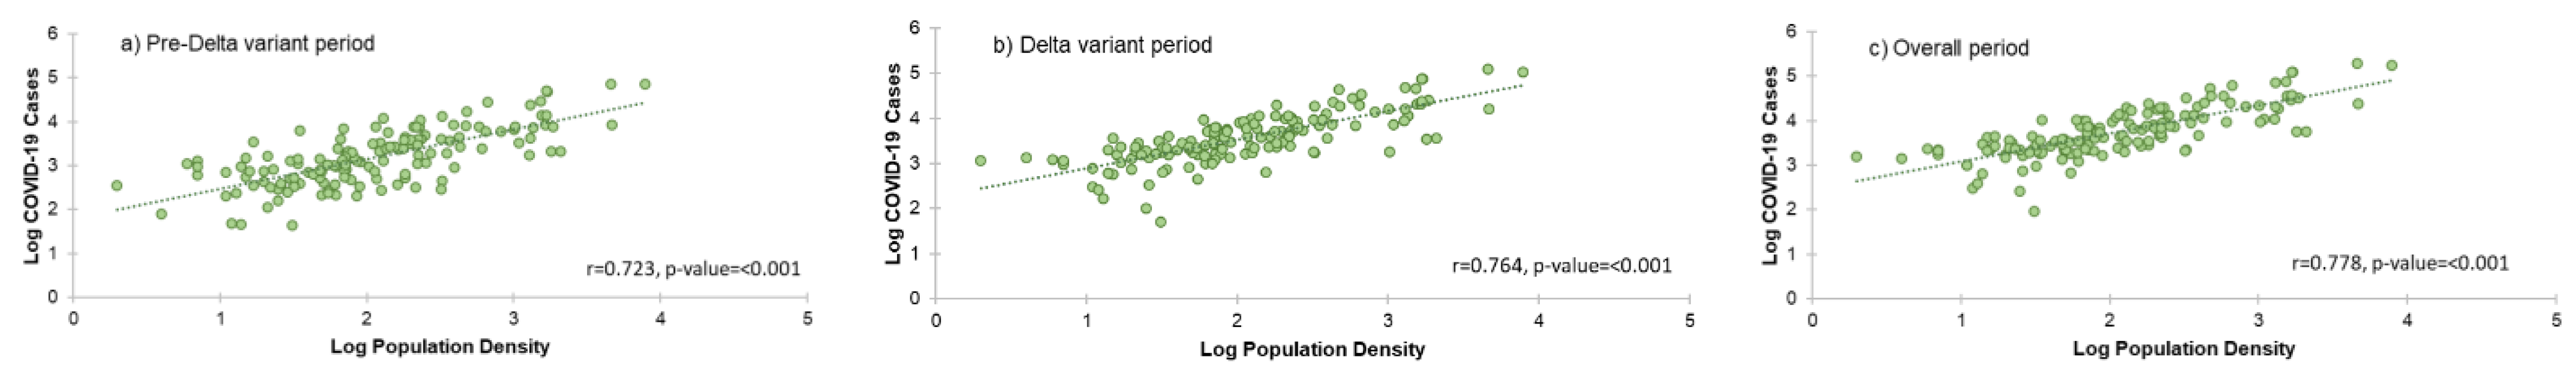
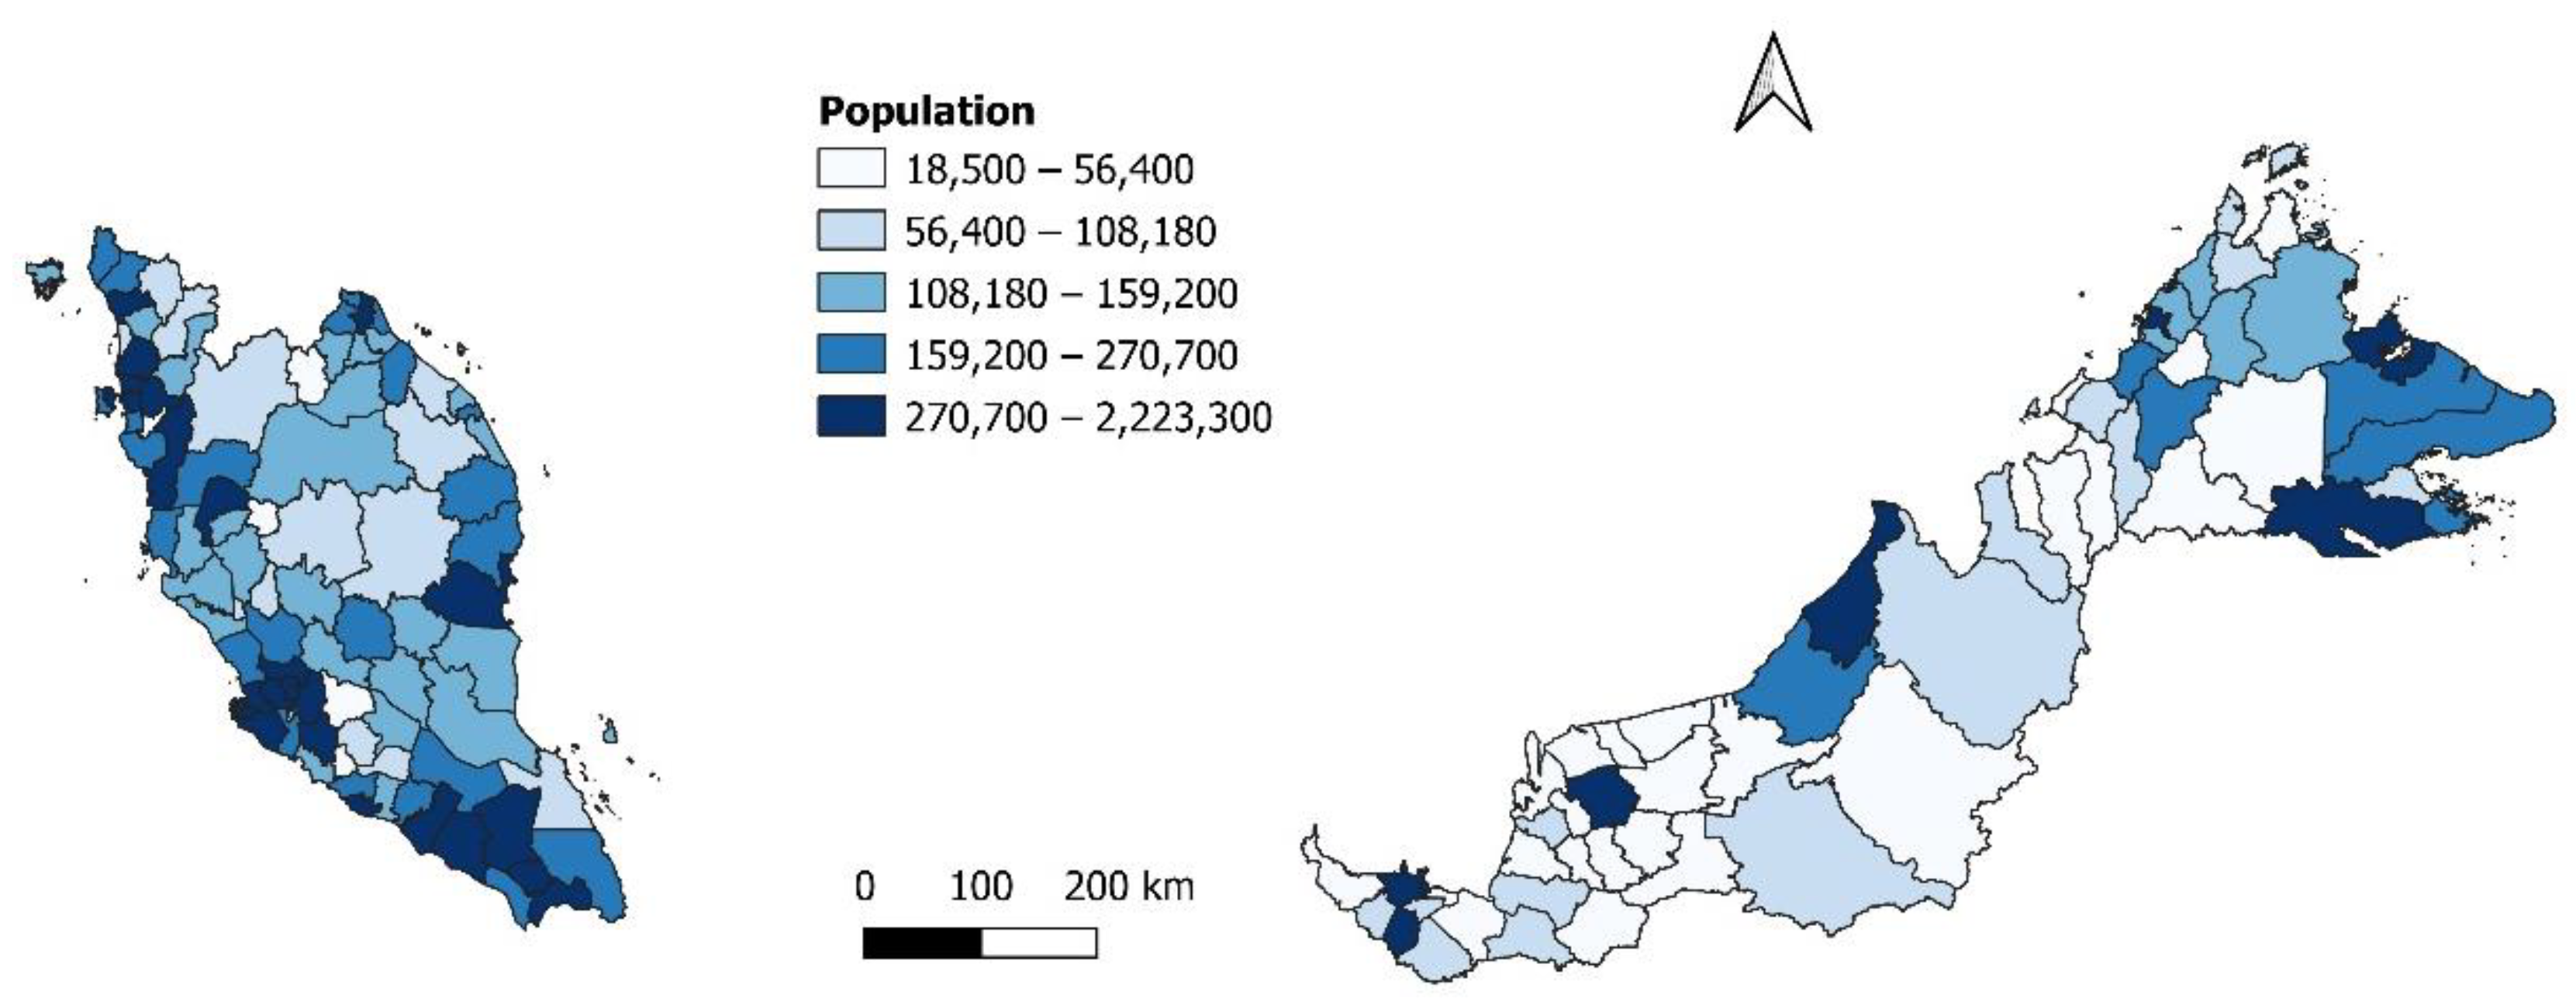
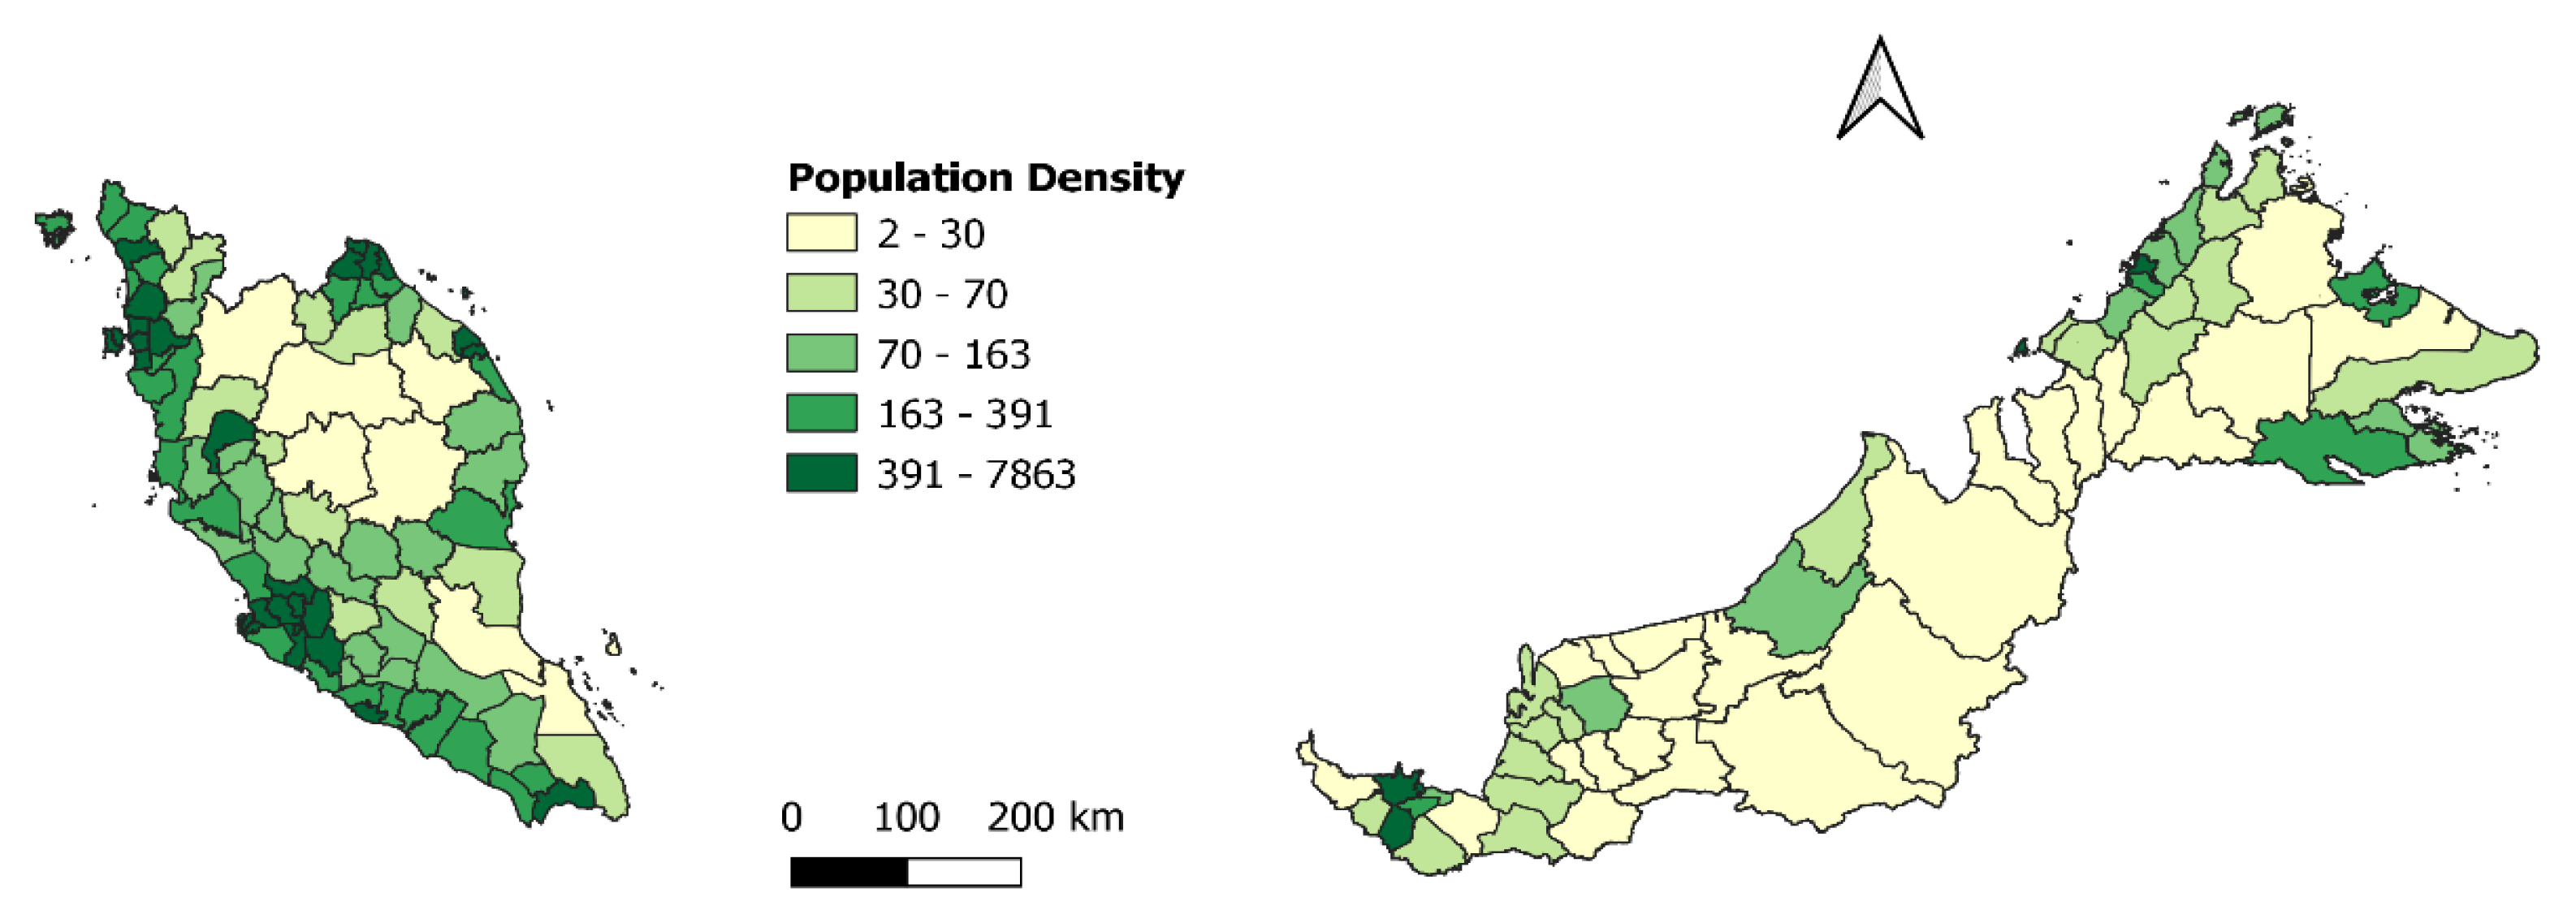
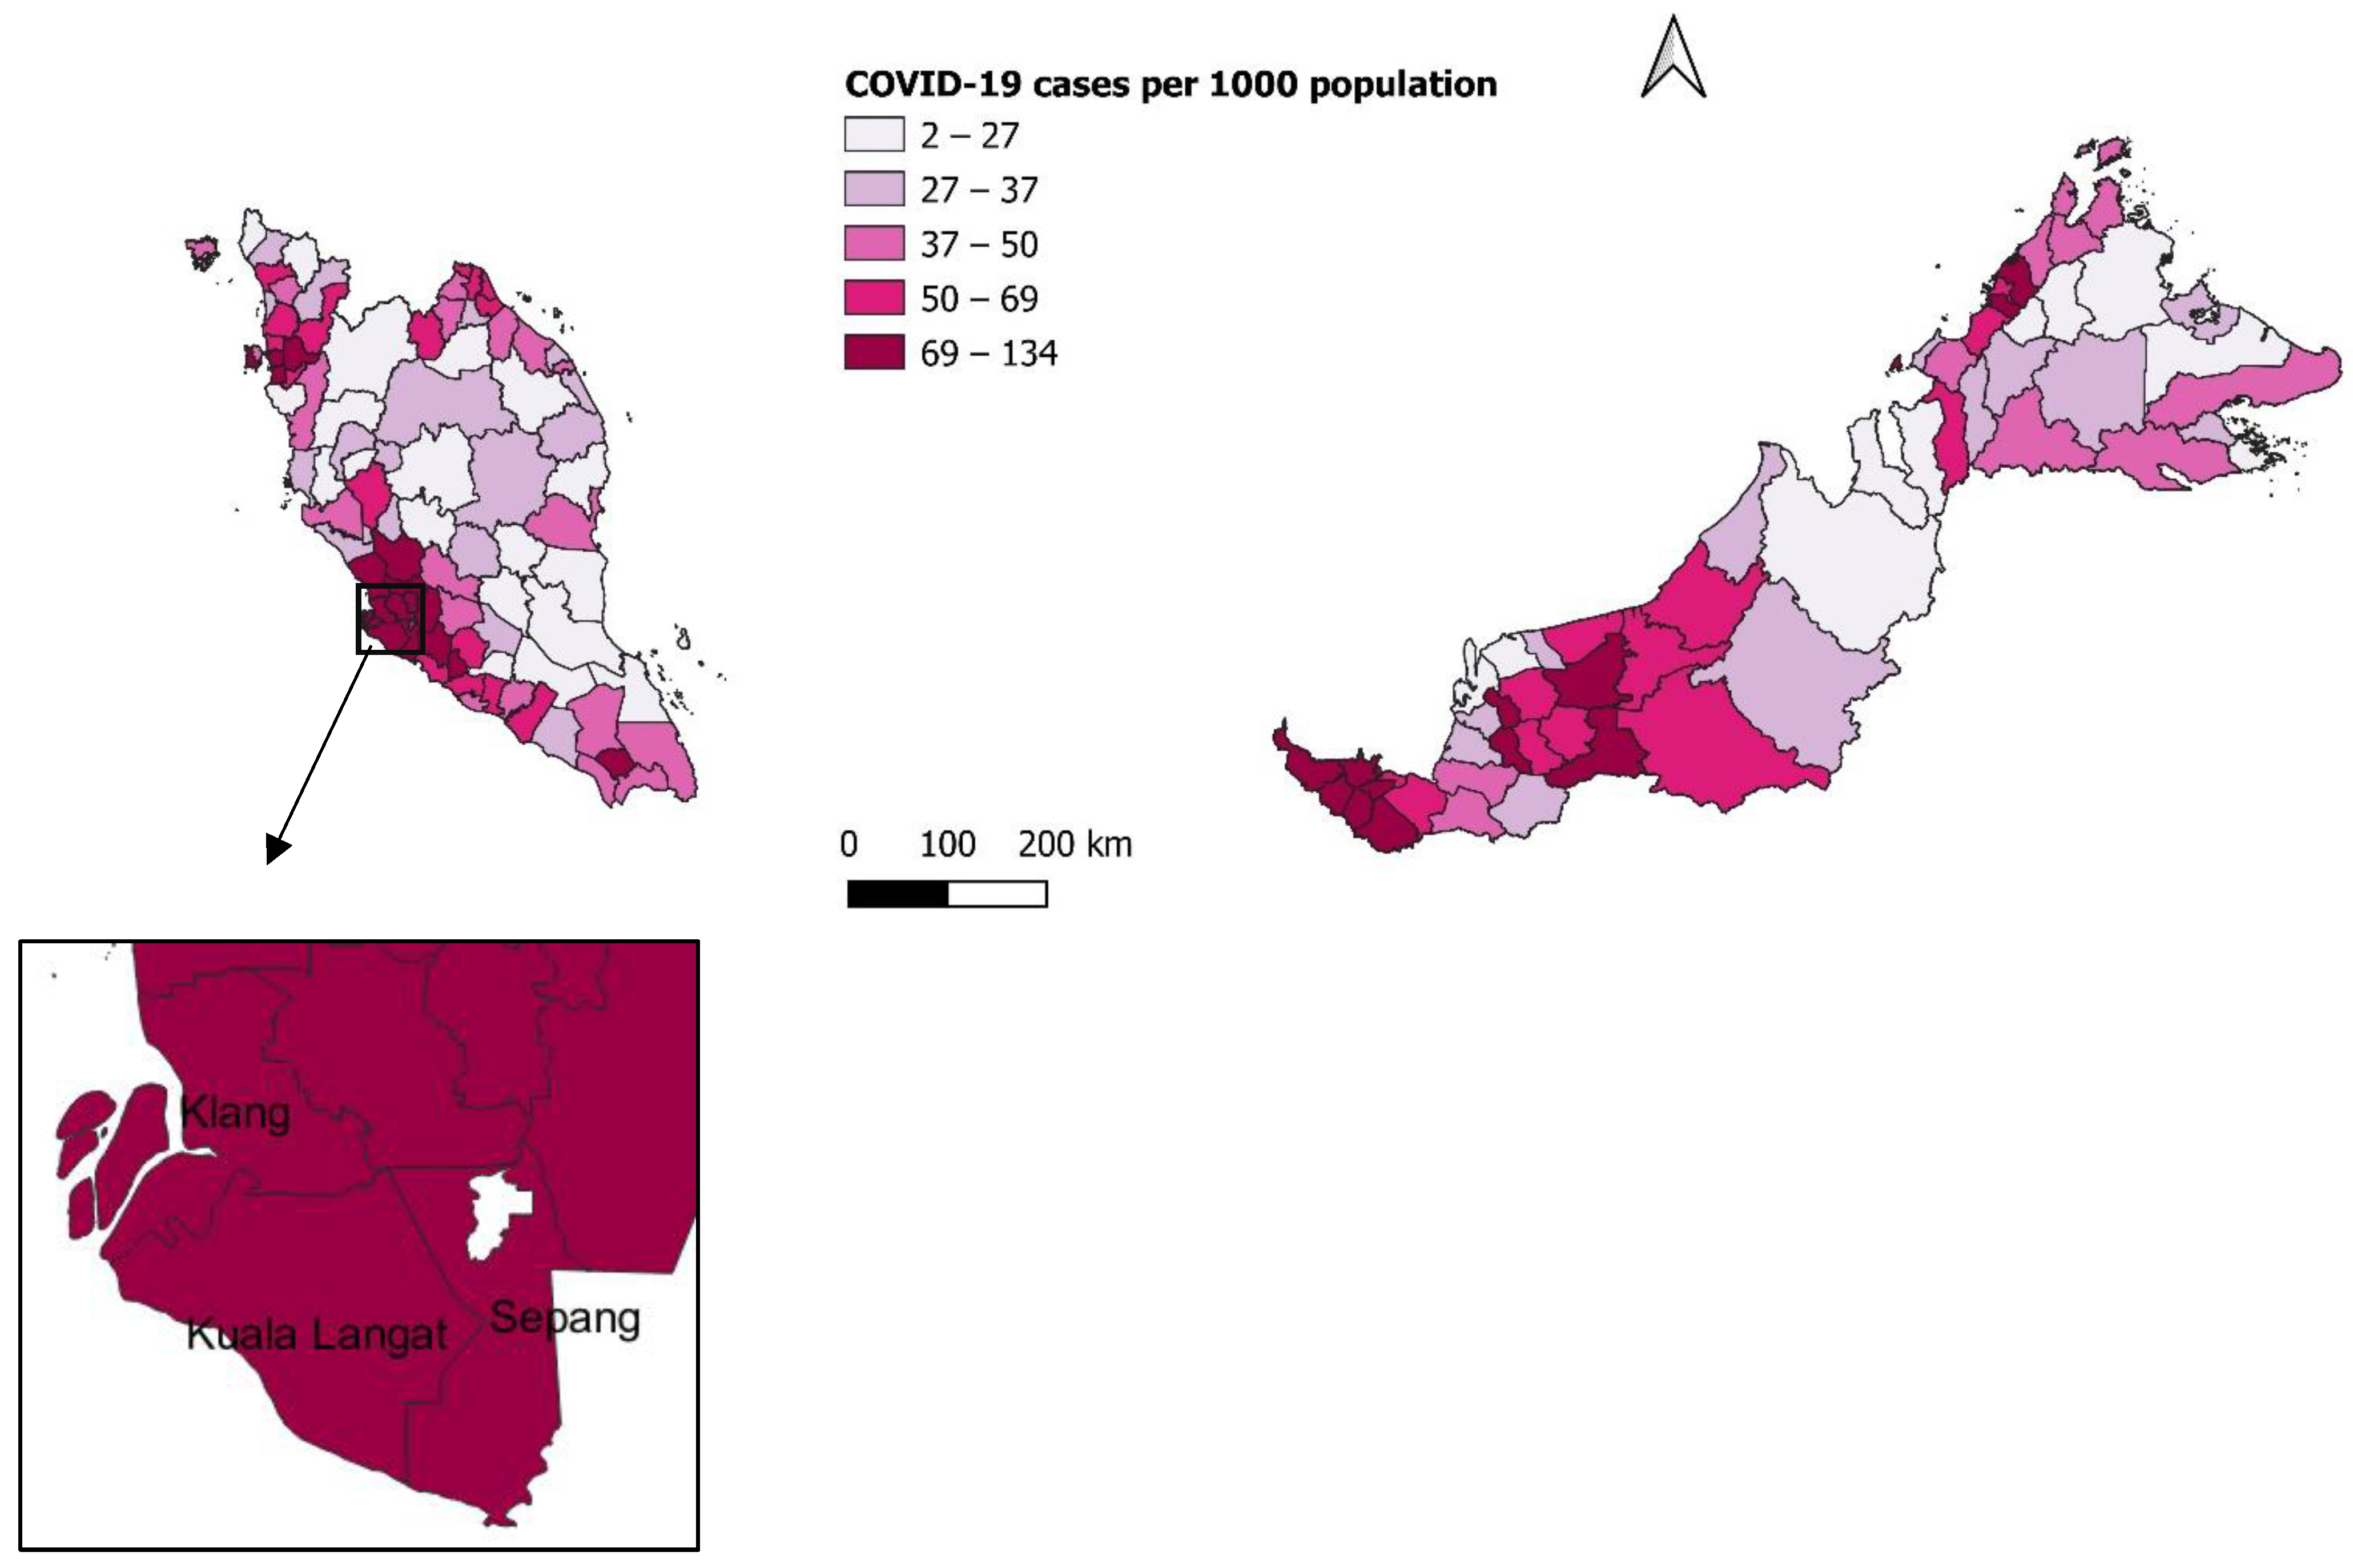
3.3. Correlation between Population and Population Density with COVID-19 Cases
4. Discussion
5. Conclusions
Author Contributions
Funding
Institutional Review Board Statement
Informed Consent Statement
Data Availability Statement
Acknowledgments
Conflicts of Interest
Appendix A

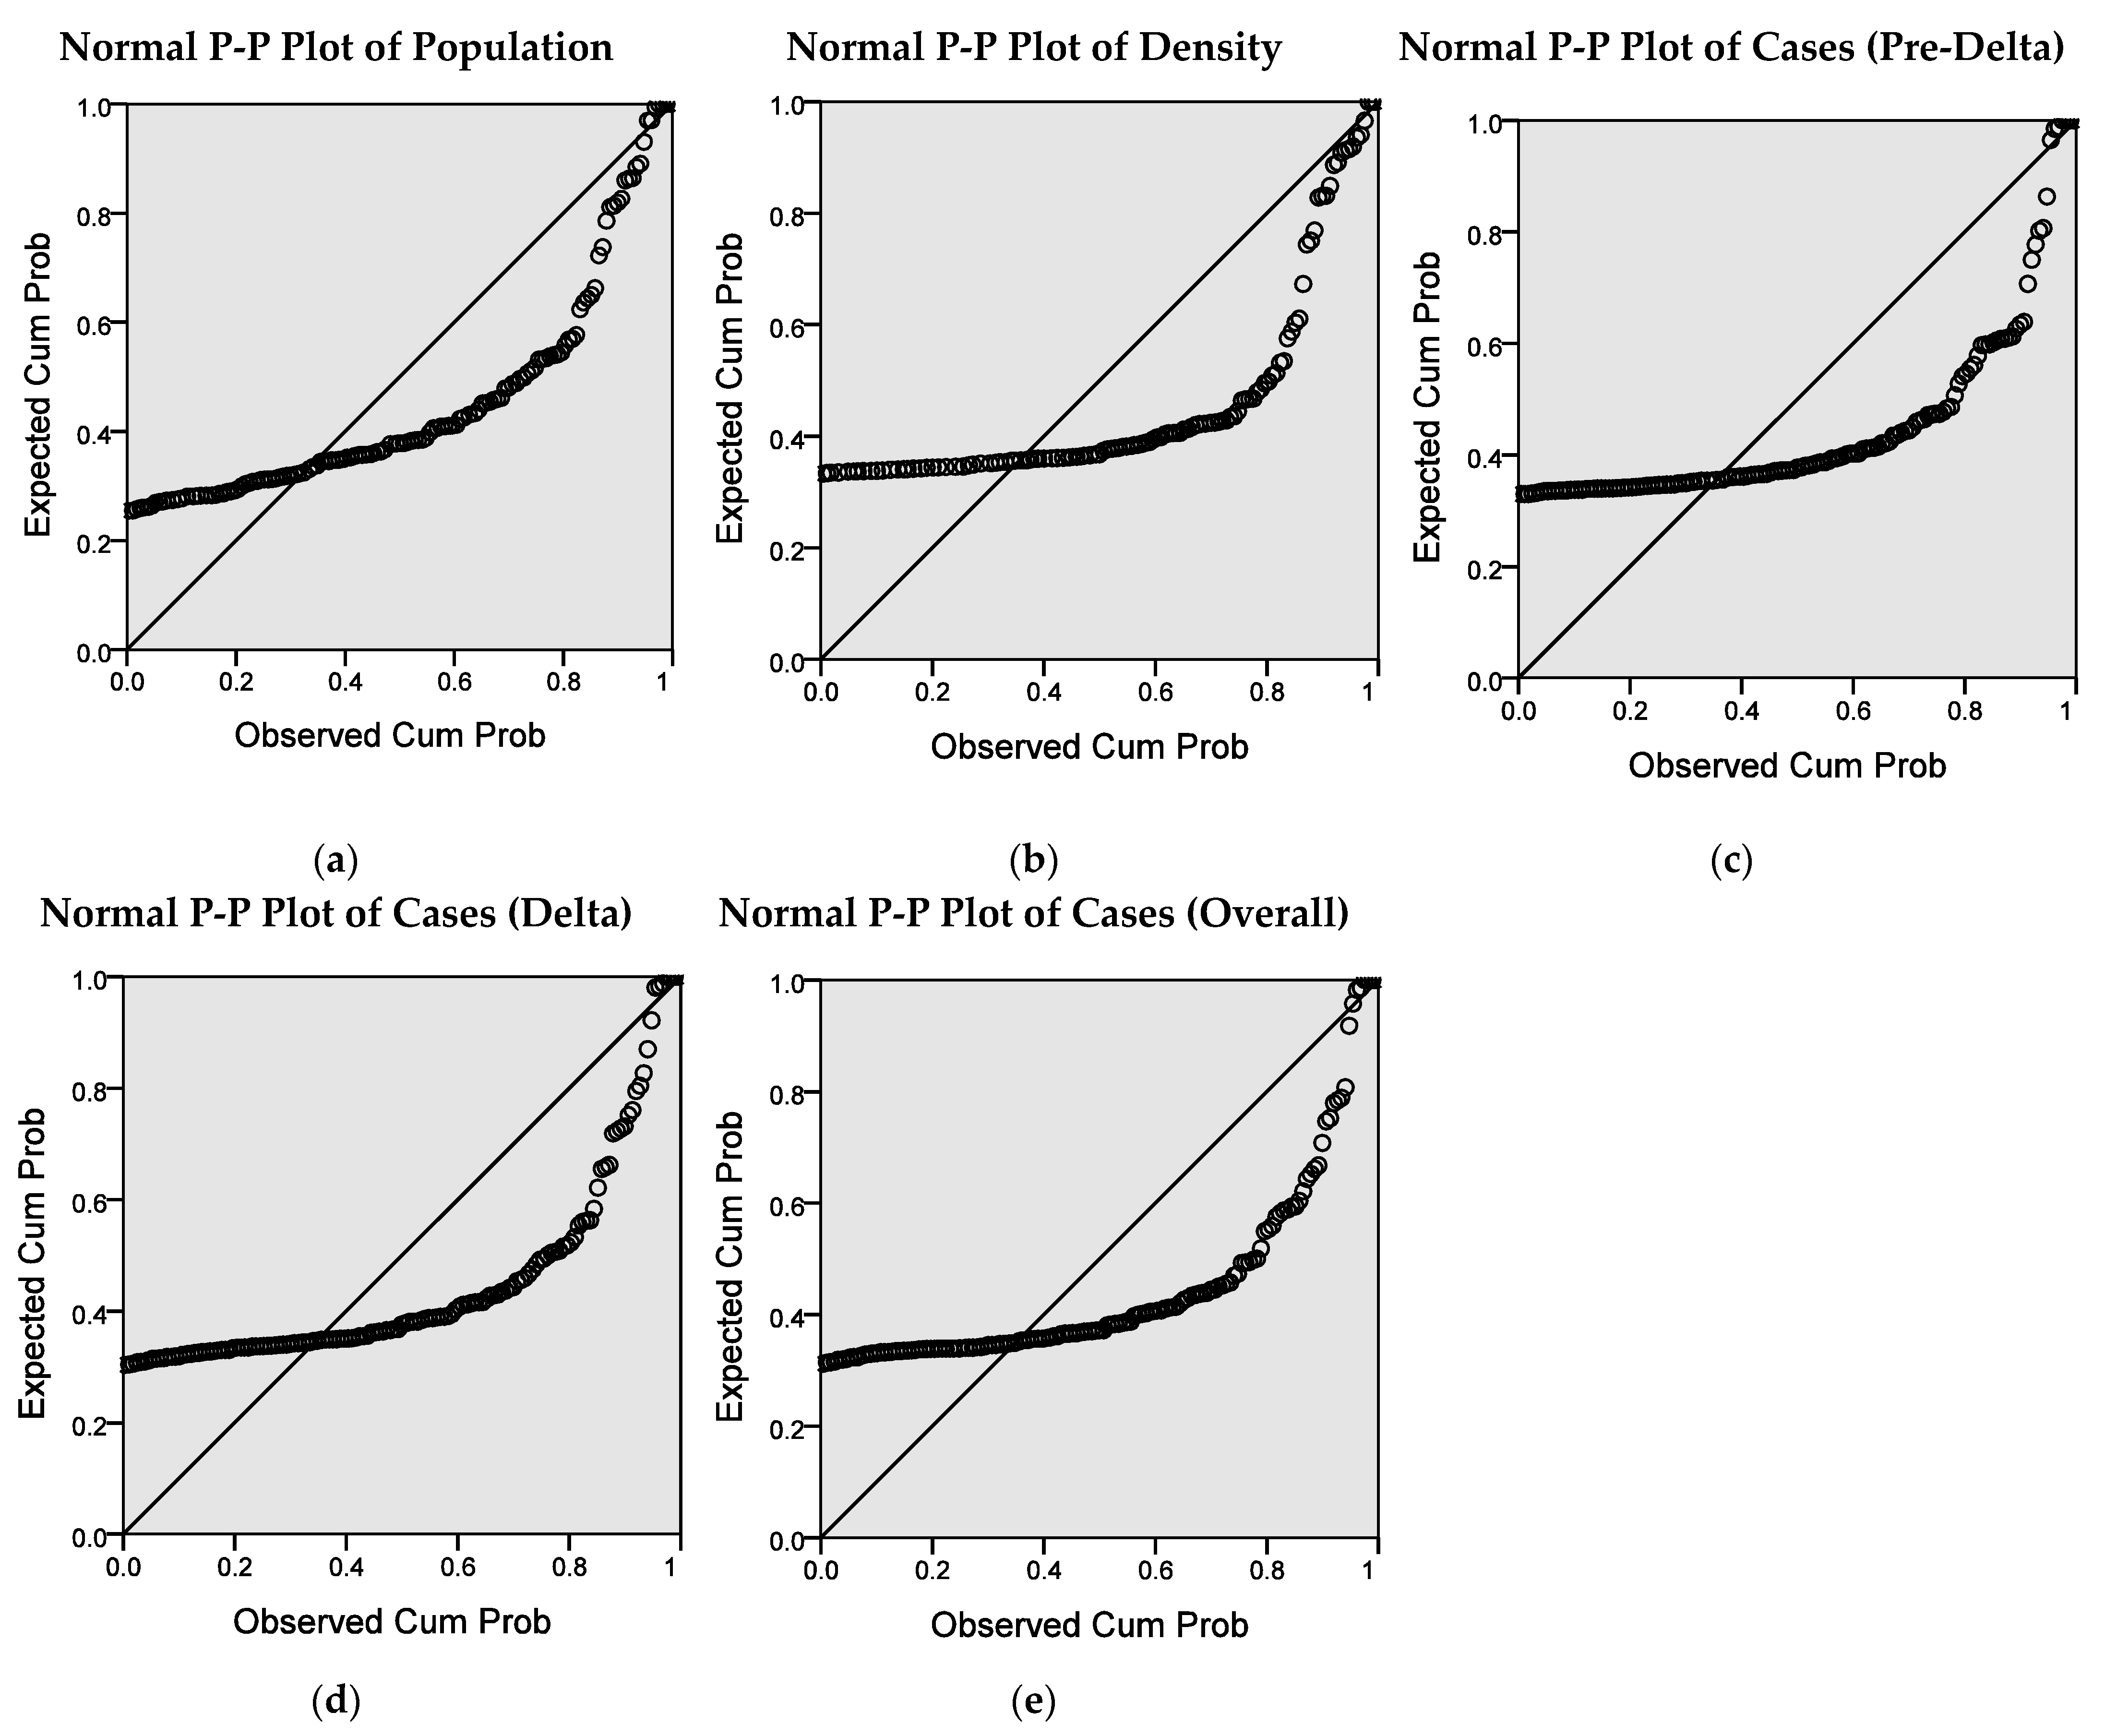
| Shapiro–Wilk, W | df | p-Value | |
|---|---|---|---|
| Population | 0.570 | 145 | <0.001 |
| Density | 0.427 | 145 | <0.001 |
| COVID-19 cases pre-Delta variant | 0.422 | 145 | <0.001 |
| COVID-19 cases during Delta variant | 0.471 | 145 | <0.001 |
| Overall COVID-19 cases | 0.447 | 145 | <0.001 |
Appendix B

Appendix C
| No | State | District | Population | Population Density (Person per sqft/km) | COVID-19 Cases | Incidence per 1000 Population | ||||
|---|---|---|---|---|---|---|---|---|---|---|
| Pre-Delta Variant Period | Delta Variant Period | Overall | Pre-Delta Variant Period | Delta Variant Period | Overall Study Period | |||||
| 1 | Johor | Batu Pahat | 488,800 | 249 | 4997 | 8572 | 13,569 | 10.2 | 17.5 | 27.8 |
| 2 | Johor Bahru | 1,621,400 | 1521 | 29,201 | 45,386 | 74,587 | 18.0 | 28.0 | 46.0 | |
| 3 | Kluang | 351,700 | 123 | 3258 | 9901 | 13,159 | 9.3 | 28.2 | 37.4 | |
| 4 | Kota Tinggi | 231,300 | 66 | 4062 | 5798 | 9860 | 17.6 | 25.1 | 42.6 | |
| 5 | Kulai | 294,800 | 390 | 8506 | 12,526 | 21,032 | 28.9 | 42.5 | 71.3 | |
| 6 | Mersing | 85,100 | 30 | 501 | 1701 | 2202 | 5.9 | 20.0 | 25.9 | |
| 7 | Muar | 288,900 | 207 | 7783 | 9658 | 17,441 | 26.9 | 33.4 | 60.4 | |
| 8 | Pontian | 183,100 | 196 | 3070 | 5051 | 8121 | 16.8 | 27.6 | 44.4 | |
| 9 | Segamat | 221,600 | 77 | 1768 | 3978 | 5746 | 8.0 | 18.0 | 25.9 | |
| 10 | Tangkak | 159,800 | 164 | 2355 | 4088 | 6443 | 14.7 | 25.6 | 40.3 | |
| 11 | Kedah | Baling | 158,700 | 104 | 968 | 8225 | 9193 | 6.1 | 51.8 | 57.9 |
| 12 | Bandar Baharu | 49,300 | 182 | 521 | 2314 | 2835 | 10.6 | 46.9 | 57.5 | |
| 13 | Kota Setar | 423,400 | 1008 | 6477 | 15,779 | 22,256 | 15.3 | 37.3 | 52.6 | |
| 14 | Kuala Muda | 527,900 | 578 | 7700 | 28,286 | 35,986 | 14.6 | 53.6 | 68.2 | |
| 15 | Kubang Pasu | 257,800 | 273 | 1901 | 5523 | 7424 | 7.4 | 21.4 | 28.8 | |
| 16 | Kulim | 334,100 | 432 | 2657 | 23,071 | 25,728 | 8.0 | 69.1 | 77.0 | |
| 17 | Langkawi | 113,100 | 215 | 325 | 4307 | 4632 | 2.9 | 38.1 | 41.0 | |
| 18 | Padang Terap | 74,100 | 55 | 275 | 1556 | 1831 | 3.7 | 21.0 | 24.7 | |
| 19 | Pendang | 111,600 | 177 | 495 | 4034 | 4529 | 4.4 | 36.1 | 40.6 | |
| 20 | Sik | 79,400 | 49 | 218 | 1999 | 2217 | 2.7 | 25.2 | 27.9 | |
| 21 | Yan | 80,000 | 325 | 443 | 1736 | 2179 | 5.5 | 21.7 | 27.2 | |
| 22 | Kelantan | Bachok | 169,100 | 607 | 2417 | 7008 | 9425 | 14.3 | 41.4 | 55.7 |
| 23 | Gua Musang | 118,700 | 15 | 554 | 3690 | 4244 | 4.7 | 31.1 | 35.8 | |
| 24 | Jeli | 53,000 | 40 | 701 | 1970 | 2671 | 13.2 | 37.2 | 50.4 | |
| 25 | Kota Bharu | 620,500 | 1541 | 13,993 | 21,099 | 35,092 | 22.6 | 34.0 | 56.6 | |
| 26 | Kuala Krai | 140,500 | 62 | 967 | 2545 | 3512 | 6.9 | 18.1 | 25.0 | |
| 27 | Machang | 118,200 | 225 | 1696 | 2496 | 4192 | 14.3 | 21.1 | 35.5 | |
| 28 | Pasir Mas | 241,100 | 423 | 4442 | 7155 | 11,597 | 18.4 | 29.7 | 48.1 | |
| 29 | Pasir Puteh | 148,900 | 352 | 1889 | 6901 | 8790 | 12.7 | 46.3 | 59.0 | |
| 30 | Tanah Merah | 155,100 | 176 | 2437 | 5247 | 7684 | 15.7 | 33.8 | 49.5 | |
| 31 | Tumpat | 194,700 | 1083 | 3273 | 7468 | 10,741 | 16.8 | 38.4 | 55.2 | |
| 32 | Melaka | Alor Gajah | 215,100 | 319 | 4100 | 9164 | 13,264 | 19.1 | 42.6 | 61.7 |
| 33 | Jasin | 158,800 | 234 | 4103 | 5237 | 9340 | 25.8 | 33.0 | 58.8 | |
| 34 | Melaka Tengah | 586,600 | 1634 | 8299 | 20,605 | 28,904 | 14.1 | 35.1 | 49.3 | |
| 35 | Negeri Sembilan | Jelebu | 45,700 | 34 | 1083 | 756 | 1839 | 23.7 | 16.5 | 40.2 |
| 36 | Jempol | 133,200 | 90 | 1249 | 3003 | 4252 | 9.4 | 22.5 | 31.9 | |
| 37 | Kuala Pilah | 75,200 | 73 | 1949 | 2227 | 4176 | 25.9 | 29.6 | 55.5 | |
| 38 | Port Dickson | 131,800 | 226 | 4032 | 5072 | 9104 | 30.6 | 38.5 | 69.1 | |
| 39 | Rembau | 49,400 | 122 | 2142 | 2498 | 4640 | 43.4 | 50.6 | 93.9 | |
| 40 | Seremban | 631,000 | 662 | 28,345 | 33,309 | 61,654 | 44.9 | 52.8 | 97.7 | |
| 41 | Tampin | 96,400 | 113 | 754 | 1647 | 2401 | 7.8 | 17.1 | 24.9 | |
| 42 | Pahang | Bentong | 136,800 | 75 | 2106 | 4651 | 6757 | 15.4 | 34.0 | 49.4 |
| 43 | Bera | 113,500 | 51 | 405 | 1770 | 2175 | 3.6 | 15.6 | 19.2 | |
| 44 | Cameron Highlands | 44,100 | 62 | 215 | 1017 | 1232 | 4.9 | 23.1 | 27.9 | |
| 45 | Jerantut | 106,800 | 14 | 951 | 1979 | 2930 | 8.9 | 18.5 | 27.4 | |
| 46 | Kuantan | 536,800 | 181 | 4367 | 19,542 | 23,909 | 8.1 | 36.4 | 44.5 | |
| 47 | Lipis | 105,300 | 20 | 429 | 1301 | 1730 | 4.1 | 12.4 | 16.4 | |
| 48 | Maran | 136,600 | 71 | 560 | 1633 | 2193 | 4.1 | 12.0 | 16.1 | |
| 49 | Pekan | 131,300 | 35 | 398 | 1544 | 1942 | 3.0 | 11.8 | 14.8 | |
| 50 | Raub | 109,100 | 48 | 534 | 810 | 1344 | 4.9 | 7.4 | 12.3 | |
| 51 | Rompin | 137,100 | 26 | 329 | 1341 | 1670 | 2.4 | 9.8 | 12.2 | |
| 52 | Temerloh | 192,400 | 85 | 1299 | 5790 | 7089 | 6.8 | 30.1 | 36.8 | |
| 53 | Perak | Batang Padang | 131,900 | 73 | 807 | 6368 | 7175 | 6.1 | 48.3 | 54.4 |
| 54 | Hilir Perak | 157,700 | 199 | 3835 | 2990 | 6825 | 24.3 | 19.0 | 43.3 | |
| 55 | Hulu Perak | 105,200 | 16 | 751 | 1541 | 2292 | 7.1 | 14.6 | 21.8 | |
| 56 | Kampar | 109,400 | 163 | 365 | 2300 | 2665 | 3.3 | 21.0 | 24.4 | |
| 57 | Kerian | 199,300 | 221 | 1112 | 4153 | 5265 | 5.6 | 20.8 | 26.4 | |
| 58 | Kinta | 841,700 | 645 | 5926 | 19,322 | 25,248 | 7.0 | 23.0 | 30.0 | |
| 59 | Kuala Kangsar | 177,900 | 70 | 730 | 3701 | 4431 | 4.1 | 20.8 | 24.9 | |
| 60 | Larut Matang & Selama | 367,900 | 180 | 3780 | 11,225 | 15,005 | 10.3 | 30.5 | 40.8 | |
| 61 | Manjung | 258,400 | 221 | 3022 | 3983 | 7005 | 11.7 | 15.4 | 27.1 | |
| 62 | Muallim | 73,200 | 78 | 474 | 1664 | 2138 | 6.5 | 22.7 | 29.2 | |
| 63 | Perak Tengah | 114,300 | 89 | 340 | 1340 | 1680 | 3.0 | 11.7 | 14.7 | |
| 64 | Perlis | Kangar | 264,700 | 323 | 286 | 1803 | 2089 | 1.1 | 6.8 | 7.9 |
| 65 | Pulau Pinang | Barat Daya | 237,000 | 1356 | 7463 | 11,507 | 18,970 | 31.5 | 48.6 | 80.0 |
| 66 | Seberang Perai Selatan | 198,000 | 817 | 6052 | 14,223 | 20,275 | 30.6 | 71.8 | 102.4 | |
| 67 | Seberang Perai Tengah | 438,400 | 1844 | 7503 | 25,119 | 32,622 | 17.1 | 57.3 | 74.4 | |
| 68 | Seberang Perai Utara | 344,900 | 1288 | 4198 | 16,125 | 20,323 | 12.2 | 46.8 | 58.9 | |
| 69 | Timur Laut | 588,200 | 4653 | 8645 | 15,933 | 24,578 | 14.7 | 27.1 | 41.8 | |
| 70 | Sabah | Beaufort | 85,100 | 49 | 754 | 3098 | 3852 | 8.9 | 36.4 | 45.3 |
| 71 | Beluran | 135,300 | 25 | 285 | 1932 | 2217 | 2.1 | 14.3 | 16.4 | |
| 72 | Keningau | 222,700 | 63 | 2391 | 5170 | 7561 | 10.7 | 23.2 | 34.0 | |
| 73 | Kinabatangan | 200,600 | 30 | 1279 | 3079 | 4358 | 6.4 | 15.3 | 21.7 | |
| 74 | Kota Belud | 113,700 | 82 | 1576 | 3802 | 5378 | 13.9 | 33.4 | 47.3 | |
| 75 | Kota Kinabalu | 581,700 | 1659 | 14,174 | 23,651 | 37,825 | 24.4 | 40.7 | 65.0 | |
| 76 | Kota Marudu | 82,600 | 43 | 627 | 2882 | 3509 | 7.6 | 34.9 | 42.5 | |
| 77 | Kuala Penyu | 25,000 | 55 | 235 | 443 | 678 | 9.4 | 17.7 | 27.1 | |
| 78 | Kudat | 103,200 | 79 | 2016 | 2096 | 4112 | 19.5 | 20.3 | 39.8 | |
| 79 | Kunak | 81,500 | 72 | 1538 | 1243 | 2781 | 18.9 | 15.3 | 34.1 | |
| 80 | Lahad Datu | 263,100 | 35 | 6295 | 4081 | 10,376 | 23.9 | 15.5 | 39.4 | |
| 81 | Nabawan | 40,600 | 7 | 613 | 1091 | 1704 | 15.1 | 26.9 | 42.0 | |
| 82 | Papar | 171,000 | 135 | 2478 | 6085 | 8563 | 14.5 | 35.6 | 50.1 | |
| 83 | Penampang | 155,300 | 366 | 3706 | 9571 | 13,277 | 23.9 | 61.6 | 85.5 | |
| 84 | Pitas | 46,000 | 32 | 349 | 1810 | 2159 | 7.6 | 39.3 | 46.9 | |
| 85 | Putatan | 73,100 | 1808 | 2154 | 3461 | 5615 | 29.5 | 47.3 | 76.8 | |
| 86 | Ranau | 115,900 | 32 | 532 | 2259 | 2791 | 4.6 | 19.5 | 24.1 | |
| 87 | Sandakan | 518,200 | 229 | 7511 | 10,324 | 17,835 | 14.5 | 19.9 | 34.4 | |
| 88 | Semporna | 175,800 | 154 | 2656 | 653 | 3309 | 15.1 | 3.7 | 18.8 | |
| 89 | Sipitang | 46,000 | 17 | 359 | 2301 | 2660 | 7.8 | 50.0 | 57.8 | |
| 90 | Tambunan | 44,100 | 32 | 343 | 630 | 973 | 7.8 | 14.3 | 22.1 | |
| 91 | Tawau | 521,000 | 233 | 10,690 | 9118 | 19,808 | 20.5 | 17.5 | 38.0 | |
| 92 | Tenom | 70,000 | 29 | 245 | 1658 | 1903 | 3.5 | 23.7 | 27.2 | |
| 93 | Tongod | 44,900 | 4 | 81 | 1355 | 1436 | 1.8 | 30.2 | 32.0 | |
| 94 | Tuaran | 130,500 | 110 | 3176 | 8660 | 11,836 | 24.3 | 66.4 | 90.7 | |
| 95 | Sarawak | Asajaya | 37,900 | 125 | 272 | 1703 | 1975 | 7.2 | 44.9 | 52.1 |
| 96 | Bau | 62,200 | 70 | 556 | 4914 | 5470 | 8.9 | 79.0 | 87.9 | |
| 97 | Belaga | 44,500 | 2 | 357 | 1182 | 1539 | 8.0 | 26.6 | 34.6 | |
| 98 | Betong | 73,600 | 48 | 792 | 2129 | 2921 | 10.8 | 28.9 | 39.7 | |
| 99 | Bintulu | 229,300 | 115 | 7850 | 5867 | 13,717 | 34.2 | 25.6 | 59.8 | |
| 100 | Dalat | 23,300 | 26 | 391 | 337 | 728 | 16.8 | 14.5 | 31.2 | |
| 101 | Daro | 37,900 | 31 | 43 | 51 | 94 | 1.1 | 1.3 | 2.5 | |
| 102 | Julau | 18,700 | 11 | 691 | 302 | 993 | 37.0 | 16.1 | 53.1 | |
| 103 | Kanowit | 34,300 | 15 | 1526 | 590 | 2116 | 44.5 | 17.2 | 61.7 | |
| 104 | Kapit | 65,800 | 17 | 3440 | 1067 | 4507 | 52.3 | 16.2 | 68.5 | |
| 105 | Kuching | 711,500 | 475 | 7915 | 44,407 | 52,322 | 11.1 | 62.4 | 73.5 | |
| 106 | Lawas | 46,200 | 12 | 48 | 258 | 306 | 1.0 | 5.6 | 6.6 | |
| 107 | Limbang | 56,900 | 14 | 47 | 600 | 647 | 0.8 | 10.5 | 11.4 | |
| 108 | Lubok Antu | 33,100 | 11 | 207 | 794 | 1001 | 6.3 | 24.0 | 30.2 | |
| 109 | Lundu | 39,200 | 22 | 326 | 2825 | 3151 | 8.3 | 72.1 | 80.4 | |
| 110 | Maradong | 34,800 | 48 | 1422 | 2386 | 3808 | 40.9 | 68.6 | 109.4 | |
| 111 | Marudi | 76,900 | 25 | 158 | 101 | 259 | 2.1 | 1.3 | 3.4 | |
| 112 | Matu | 21,400 | 13 | 233 | 166 | 399 | 10.9 | 7.8 | 18.6 | |
| 113 | Miri | 356,900 | 69 | 6954 | 2883 | 9837 | 19.5 | 8.1 | 27.6 | |
| 114 | Mukah | 52,300 | 21 | 1656 | 1923 | 3579 | 31.7 | 36.8 | 68.4 | |
| 115 | Pakan | 18,500 | 20 | 759 | 761 | 1520 | 41.0 | 41.1 | 82.2 | |
| 116 | Samarahan | 102,700 | 252 | 1185 | 6443 | 7628 | 11.5 | 62.7 | 74.3 | |
| 117 | Saratok | 54,400 | 61 | 376 | 1504 | 1880 | 6.9 | 27.6 | 34.6 | |
| 118 | Sarikei | 67,400 | 68 | 1319 | 999 | 2318 | 19.6 | 14.8 | 34.4 | |
| 119 | Selangau | 27,400 | 7 | 1258 | 933 | 2191 | 45.9 | 34.1 | 80.0 | |
| 120 | Serian | 105,800 | 60 | 999 | 9253 | 10,252 | 9.4 | 87.5 | 96.9 | |
| 121 | Sibu | 288,000 | 129 | 12,107 | 7796 | 19,903 | 42.0 | 27.1 | 69.1 | |
| 122 | Simunjan | 46,900 | 21 | 112 | 2341 | 2453 | 2.4 | 49.9 | 52.3 | |
| 123 | Song | 24,500 | 6 | 1089 | 1216 | 2305 | 44.4 | 49.6 | 94.1 | |
| 124 | Sri Aman | 78,300 | 34 | 1446 | 2212 | 3658 | 18.5 | 28.3 | 46.7 | |
| 125 | Tatau | 36,900 | 7 | 947 | 1150 | 2097 | 25.7 | 31.2 | 56.8 | |
| 126 | Selangor | Gombak | 842,200 | 1290 | 24,411 | 47,832 | 72,243 | 29.0 | 56.8 | 85.8 |
| 127 | Hulu Langat | 1,413,100 | 1697 | 47,840 | 75,478 | 123,318 | 33.9 | 53.4 | 87.3 | |
| 128 | Hulu Selangor | 245,700 | 140 | 5566 | 11,592 | 17,158 | 22.7 | 47.2 | 69.8 | |
| 129 | Klang | 1,056,200 | 1672 | 50,417 | 76,162 | 126,579 | 47.7 | 72.1 | 119.8 | |
| 130 | Kuala Langat | 279,100 | 326 | 13,069 | 19,078 | 32,147 | 46.8 | 68.4 | 115.2 | |
| 131 | Kuala Selangor | 259,900 | 219 | 7791 | 11,624 | 19,415 | 30.0 | 44.7 | 74.7 | |
| 132 | Petaling | 2,223,300 | 4565 | 72,839 | 124,243 | 197,082 | 32.8 | 55.9 | 88.6 | |
| 133 | Sabak Bernam | 130,500 | 130 | 1285 | 2204 | 3489 | 9.8 | 16.9 | 26.7 | |
| 134 | Sepang | 265,600 | 482 | 16,667 | 18,872 | 35,539 | 62.8 | 71.1 | 133.8 | |
| 135 | Terengganu | Besut | 175,800 | 143 | 2745 | 3910 | 6655 | 15.6 | 22.2 | 37.9 |
| 136 | Dungun | 193,300 | 71 | 1049 | 6157 | 7206 | 5.4 | 31.9 | 37.3 | |
| 137 | Hulu Terengganu | 90,700 | 23 | 807 | 1550 | 2357 | 8.9 | 17.1 | 26.0 | |
| 138 | Kemaman | 216,100 | 85 | 202 | 5252 | 5454 | 0.9 | 24.3 | 25.2 | |
| 139 | Kuala Nerus | 157,900 | 397 | 928 | 3676 | 4604 | 5.9 | 23.3 | 29.2 | |
| 140 | Kuala Terengganu | 268,600 | 1278 | 1698 | 8905 | 10,603 | 6.3 | 33.2 | 39.5 | |
| 141 | Marang | 121,700 | 183 | 629 | 2804 | 3433 | 5.2 | 23.0 | 28.2 | |
| 142 | Setiu | 69,900 | 54 | 1060 | 2245 | 3305 | 15.2 | 32.1 | 47.3 | |
| 143 | Federal Territory | Kuala Lumpur | 1,910,700 | 7863 | 73,041 | 105,365 | 178,406 | 38.2 | 55.1 | 93.4 |
| 144 | Putrajaya | 94,600 | 2090 | 2147 | 3572 | 5719 | 22.7 | 37.8 | 60.5 | |
| 145 | Labuan | 103,100 | 1028 | 7601 | 1856 | 9457 | 73.7 | 18.0 | 91.7 | |
References
- WHO. IHR Emergency Committee on Novel Coronavirus (2019-nCoV). Available online: https://www.who.int/director-general/speeches/detail/who-director-general-s-statement-on-ihr-emergency-committee-on-novel-coronavirus-(2019-ncov) (accessed on 1 October 2021).
- WHO. Situation Report-51 Situation in Numbers Total and New Cases in Last 24 Hours; WHO: Geneva, Switzerland, 2020.
- African Countries Face High Risk of COVID-19 Resurgence|WHO|Regional Office for Africa. Available online: https://www.afro.who.int/news/african-countries-face-high-risk-covid-19-resurgence (accessed on 6 October 2021).
- Rajatanavin, N.; Tuangratananon, T.; Suphanchaimat, R.; Tangcharoensathien, V. Responding to the COVID-19 Second Wave in Thailand by Diversifying and Adapting Lessons from the First Wave. BMJ Glob. Health 2021, 6, 1–9. [Google Scholar] [CrossRef] [PubMed]
- Iftimie, S.; Lopez-Azcona, A.F.; Vallverdu, I.; Hernandez-Flix, S.; De Febrer, G.; Parra, S.; Hernandez-Aguilera, A.; Riu, F.; Joven, J.; Andreychuk, N.; et al. First and Second Waves of Coronavirus Disease-19: A Comparative Study in Hospitalized Patients in Reus, Spain. PLoS ONE 2021, 16, e0248029. [Google Scholar] [CrossRef] [PubMed]
- WHO. WHO Coronavirus (COVID-19) Dashboard|WHO Coronavirus (COVID-19) Dashboard with Vaccination Data. Available online: https://covid19.who.int/info?openIndex=2 (accessed on 1 March 2022).
- Ministry of Health Malaysia. Kesiapsiagaan Hospital KKM Dalam Menghadapi Gelombang Ketiga Pandemik COVID-19|COVID-19 MALAYSIA. Available online: https://covid-19.moh.gov.my/semasa-kkm/122020/kesiapsiagaan-kkm-menghadapi-gelombang-ketiga-pandemik-covid-19 (accessed on 6 October 2021).
- Ministry of Health Malaysia. Situasi Terkini COVID-19 di Malaysia Sehingga 30 SEPT 2021|COVID-19 MALAYSIA. Available online: https://covid-19.moh.gov.my/terkini/2021/09/situasi-terkini-covid-19-di-malaysia-sehingga-30092021 (accessed on 6 October 2021).
- Faziera, N.; Epa, A.E.; Chabo, D.; Masron, T. Coronavirus (COVID-19): Density Risk Mapping Using Population and Housing Census of Malaysia 2010. Geografi 2020, 8, 21–47. [Google Scholar]
- Tammes, P. Social Distancing, Population Density, and Spread of COVID-19 in England: A Longitudinal Study. BJGP Open 2020, 4, bjgpopen20X101116. [Google Scholar] [CrossRef] [PubMed]
- Coşkun, H.; Yıldırım, N.; Gündüz, S. The Spread of COVID-19 Virus through Population Density and Wind in Turkey Cities. Sci. Total Environ. 2021, 751, 141663. [Google Scholar] [CrossRef] [PubMed]
- Aw, S.B.; Teh, B.T.; Ling, G.H.T.; Leng, P.C.; Chan, W.H.; Ahmad, M.H. The COVID-19 Pandemic Situation in Malaysia: Lessons Learned from the Perspective of Population Density. Int. J. Environ. Res. Public Health 2021, 18, 6566. [Google Scholar] [CrossRef]
- Ganasegeran, K.; Jamil, M.F.A.; Ch’ng, A.S.H.; Looi, I.; Peariasamy, K.M. Influence of Population Density for COVID-19 Spread in Malaysia: An Ecological Study. Int. J. Environ. Res. Public Health 2021, 18, 9866. [Google Scholar] [CrossRef] [PubMed]
- WHO. Tracking SARS-CoV-2 Variants. Available online: https://www.who.int/en/activities/tracking-SARS-CoV-2-variants/ (accessed on 6 October 2021).
- Campbell, F.; Archer, B.; Laurenson-Schafer, H.; Jinnai, Y.; Konings, F.; Batra, N.; Pavlin, B.; Vandemaele, K.; Van Kerkhove, M.D.; Jombart, T.; et al. Increased Transmissibility and Global Spread of SARS-CoV-2 Variants of Concern as at June 2021. Eurosurveillance 2021, 26, 2100509. [Google Scholar] [CrossRef]
- Ministry of Health Malaysia. Kenyataan Akhbar Kementerian Kesihatan Malaysia Situasi Semasa Jangkitan Penyakit Coronavirus 2019 (COVID-19) Di Malaysia 2 Mei; Ministry of Health Malaysia: Putrajaya, Malaysia, 2021.
- Ministry of Health Malaysia. Kenyataan Akhbar Kementerian Kesihatan Malaysia Situasi Semasa Jangkitan Penyakit Coronavirus 2019 (COVID-19) Di Malaysia 28 Julai 2021; Ministry of Health Malaysia: Putrajaya, Malaysia, 2021.
- Bernal, J.L.; Andrews, N.; Gower, C.; Gallagher, E.; Simmons, R.; Thelwall, S.; Stowe, J.; Tessier, E.; Groves, N.; Dabrera, G.; et al. Effectiveness of COVID-19 Vaccines against the B.1.617.2 (Delta) Variant. N. Engl. J. Med. 2021, 385, 585–594. [Google Scholar] [CrossRef] [PubMed]
- Department of Statistics Malaysia. Population Quick Info. Available online: https://www.dosm.gov.my/v1/index.php?r=column/cone&menu_id=Nk1JZnJBMm1TdmRFS0xaTXZnanIrQT09 (accessed on 6 October 2021).
- IBM Corp. IBM SPSS Statistics for Windows; Version 24.0; IBM Corp.: Armonk, NY, USA, 2019. [Google Scholar]
- Schober, P.; Boer, C.; Schwarte, L.A. Correlation Coefficients. Anesth. Analg. 2018, 126, 1763–1768. [Google Scholar] [CrossRef] [PubMed]
- Alexopoulos, E.C. Introduction to Multivariate Regression Analysis. Hippokratia 2010, 14 (Suppl. S1), 23. [Google Scholar]
- Bian, L.; Gao, Q.; Gao, F.; Wang, Q.; He, Q.; Wu, X.; Mao, Q.; Xu, M.; Liang, Z. Impact of the Delta variant on vaccine efficacy and response strategies. Expert Rev. Vaccines 2021, 20, 1201–1209. [Google Scholar] [CrossRef]
- Herlihy, R.; Bamberg, W.; Burakoff, A.; Alden, N.; Severson, R.; Bush, E.; Kawasaki, B.; Berger, B.; Austin, E.; Shea, M.; et al. Rapid Increase in Circulation of the SARS-CoV-2 B.1.617.2 (Delta) Variant—Mesa County, Colorado, April–June 2021. Morb. Mortal. Wkly. Rep. 2021, 70, 1084–1087. [Google Scholar] [CrossRef] [PubMed]
- Morens, D.M.; Folkers, G.K.; Fauci, A.S. The challenge of emerging and re-emerging infectious diseases. Nature 2004, 430, 242–249. [Google Scholar] [CrossRef] [PubMed]
- Tarwater, P.M.; Martin, C.F. Effects of population density on the spread of disease. Complexity 2001, 6, 29–36. [Google Scholar] [CrossRef]
- Amoo, E.O.; Adekeye, O.; Olawole-Isaac, A.; Fasina, F.; Adekola, P.O.; Samuel, G.W.; Akanbi, M.A.; Oladosun, M.; Azuh, D.E. Nigeria and Italy Divergences in Coronavirus Experience: Impact of Population Density. Sci. World J. 2020, 2020, 8923036. [Google Scholar] [CrossRef] [PubMed]
- Li, R.; Richmond, P.; Roehner, B.M. Effect of population density on epidemics. arXiv 2018, arXiv:1803.03809. [Google Scholar] [CrossRef] [Green Version]
- Sheikh, A.; McMenamin, J.; Taylor, B.; Robertson, C. SARS-CoV-2 Delta VOC in Scotland: Demographics, risk of hospital admission, and vaccine effectiveness. Lancet 2021, 397, 2461–2462. [Google Scholar] [CrossRef]
- Goscé, L.; Phillips, A.; Spinola, P.; Gupta, R.K.; Abubakar, I. Modelling SARS-CoV-2 Spread in London: Approaches to Lift the Lockdown. J. Infect. 2020, 81, 260–265. [Google Scholar] [CrossRef] [PubMed]
- Gerli, A.G.; Centanni, S.; Miozzo, M.R.; Virchow, J.C.; Sotgiu, G.; Canonica, G.W.; Soriano, J.B. COVID-19 mortality rates in the European Union, Switzerland, and the UK: Effect of timeliness, lockdown rigidity, and population density. Minerva Med. 2020, 111, 308–314. [Google Scholar] [CrossRef] [PubMed]


| Factor | Crude Coefficients, B (95% CI) | p-Value | Adjusted Coefficients, B (95% CI) | Std. Error | p-Value |
|---|---|---|---|---|---|
| Age 15 and above | 1222.87 (223.87, 2221.88) | 0.017 | |||
| Vaccination | 674.60 (371.644, 977.555) | <0.001 | |||
| Median household income (RM) | 11.58 (9.360, 13.788) | <0.001 | 4.88 (2.64, 7.114) | 1.132 | <0.001 |
| Population density | 23.28 (20.152, 26.409) | <0.001 | 18.10 (14.305, 21.887) | 1.918 | <0.001 |
| Absolute Population and COVID-19 Cases | Population Density and COVID-19 Cases | |||
|---|---|---|---|---|
| Correlation (r) | p-Value | Correlation (r) | p-Value | |
| Pre-Delta variant period | 0.785 | <0.001 * | 0.723 | <0.001 * |
| Delta variant period | 0.864 | <0.001 * | 0.764 | <0.001 * |
| Overall period | 0.871 | <0.001 * | 0.778 | <0.001 * |
Publisher’s Note: MDPI stays neutral with regard to jurisdictional claims in published maps and institutional affiliations. |
© 2022 by the authors. Licensee MDPI, Basel, Switzerland. This article is an open access article distributed under the terms and conditions of the Creative Commons Attribution (CC BY) license (https://creativecommons.org/licenses/by/4.0/).
Share and Cite
Md Iderus, N.H.; Lakha Singh, S.S.; Mohd Ghazali, S.; Yoon Ling, C.; Cia Vei, T.; Md Zamri, A.S.S.; Ahmad Jaafar, N.; Ruslan, Q.; Ahmad Jaghfar, N.H.; Gill, B.S. Correlation between Population Density and COVID-19 Cases during the Third Wave in Malaysia: Effect of the Delta Variant. Int. J. Environ. Res. Public Health 2022, 19, 7439. https://doi.org/10.3390/ijerph19127439
Md Iderus NH, Lakha Singh SS, Mohd Ghazali S, Yoon Ling C, Cia Vei T, Md Zamri ASS, Ahmad Jaafar N, Ruslan Q, Ahmad Jaghfar NH, Gill BS. Correlation between Population Density and COVID-19 Cases during the Third Wave in Malaysia: Effect of the Delta Variant. International Journal of Environmental Research and Public Health. 2022; 19(12):7439. https://doi.org/10.3390/ijerph19127439
Chicago/Turabian StyleMd Iderus, Nuur Hafizah, Sarbhan Singh Lakha Singh, Sumarni Mohd Ghazali, Cheong Yoon Ling, Tan Cia Vei, Ahmed Syahmi Syafiq Md Zamri, Nadhar Ahmad Jaafar, Qistina Ruslan, Nur Huda Ahmad Jaghfar, and Balvinder Singh Gill. 2022. "Correlation between Population Density and COVID-19 Cases during the Third Wave in Malaysia: Effect of the Delta Variant" International Journal of Environmental Research and Public Health 19, no. 12: 7439. https://doi.org/10.3390/ijerph19127439
APA StyleMd Iderus, N. H., Lakha Singh, S. S., Mohd Ghazali, S., Yoon Ling, C., Cia Vei, T., Md Zamri, A. S. S., Ahmad Jaafar, N., Ruslan, Q., Ahmad Jaghfar, N. H., & Gill, B. S. (2022). Correlation between Population Density and COVID-19 Cases during the Third Wave in Malaysia: Effect of the Delta Variant. International Journal of Environmental Research and Public Health, 19(12), 7439. https://doi.org/10.3390/ijerph19127439