
Heterogeneity of Cognitive Profiles in Children and Adolescents with Mild Intellectual Disability (MID)

 ,
,  , ,
, , 
Abstract
:1. Introduction
2. Materials and Methods
2.1. Sample
2.2. Measures
2.3. Statistical Analysis
3. Results
4. Discussion
5. Conclusions and Practical Implications
6. Limitations and Future Directions
Author Contributions
Funding
Institutional Review Board Statement
Informed Consent Statement
Data Availability Statement
Acknowledgments
Conflicts of Interest
References
- Soenen, S.M.T.A. Mild Intellectual Disability: An Entity? Mapping Clinical Profiles and Support Needs. Ph.D. Thesis, Leiden University, Leiden, The Netherlands, 2016. [Google Scholar]
- Patel, D.R.; Cabral, M.D.; Ho, A.; Merrick, J. A clinical primer on intellectual disability. Transl. Pediatrics 2020, 9 (Suppl. S1), S23–S35. [Google Scholar] [CrossRef] [PubMed]
- World Health Organization. International Statistical Classification of Diseases and Related Health Problems, 11th ed.; 2019; Available online: https://icd.who.int/ (accessed on 26 March 2022).
- American Psychiatric Association. Diagnostic and Statistical Manual of Mental Disorders, 5th ed.; American Psychiatric Press: Washington, DC, USA, 2013. [Google Scholar]
- Ropers, F.; Derivery, E.; Hu, H.; Garshasbi, M.; Karbasiyan, M.; Herold, M.; Nürnberg, G.; Ullmann, R.; Gautreau, A.; Sperling, K.; et al. Identification of a novel candidate gene for non-syndromic autosomal recessive intellectual disability: The WASH complex member SWIP. Hum. Mol. Genet. 2011, 20, 2585–2590. [Google Scholar] [CrossRef] [Green Version]
- Chaste, P.; Leboyer, M. Autism risk factors: Genes, environment, and gene-environment interactions. Dialogues Clin. Neurosci. 2012, 14, 281–292. [Google Scholar] [CrossRef]
- Oliveira, L.F.; Chaves, T.F.; Baretto, N.; de Luca, G.R.; Barbato, I.T.; Barbato Filho, J.H.; Ocampos, M.; Maris, A.F. Etiology of intellectual disability in individuals from special education schools in the south of Brazil. BMC Pediatrics 2020, 20, 506. [Google Scholar] [CrossRef] [PubMed]
- Pierzynowska, K.; Mański, A.; Limanówka, M.; Wierzba, J.; Gaffke, L.; Anikiej, P.; Węgrzyn, G. Untypically mild phenotype of a patient suffering from Sanfilippo syndrome B with the c.638C>T/c.889C>T (p.Pro213Leu/p.Arg297Ter) mutations in the NAGLU gene. Mol. Genet. Genom. Med. 2020, 8, e1356. [Google Scholar] [CrossRef] [PubMed]
- Emerson, E. Poverty and people with intellectual disabilities. Ment. Retard. Dev. Disabil. Res. Rev. 2007, 13, 107–113. [Google Scholar] [CrossRef]
- Parnes, P.; Cameron, D.; Christie, N.; Cockburn, L.; Hashemi, G.; Yoshida, K. Disability in low-income countries: Issues and implications. Disabil. Rehabil. 2009, 31, 1170–1180. [Google Scholar] [CrossRef]
- Trawicka, A.; Lewandowska-Walter, A.; Bogdanowicz, M.; Woźniak-Mielczarek, L.; Janikowska-Hołoweńko, D.; Bilicka-Siewert, M. Internalizing and externalizing behaviors in chronically ill adolescents in the context of family system functioning. Health Psychol. Rep. 2019, 7, 213–228. [Google Scholar] [CrossRef]
- Lindblad, I.; Svensson, L.; Landgren, M.; Nasic, S.; Tideman, E.; Gillberg, C.; Fernell, E. Mild intellectual disability and ADHD; a comparative study of school age children’s adaptive abilities. Acta Paediatr. 2013, 102, 1027–1031. [Google Scholar] [CrossRef] [PubMed]
- Begega, A.; Méndez-López, M.; de Iscar, M.J.; Cuesta-Izquierdo, M.; Solís, G.; Fernández-Colomer, B.; Álvarez, L.; Méndez, M.; Arias, J.L. Assessment of the global intelligence and selective cognitive capacities in preterm 8-year-old children. Evaluación De La Intel. Y Capacid. Cogn. Específicas En Niños Prematuros De 8 Años De Edad 2010, 22, 648–653. [Google Scholar]
- Fletcher, K.L.; Blair, C.; Scott, M.S.; Bolger, K.E. Specific Patterns of Cognitive Abilities in Young Children with Mild Mental Retardation. Educ. Train. Dev. Disabil. 2004, 39, 270–278. [Google Scholar]
- Van der Molen, M.J.; Van Luit, J.E.; Van der Molen, M.W.; Jongmans, M.J. Everyday memory and working memory in adolescents with mild intellectual disability. Am. J. Intellect. Dev. Disabil. 2010, 115, 207–217. [Google Scholar] [CrossRef] [PubMed]
- Fletcher, K.L.; Huffman, L.F.; Bray, N.W.; Grupe, L.A. The Use of the Microgenetic Method with Children with Disabilities: Discovering Competence. Early Educ. Dev. 1998, 9, 357–373. [Google Scholar] [CrossRef]
- Van der Molen, M.J.; Van Luit, J.E.H.; Jongmans, M.J.; Van der Molen, M.W. Memory Profiles in Children with Mild Intellectual Disabilities: Strengths and Weaknesses. Res. Dev. Disabil. A Multidiscip. J. 2009, 30, 1237–1247. [Google Scholar] [CrossRef]
- Backer van Ommeren, T.; Koot, H.M.; Begeer, S. Reciprocity in autistic and typically developing children and adolescents with and without mild intellectual disabilities. J. Intellect. Disabil. Res. 2017, 61, 810–817. [Google Scholar] [CrossRef]
- Van der Molen, M.J.; Henry, L.A.; Van Luit, J.E. Working memory development in children with mild to borderline intellectual disabilities. J. Intellect. Disabil. Res. 2014, 58, 637–650. [Google Scholar] [CrossRef]
- Copet, P.; Jauregi, J.; Laurier, V.; Ehlinger, V.; Arnaud, C.; Cobo, A.M.; Molinas, C.; Tauber, M.; Thuilleaux, D. Cognitive profile in a large french cohort of adults with Prader–Willi syndrome: Differences between genotypes. J. Intellect. Disabil. Res. 2010, 54, 204–215. [Google Scholar] [CrossRef]
- Jankowska, A.M.; Bogdanowicz, M.; Takagi, A. Stability of WISC-R scores in students with borderline intellectual functioning. Health Psychol. Rep. 2014, 2, 49–59. [Google Scholar] [CrossRef] [Green Version]
- Jankowska, A.M.; Łockiewicz, M.; Łada-Maśko, A.B. Heterogeneity of cognitive profiles in students with borderline intellectual functioning. Psychiatr. Pol. 2021, 55, 869–885. [Google Scholar] [CrossRef] [PubMed]
- Taupiac, E.; Lacombe, D.; Thiébaut, E.; Van-Gils, J.; Michel, G.; Fergelot, P.; Adrien, J.-L. Psychomotor, cognitive, and socio-emotional developmental profiles of children with Rubinstein-Taybi Syndrome and a severe intellectual disability. J. Intellect. Dev. Disabil. 2021, 46, 80–89. [Google Scholar] [CrossRef]
- Márquez-Caraveo, M.E.; Rodríguez-Valentín, R.; Pérez-Barrón, V.; Vázquez-Salas, R.A.; Sánchez-Ferrer, J.C.; De Castro, F.; Allen-Leigh, B.; Lazcano-Ponce, E. Children and adolescents with neurodevelopmental disorders show cognitive heterogeneity and require a person-centered approach. Sci. Rep. 2021, 11, 18463. [Google Scholar] [CrossRef]
- Schalke, D.; Brunner, M.; Geiser, C.; Preckel, F.; Keller, U.; Spengler, M.; Martin, R. Stability and change in intelligence from age 12 to age 52: Results from the Luxembourg MAGRIP study. Dev. Psychol. 2013, 49, 1529–1543. [Google Scholar] [CrossRef] [PubMed]
- Roid, G.H.; Sajewicz-Radtke, U.; Radtke, B.M.; Lipowska, M. Skala Inteligencji Stanford-Binet, Edycja Piąta [Stanford-Binet Intelligence Scales, Fifth Edition]; Pracownia Testów Psychologicznych i Pedagogicznych [Laboratory of Psychological and Pedagogical Tests]: Gdańsk, Poland, 2017. [Google Scholar]
- Flanagan, D.P.; Dixon, S.G. The Cattell-Horn-Carroll Theory of Cognitive Abilities. In Encyclopedia of Special Education; Reynolds, C.R., Vannest, K.J., Fletcher-Janzen, E., Eds.; John Wiley & Sons: Hoboken, NJ, USA, 2014. [Google Scholar]
- Roid, G.H.; Jurek, P.; Olech, M.; Sajewicz-Radtke, U.; Radtke, B.M. Skale Inteligencji Stanford-Binet, Edycja Piąta. Podręcznik Techniczny [Stanford-Binet Intelligence Scales, Fifth Edition. Technical Manual]; Pracownia Testów Psychologicznych i Pedagogicznych [Psychological and Pedagogical Testing Laboratory]: Gdańsk, Poland, 2017. [Google Scholar]
- Roid, G.H.; Sajewicz-Radtke, U.; Radtke, B.M.; Jurek, P. Podręcznik interpretacyjny. Przewodnik po zaawansowanej interpretacji wyników SB5 [Interpretive Manual. Expanded Guide to the Interpretation of SB5 Test Results]; Pracownia Testów Psychologicznych i Pedagogicznych [Psychological and Pedagogical Testing Laboratory]: Gdańsk, Poland, 2018. [Google Scholar]
- Roid, G.H. Stanford-Binet Intelligence Scales, Fifth Edition; Riverside Publishing: Itasca, IL, USA, 2003. [Google Scholar]
- Charrad, M.; Ghazzali, N.; Boiteau, V.; Niknafs, A. NbClust: An R Package for Determining the Relevant Number of Clusters in a Data Set. J. Stat. Softw. 2014, 61, 1–36. [Google Scholar] [CrossRef] [Green Version]
- Team, R.C.D. R: A Language and Environment for Statistical Computing. Available online: http://www.r-project.org/ (accessed on 15 February 2022).
- Cattell, R.B.; Feingold, S.N.; Sarason, S.B. A culture-free intelligence test: II. Evaluation of cultural influence on test performance. J. Educ. Psychol. 1941, 32, 81–100. [Google Scholar] [CrossRef]
- Cattell, R.B. Theory of fluid and crystallized intelligence: A critical experiment. J. Educ. Psychol. 1963, 54, 1–22. [Google Scholar] [CrossRef]
- Luwel, K.; Foustana, A.; Onghena, P.; Verschaffel, L. The Role of Verbal and Performance Intelligence in Children’s Strategy Selection and Execution. Learn. Individ. Differ. 2013, 24, 134–138. [Google Scholar] [CrossRef]
- Roid, G.H.B.R.A. Essentials of Stanford-Binet Intelligence Scales (SB5) Assessment; Wiley: Hoboken, NJ, USA, 2004. [Google Scholar]
- Cattell, R.B. Abilities: Their Structure, Growth and Action; Houghton Mifflin Harcourt: Boston, MA, USA, 1971. [Google Scholar]
- Kamphaus, R.W. Clinical Assessment of Child and Adolescent Intelligence, 2nd ed.; Allyn & Bacon: Boston, MA, USA, 2001. [Google Scholar]
- Makharia, A.; Nagarajan, A.; Mishra, A.; Peddisetty, S.; Chahal, D.; Singh, Y. Effect of environmental factors on intelligence quotient of children. Ind. Psychiatry J. 2016, 25, 189–194. [Google Scholar] [CrossRef]
- Murtaza, S.F.; Gan, W.Y.; Sulaiman, N.; Mohd Shariff, Z.; Ismail, S.I.F. Sociodemographic, nutritional, and environmental factors are associated with cognitive performance among Orang Asli children in Malaysia. PLoS ONE 2019, 14, e0219841. [Google Scholar] [CrossRef] [Green Version]
- Woo Hyun, K.; Tae Won, P.; Juhyun, P.; Sang-Keun, C.; Jong-Chul, Y.; Jong-Il, P.; Eun-Ji, K.; Eun-Cheong, C.; Jae Cheol, P. Comparing Intelligence Test Profiles to Assess Tourette’s Disorder with Attention-Deficit Hyperactivity Disorder. J. Korean Acad. Child Adolesc. Psychiatry 2017, 28, 25–30. [Google Scholar]

| Variable | Age Group | ||
|---|---|---|---|
| G1 (7;00–9;11) | G2 (10;00–14;11) | G3 (15;00–18;11) | |
| Gender | |||
| Male | 3788 | 4232 | 1837 |
| Female | 2224 | 2796 | 1339 |
| Missing data | 80 | 81 | 34 |
| Place of residence | |||
| Rural | 2149 | 2527 | 1075 |
| Urban | 3698 | 4322 | 2033 |
| Missing data | 245 | 260 | 102 |
| Previous diagnosis | |||
| ADHD | 28 | 30 | 6 |
| Attention deficit disorder (ADD) | 14 | 12 | – |
| Speech impairment or SLI | 82 | 37 | 11 |
| Intellectual disability | 611 | 1387 | 1068 |
| Lower than average intelligence | 748 | 1119 | 226 |
| Neurological condition | 32 | 42 | 19 |
| Craniocerebral injury | 2 | 6 | 2 |
| Other | 318 | 340 | 78 |
| No diagnosis | 4257 | 4136 | 1800 |
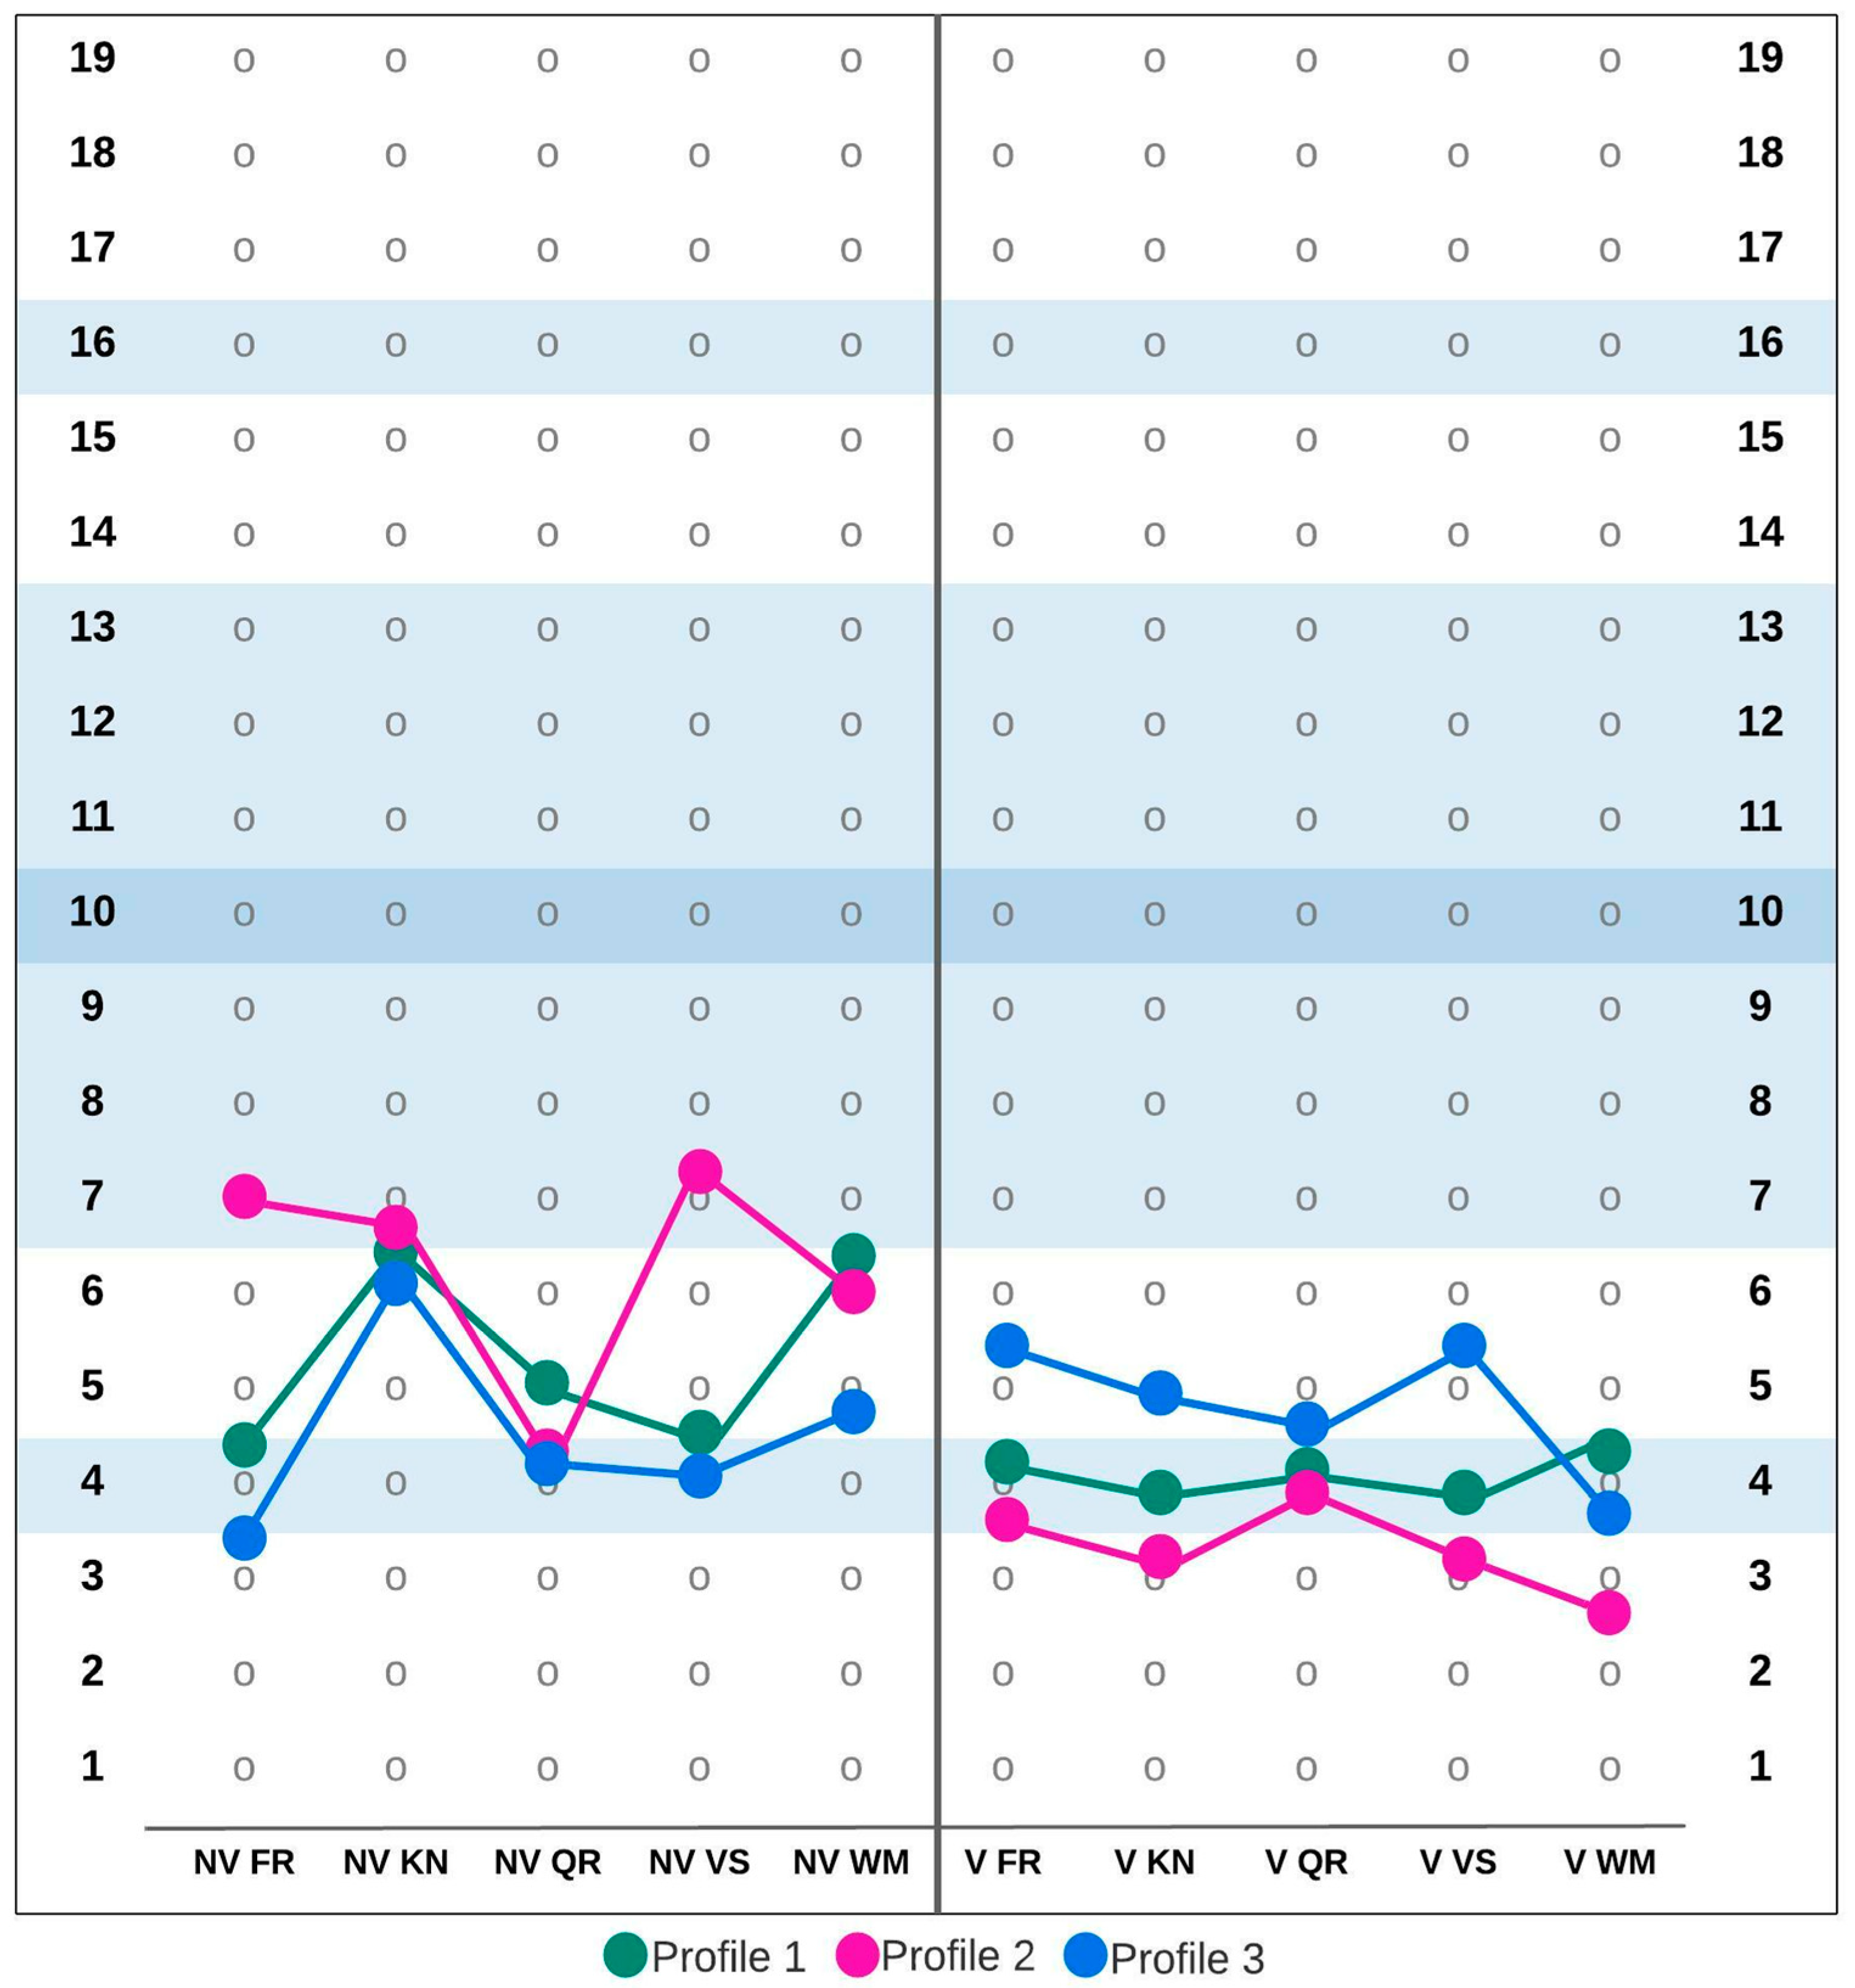
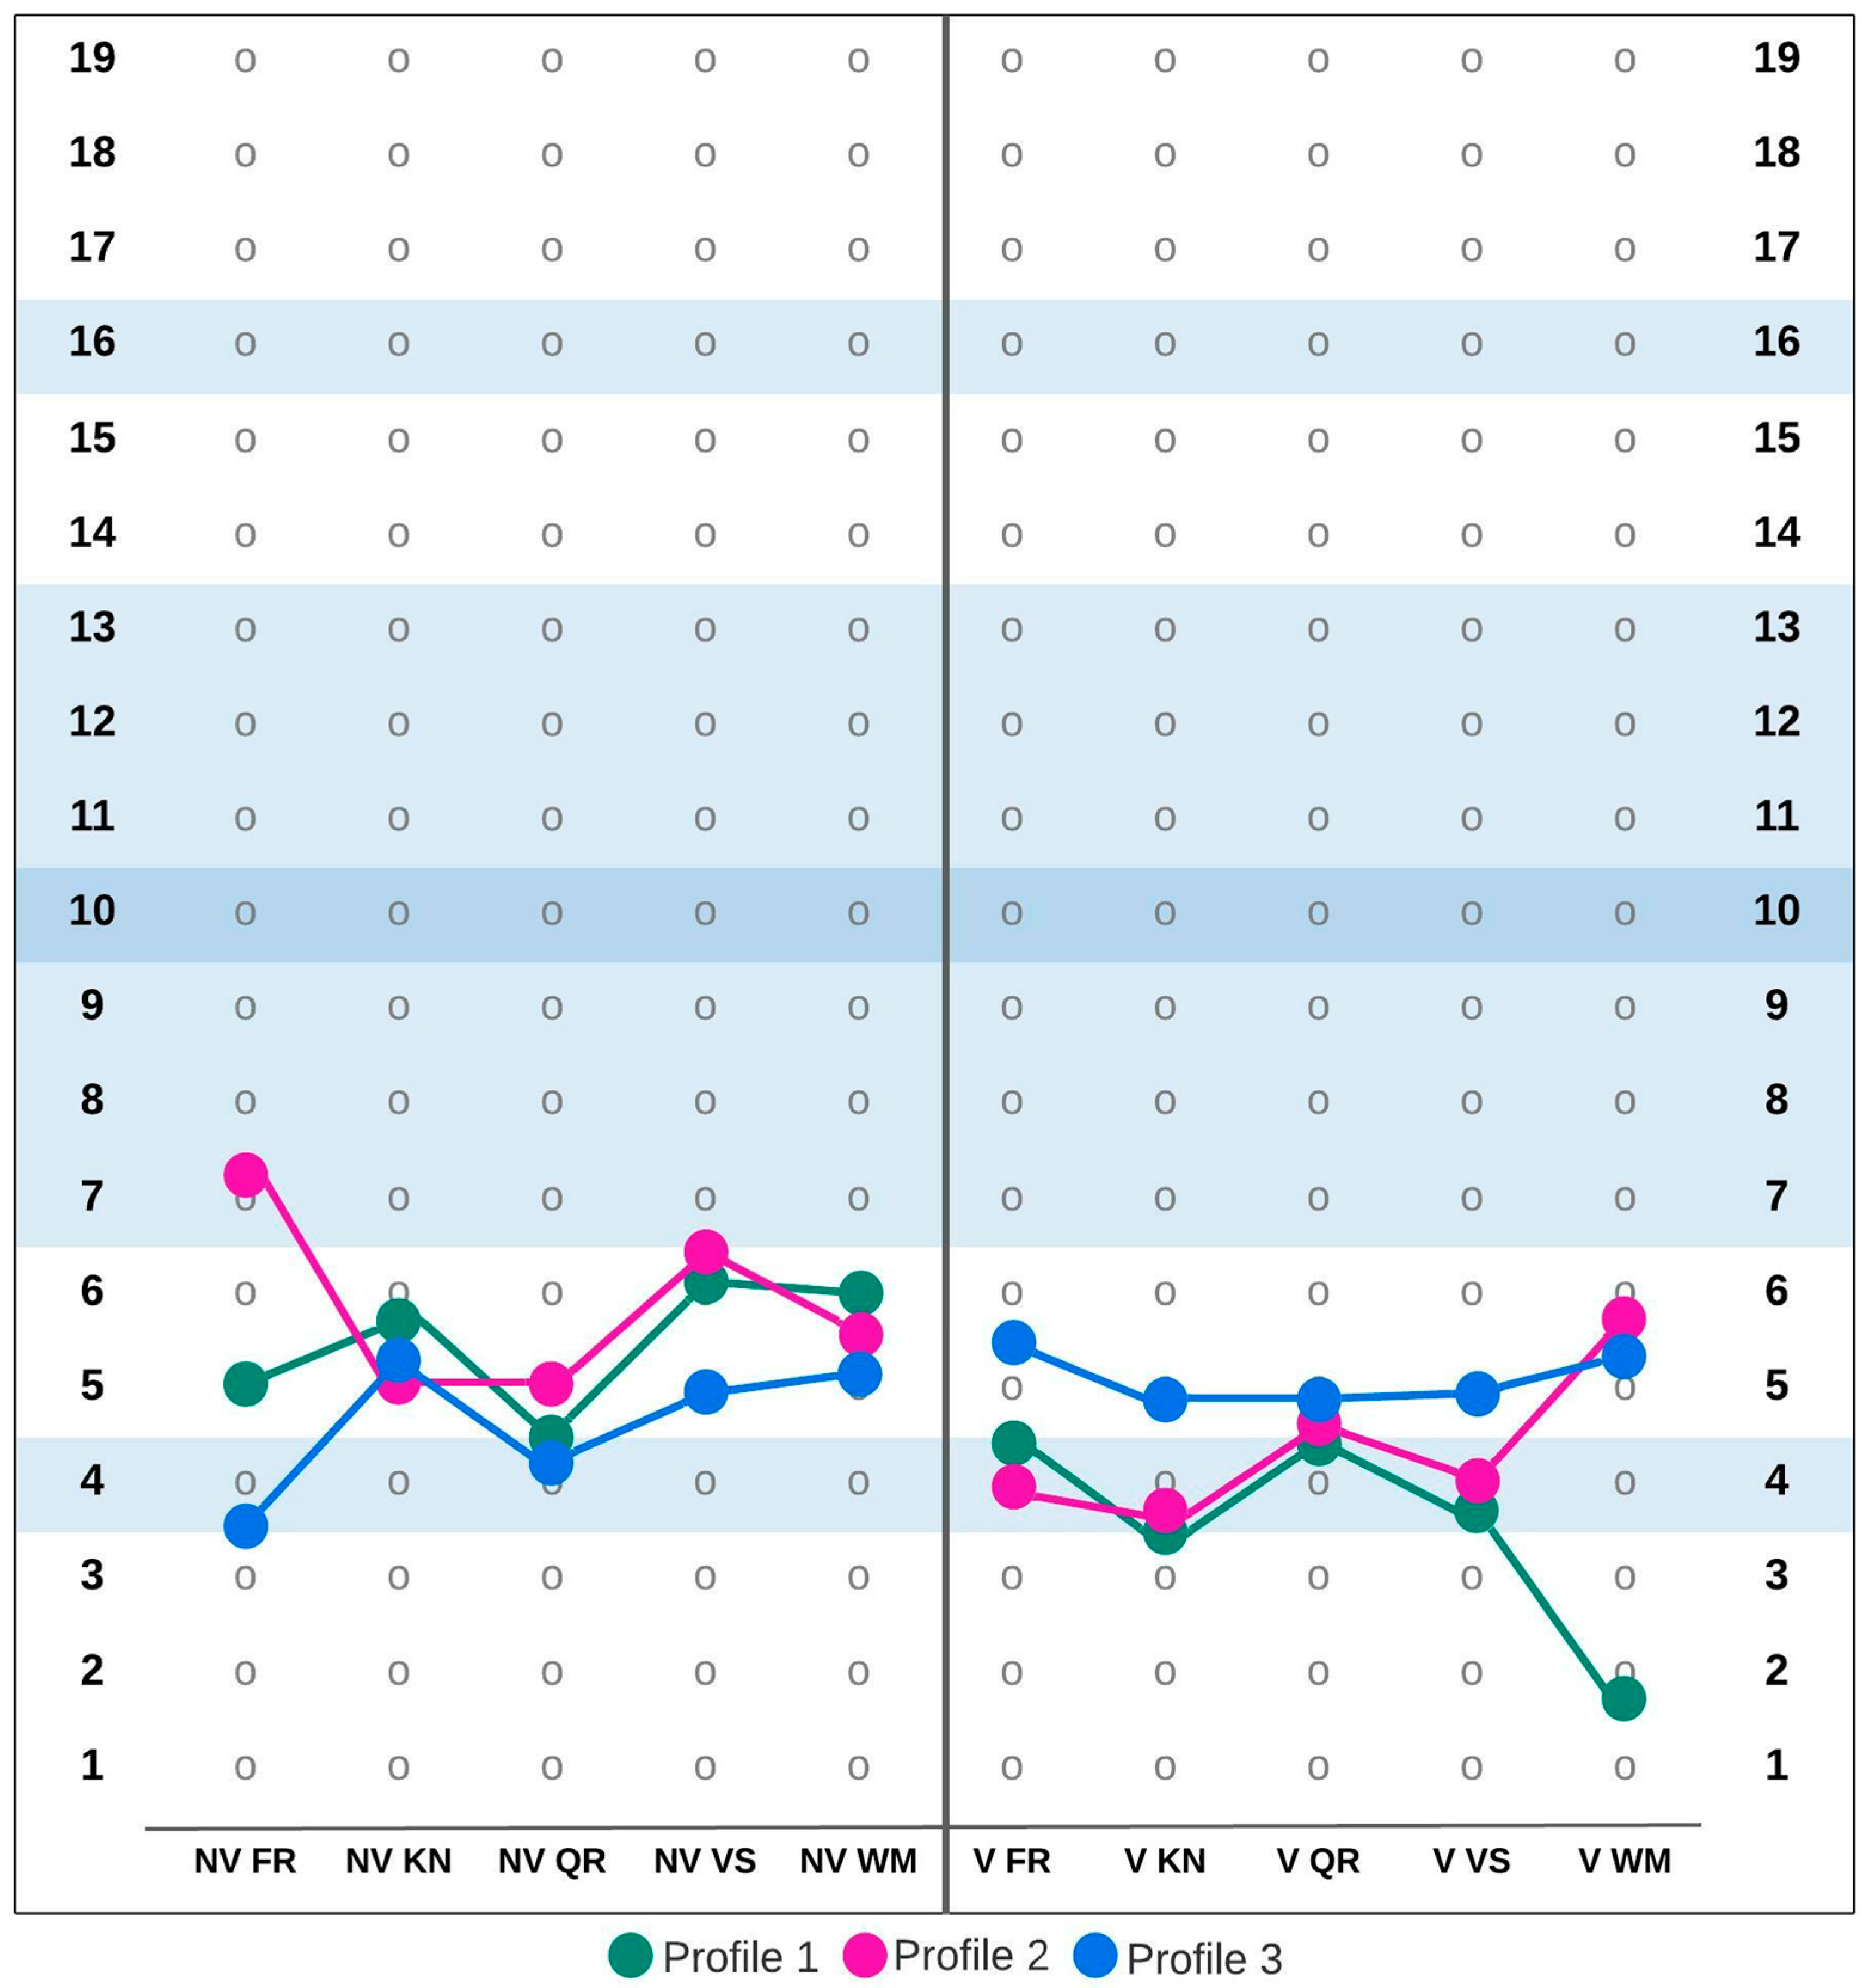
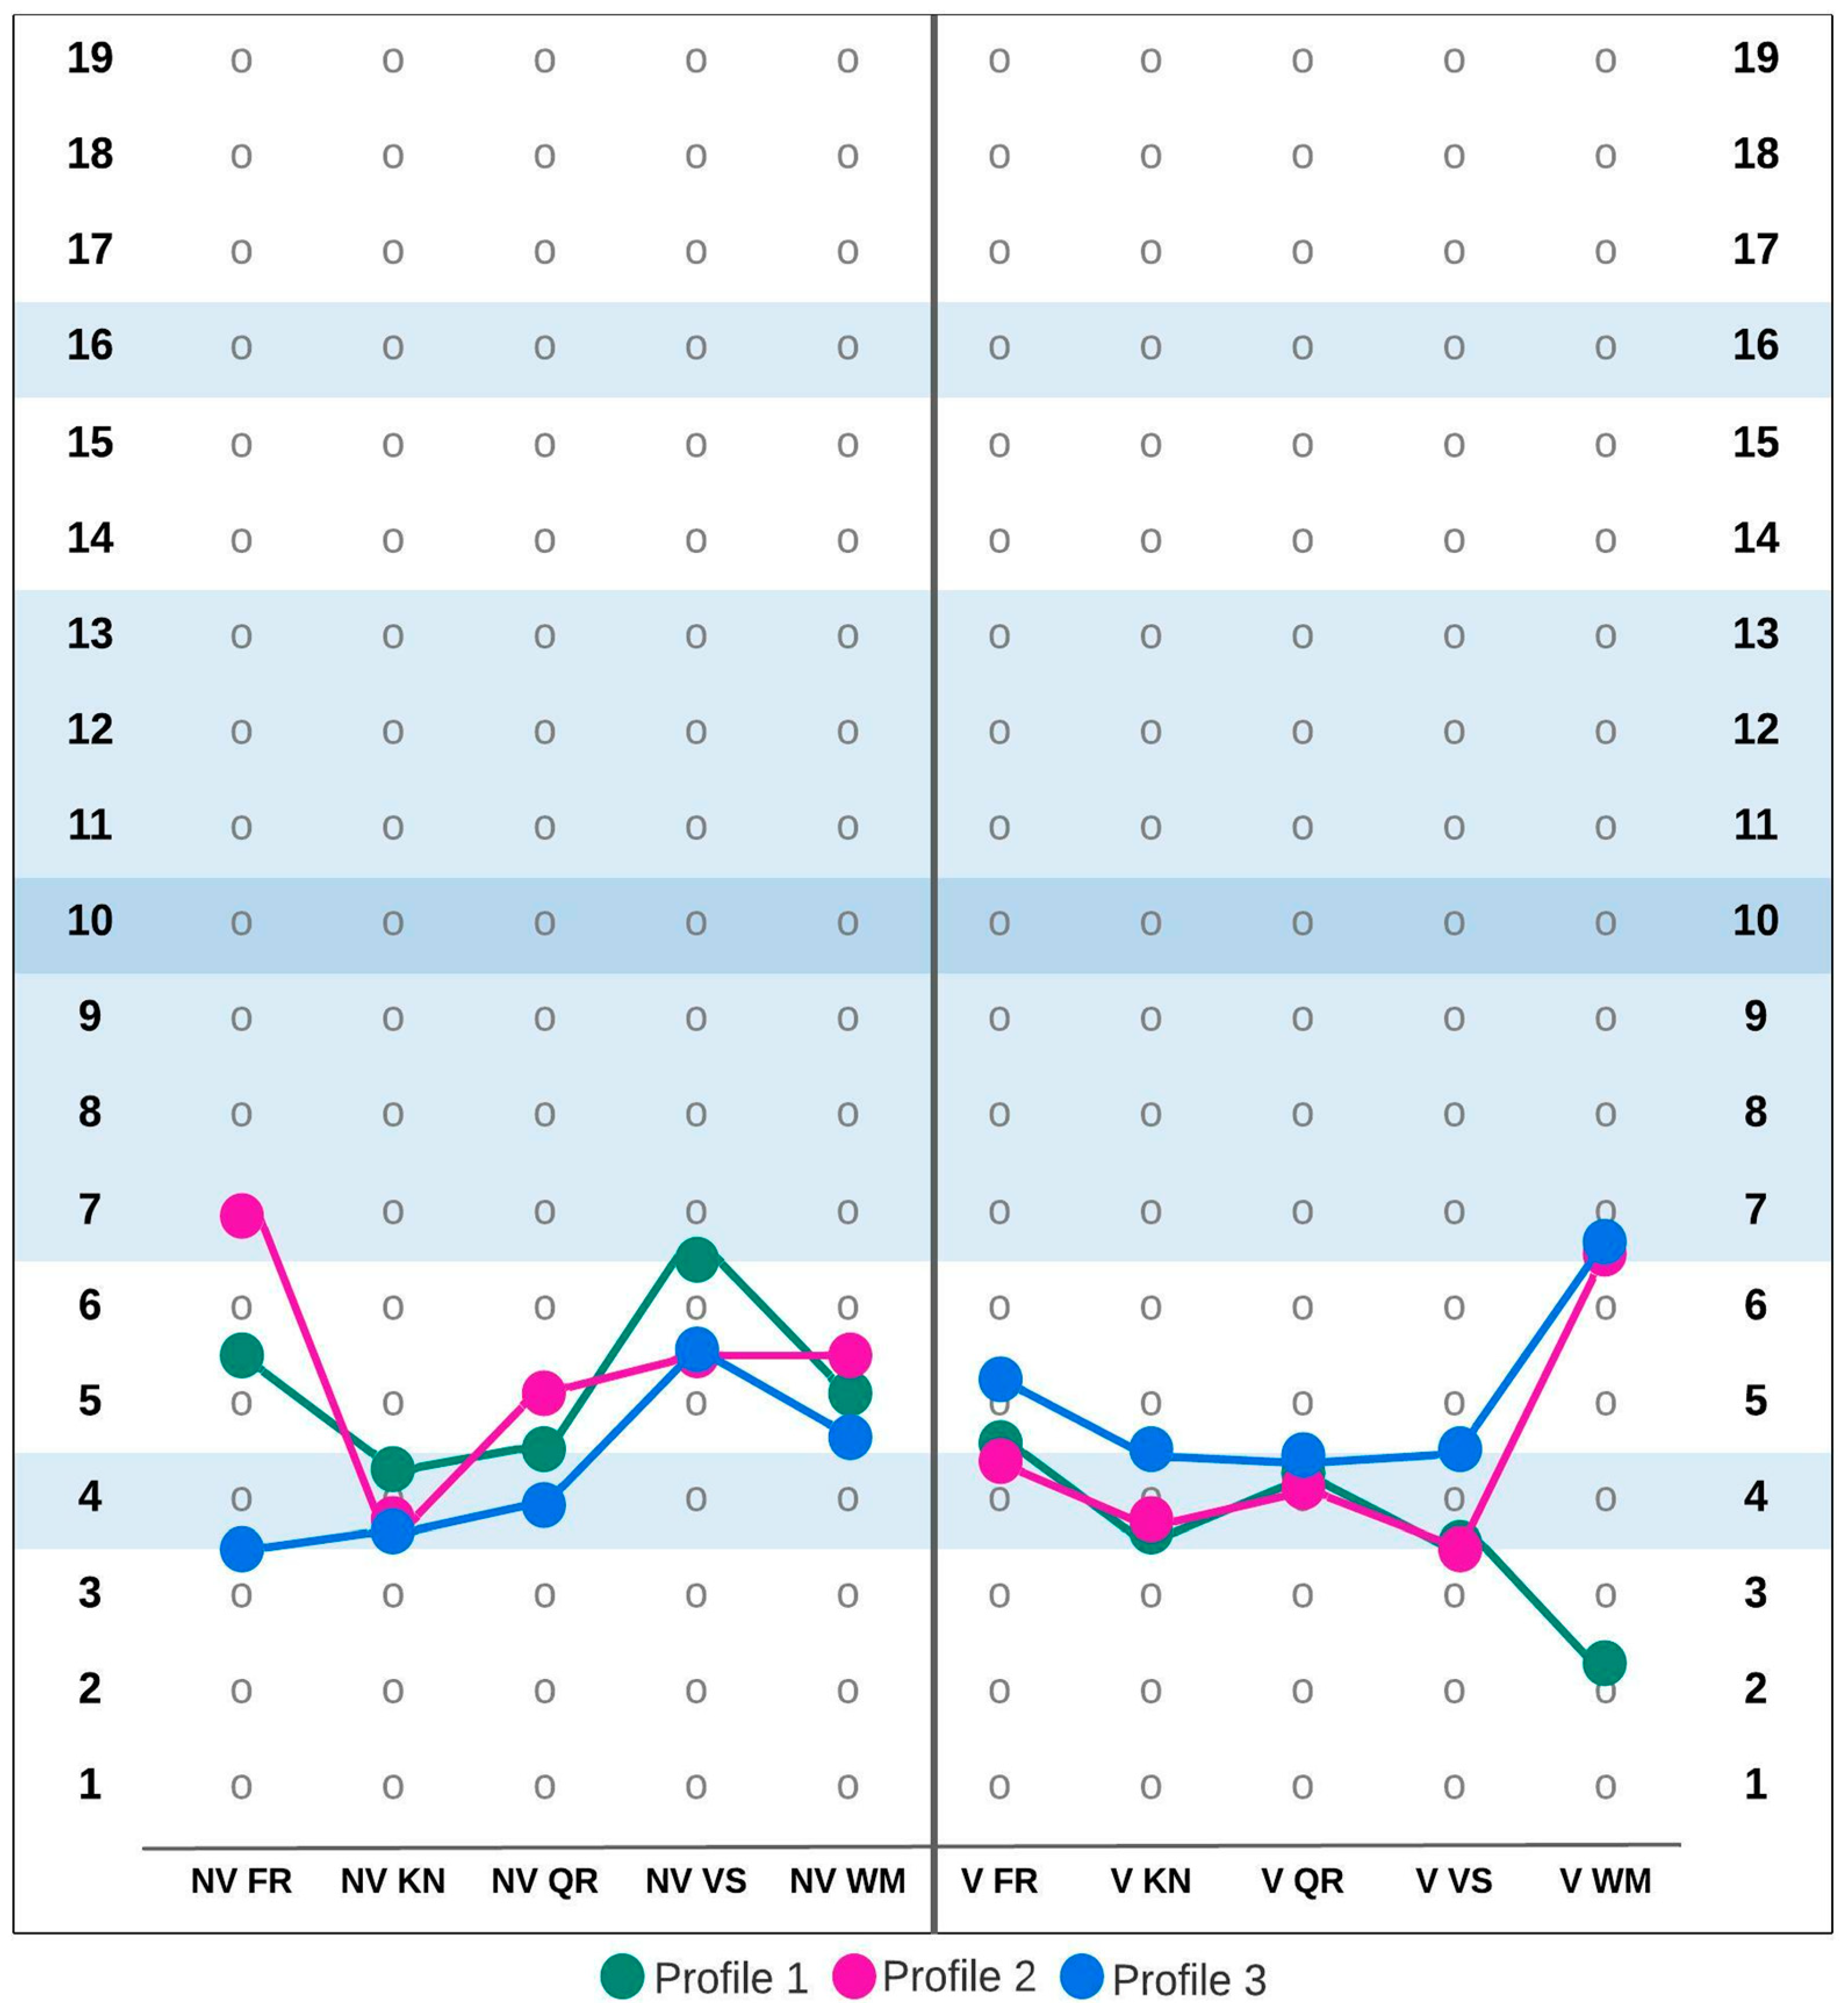
| G1 (7;00–9;11) | F | G2 (10;00–14;11) | F | G3 (15;00–18;11) | F | |||||||
|---|---|---|---|---|---|---|---|---|---|---|---|---|
| Subtest | P1 | P2 | P3 | P1 | P2 | P3 | P1 | P2 | P3 | |||
| Nonverbal Fluid Reasoning | 4.35 | 6.96 | 3.87 | 29.90 ** | 5.04 | 7.20 | 3.53 | 651.97 ** | 5.48 | 6.92 | 3.45 | 1649.21 ** |
| Nonverbal Knowledge | 6.49 | 6.76 | 6.13 | 35.08 ** | 5.73 | 5.07 | 5.31 | 181.72 ** | 4.21 | 3.87 | 3.79 | 0.82 |
| Nonverbal Quantitative Reasoning | 4.94 | 4.43 | 4.37 | 102.71 ** | 4.51 | 5.02 | 4.22 | 72.02 ** | 4.53 | 5.13 | 4.06 | 179.20 ** |
| Nonverbal Visual-Spatial Processing | 4.61 | 7.25 | 4.15 | 27.36 ** | 6.15 | 6.40 | 4.91 | 5.56 * | 6.51 | 5.61 | 5.65 | 0.46 |
| Nonverbal Working Memory | 6.37 | 6.01 | 4.79 | 627.74 ** | 6.01 | 5.64 | 5.33 | 56.62 ** | 5.03 | 5.43 | 4.72 | 11.67 ** |
| Verbal Fluid Reasoning | 4.21 | 3.83 | 5.43 | 351.89 ** | 4.41 | 4.01 | 5.51 | 23.21 ** | 4.68 | 4.30 | 5.26 | 141.40 ** |
| Verbal Knowledge | 4.06 | 3.28 | 4.91 | 173.66 ** | 3.47 | 3.67 | 4.91 | 21.95 ** | 3.89 | 3.93 | 4.65 | 94.37 ** |
| Verbal Quantitative Reasoning | 4.18 | 3.90 | 4.67 | 50.46 ** | 4.26 | 4.65 | 4.92 | 66.29 ** | 4.23 | 4.15 | 4.46 | 30.14 ** |
| Verbal Visual-Spatial Processing | 4.06 | 3.23 | 5.44 | 402.60 ** | 3.86 | 4.02 | 5.04 | 14.25 ** | 3.68 | 3.56 | 4.64 | 235.93 ** |
| Verbal Working Memory | 4.30 | 2.75 | 3.82 | 63.55 ** | 1.81 | 5.79 | 5.29 | 3230.42 ** | 2.24 | 6.55 | 6.74 | 52.51 ** |
Publisher’s Note: MDPI stays neutral with regard to jurisdictional claims in published maps and institutional affiliations. |
© 2022 by the authors. Licensee MDPI, Basel, Switzerland. This article is an open access article distributed under the terms and conditions of the Creative Commons Attribution (CC BY) license (https://creativecommons.org/licenses/by/4.0/).
Share and Cite
Sajewicz-Radtke, U.; Jurek, P.; Olech, M.; Łada-Maśko, A.B.; Jankowska, A.M.; Radtke, B.M. Heterogeneity of Cognitive Profiles in Children and Adolescents with Mild Intellectual Disability (MID). Int. J. Environ. Res. Public Health 2022, 19, 7230. https://doi.org/10.3390/ijerph19127230
Sajewicz-Radtke U, Jurek P, Olech M, Łada-Maśko AB, Jankowska AM, Radtke BM. Heterogeneity of Cognitive Profiles in Children and Adolescents with Mild Intellectual Disability (MID). International Journal of Environmental Research and Public Health. 2022; 19(12):7230. https://doi.org/10.3390/ijerph19127230
Chicago/Turabian StyleSajewicz-Radtke, Urszula, Paweł Jurek, Michał Olech, Ariadna B. Łada-Maśko, Anna M. Jankowska, and Bartosz M. Radtke. 2022. "Heterogeneity of Cognitive Profiles in Children and Adolescents with Mild Intellectual Disability (MID)" International Journal of Environmental Research and Public Health 19, no. 12: 7230. https://doi.org/10.3390/ijerph19127230
APA StyleSajewicz-Radtke, U., Jurek, P., Olech, M., Łada-Maśko, A. B., Jankowska, A. M., & Radtke, B. M. (2022). Heterogeneity of Cognitive Profiles in Children and Adolescents with Mild Intellectual Disability (MID). International Journal of Environmental Research and Public Health, 19(12), 7230. https://doi.org/10.3390/ijerph19127230