Article

Analyzing the Asymmetric Effect of Renewable Energy Consumption on Environment in STIRPAT-Kaya-EKC Framework: A NARDL Approach for China

1
Jiangsu Vocational Institute of Commerce, Nanjing 211168, China
2
Department of Economics, National University of Modern Languages (NUML), Islamabad 44000, Pakistan
3
China Institute of Development Strategy and Planning, Wuhan University, Wuhan 430072, China
4
Institute for Region and Urban-Rural Development, Wuhan University, Wuhan 430072, China
5
School of Economics, Quaid-e-Azam University, Islamabad 44000, Pakistan
*
Author to whom correspondence should be addressed.
Int. J. Environ. Res. Public Health 2022, 19(12), 7100; https://doi.org/10.3390/ijerph19127100
Submission received: 29 April 2022 / Revised: 5 June 2022 / Accepted: 7 June 2022 / Published: 9 June 2022
(This article belongs to the Special Issue Ecosystem Quality and Stability)

Abstract

:
This study aims to analyze the asymmetric relation between renewable energy consumption and CO2 emissions in China using the STIRPAT-Kaya-EKC framework. To delve into the asymmetric effect of renewable energy consumption on the environment, the non-linear ARDL model is used. The results of this study confirm the asymmetric impact of renewable energy on the environment in the long run as well as in the short run. However, the negative shocks to renewable energy have a greater detrimental influence on the environment than the benign effect due to the positive shock to renewable energy. Population growth affects the environment in the short run, whereas technology only affects environment quality in the long run. Moreover, the study supports the EKC theory in China. This research emphasizes that the administration can improve the economy’s lifespan by allocating substantial funds to establish legislation to maintain a clean environment by subsidizing renewable energy infrastructure and research and innovations for low-carbon projects.

1. Introduction

Economic progress is imperative for every country to bring ease to the lives of the people living within the country’s boundaries. However, increased economic activities and industrialization come along with the greater risk of environmental degradation as it may cause land, air, and water pollution. Air pollution is the most dangerous among pollution types. It spreads to a large area and needs to be cared for with proper regulation with the inclusion of chronological research evidence. The industrial sector of any developed country depends largely on fossil fuels for their energy needs, causing CO2 emissions that lead to environmental degradation, bringing different ecological and health problems for living beings. At the same time, the other disadvantages related to it are energy issues triggered by variations in oil prices, global warming, and acid rain. To achieve sustainable growth and development, many countries are making efforts to replace non-renewable energy sources with renewable ones mainly to deal with the problem of environmental degradation. Among the 17 SDGs, climate change and green growth are some of the most challenging tasks for policymakers in both developed and developing countries to achieve, as it needs reforms at a broader level [1]. However, in recent years, investment in renewable energy showed a scintillating rise over the years. According to a new estimate from Energy Transition Investment Trends 2022 published by Bloomberg NEF (BNEF), the total global investment in renewable energy hit $755 billion in 2021, showing an increase of 27% compared to the figures of 2020, within which renewable energy projects, for example, solar parks and wind farms, received the most investment in 2021, making a total investment of $366 billion. It is also observed that countries are trying to bring about a transition from fuel-based cars to electric cars. As per the International Energy Agency (IEA), worldwide electric car revenue has increased by 140% in the first quarter of 2021 as compared to 2020. China topped the ladder in the energy transition by selling electric cars, followed by Europe, whereas sales in the United States doubled. Electric car investment and renewable energy industries have driven up the global investment pattern toward low-carbon energy.
China, the world’s 3rd largest country in standings of land area with the largest population in the world, has emerged as an economic giant in recent years. Increased oil consumption is directly related to China’s sustained economic growth. China is using around 13% of the world’s oil per day, which is the second-largest consumption in the world after America. It is evident from the IEA 2021 that China is responsible for 33% of the CO2 emissions in the world, the most among any country, with 11.9 billion tonnes of CO2 emitted in 2021, which makes it challenging to achieve the targets of energy security, low-carbon atmosphere, and environmental preservation, all being hampered because of continued high economic expansion. To deal with these consequences, a comprehensive plan for environmental sustainability is required [2].
Although the Renewable Energy Law was passed in China in 2006 to promote the consumption and production of renewable energy, the Chinese economy has accounted for 44% of world oil demand growth since 2015. Excess capacity in oil refineries has made China among the world’s biggest net exporters of refined commodities. Another reason for China’s increase in demand for crude oil is that China’s oil demand is shifting its weight from industry to consumer-driven. On the other hand, the increase in domestic air transportation has boosted kerosene demand dramatically [3]. However, China’s yearly crude oil imports have declined by 5.4% in 2021, for the first time since 2001, after Beijing enforced refinery industry regulations to prevent excess local fuel generation. While on the other hand, analysts also credit the decrease in crude oil imports and decreased energy reliance to effective engagement by domestic energy companies in domestic oil field exploration and utilization in recent years, which has improved domestic energy independence. In 2021, China boosted its total energy shift spending by 60% from 2020, substantially solidifying its global leadership position in investment in the energy transition. Even if China is slowing down growth in oil demand, the baseline figures are now huge enough that even a slower yearly percentage rate of growth can still result in a considerable yearly absolute rise in oil demand volume.
Thus, keeping in view, the struggle of the Chinese economy is making energy transitions yet remains the top CO2 emitter in the world. At the same time, negotiation with increasing economic growth is also not easy. However, renewable energy consumption is continuously growing in China and will be an interesting factor in evaluating its long-term environmental sustainability influences. On the other hand, according to Eyuboglu and Uzar [4], a negative shock to the economy has a detrimental impact on renewable energy generation. Regarding this, the study attempts to evaluate the asymmetric impact of renewable energy consumption in China in the STIRPAT-Kaya-EKC framework. The findings of this study will help academicians and policymakers understand how renewable energy consumption affects the environment asymmetrically. Examining the data individually for positive and negative shocks to renewable energy consumption will help the policymakers develop more precise tactics when deciding on energy policy in China. Nevertheless, figures for carbon dioxide emissions, renewable energy consumption, and economic growth are incorporated in Figure 1, Figure 2 and Figure 3, which indicate the continuous increase in CO2 emissions, economic growth, and renewable energy consumption in China. However, it has been seen that there is much increase in CO2 secretions, economic growth, and renewable energy after the year 2000 in China. However, renewable energy is found to be more profound in its consumption in China after 2010. So, it will be noticeable to examine the long-run influences of economic growth, its desired level of growth, and renewable energy on CO2 emission in China. It will also be an interesting context to measure these factors’ positive and negative shocks on carbon emissions. Moreover, the current study’s findings are significant to the environmentalist in making policies that would help reduce CO2 emissions in China.
The rest of the paper is as follows: Section 2 and Section 3 include a literature review with the statement of the research gap and a theoretical and econometric model with the discussion of methodology, data, and sources. Section 4 discusses and interprets results, and research is concluded in Section 5 with policy recommendations.
This study significantly validates the STIRPAT-Kaya-EKC framework by analyzing the asymmetric relation between renewable energy consumption and CO2 emissions in China. The significant and negative impact of GDP squared on CO2 emissions confirms the inverted U shape of the EKC hypothesis in China. Furthermore, renewable energy’s positive shock helps to mitigate environmental degradation in China.

2. Literature Review

Economic growth and environmental degradation are being discussed widely across the research community. The increasing pollution, including emissions of reactive nitrogen, methane CO2, and ozone precursors caused by economic expansion and population growth, drew researchers and policymakers’ attention toward green growth. However, high levels of growth and economic development bring prosperity and enable the economy to focus on environmental objectives. In the early 1970s, researchers identified GDP and population as key factors of environmental quality. The idea of Environmental Impact–Population–Affluence–Technology (hereinafter IPAT) was introduced by Ehrlich and Holdren [5] in 1971. Later on, many studies used the concept of IPAT to explain environmental degradation [6,7,8,9,10,11,12].
Focusing on GDP as a contributor to environmental degradation, the theory of Environment–Kuznets–Curve (hereinafter EKC) explains that contamination intensifies during the preliminary stages of economic expansion until it hits a tipping point where pollution decreases as income per capita rises [13]. While examining CKC (carbon Kuznets curve) and its long-term relationship, Pao and Chen [14] found that the ingesting of fossils plays its part expressively in the deterioration of the environment. However, the use of renewables improves the eminence of the environment by reducing carbon emissions. Since energy conservation policies may impede economic growth, a higher proportion of clean energy is required for long-term sustainability. Because numerous technological advancements in several economic sectors are necessary for the early stages of economic expansion, a high degree of pollution is unavoidable. For the period 1980–2012, Zoundi [15] explored the link in accordance with CO2 emissions and renewable energy consumption (hereinafter REC) in 25 African nations and found a negative association between REC and carbon emissions. Naz et al. [16] inspected the association amongst GDP and CO2 emissions in Pakistan and identified a positive correlation between GDP and environmental degradation, thus rejecting the inverted U-shaped EKC hypothesis while arguing that REC considerably reduces CO2 releases. Nevertheless, the empirical findings of Hu et al. [17] revealed the EKC hypothesis and indicate that growing the proportion of renewable energy consumption adds value to carbon reduction; that is, raising the amount of renewable energy consumption results in decarbonization. Working on the same line, Sarkodie et al. [18], in their study, found that CO2 emissions and environmental degradation are reduced when production and renewable energy and income levels rise at the same time, while they argue that in both carbon emanations and degradation functions, the EKC hypothesis is supported. Bölük and Mert [19] further examined the EKC hypothesis in EU countries during the years 1990–2008 in terms of the relation between carbon emissions, GDP, and energy intake. They concluded that the European Union economies do not have an inverted U shape of EKC and also determined that energy derived from renewable sources reduces emissions of CO2 by 50% compared to energy derived from traditional sources.
In attempts to find the solution to protect the environment, many researchers explored the influence of energy use and energy transition on environmental deprivation in different regions of the world. Energy generated through fossil fuels and investment activities and development positively influence contamination levels in the environment. By employing cointegration analysis, Hasnisah et al. [20] exposed that renewable forms of energy negligibly influenced carbon secretions in thirteen Asian emerging nations. However, the study also explained that the rising ingestion of non-renewables and faster economic development offset the advantage of renewables. The study suggests that by better understanding the various variables impacting CO2 emissions, the nations may build a strategic strategy to slow environmental deterioration. In a similar vein, Nathaniel and Iheonu [21] explored the one-way causation between renewable and non-renewable energy forms and carbon secretions in Africa. Based on empirical estimations, they conclude that REC lowers carbon emissions while non-REC contributes to CO2 emissions. Lin and Moubarak [22] and Dong et al. [23] investigated the REC–growth–CO2 relationship in the case of China and found bidirectional causation running between REC and growth in the long run. However, no indication of a long-run or short-run causation involving emissions of CO2 and REC is realized.
A clean form of energy recognized as renewable energy is familiar and predictable for environmental protection. It has mostly been seen that this clean form of energy negatively influences CO2 releases and helps to ensure environmental cleanliness. Bekhet and Othman [24] argue that renewables are the most momentous factors to consider when enlightening environmental eminence. According to Payne [25], emissions of carbon dioxide had a favorable influence on the REC. Silva et al. [26] inspect the liaison flanked by REC, GDP, and carbon secretions and describe that increasing renewable energy reduces per capita carbon emanations. Moreover, Charfeddine and Kahia [27] evaluated the influence of REC on the CO2 level of the MENA region and revealed a significant impact of REC on CO2 reduction. In comparison, Nathaniel et al. [28] found that REC does not contribute to environmental quality in MENA countries. Excluding South Africa, Khattak et al. [29] observed the effectiveness of a clean form of energy use on the atmosphere in the BRICS economy, and their findings show that REC has negative and noteworthy long-term impacts on CO2, implying that CO2 emissions may be lowered by expanding renewable energy usage and forest area. Mohsin et al. [30] also established a similar result in twenty-five emerging Asian nations. Belaïd and Zrelli [31] and Sharif et al. [32] demonstrate that expanding renewables is a realistic option for tackling energy independence while also lowering carbon emissions to safeguard future generations’ environment. Hanif [33] and Acheampong et al. [34] scrutinize the impression of REC on the environment in Sub-Saharan African economies and discover that renewable energy sources promote air quality by reducing carbon emissions and reducing households’ direct exposure to toxic gases; thus, the usage of renewable aids economies in meeting their long-term development goals. Many researchers have conducted a comparative analysis of how REC affects the environment in low-income vs. high-income countries. In this vein, Nguyen and Kakinaka [35] illustrate that REC is positively related to carbon dioxide discharges in low-income economies, while the relationship is opposite for high-income nations. The empirical outcomes of Saidi and Omri [36] do not support a positive association amid economic progress and renewable energy consumption and CO2 emissions, demonstrating the validity of the neutrality hypothesis, which is explained by the uneven and inadequate utilization of renewable energy sources in the low-income countries. According to Gielen et al. [37], renewable energy can provide two-thirds of the world’s energy demand while also contributing to the reduction in greenhouse gas emissions. However, the increasing transition toward REC will help in controlling global warming [38]. Collender et al. [39] show that the risk premium on sovereign borrowing costs is lower in nations with lower carbon emissions, and advanced economies that fail to manage their climate transition may face higher sovereign borrowing rates. Lin and Zhu [40] consider CO2 emissions as an indicator of environmental change, investigate the responsiveness of renewable energy technology innovation to the intensiveness of CO2 releases in Chinese provinces, and conclude that the level of technical innovation varies significantly throughout China’s provinces, while at the same time, high CO2 emissions have boosted the amount of renewable energy technical innovation, implying that the innovation process is actively responding to climate change in China. Although there is fear that high energy prices caused by the rise of renewable energy would harm the economy, findings suggest that renewable energy use leads the economy toward sustainability [41]. On the other hand, Ali and Kirikkaleli [42] and Adebayo et al. [43] examine the asymmetric effect of renewable energy on CO2 emissions in Italy and Sweden, respectively.
Although the past studies in the literature have investigated the impact of renewable energy on environmental degradation, the proponents of energy transition argue that renewable energy is a benign form of energy. In contrast, other researchers have shown an insignificant inspiration for renewables in improving the environment. There are also studies that support the EKC theory, while others have rejected the EKC hypothesis. The literature discusses the asymmetric effects of energy consumption on the environment. However, the literature lacks providing the asymmetric effects of the environment influencing factors in the STIRPAT-Kaya-EKC framework for China. In this uncertain and unclear situation, this study utilizes the STIRPAT-Kaya-EKC framework analysis of the asymmetric effect of EKC in China.

3. Data, Model and Methodology

3.1. Theoretical Framework

According to classical economists, with increasing population density, the sustainable output cannot be maintained because the population grows geometrically while subsistence increases arithmetically. Thus, given the fixed resources, environmental degradation occurs if population growth exceeds the region’s carrying capacity. Later on, Ehrlich and Holdren [5] proposed an IPAT framework that highlighted the affluent and technology along with the population as potential drivers of environment quality. However, by upgrading the IPAT model, the existing research applies the stochastic influence through a regression on population growth, affluence, and technology (STIRPAT), which is acknowledged by Dietz and Rosa [44]. Thus, the empirical model can be written as follows:
E D t   = β 0 + β 1 P t + β 2 A t + β 3 T t + e t
where ED is environmental degradation measured by CO2 emissions, P is population growth, A is affluence proxied by per capita GDP, T is technology proxied by a number of patents, and e is the disturbance term. However, Grossman and Krueger [13] established the EKC theory that shows the link between income per capita and environmental degradation to prove an inverted U shape. Encompassing the EKC premise in Equation (1), the model takes the following form:
E D t   = β 0 + β 1 P t + β 2 G D P t + β 3 G D P t 2 + β 4 T t + e t
The model in Equation (2) is further modified by adding the Kaya identity, which considers energy use as one of the determinants of environmental degradation. Since this study intends to evaluate the asymmetric impact of renewable energy on the environment, this study considers renewable energy use as one of the determinants. Thus, the model of this study can be written as
E D t   = β 0 + β 1 P t + β 2 G D P t + β 3 G D P t 2 + β 4 T t + β 5 R E t + e t
where the RE abbreviation is considered as renewable energy. To estimate the asymmetric influence of the consumption of renewable energy on the environment, this study collects annual data for the economy of China spanning the period 1990 to 2020. To capture environmental degradation, per capita CO2 emissions are used, and population data on the total population from WDI are used. To measure affluence, data on per capita real GDP are used, and to gauge the technological level, the number of resident patent applications is obtained. Data on renewable energy consumption are obtained from WDI. All the variables in Equation (3) are transformed in the logarithmic form, which helps avoid the problem of heteroscedasticity and produces efficient estimates.

3.2. Econometric Strategy

In order to evaluate the asymmetric effect of renewable energy consumption on environmental quality, this study employs the NARDL approach introduced by Shin et al. [45]. The NARDL version of the model given in Equation (3) can be written as follows:
Δ E D t = θ 0 + i = 1 p θ 1 i Δ E D t i + i = 0 q θ 2 i Δ G D P t i + i = 0 r θ 3 i Δ G D P 2 t i + i = 0 s θ 4 i Δ P t i + i = 0 t θ 5 i Δ T t i + i = 0 u θ 6 i Δ R E t i + i = 0 u θ 7 i + Δ R E t i +   + π 1 E D t 1   + π 2 G D P t 1 + π 3 G D P t 1 2 + π 4 P t 1 + π 5 T t 1 + π 6 R E t 1 + π 7 + R E t 1 + + μ t
In Equation (4), θi are the short-run coefficients, whereas πi are the long-run coefficients. The positive and negative sign over the renewable energy variable symbolizes the asymmetric effect of renewable energy on CO2 emissions. Following the approach used by Shin et al. [45] and Allen and McAleer [46], the positive and negative attributes of renewable energy are formulated using Equations (5) and (6), respectively.
R E + = i = 1 t Δ R E i + = i = 1 t max   Δ R E i , 0
R E = i = 1 t Δ R E i = i = 1 t min   Δ R E i , 0
where (RE)+ shows the partial sum of positive changes in renewable energy and (RE) is the partial sum of negative changes in renewable energy.
To assess the presence of a long-run association between dependent and independent factors, the bound technique is applied with the null hypothesis of no long-run equilibrium relationship, that is, H0: π1 = π2 = π3 = π4 = π5 = π6 = π7 = 0. Furthermore, the short-run and long-run asymmetries are examined by means of the Wald test with the null hypothesis of H0 = θi = θi+ = θ and H0 = π = π+ = π, respectively. The long-run estimates are derived from Equation (4), assuming that the differenced variables are zero, and normalizing the equation, we obtain the following model:
ED t = δ 0 + δ 1 G D P t + δ 2 G D P t 2 + δ 3 P t + δ 4 T t + δ 5 R E t + δ 6 R E t + + e t
where δ 1 =   π 2 / π 1 , δ 2 = π 3 / π 1 , δ 3 = π 4 / π 1 , δ 4 = π 5 / π 1 , δ 5 = π 6 / π 1 , δ 6 = π 6 + / π 1 .
The short-run coefficient estimates of the independent variables are obtained using the restricted error correction method of the overhead model, which is given in Equation (4).
Δ E D t = θ 0 + i = 1 p θ 1 i Δ E D t i + i = 0 q θ 2 i Δ G D P t i + i = 0 r θ 3 i Δ G D P 2 t i + i = 0 s θ 4 i Δ P t i + i = 0 t θ 5 i Δ T t i + i = 0 u θ 6 i Δ R E t i + i = 0 u θ 7 i + Δ R E t i +   + π 1 E D t 1   + λ   ECT t 1 + μ t
where λ is the coefficient of the speed of adjustment and ECT is the error correction term obtained by the following equation.
ECT t 1 = ED t 1 δ 0 + δ 1 G D P t 1 + δ 2 G D P t 1 2 + δ 3 P t 1 + δ 4 T t 1 + δ 5 R E t 1 + δ 6 R E t 1 +
The application of the NARDL approach involves various steps. Firstly, the unit root test is applied to verify that there is no indication of spurious results which arises from variables integration at order two. Secondly, appropriate lag lengths for each of the variables are selected based on the Akaike information criterion. Thirdly, the occurrence of cointegration is examined using F-statistics, and if cointegration appears, then the asymmetric effects are calculated. Lastly, diagnostic assessments are practical to confirm the validity of the model, and QARDL is applied for a robustness check.

4. Results and Discussion

Before applying estimation techniques, the descriptive analysis of the variables in Table 1 is completed to understand the behavior of the data. It provides a picture of how data are distributed and assists with the detection of outliers and mistakes. The value of skewness shows that, except for technology, the distribution of other variables is symmetric.

4.1. Unit Root Test

In the first estimation step, this existing study employs the Augmented Dickey–Fuller and Phillips–Perron test to assess variables’ integration order. The null hypothesis of both tests states that there is a unit root against the alternative hypothesis of the stationary data set. The test statistic values are then compared with critical standards produced at significance levels 1, 5, and 10%. The unit root test results are reported in Table 2.
The results in Table 2 depict that the indicators are not stationary at levels, and all are integrated at order one. Since no variables are stationary in the second-order, we can carry on with the NARDL model.

4.2. Cointegration Analysis

To test the presence of a long run equilibrium association flanked by the variables, a NARDL bound test approach anticipated by Pesaran et al. [47] is employed. The result of the cointegration test in the NARDL framework is given in Table 3. The F statistics are equated with the critical standards produced by Narayan [48]. Narayan [48] argued that the critical standards developed by Pesaran et al. [47] are centered on large sample sizes. Therefore, they are not appropriate for small sample sizes. The bound F-test statistic is 5.573, which is greater than the critical value of the upper bound and extensive at a 5% level of significance. Thus, it is determined that there is a non-linear long-run equilibrium association between the model variables.

4.3. NARDL Model Results

After the validation of cointegration for the NARDL model, the subsequent step involves the examination of long-run and short-run asymmetries for renewable energy. The Wald test is applied to verify the asymmetry in renewable energy, and the test outcomes are stated in Table 4. Since the probability value of both short-run and long-run F-statistics in Table 4 is less than 0.05, we decline the null hypothesis of symmetric effects, which allows us to analyze the effect of negative and positive shocks to renewable energy on the carbon secretions.
The long-run and short-run evaluations of the NARDL model are given in Table 5. The short-run estimates in Panel A show that the value of negative shocks to renewable energy is significantly positive, indicating that a 1% decline in the REC affects the CO2 emissions by 1.29%. On the other hand, environmental quality improves due to positive shocks to renewable energy consumption. The coefficient value of positive shocks to renewable energy consumption is −0.506; that is, a 1% rise in the consumption of renewable energy causes CO2 emissions to reduce by 0.506%. However, rendering to the results, the negative shocks to renewable energy consumption are found to deteriorate the environment quality more than the positive effects of positive shocks to renewable energy consumption. The existing research result is in accordance with Rehman et al. [49]. According to the EKC theory, the linear term of GDP is expected to increase environmental degradation, while the quadratic term affects environmental degradation negatively. According to our outcomes, the coefficient of GDP is positive, and the square of GDP is negative, which validates the existence of EKC in the short run.
An increase in population is also found to contribute to environmental degradation as its coefficient value is positive; that is, a 1% surge in the population causes CO2 emissions to intensify by 0.722%. Many researchers have identified population size as one of the key drivers of environmental degradation and argued that populated economies are more likely to have high CO2 emissions [50,51]. The growing population results in a rise in aggregate demand, including demand for petroleum for transportation, electricity, and industrial goods [52,53]. According to the results, the number of patent applications which is used as a proxy for technology is not found to affect environmental degradation over the short run. The coefficient of ECT is −0.548, which is significant at a 5% level. The negative value of the adjustment coefficient shows that 54.8% of disequilibrium is corrected annually.
The estimates of long-run coefficients are given in Panel B of Table 5. The results show that the negative and positive shocks to renewable energy affect CO2 emissions significantly, correspondingly at 5% and 10% significance levels. The negative shock to renewable energy deteriorates the quality of the environment drastically; that is, a 1% decline in the intake of renewable energy drives CO2 emissions to increase by 2.897% in the long run. However, a 1% positive shock to renewable energy causes CO2 emanations to reduce by 0.762%. Regarding the effect of per capita GDP, the value of the linear term is 2.314 and significant in the long run, which is more or less similar to the short-run coefficient of linear GDP. On the other hand, the quadratic term is negative, and compared to the short-run coefficient of the quadratic term, GDP2 affects CO2 emissions to a lesser extent in the long run. The coefficient of linear and squared GDP shows that the EKC theory holds in the long run as well, which shows that at initial levels of growth, the environment deteriorates due to the scale effect. However, at high levels of GDP, the growth process becomes slower, and the pollution control initiatives can offset the scale effect. The coefficient of population growth is insignificant; thus, population growth affects environmental efficiency negatively in the short run. However, the population does not affect the environment in the long run in China. These outcomes of the existing research are in agreement with the studies of Ahmad et al. [54] and Shah et al. [55]. The technology originated to mark CO2 emissions negatively in the long run only; that is, a 1% increase in technology mitigates CO2 releases by 1.205%. Technological advancements in both agriculture and industry, such as the use of mechanization and sophisticated chemicals in agriculture, as well as the excessive use of technological machinery in the industrial sector, increase CO2 emissions. In contrast, the development of high-tech industries induces technologies that use a higher proportion of renewable energy over the long run, thus affecting CO2 emissions negatively [56]. Our result shows that in the case of China, due to renewable energy-bound technology, the negative consequence of technological advancements on CO2 emanations prevails over the long run.
Panel C of Table 5 illustrates the diagnostic analysis. The value of adjusted R2 is 0.687, which shows that around 69% of the variation in CO2 emissions is explained by the independent indicators of the model. The significant rate of the F-statistic indicates the overall significance, whereas the Portmanteau test up to lag 10 shows that there is no serial correlation. The probability rate of the J-B assessment is higher than 0.05, which leads to the conclusion that errors are normally distributed. At the same time, the insignificant value of RESET shows that the existing empirical model is appropriately specified. After this, we have examined the robustness test to assess the sensitivity of the findings. In Table 6 of QARDL, the findings illustrate that the value of GDP2 is significant at quantile v = 0.25, 0.50, and 0.75, and its negative sign validates the EKC inverted U-shape hypothesis. Furthermore, renewable energy is found to be confident in reducing environmental degradation. However, the findings of QARDL fulfilled the need for robustness, and there is no issue in the model. The findings are given below in Table 6.

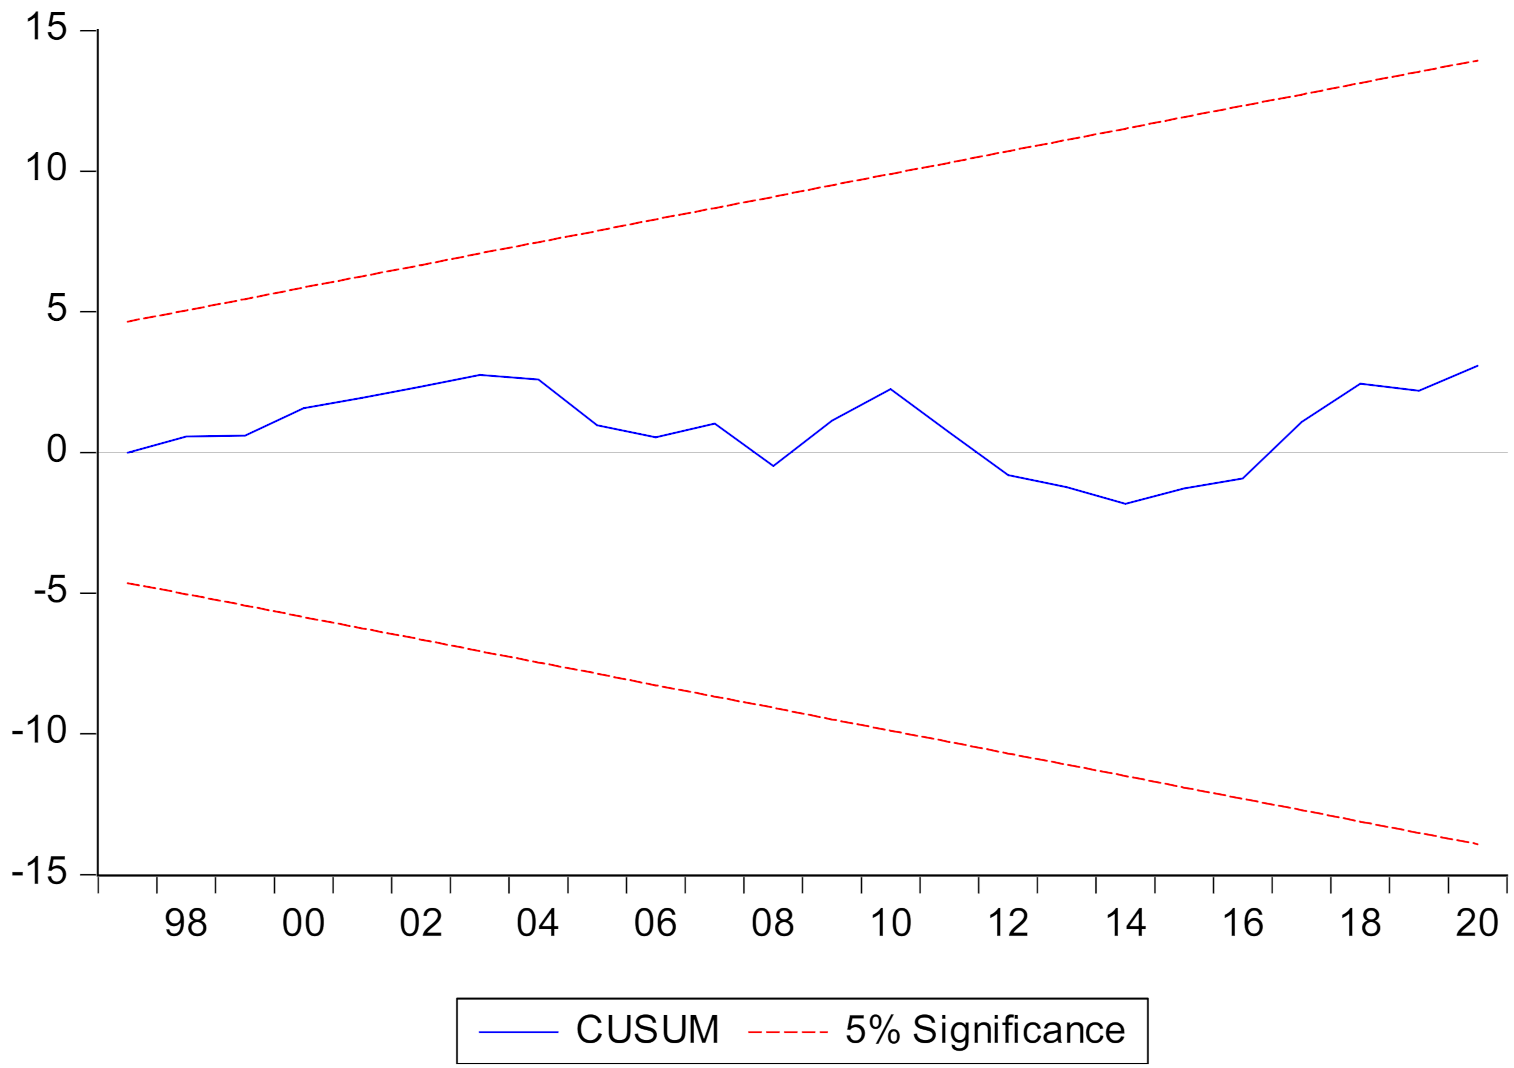
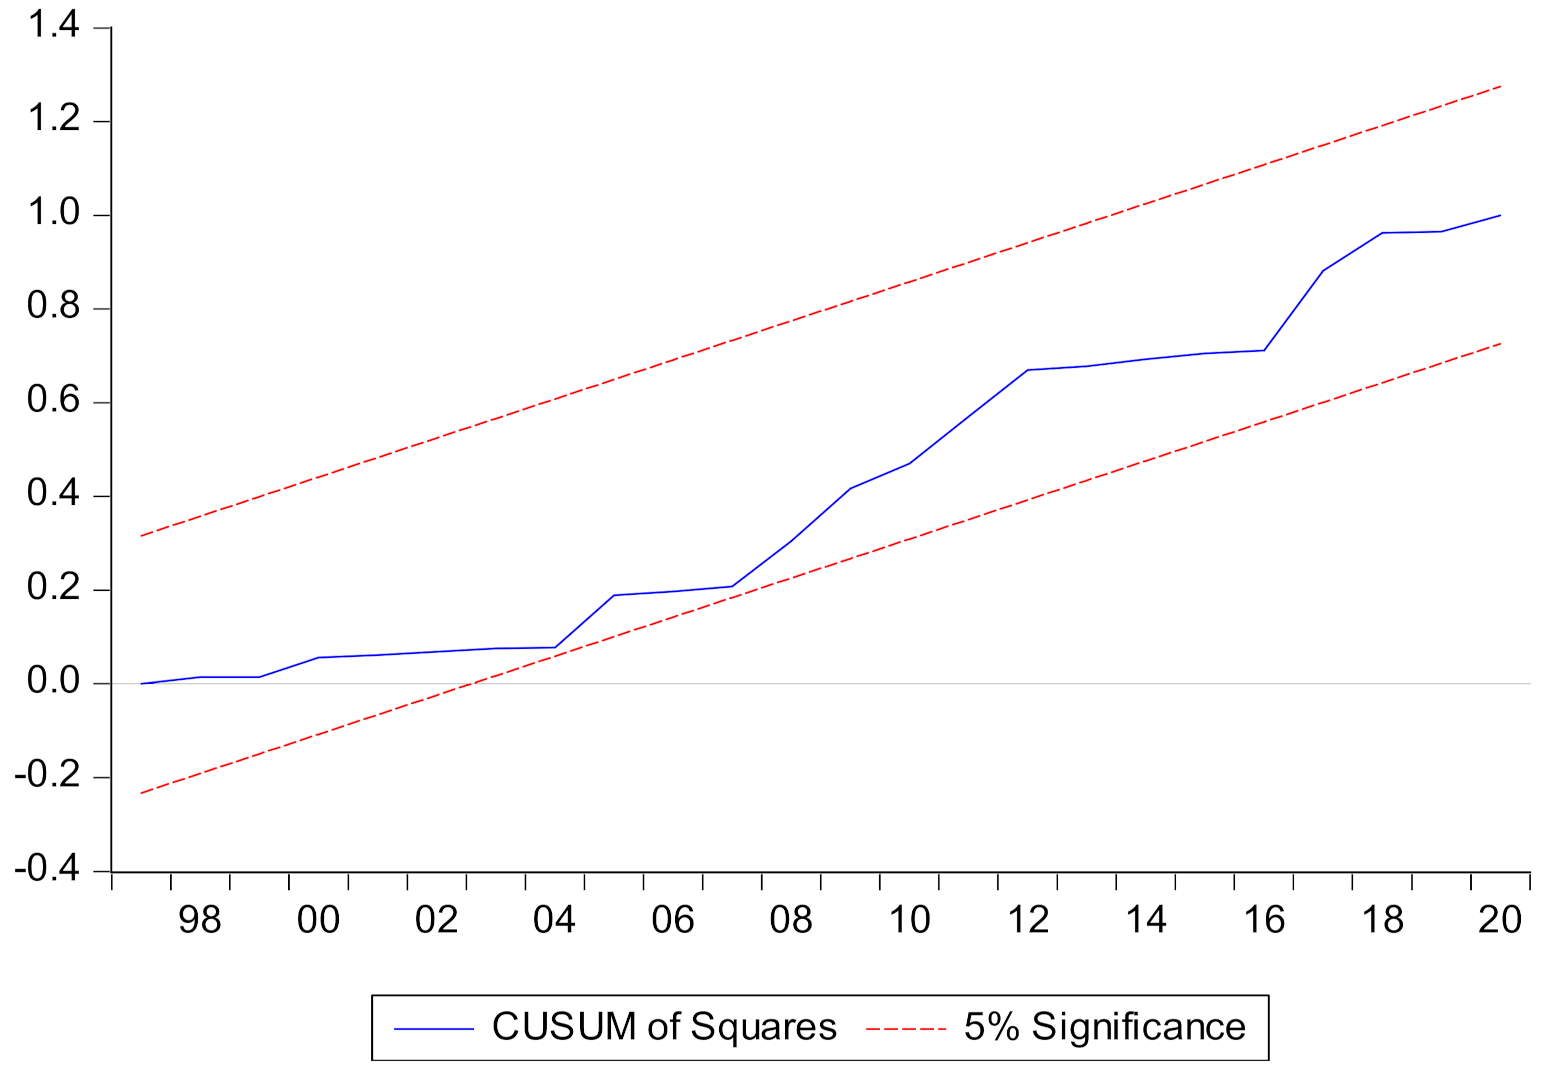
4.4. Stability Graph Results

In the end, stability graphs of CUSUM and CUSUM-square are employed to witness the stability of the empirical model by graphs. Regarding this, two stability graphs, CUSUM and CUSUM-squared, are employed in which the CUSUM and CUSUM-square lines are prerequisites for positioned between the upper and lower bound lines. However, here in the results, CUSUM and CUSUM-square lines are found between the upper-lower bounds and presented in Figure 4 and Figure 5, evidencing the stability of the empirical model to measure STIRPAT-Kaya-EKC in China.

5. Conclusions and Policy Recommendations

This study employs the STIRPAT-Kaya-EKC framework and examines whether renewable energy affects environmental degradation asymmetrically in China or not. Following the empirical results, the main outcomes of the study are as follows:
  • The NARDL estimates of linear and quadratic terms of GDP support the EKC hypothesis in China in both the short-run and long-run, implying that the advantages of economic expansion in standings of CO2 secretions reduction will be realized over time.
  • According to the findings, renewable energy has an asymmetric impact on environmental quality. However, results indicate that the negative shocks to renewable energy use have a greater damaging impression on the environment than the positive shock to renewable energy consumption. The decrease in the use of REC leaves the population to rely on non-renewable energy sources that cause a tremendous increase in CO2 emissions.
  • It is also observed that the population contributes to environmental deprivation in the short run due to the resulting increase in demand for industrial products and transportation. However, its effect on environmental deterioration is insignificant in the long run.
  • Technology proxied by the number of patent applications is found to improve the environment by shrinking the carbon releases in the long run, because the high-tech industries use energy-efficient and renewable energy-based technologies.
Based on empirical findings, this study emphasizes that the government can improve the economy’s lifespan by allocating substantial funds for environmental preservation and establishing legislation to maintain a clean environment. With the increase in economic expansion, the government of China must subsidize the clean energy projects to encourage the industrialists to use clean energy resources. According to our result, technology is found to affect environmental quality positively. Therefore, this study suggests that the government should encourage research and innovations in energy-saving and low-carbon projects. Since the findings of this study show that negative shocks to renewable energy consumption harshly harm the environment, the government needs to maintain subsidies for the use of renewable energy to avoid negative shocks to REC and improve the infrastructure of renewable energy production. Examining positive and negative shocks to REC would aid policymakers in establishing more precise methods when deciding on China’s energy strategy.
Future studies in this domain can investigate the asymmetric impact of the sub-components of renewable energy, for example, wind, hydro, solar, etc., on the environment. Furthermore, the upcoming research may focus on the asymmetric effect of sub-components of renewable energy on other populated and polluted countries.

Author Contributions

Conceptualization, S.Z.U.A. and M.H.; Data curation, S.Z.U.A.; Formal analysis, S.M.F.R.; Funding acquisition, Y.J.; Methodology, S.M.F.R., Z.B.; Supervision, M.H.; Visualization, S.A. and M.H.; Writing—original draft, Z.B.; Writing—review and editing, S.M.F.R. and S.Z.U.A. All authors have read and agreed to the published version of the manuscript.

Funding

This work is supported by the “Leading Talents Training Program” of Jiangsu Vocational Institute of Commerce.

Institutional Review Board Statement

Not applicable.

Informed Consent Statement

Not applicable.

Data Availability Statement

Data can be available on reasonable request.

Conflicts of Interest

The authors declare no conflict of interest.

References

  1. Baumeister, S. We Are Still In! Conference report from the 2018 Ceres Conference. J. Clean. Prod. 2018, 196, 183–184. [Google Scholar] [CrossRef]
  2. Zhang-Wei, L.; Xun-Gang, Z. Study on Relationship of Energy Consumption and Economic Growth in China. Phys. Procedia 2012, 24, 313–319. [Google Scholar] [CrossRef] [Green Version]
  3. Collins, G. China’s Evolving Oil Demand: Slowing Overall Growth, Gasoline Replacing Diesel as Demand Driver, Refined Product Exports Rising Substantially. 2016. Available online: https://scholarship.rice.edu/bitstream/handle/1911/92692/WorkingPaper-ChinaOil-093016.pdf?sequence=1 (accessed on 28 April 2022).
  4. Eyuboglu, K.; Uzar, U. Asymmetric causality between renewable energy consumption and economic growth: Fresh evidence from some emerging countries. Environ. Sci. Pollut. Res. 2022, 29, 21899–21911. [Google Scholar] [CrossRef] [PubMed]
  5. Ehrlich, P.R.; Holdren, J.P. Impact of Population Growth: Complacency concerning this component of man’s predicament is unjustified and counterproductive. Science 1971, 171, 1212–1217. [Google Scholar] [CrossRef]
  6. Chontanawat, J. Decomposition analysis of CO2 emission in ASEAN: An extended IPAT model. Energy Procedia 2018, 153, 186–190. [Google Scholar] [CrossRef]
  7. Dawson, I.; Zhang, D. Using a 3D Interactive Model of the ‘IPAT’equation to Communicate What Can Drive Environment Risks. In Proceedings of the 29th Annual Conference of the Society for Risk Analysis—Europe, Espoo, Finland, 14–16 June 2021; Aalto University: Espoo, Finland. [Google Scholar]
  8. Fan, Y.; Liu, L.C.; Wu, G.; Wei, Y.M. Analyzing impact factors of CO2 emissions using the STIRPAT model. Environ. Impact Assess. Rev. 2006, 26, 377–395. [Google Scholar] [CrossRef]
  9. Filimonova, I.; Provornaya, I.; Komarova, A.; Zemnukhova, E.; Mishenin, M. Influence of economic factors on the environment in countries with different levels of development. Energy Rep. 2020, 6, 27–31. [Google Scholar] [CrossRef]
  10. Hubacek, K.; Feng, K.S.; Chen, B. Changing lifestyles towards a low carbon economy: An IPAT analysis for China. Energies 2012, 5, 22–31. [Google Scholar] [CrossRef]
  11. Kaya, Y. Impact of Carbon Dioxide Emission Control on GNP Growth: Interpretation of Proposed Scenarios. Intergovernmental Panel on Climate Change/Response Strategies Working Group, May 1989. Available online: https://cir.nii.ac.jp/crid/1570291225678384256 (accessed on 28 April 2022).
  12. Meyer, W.B.; Turner, B.L. Human population growth and global land-use/cover change. Annu. Rev. Ecol. Syst. 1992, 23, 39–61. [Google Scholar] [CrossRef]
  13. Grossman, G.M.; Krueger, A.B. Environmental Impacts of a North American Free Trade Agreement; MIT Press: Cambridge, MA, USA, 1991. [Google Scholar]
  14. Pao, H.-T.; Chen, C.C. Decoupling strategies: CO2 emissions, energy resources, and economic growth in the Group of Twenty. J. Clean. Prod. 2018, 206, 907–919. [Google Scholar] [CrossRef]
  15. Zoundi, Z. CO2 emissions, renewable energy and the Environmental Kuznets Curve, a panel cointegration approach. Renew. Sustain. Energy Rev. 2017, 72, 1067–1075. [Google Scholar] [CrossRef]
  16. Naz, S.; Sultan, R.; Zaman, K.; Aldakhil, A.M.; Nassani, A.A.; Abro, M.M.Q. Moderating and mediating role of renewable energy consumption, FDI inflows, and economic growth on carbon dioxide emissions: Evidence from robust least square estimator. Environ. Sci. Pollut. Res. 2018, 26, 2806–2819. [Google Scholar] [CrossRef] [PubMed]
  17. Hu, H.; Xie, N.; Fang, D.; Zhang, X. The role of renewable energy consumption and commercial services trade in carbon dioxide reduction: Evidence from 25 developing countries. Appl. Energy 2018, 211, 1229–1244. [Google Scholar] [CrossRef]
  18. Sarkodie, S.A.; Adams, S.; Owusu, P.A.; Leirvik, T.; Ozturk, I. Mitigating degradation and emissions in China: The role of environmental sustainability, human capital and renewable energy. Sci. Total Environ. 2020, 719, 137530. [Google Scholar] [CrossRef]
  19. Bölük, G.; Mert, M. Fossil & renewable energy consumption, GHGs (greenhouse gases) and economic growth: Evidence from a panel of EU (European Union) countries. Energy 2014, 74, 439–446. [Google Scholar]
  20. Hasnisah, A.; Azlina, A.A.; Che CM, I. The impact of renewable energy consumption on carbon dioxide emissions: Empirical evidence from developing countries in Asia. Int. J. Energy Econ. Policy 2019, 9, 135. [Google Scholar] [CrossRef]
  21. Nathaniel, S.P.; Iheonu, C.O. Carbon dioxide abatement in Africa: The role of renewable and non-renewable energy consumption. Sci. Total Environ. 2019, 679, 337–345. [Google Scholar] [CrossRef]
  22. Lin, B.; Moubarak, M. Renewable energy consumption—Economic growth nexus for China. Renew. Sustain. Energy Rev. 2014, 40, 111–117. [Google Scholar] [CrossRef]
  23. Dong, K.; Sun, R.; Jiang, H.; Zeng, X. CO2 emissions, economic growth, and the environmental Kuznets curve in China: What roles can nuclear energy and renewable energy play? J. Clean. Prod. 2018, 196, 51–63. [Google Scholar] [CrossRef]
  24. Bekhet, H.A.; Othman, N.S. The role of renewable energy to validate dynamic interaction between CO2 emissions and GDP toward sustainable development in Malaysia. Energy Econ. 2018, 72, 47–61. [Google Scholar] [CrossRef]
  25. Payne, J.E. The Causal Dynamics Between US Renewable Energy Consumption, Output, Emissions, and Oil Prices. Energy Sources Part B Econ. Plan. Policy 2012, 7, 323–330. [Google Scholar] [CrossRef]
  26. Silva, S.; Soares, I.; Pinho, C. The Impact of Renewable Energy Sources on Economic Growth and CO2 Emissions—A SVAR approach. Eur. Res. Stud. J. 2012, XV, 133–144. [Google Scholar] [CrossRef] [Green Version]
  27. Charfeddine, L.; Kahia, M. Impact of renewable energy consumption and financial development on CO2 emissions and economic growth in the MENA region: A panel vector autoregressive (PVAR) analysis. Renew. Energy 2019, 139, 198–213. [Google Scholar] [CrossRef]
  28. Nathaniel, S.; Anyanwu, O.; Shah, M. Renewable energy, urbanization, and ecological footprint in the Middle East and North Africa region. Environ. Sci. Pollut. Res. 2020, 27, 14601–14613. [Google Scholar] [CrossRef] [PubMed]
  29. Khattak, S.I.; Ahmad, M.; Khan, Z.U.; Khan, A. Exploring the impact of innovation, renewable energy consumption, and income on CO2 emissions: New evidence from the BRICS economies. Environ. Sci. Pollut. Res. 2020, 27, 13866–13881. [Google Scholar] [CrossRef] [PubMed]
  30. Mohsin, M.; Kamran, H.W.; Nawaz, M.A.; Hussain, M.S.; Dahri, A.S. Assessing the impact of transition from non-renewable to renewable energy consumption on economic growth-environmental nexus from developing Asian economies. J. Environ. Manag. 2021, 284, 111999. [Google Scholar] [CrossRef]
  31. Belaïd, F.; Zrelli, M.H. Renewable and non-renewable electricity consumption, environmental degradation and economic development: Evidence from Mediterranean Vcountries. Energy Policy 2019, 133, 110929. [Google Scholar] [CrossRef]
  32. Sharif, A.; Baris-Tuzemen, O.; Uzuner, G.; Ozturk, I.; Sinha, A. Revisiting the role of renewable and non-renewable energy consumption on Turkey’s ecological footprint: Evidence from Quantile ARDL approach. Sustain. Cities Soc. 2020, 57, 102138. [Google Scholar] [CrossRef]
  33. Hanif, I. Impact of economic growth, nonrenewable and renewable energy consumption, and urbanization on carbon emissions in Sub-Saharan Africa. Environ. Sci. Pollut. Res. 2018, 25, 15057–15067. [Google Scholar] [CrossRef]
  34. Acheampong, A.O.; Adams, S.; Boateng, E. Do globalization and renewable energy contribute to carbon emissions mitigation in Sub-Saharan Africa? Sci. Total Environ. 2019, 677, 436–446. [Google Scholar] [CrossRef] [PubMed]
  35. Nguyen, K.H.; Kakinaka, M. Renewable energy consumption, carbon emissions, and development stages: Some evidence from panel cointegration analysis. Renew. Energy 2018, 132, 1049–1057. [Google Scholar] [CrossRef]
  36. Saidi, K.; Omri, A. The impact of renewable energy on carbon emissions and economic growth in 15 major renewable energy-consuming countries. Environ. Res. 2020, 186, 109567. [Google Scholar] [CrossRef] [PubMed]
  37. Gielen, D.; Boshell, F.; Saygin, D.; Bazilian, M.D.; Wagner, N.; Gorini, R. The role of renewable energy in the global energy transformation. Energy Strategy Rev. 2019, 24, 38–50. [Google Scholar] [CrossRef]
  38. Jones, G.A.; Warner, K. The 21st century population-energy-climate nexus. Energy Policy 2016, 93, 206–212. [Google Scholar] [CrossRef]
  39. Collender, S.; Sklibosios Nikitopoulos, C.; Richards, K.A.; Ryan, L.S. Climate Change Transition Risk on Sovereign Bond Markets. 2021. Available online: https://ssrn.com/abstract=3861350 (accessed on 26 October 2021).
  40. Lin, B.; Zhu, J. Determinants of renewable energy technological innovation in China under CO2 emissions constraint. J. Environ. Manag. 2019, 247, 662–671. [Google Scholar] [CrossRef] [PubMed]
  41. Jin, T.; Kim, J. What is better for mitigating carbon emissions—Renewable energy or nuclear energy? A panel data analysis. Renew. Sustain. Energy Rev. 2018, 91, 464–471. [Google Scholar] [CrossRef]
  42. Ali, M.; Kirikkaleli, D. The asymmetric effect of renewable energy and trade on consumption-based CO2 emissions: The case of Italy. Integr. Environ. Assess. Manag. 2022, 18, 784–795. [Google Scholar] [CrossRef]
  43. Adebayo, T.S.; Rjoub, H.; Akinsola, G.D.; Oladipupo, S.D. The asymmetric effects of renewable energy consumption and trade openness on carbon emissions in Sweden: New evidence from quantile-on-quantile regression approach. Environ. Sci. Pollut. Res. 2022, 29, 1875–1886. [Google Scholar] [CrossRef]
  44. Dietz, T.; Rosa, E.A. Rethinking the environmental impacts of population, affluence and technology. Hum. Ecol. Rev. 1994, 1, 277–300. [Google Scholar]
  45. Shin, Y.; Yu, B.; Greenwood-Nimmo, M. Modelling asymmetric cointegration and dynamic multipliers in a non-linear ARDL framework. In Festschrift in Honor of Peter Schmidt; Springer: New York, NY, USA, 2014; pp. 281–314. [Google Scholar]
  46. Allen, D.E.; McAleer, M. A Nonlinear Autoregressive Distributed Lag (NARDL) Analysis of the FTSE and S&P500 Indexes. Risks 2021, 9, 195. [Google Scholar]
  47. Pesaran, M.H.; Shin, Y.; Smith, R.J. Bounds testing approaches to the analysis of level relationships. J. Appl. Econom. 2001, 16, 289–326. [Google Scholar] [CrossRef]
  48. Narayan, P.K. The saving and investment nexus for China: Evidence from cointegration tests. Appl. Econ. 2005, 37, 1979–1990. [Google Scholar] [CrossRef]
  49. Rehman, A.; Ma, H.; Ahmad, M.; Ozturk, I.; Işık, C. An asymmetrical analysis to explore the dynamic impacts of CO2 emission to renewable energy, expenditures, foreign direct investment, and trade in Pakistan. Environ. Sci. Pollut. Res. 2021, 28, 53520–53532. [Google Scholar] [CrossRef] [PubMed]
  50. Bongaarts, J. Population Growth and Global Warming. Popul. Dev. Rev. 1992, 18, 299. [Google Scholar] [CrossRef]
  51. Nasir, M.; Rehman, F.U. Environmental Kuznets curve for carbon emissions in Pakistan: An empirical investigation. Energy Policy 2011, 39, 1857–1864. [Google Scholar] [CrossRef]
  52. Abdouli, M.; Hammami, S. Investigating the causality links between environmental quality, foreign direct investment and economic growth in MENA countries. Int. Bus. Rev. 2017, 26, 264–278. [Google Scholar] [CrossRef]
  53. Çıtak, F.; Uslu, H.; Batmaz, O.; Hoş, S. Do renewable energy and natural gas consumption mitigate CO2 emissions in the USA? New insights from NARDL approach. Environ. Sci. Pollut. Res. 2020, 28, 63739–63750. [Google Scholar] [CrossRef]
  54. Ahmad, M.; Hengyi, H.; Rahman, Z.U.; Khan, Z.U.; Khan, S.; Khan, Z. Carbon emissions, energy use, gross domestic product and total population in China. Ekon. I Sr.-Econ. Environ. 2018, 65, 13. [Google Scholar]
  55. Shah, M.H.; Wang, N.; Ullah, I.; Akbar, A.; Khan, K.; Bah, K. Does environment quality and public spending on environment promote life expectancy in China? Evidence from a non-linear autoregressive distributed lag approach. Int. J. Health Plan. Manag. 2021, 36, 545–560. [Google Scholar] [CrossRef]
  56. Aslam, B.; Hu, J.; Majeed, M.T.; Andlib, Z.; Ullah, S. Asymmetric macroeconomic determinants of CO2 emission in China and policy approaches. Environ. Sci. Pollut. Res. 2021, 28, 41923–41936. [Google Scholar] [CrossRef]
Figure 1. CO2 Emissions in China (1990–2020).
Ijerph 19 07100 g001
Figure 2. Economic Growth in China (1990–2020).
Ijerph 19 07100 g002
Figure 3. Renewable Energy Consumption in China (1990–2020).
Ijerph 19 07100 g003
Figure 4. CUSUM.
Figure 4. CUSUM.
Ijerph 19 07100 g004
Figure 5. CUSUM of Squares.
Ijerph 19 07100 g005
Table 1. Descriptive Statistics.
EDRECGDPTP
MEAN4.62821.14427,631.479363,389.11.29 × 109
S.D.2.1478.67919,062.425481,685.481,136,228
MIN1.91411.3385636.07958321.14 × 109
MAX7.53834.08364,581.4121,393,8151.41 × 109
SKEW0.1340.2120.6181.173−0.343
KURT1.2281.1652.0102.8072.088
Table 2. Results of Unit Root Tests.
VariableAugmented Dickey-Fuller TestPhillips-Perron Test
Level1st DifferenceLevel1st Difference
ED−2.012−3.328 *−1.447−3.531 **
GDP−2.857−4.529 ***−2.034−3.498 **
GDP2−1.836−3.894 **−1.723−3.277 *
P−0.463−4.552 ***−0.439−4.430 ***
T−1.264−3.291 *0.012−3.016 *
RE−0.344−4.967 ***−0.773−5.309 ***
Note: *, **, and *** show statistical significance at 10%, 5%, and 1% levels.
Table 3. Result of NARDL Bound Test.
F-Statistics (PSS)5.792
Critical-Values
Significance LevelsI (0)I (1)
10%2.9774.260
5%3.5765.065
1%5.0466.930
Note: Narayan [48] is the source to acquire critical values for the bound test in accordance with k = 6 and N = 30 with no trend and unrestricted intercept.
Table 4. Short-run and Long-run Asymmetry Statistics.
Short-Run Asymmetry
VariableF-Statisticp-Value
RE9.764 ***0.008
Long-run Asymmetry
RE17.098 ***0.000
Note: *** shows that values are meaningful at a 1% significance level.
Table 5. The Short-run and Long-run Estimates of the NARDL Model.
Dependent Variable: ED
VariablesCoefficient Valuep-Value
Panel A: Short-Run Estimates
D (RE_NEG)−0.6600.118
D (RE_NEG (−1))0.0070.192
D (RE_NEG (−2))1.291 ***0.016
D (RE_POS)−0.2830.355
D (RE_POS (−1))−0.506 *0.092
D (GDP)2.155 ***0.001
D (GDP2)−1.893 ***0.008
D (P)0.0030.235
D (P (−1))0.722 *0.067
D (ED)0.4776 **0.034
ECT−0.548 **0.017
Constant0.01180.776
Panel B: Long-Run Estimates
RE_NEG2.897 **0.041
RE_POS−0.762 *0.081
GDP2.314 ***0.000
GDP2−0.809 *0.086
P0.0680.215
T−1.205 **0.013
Panel C: Diagnostic Test
Adjusted R20.687
F-Stat (p-value)18.390 *** (0.000)
Portmanteau test (10)1.347 (0.265)
JB Stat3.722 (0.144)
Ramsey RESET1.794 (0.187)
Note: *, **, and *** illustrate significance correspondingly at 10%, 5%, and 1%.
Table 6. Estimates of QARDL Model.
ParametersQuantile v = 0.25Quantile v = 0.50Quantile v = 0.75
Coefficientp-ValueCoefficientp-ValueCoefficientp-Value
GDP0.1130.7460.2990.2890.0990.762
GDP2−0.913 ***0.000−1.046 ***0.000−0.990 ***0.000
P0.0140.8420.0310.3570.0000.980
RE−0.692 ***0.000−0.526 ***0.000−0.535 ***0.001
T−1.3280.681−4.1550.149−4.2270.144
Note: *** indicates the significance level at 1 percent.
Publisher’s Note: MDPI stays neutral with regard to jurisdictional claims in published maps and institutional affiliations.

