
Accelerometer-Measured Physical Activity Levels and Patterns Vary in an Age- and Sex-Dependent Fashion among Finnish Children and Adolescents

 , ,
, ,  , , and
Abstract
:1. Introduction
2. Materials and Methods
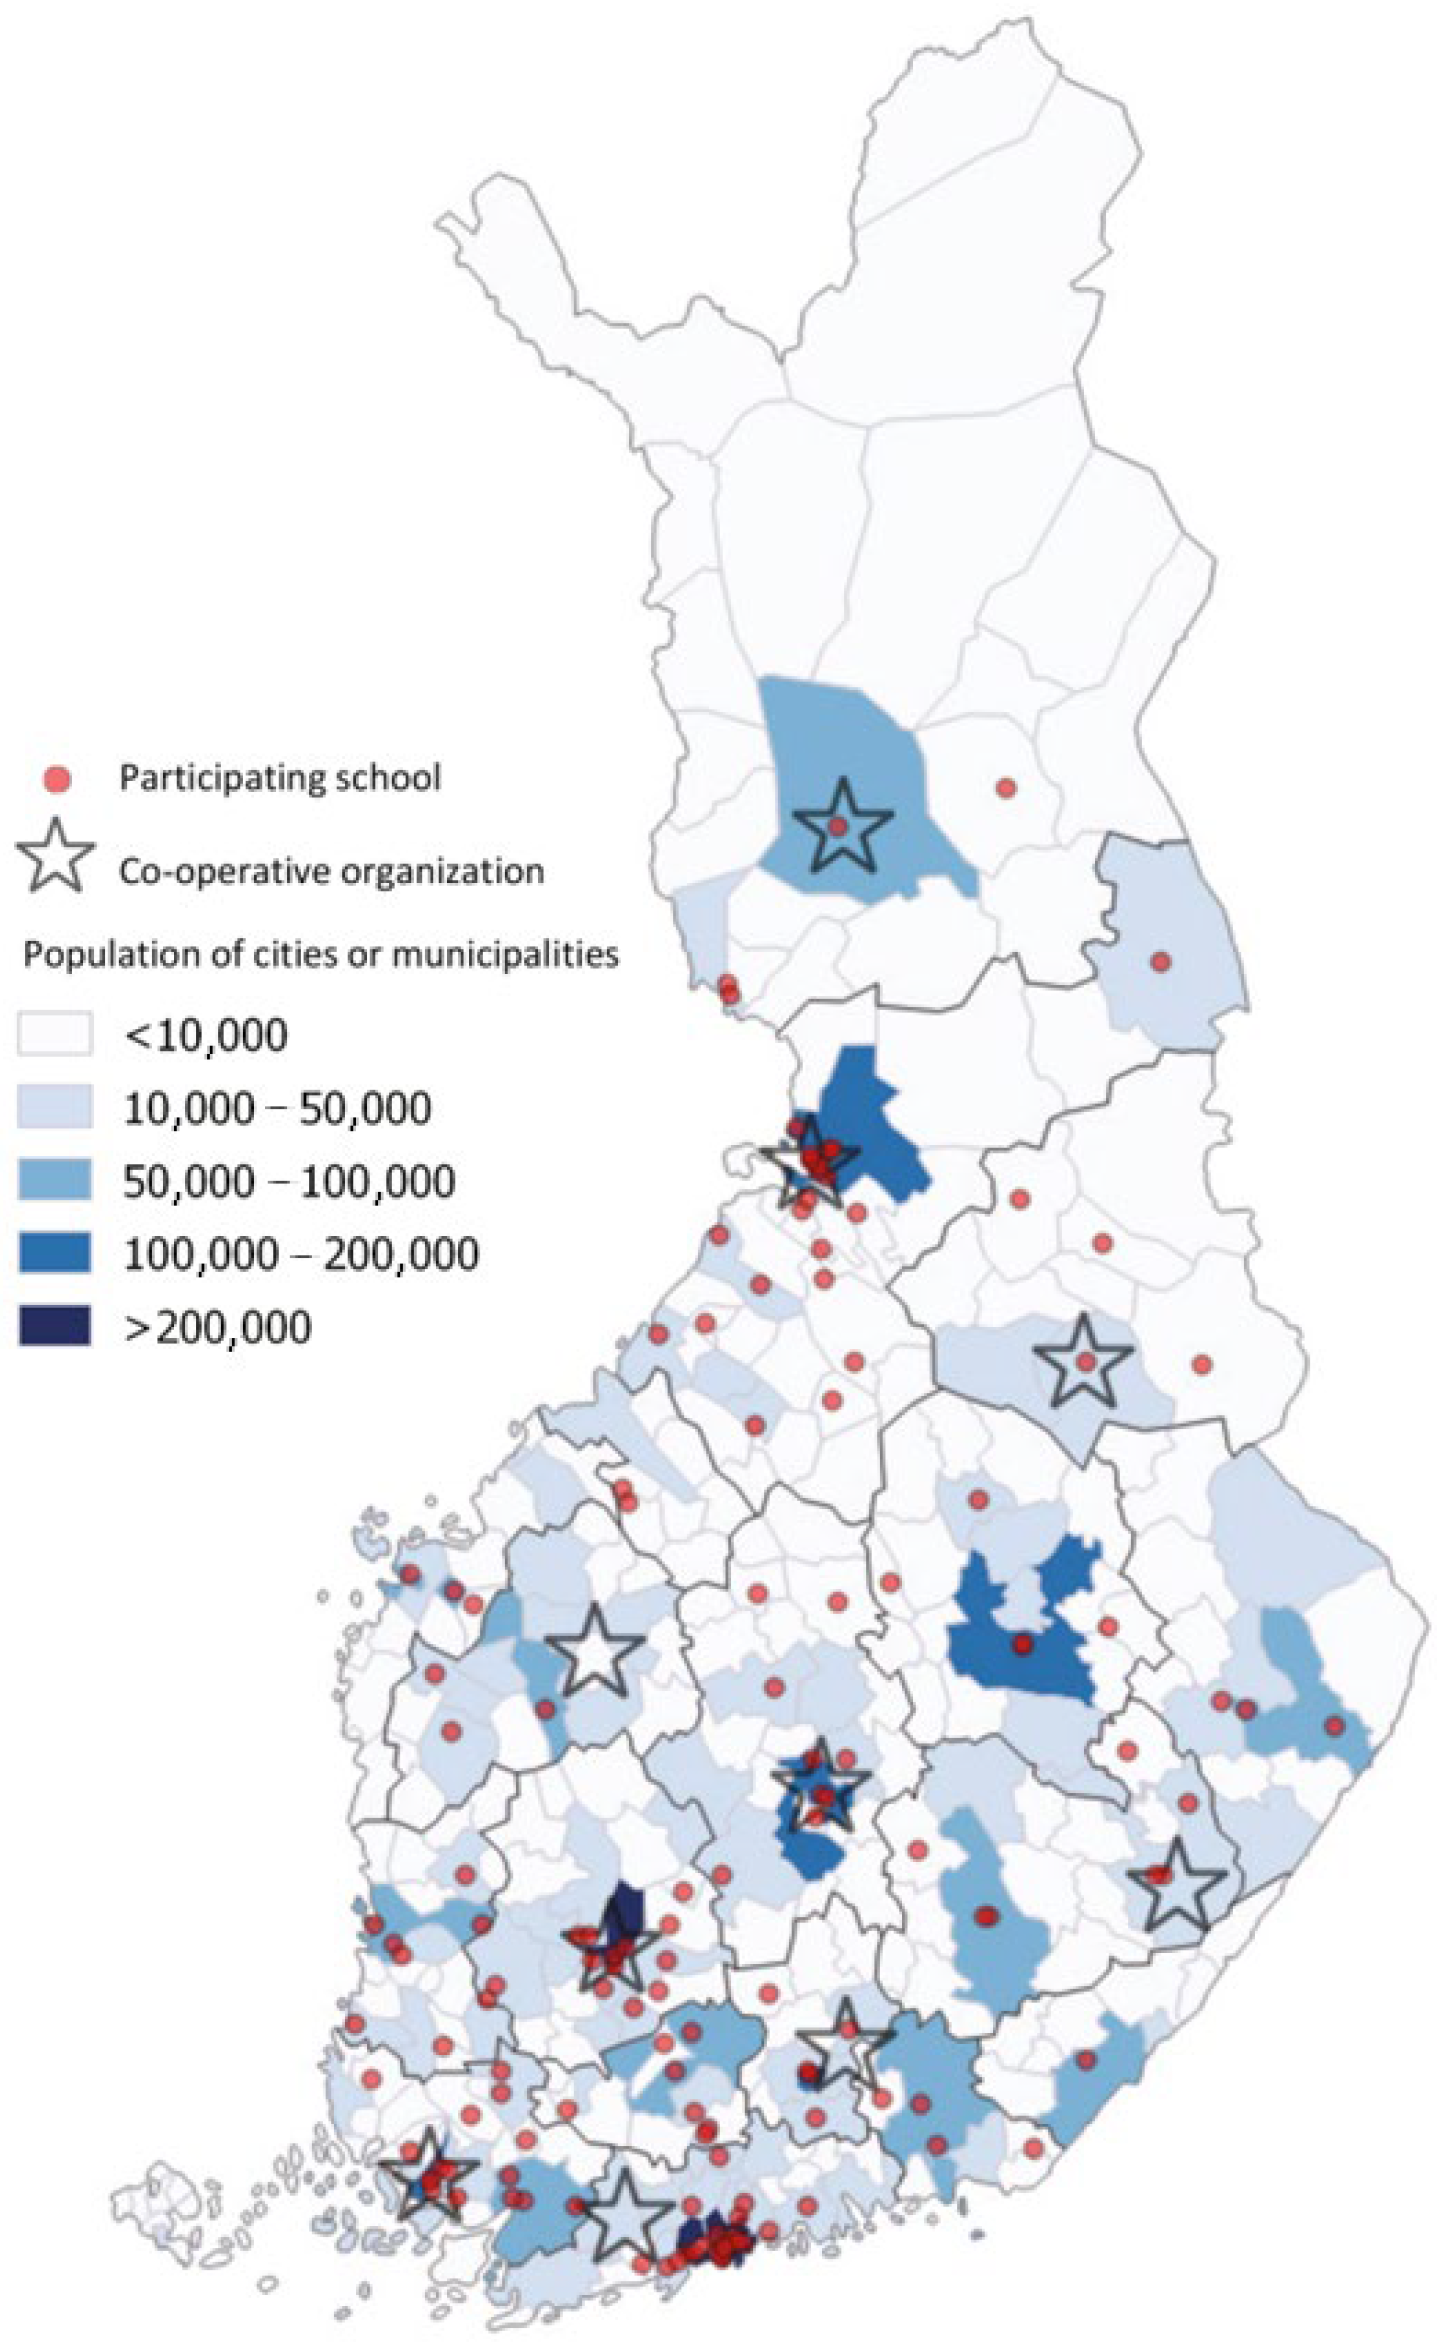
2.1. Study Design and Sample Size
2.2. Accelerometer-Based Measurements of PA and SB
2.3. Statistical Analyses
2.4. Ethics
3. Results
3.1. Overall PA and SB
3.2. Tertile-Wise Daily Step Counts
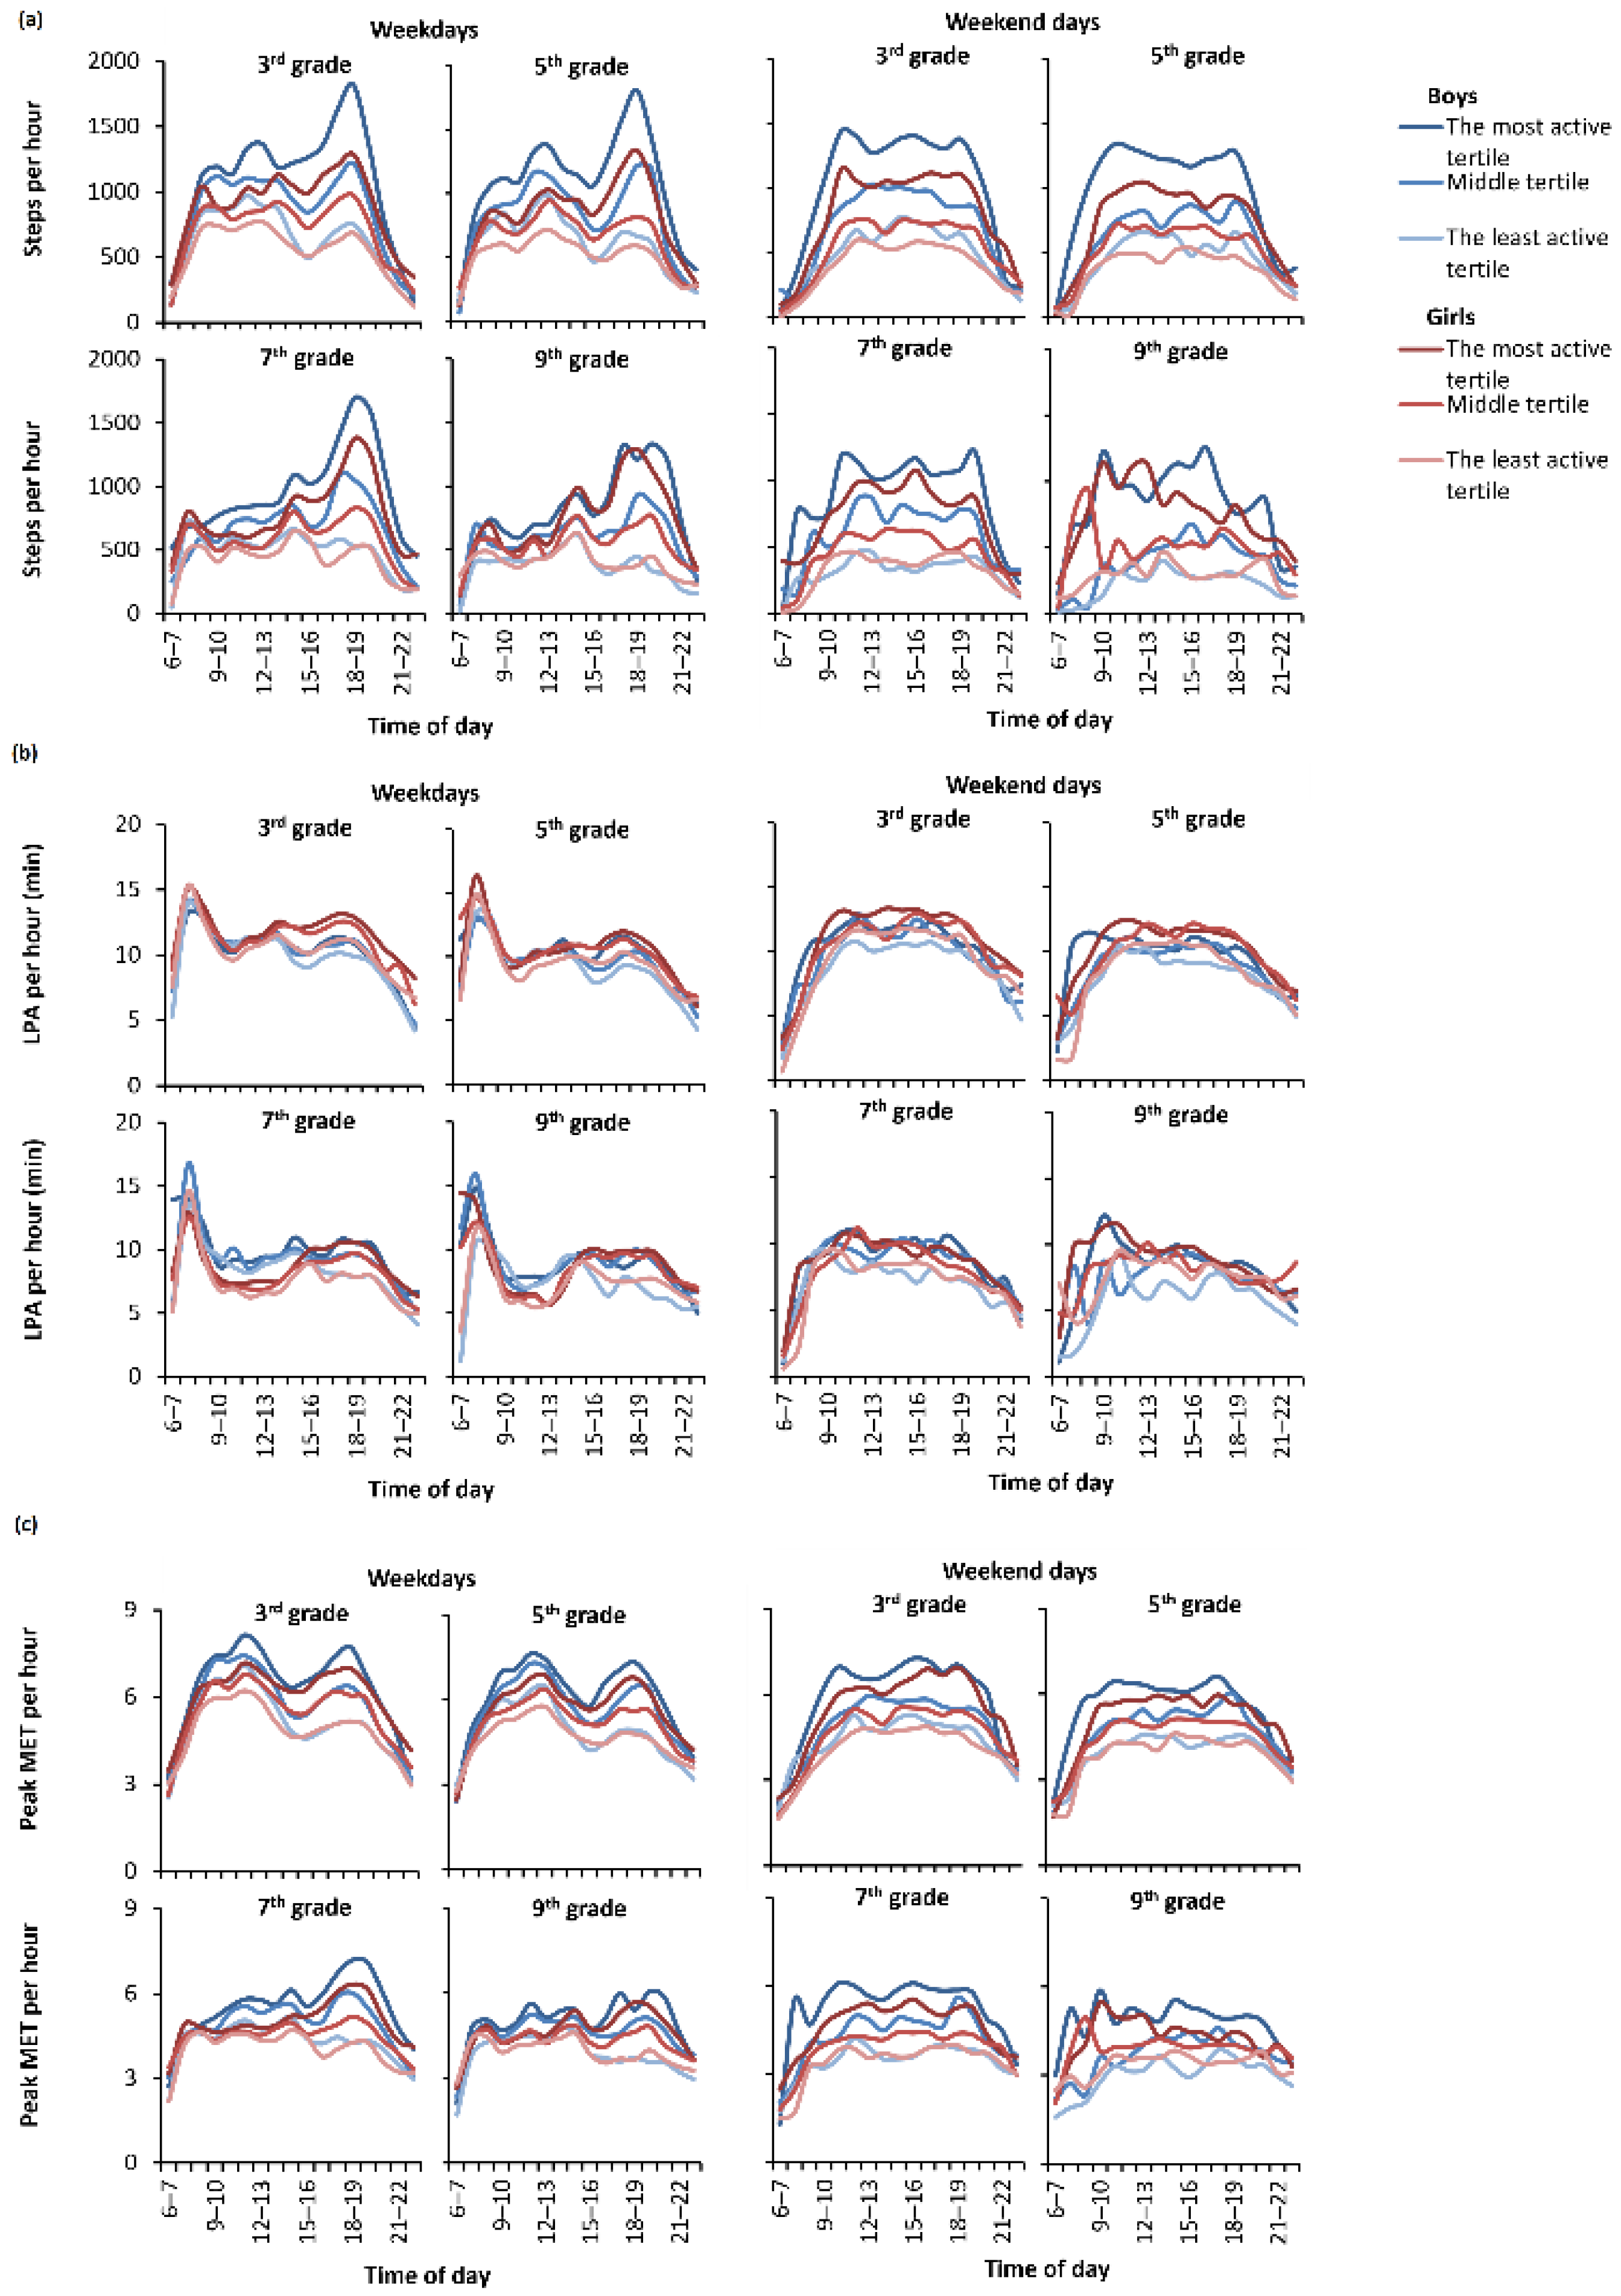
3.3. Hour-by-Hour Step Patterns
3.4. Hour-by-Hour PA Intensity
4. Discussion
5. Conclusions
Supplementary Materials
Author Contributions
Funding
Institutional Review Board Statement
Informed Consent Statement
Data Availability Statement
Acknowledgments
Conflicts of Interest
Abbreviations
| PA | physical activity |
| SB | sedentary behavior |
| LPA | light physical activity |
| MVPA | moderate-to-vigorous physical activity |
| MET | metabolic equivalent |
| FSPA | Finnish School-age Physical Activity-study |
| WHO | The World Health Organization |
| HBSC | The Cross-national Health Behaviors in School-aged Children study |
| MAD | mean amplitude deviation |
| VPA | vigorous physical activity |
| APE | angle for posture estimation |
| SD | standard deviation |
| UK | United Kingdom |
References
- Piercy, K.L.; Troiano, R.P.; Ballard, R.M.; Carlson, S.A.; Fulton, J.E.; Galuska, D.A.; George, S.M.; Olson, R.D. The Physical Activity Guidelines for Americans. JAMA 2018, 320, 2020–2028. [Google Scholar] [CrossRef] [PubMed]
- Poitras, V.J.; Gray, C.E.; Borghese, M.M.; Carson, V.; Chaput, J.P.; Janssen, I.; Katzmarzyk, P.T.; Pate, R.R.; Connor Gorber, S.; Kho, M.E.; et al. Systematic review of the relationships between objectively measured physical activity and health indicators in school-aged children and youth. Appl. Physiol. Nutr. Metab. 2016, 41, 197–239. [Google Scholar] [CrossRef] [PubMed]
- de Rezende, L.F.; Rodrigues Lopes, M.; Rey-Lopez, J.P.; Matsudo, V.K.; Luiz, O.C. Sedentary behavior and health outcomes: An overview of systematic reviews. PLoS ONE 2014, 9, e105620. [Google Scholar] [CrossRef] [PubMed]
- Colley, R.C.; Garriguet, D.; Janssen, I.; Craig, C.L.; Clarke, J.; Tremblay, M.S. Physical activity of Canadian children and youth: Accelerometer results from the 2007 to 2009 Canadian Health Measures Survey. Health Rep. 2011, 22, 15–23. [Google Scholar]
- Husu, P.; Vähä-Ypyä, H.; Vasankari, T. Objectively measured sedentary behavior and physical activity of Finnish 7- to 14-year-old children-associations with perceived health status: A cross-sectional study. BMC Public Health 2016, 16, 338. [Google Scholar] [CrossRef] [Green Version]
- Bull, F.C.; Al-Ansari, S.S.; Biddle, S.; Borodulin, K.; Buman, M.P.; Cardon, G.; Carty, C.; Chaput, J.-P.; Chastin, S.; Chou, R.; et al. World Health Organization 2020 guidelines on physical activity and sedentary behaviour. Br. J. Sports Med. 2020, 54, 1451–1462. [Google Scholar] [CrossRef]
- Cooper, A.R.; Goodman, A.; Page, A.S.; Sherar, L.B.; Esliger, D.W.; van Sluijs, E.M.; Andersen, L.B.; Anderssen, S.; Cardon, G.; Davey, R.; et al. Objectively measured physical activity and sedentary time in youth: The international children’s accelerometry database (ICAD). Int. J. Behav. Nutr. Phys. Act. 2015, 12, 113. [Google Scholar] [CrossRef] [PubMed] [Green Version]
- Kalman, M.; Inchley, J.; Sigmundova, D.; Iannotti, R.J.; Tynjala, J.A.; Hamrik, Z.; Haug, E.; Bucksch, J. Secular trends in moderate-to-vigorous physical activity in 32 countries from 2002 to 2010: A cross-national perspective. Eur. J. Public Health 2015, 25, 37–40. [Google Scholar] [CrossRef] [Green Version]
- Sylvia, L.G.; Bernstein, E.E.; Hubbard, J.L.; Keating, L.; Anderson, E.J. A practical guide to measuring physical activity. J. Acad. Nutr. Diet. 2014, 114, 199–208. [Google Scholar] [CrossRef] [Green Version]
- Westerterp, K.R. Assessment of physical activity: A critical appraisal. Eur. J. Appl. Physiol. 2009, 105, 823–828. [Google Scholar] [CrossRef] [Green Version]
- Cain, K.L.; Sallis, J.F.; Conway, T.L.; Van Dyck, D.; Calhoon, L. Using accelerometers in youth physical activity studies: A review of methods. J. Phys. Act. Health 2013, 10, 437–450. [Google Scholar] [CrossRef]
- Ferrari, G.L.M.; Araújo, T.; Oliveira, L.C.; Matsudo, V.K.R.; Mire, E.; Barreira, T.; Katzmarzyk, P.T.; Tudor-Locke, C. Accelerometer-determined peak cadence and weight status in children from São Caetano do Sul, Brazil. Cien Saude Colet 2017, 22, 3689–3698. [Google Scholar] [CrossRef] [PubMed]
- Belton, S.; O’Brien, W.; Issartel, J.; McGrane, B.; Powell, D. Where does the time go? Patterns of physical activity in adolescent youth. J. Sci. Med. Sport 2016, 19, 921–925. [Google Scholar] [CrossRef] [PubMed]
- Steele, R.M.; van Sluijs, E.M.; Sharp, S.J.; Landsbaugh, J.R.; Ekelund, U.; Griffin, S.J. An investigation of patterns of children’s sedentary and vigorous physical activity throughout the week. Int. J. Behav. Nutr. Phys. Act. 2010, 7, 88. [Google Scholar] [CrossRef] [PubMed] [Green Version]
- Tudor-Locke, C.; Craig, C.L.; Thyfault, J.P.; Spence, J.C. A step-defined sedentary lifestyle index: <5000 steps/day. Appl. Physiol. Nutr. Metab. 2013, 38, 100–114. [Google Scholar] [CrossRef] [PubMed]
- Tudor-Locke, C.; Craig, C.L.; Beets, M.W.; Belton, S.; Cardon, G.M.; Duncan, S.; Hatano, Y.; Lubans, D.R.; Olds, T.S.; Raustorp, A.; et al. How many steps/day are enough? for children and adolescents. Int. J. Behav. Nutr. Phys. Act. 2011, 8, 78. [Google Scholar] [CrossRef] [PubMed] [Green Version]
- Tammelin, T.; Laine, K.; Turpeinen, S. Physical activity of school-aged children. In Oppilaiden Fyysinen Aktiivisuus; Tammelin, T., Laine, K., Turpeinen, S., Eds.; LIKES–Foundation for Sport and Health Science: Jyväskylä, Finland, 2013; p. 9, (Abstract in English). [Google Scholar]
- Kokko, S.; Hämylä, R. (Eds.) Lasten ja Nuorten Liikuntakäyttäytyminen Suomessa: LIITU-Tutkimuksen Tuloksia 2014; Valtion Liikuntaneuvoston Julkaisuja: Helsinki, Finland, 2015; p. 2, (Abstract in English). [Google Scholar]
- Finland’s Report card 2018 on Physical Activity for Children and Youth. LIKES Research Reports on Physical Activity and Health 350. Available online: https://www.likes.fi/wp-content/uploads/2020/03/2800-Finland-reportcard2018-final-150.pdf (accessed on 25 February 2022).
- Kallio, J.; Hakonen, H.; Syväoja, H.; Kulmala, J.; Kankaanpää, A.; Ekelund, U.; Tammelin, T. Changes in physical activity and sedentary time during adolescence: Gender differences during weekdays and weekend days. Scand. J. Med. Sci. Sports 2020, 30, 1265–1275. [Google Scholar] [CrossRef] [Green Version]
- Currie, C.; Inchley, J.; Molcho, M.; Lenzi, M.; Veselska, Z.; Wild, F. (Eds.) Health Behaviour in School-Aged Children (HBSC) Study Protocol: Background, Methodology and Mandatory Items for the 2013/2014 Survey; CAHRU: Hong Kong, China, 2014. [Google Scholar]
- Aittasalo, M.; Vähä-Ypyä, H.; Vasankari, T.; Husu, P.; Jussila, A.M.; Sievänen, H. Mean amplitude deviation calculated from raw acceleration data: A novel method for classifying the intensity of adolescents’ physical activity irrespective of accelerometer brand. BMC Sports Sci. Med. Rehabil. 2015, 7, 18. [Google Scholar] [CrossRef] [PubMed] [Green Version]
- Vähä-Ypyä, H.; Vasankari, T.; Husu, P.; Suni, J.; Sievänen, H. A universal, accurate intensity-based classification of different physical activities using raw data of accelerometer. Clin. Physiol. Funct. Imaging 2015, 35, 64–70. [Google Scholar] [CrossRef]
- Vähä-Ypyä, H.; Vasankari, T.; Husu, P.; Mänttäri, A.; Vuorimaa, T.; Suni, J.; Sievänen, H. Validation of cut-points for evaluating the intensity of physical activity with accelerometry-based mean amplitude deviation (MAD). PLoS ONE 2015, 10, e0134813. [Google Scholar] [CrossRef] [Green Version]
- Vähä-Ypyä, H.; Husu, P.; Suni, J.; Vasankari, T.; Sievänen, H. Reliable recognition of lying, sitting and standing with a hip-worn accelerometer. Scand. J. Med. Sci. Sports. 2018, 28, 1092–1102. [Google Scholar] [CrossRef] [Green Version]
- Sievänen, H.; Kujala, H. Accelerometry—Simple, but challenging. Scand. J. Med. Sci. Sports. 2017, 27, 574–578. [Google Scholar] [CrossRef]
- Vanhala, A. Fyysisen Aktiivisuuden Kuormittavuuden Määrittäminen Absoluuttisesti ja Kestävyyskuntoon Suhteutettuna Energiankulutukseen ja Lantiolta Mitattuihin Kiihtyvyysarvoihin Perustuen Alakouluikäisillä Lapsilla. Master’s Thesis, University of Jyväskylä, Jyväskylä, Finland, 2019. (Abstract in English). [Google Scholar]
- Benjamini, Y.; Hochberg, Y. Controlling the false discovery rate: A practical and powerful approach to multiple testing. J. R. Stat. Soc. B 1995, 57, 289–300. [Google Scholar] [CrossRef]
- Verloigne, M.; Van Lippevelde, W.; Maes, L.; Yıldırım, M.; Chinapaw, M.; Manios, Y.; Androutsos, O.; Kovács, É.; Bringolf-Isler, B.; Brug, J.; et al. Levels of physical activity and sedentary time among 10- to 12-year-old boys and girls across 5 European countries using accelerometers: An observational study within the ENERGY-project. Int. J. Behav. Nutr. Phys. Act. 2012, 9, 34. [Google Scholar] [CrossRef] [PubMed] [Green Version]
- Júdice, P.B.; Silva, A.M.; Berria, J.; Petroski, E.L.; Ekelund, U.; Sardinha, L.B. Sedentary patterns, physical activity and health-related physical fitness in youth: A cross-sectional study. Int. J. Behav. Nutr. Phys. Act. 2017, 14, 25. [Google Scholar] [CrossRef] [PubMed] [Green Version]
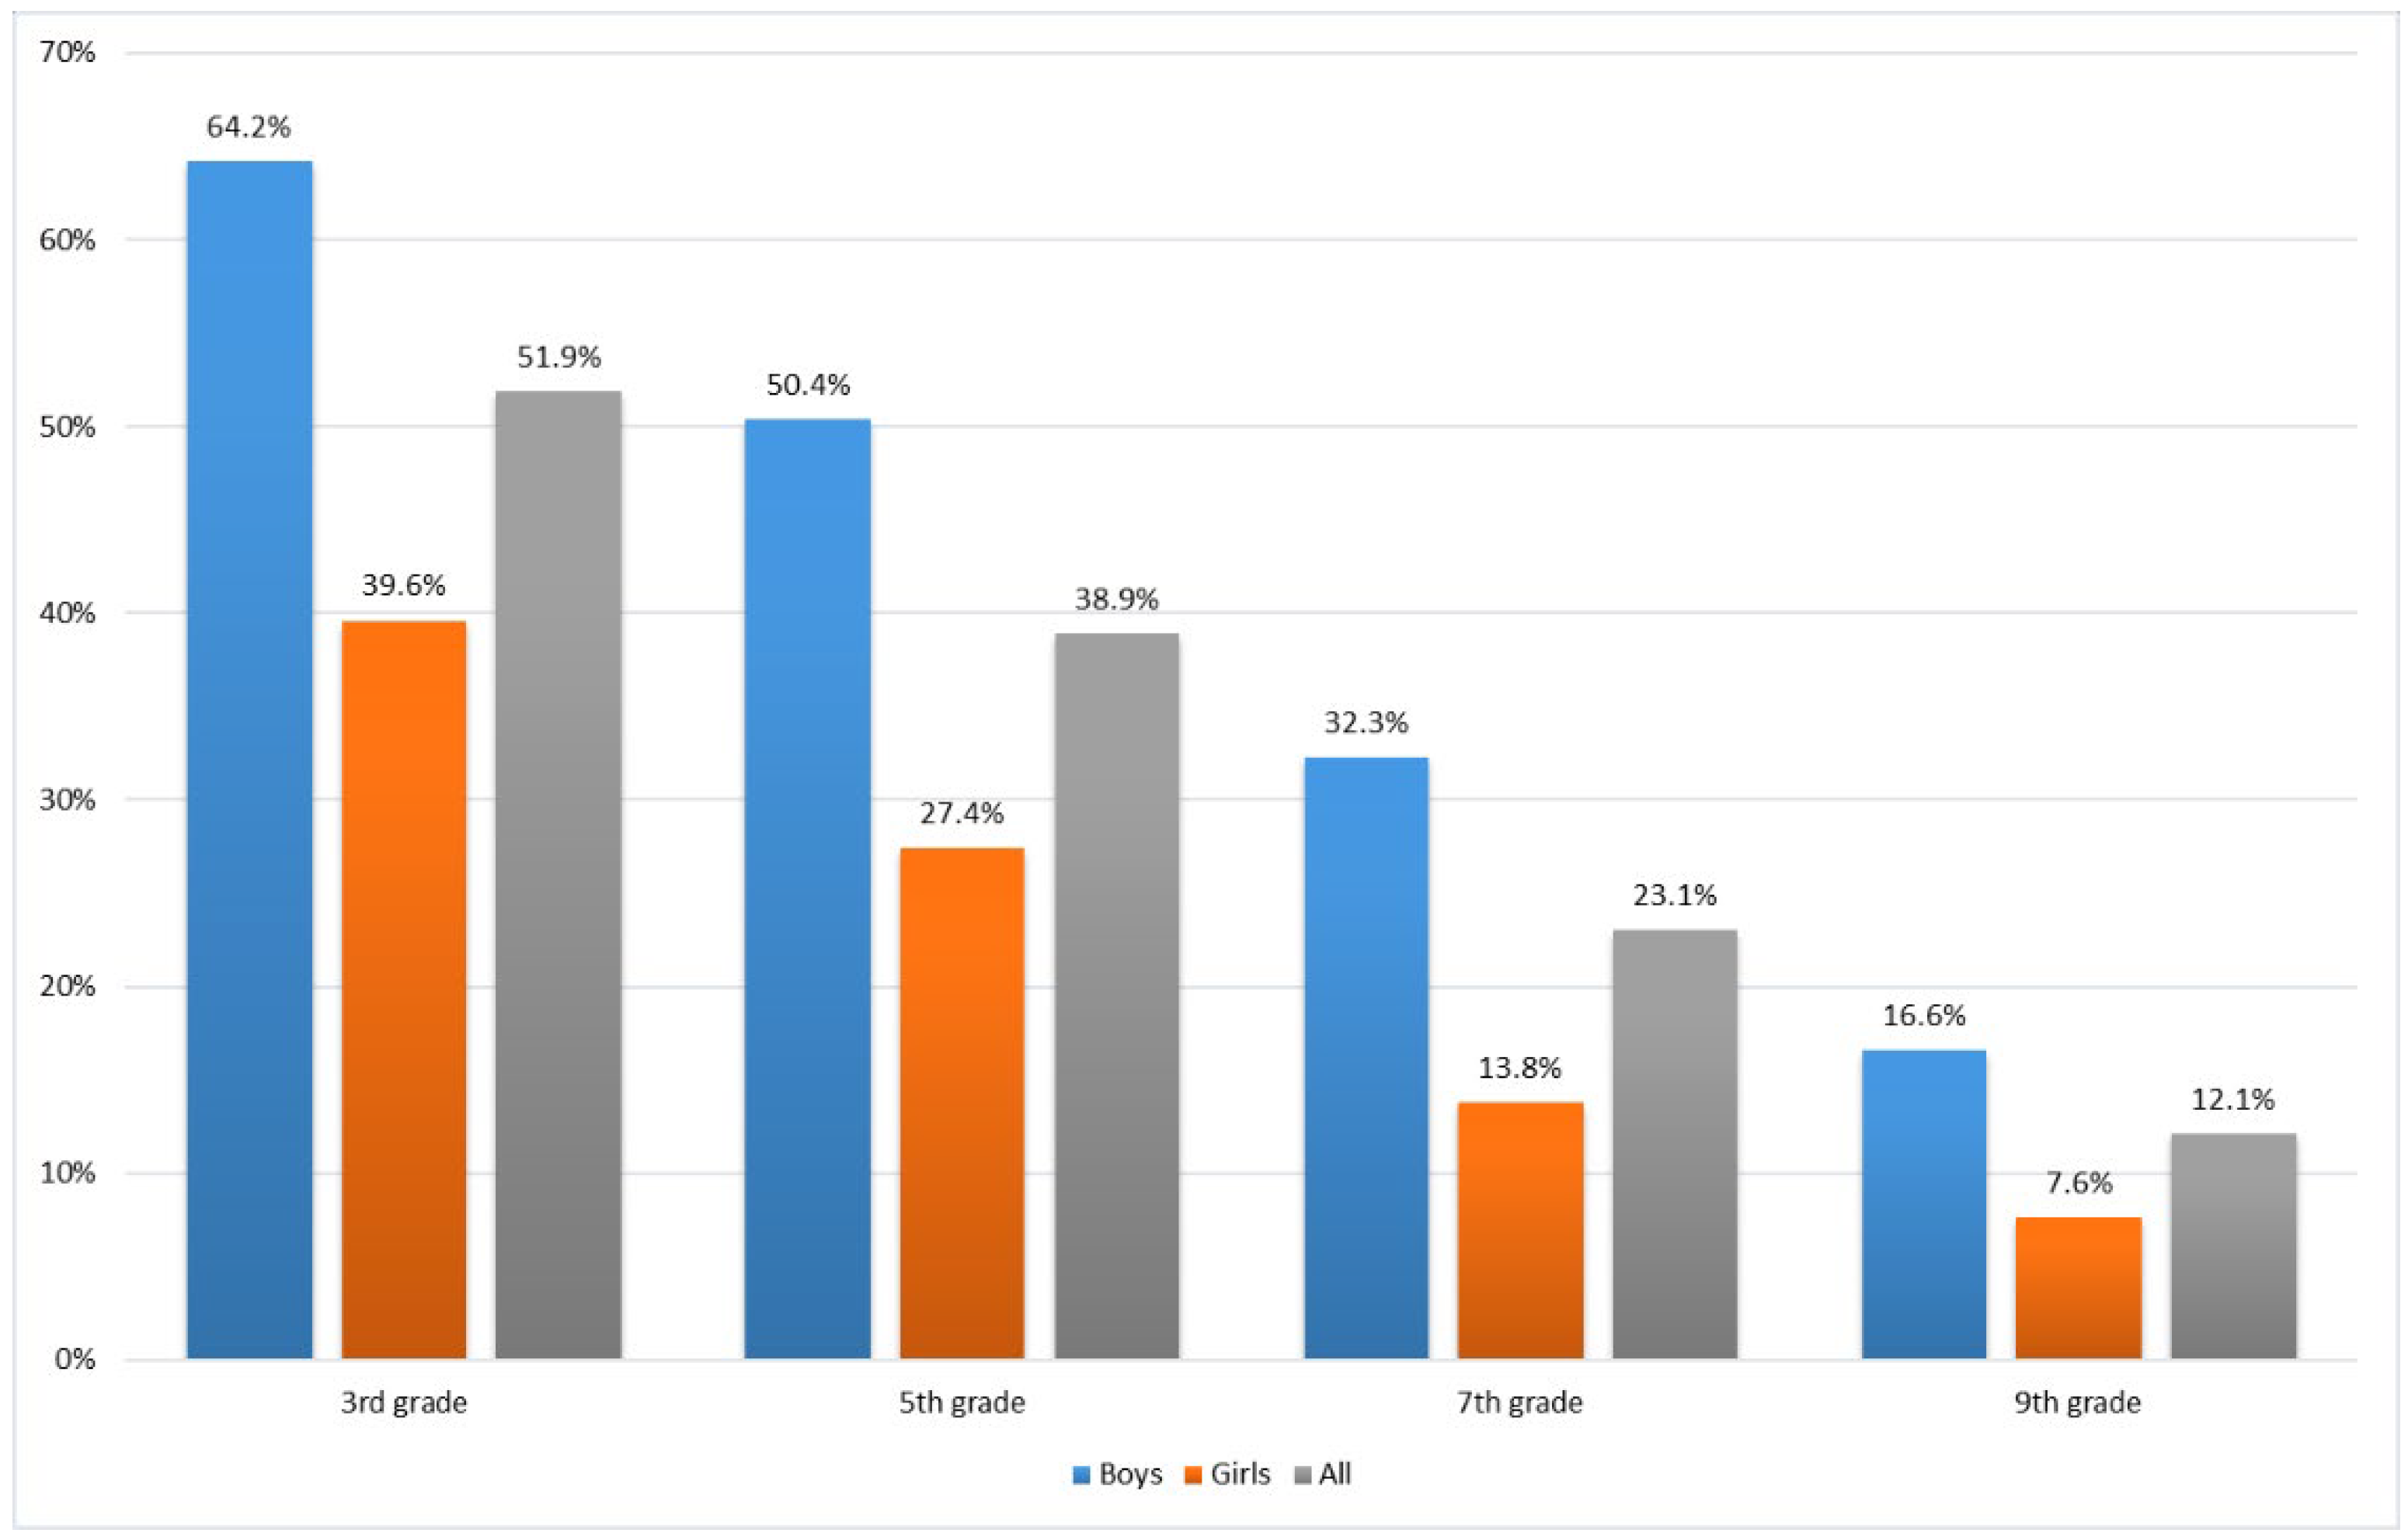
- Roberts, K.C.; Yao, X.; Carson, V.; Chaput, J.P.; Janssen, I.; Tremblay, M.S. Meeting the Canadian 24-hour movement guidelines for children and youth. Health Rep. 2017, 28, 3–7. [Google Scholar]
- Loyen, A.; Van Hecke, L.; Verloigne, M.; Hendriksen, I.; Lakerveld, J.; Steene-Johannessen, J.; Vuillemin, A.; Koster, A.; Donnelly, A.; Ekelund, A.; et al. Variation in population levels of physical activity in European adults according to cross-European studies: A systematic literature review within DEDIPAC. Int. J. Behav. Nutr. Phys. Act. 2016, 13, 72. [Google Scholar] [CrossRef] [Green Version]
- Steene-Johannessen, J.; Hansen, B.H.; Dalene, K.E.; Kolle, E.; Northstone, K.; Møller, N.C.; Grøntved, A.; Wedderkopp, N.; Kriemler, S.; Page, A.S.; et al. Variations in accelerometry measured physical activity and sedentary time across Europe–harmonized analyses of 47,497 children and adolescents. Int. J. Behav. Nutr. Phys. Act. 2020, 17, 38. [Google Scholar] [CrossRef] [PubMed] [Green Version]
- Cameron, C.; Craig, C.; Bauman, A.; Tudor-Locke, C. CANPLAY study: Secular trends in steps/day amongst 5–19 year-old Canadians between 2005 and 2014. Prev. Med. 2016, 86, 28–33. [Google Scholar] [CrossRef]
- Ishii, K.; Shibata, A.; Adachi, M.; Nonoue, K.; Oka, K. Gender and grade differences in objectively measured physical activity and sedentary behavior patterns among Japanese children and adolescents: A cross-sectional study. BMC Public Health 2015, 15, 1254. [Google Scholar] [CrossRef] [PubMed] [Green Version]
- Beets, M.W.; Bornstein, D.; Beighle, A.; Cardinal, B.J.; Morgan, C.F. Pedometer-measured physical activity patterns of youth: A 13-country review. Am. J. Prev. Med. 2010, 38, 208–216. [Google Scholar] [CrossRef] [PubMed]
- Vasankari, V.; Husu, P.; Vähä-Ypyä, H.; Suni, J.H.; Tokola, K.; Borodulin, K.; Wennman, H.; Halonen, J.; Hartikainen, J.; Sievänen, H.; et al. Subjects with cardiovascular disease or high disease risk are more sedentary and less active than their healthy peers. BMJ Open Sport Exerc. Med. 2018, 10, e000363. [Google Scholar] [CrossRef]
- Brooke, H.L.; Corder, K.; Atkin, A.J.; van Sluijs, E.M. A systematic literature review with meta-analyses of within and between-day differences in objectively measured physical activity in school-aged children. Sports Med. 2014, 44, 1427–1438. [Google Scholar] [CrossRef] [Green Version]
- Fairclough, S.J.; Boddy, L.M.; Mackintosh, K.A.; Valencia-Peris, A.; Ramirez-Rico, E. Weekday and weekend sedentary time and physical activity in differentially active children. J. Sci. Med. Sport. 2015, 18, 444–449. [Google Scholar] [CrossRef] [Green Version]
- Garriguet, D.; Colley, R.C. Daily patterns of physical activity among Canadians. Health Rep. 2012, 23, 27–32. [Google Scholar] [PubMed]
- Mehtälä, M.A.K.; Villberg, J.; Blomqvist, M.; Huotari, P.; Jaakkola, T.; Koski, P.; Lintunen, T.; Mononen, K.; Ng, K.; Palomäki, S.; et al. Individual- and environmental-related correlates of moderate-to-vigorous physical activity in 11-, 13-, and 15-year-old Finnish children. PLoS ONE 2020, 15, e0234686. [Google Scholar] [CrossRef]
- Brooke, H.L.; Atkin, A.J.; Corder, K.; Ekelund, U.; van Sluijs, E.M. Changes in time-segment specific physical activity between ages 10 and 14 years: A longitudinal observational study. J. Sci. Med. Sport. 2016, 19, 29–34. [Google Scholar] [CrossRef] [Green Version]
- Dobbins, M.; Husson, H.; DeCorby, K.; LaRocca, R.L. School-based physical activity programs for promoting physical activity and fitness in children and adolescents aged 6 to 18. Cochrane Database Syst. Rev. 2013, 2, CD007651. [Google Scholar] [CrossRef]
- Rhodes, R.E.; Guerrero, M.D.; Vanderloo, L.M.; Barbeau, K.; Birken, C.S.; Chaput, J.-P.; Faulkner, G.; Janssen, I.; Madigan, S.; Mâsse, L.; et al. Development of a consensus statement on the role of the family in the physical activity, sedentary, and sleep behaviours of children and youth. Int. J. Behav. Nutr. Phys. Act. 2020, 17, 74. [Google Scholar] [CrossRef] [PubMed]
- James, M.; Todd, C.; Scott, S.; Stratton, G.; McCoubrey, S.; Christian, D.; Halcox, J.; Audrey, S.; Ellins, E.; Anderson, S.; et al. Teenage recommendations to improve physical activity for their age group: A qualitative study. BMC Public Health 2018, 18, 372. [Google Scholar] [CrossRef] [PubMed]


| (A) The amount of the days (%) that 3274 participants used accelerometer by grade and sex | ||||||||||||
| 3rd grade | 5th grade | 7th grade | 9th grade | |||||||||
| Wearing days | Boys | Girls | All | Boys | Girls | All | Boys | Girls | All | Boys | Girls | All |
| 1–3 | 11 | 7 | 8 | 6 | 5 | 5 | 15 | 10 | 12 | 18 | 8 | 12 |
| 4 | 6 | 8 | 7 | 9 | 9 | 9 | 11 | 6 | 8 | 10 | 11 | 10 |
| 5 | 13 | 15 | 14 | 17 | 18 | 18 | 17 | 17 | 17 | 17 | 17 | 17 |
| 6 | 28 | 27 | 28 | 25 | 29 | 27 | 27 | 25 | 26 | 22 | 26 | 24 |
| 7 | 43 | 43 | 43 | 43 | 39 | 41 | 29 | 42 | 37 | 33 | 39 | 37 |
| n | 441 | 536 | 977 | 443 | 519 | 962 | 302 | 480 | 782 | 214 | 339 | 553 |
| (B) The average wearing time of those 2981 participants who used the accelerometer at least four days and at least 10 h per day | ||||||||||||
| 3rd grade | 5th grade | 7th grade | 9th grade | |||||||||
| Boys | Girls | All | Boys | Girls | All | Boys | Girls | All | Boys | Girls | All | |
| h:min/day | 13:52 | 13:46 | 13:49 | 14:02 | 13:55 | 13:58 | 14:07 | 14:16 | 14:13 | 14:18 | 14:12 | 14:14 |
| n | 394 | 500 | 894 | 416 | 495 | 911 | 257 | 431 | 688 | 176 | 312 | 488 |
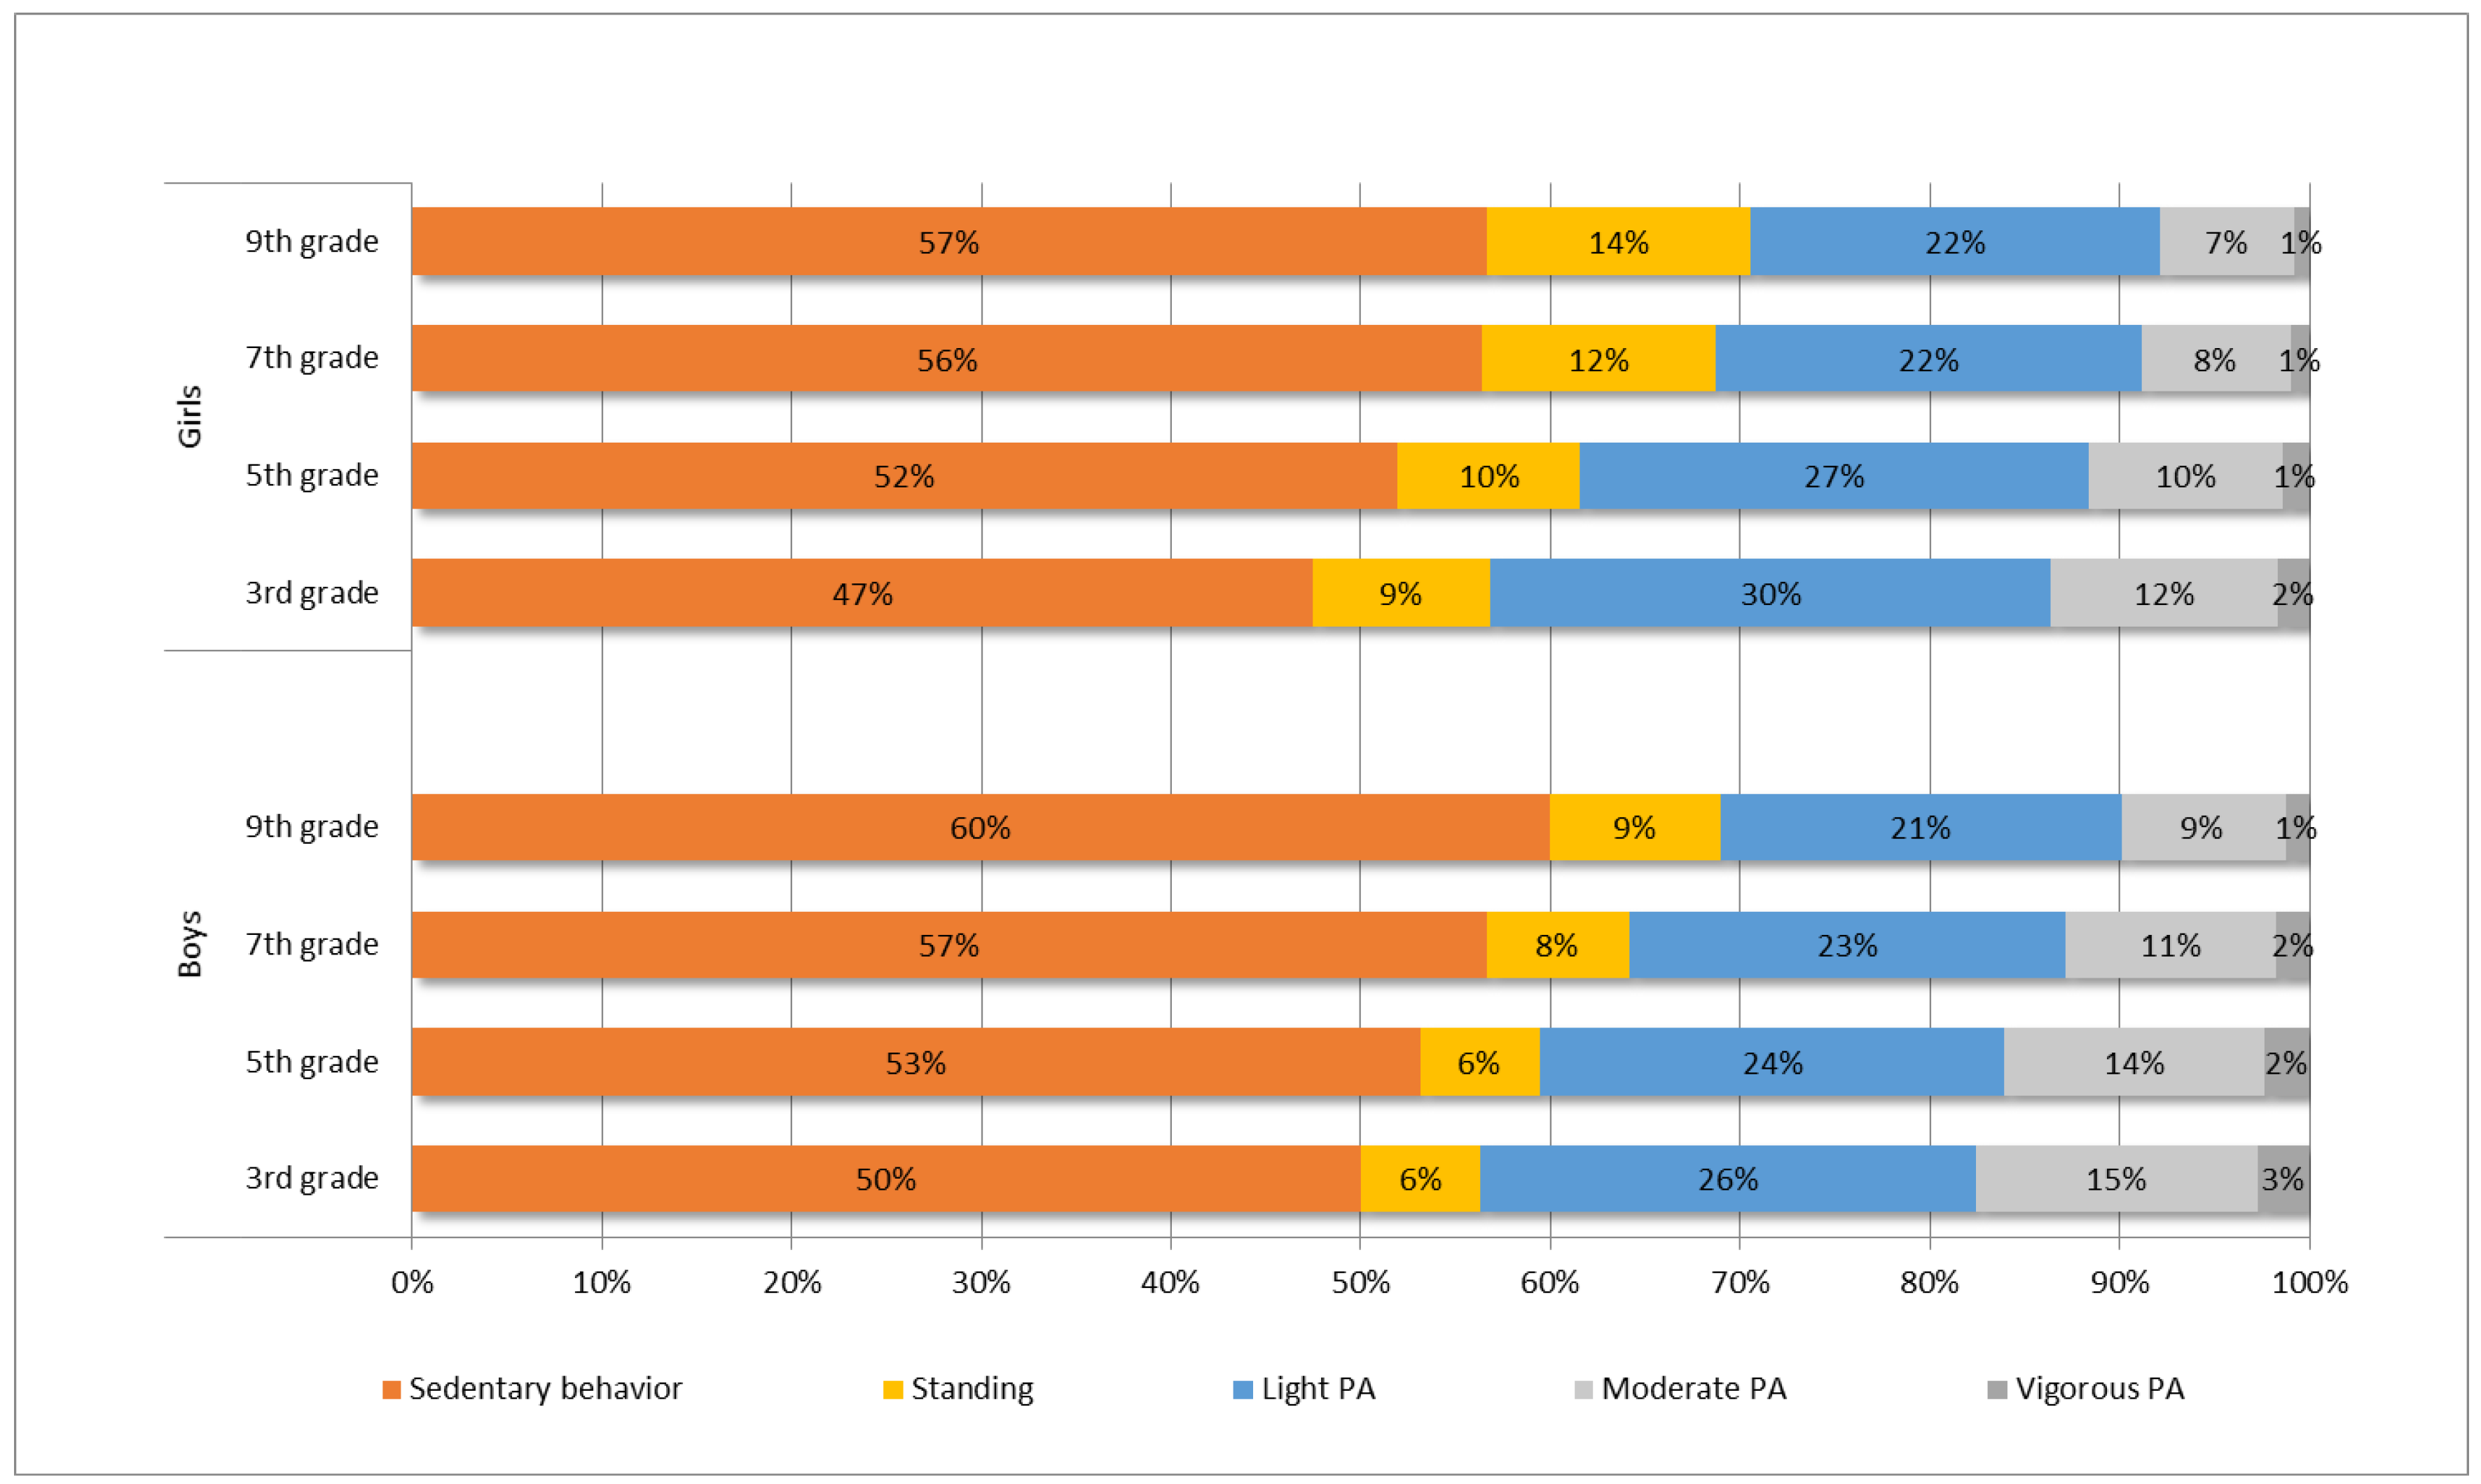
| Grade | Boys Mean (sd) | Girls Mean (sd) | p-Value for SEX Difference ¶ | All Mean (sd) | p-Value for Grade Difference ¶,§ | |
|---|---|---|---|---|---|---|
| Sedentary behavior (sitting, laying down) † | 3 | 6:56 (1:34) | 6:32 (1:22) | <0.001 | 6:44 (1:28) | reference |
| 5 | 7:27 (1:41) | 7:14 (1:28) | 0.044 | 7:21 (1:34) | <0.001 | |
| 7 | 8:00 (1:32) | 8:03 (1:25) | 0.812 | 8:01 (1:28) | <0.001 | |
| 9 | 8:35 (1:40) | 8:03 (1:24) | <0.001 | 8:19 (1:32) | <0.001 | |
| All | 7:42 (1:44) | 7:30 (1:32) | 0.002 | 7:27 (1:36) | ||
| Standing † | 3 | 0:53 (0:28) | 1:17 (0:32) | <0.001 | 1:05 (0:38) | reference |
| 5 | 0:53 (0:28) | 1:20 (0:32) | <0.001 | 1:07 (0:30) | 0.562 | |
| 7 | 1:04 (0:30) | 1:46 (0:42) | <0.001 | 1:25 (0:36) | <0.001 | |
| 9 | 1:18 (0:38) | 1:58 (0:51) | <0.001 | 1:38 (0:45) | <0.001 | |
| All | 1:01 (0:31) | 1:36 (0:44) | <0.001 | 1:18 (0:41) | ||
| Light PA † | 3 | 3:38 (0:35) | 4:04 (0:38) | <0.001 | 3:51 (0:36) | reference |
| 5 | 3:26 (0:37) | 3:44 (0:36) | <0.001 | 3:35 (0:37) | <0.001 | |
| 7 | 3:15 (0:43) | 3:12 (0:37) | 0.641 | 3:13 (0:40) | <0.001 | |
| 9 | 3:01 (0:50) | 3:04 (0:42) | 0.330 | 3:02 (0:46) | <0.001 | |
| All | 3:20 (0:44) | 3:30 (0:45) | <0.001 | 3:31 (0:44) | ||
| Moderate PA † | 3 | 2:03 (0:35) | 1:38 (0:27) | <0.001 | 1:51 (0:31) | reference |
| 5 | 1:55 (0:33) | 1:26 (0:24) | <0.001 | 1:40 (0:29) | <0.001 | |
| 7 | 1:34 (0:36) | 1:07 (0:23) | <0.001 | 1:21 (0:29) | <0.001 | |
| 9 | 1:14 (0:33) | 1:00 (0:23) | <0.001 | 1:07 (0:28) | <0.001 | |
| All | 1:43 (0:39) | 1:17 (0:28) | <0.001 | 1:32 (0:36) | ||
| Vigorous PA † | 3 | 0:23 (0:16) | 0:14 (0:11) | <0.001 | 0:18 (0:14) | reference |
| 5 | 0:20 (0:16) | 0:12 (0:10) | <0.001 | 0:16 (0:13) | <0.001 | |
| 7 | 0:15 (0:13) | 0:08 (0:09) | <0.001 | 0:11 (0:11) | <0.001 | |
| 9 | 0:11 (0:11) | 0:07 (0:07) | <0.001 | 0:09 (0:09) | <0.001 | |
| All | 0:17 (0:15) | 0:10 (0:10) | <0.001 | 0:14 (0:13) | ||
| Steps ‡ | 3 | 12,498 (3419) | 10,345 (2532) | <0.001 | 11,421 (2975) | reference |
| 5 | 11,909 (3421) | 9476 (2330) | <0.001 | 10,692 (2876) | <0.001 | |
| 7 | 10,034 (3225) | 8483 (2529) | <0.001 | 9258 (2877) | <0.001 | |
| 9 | 8513 (3386) | 7927 (2658) | 0.027 | 8220 (3022) | <0.001 | |
| All | 10,824 (3743) | 9040 (2669) | <0.001 | 9890 (3339) |
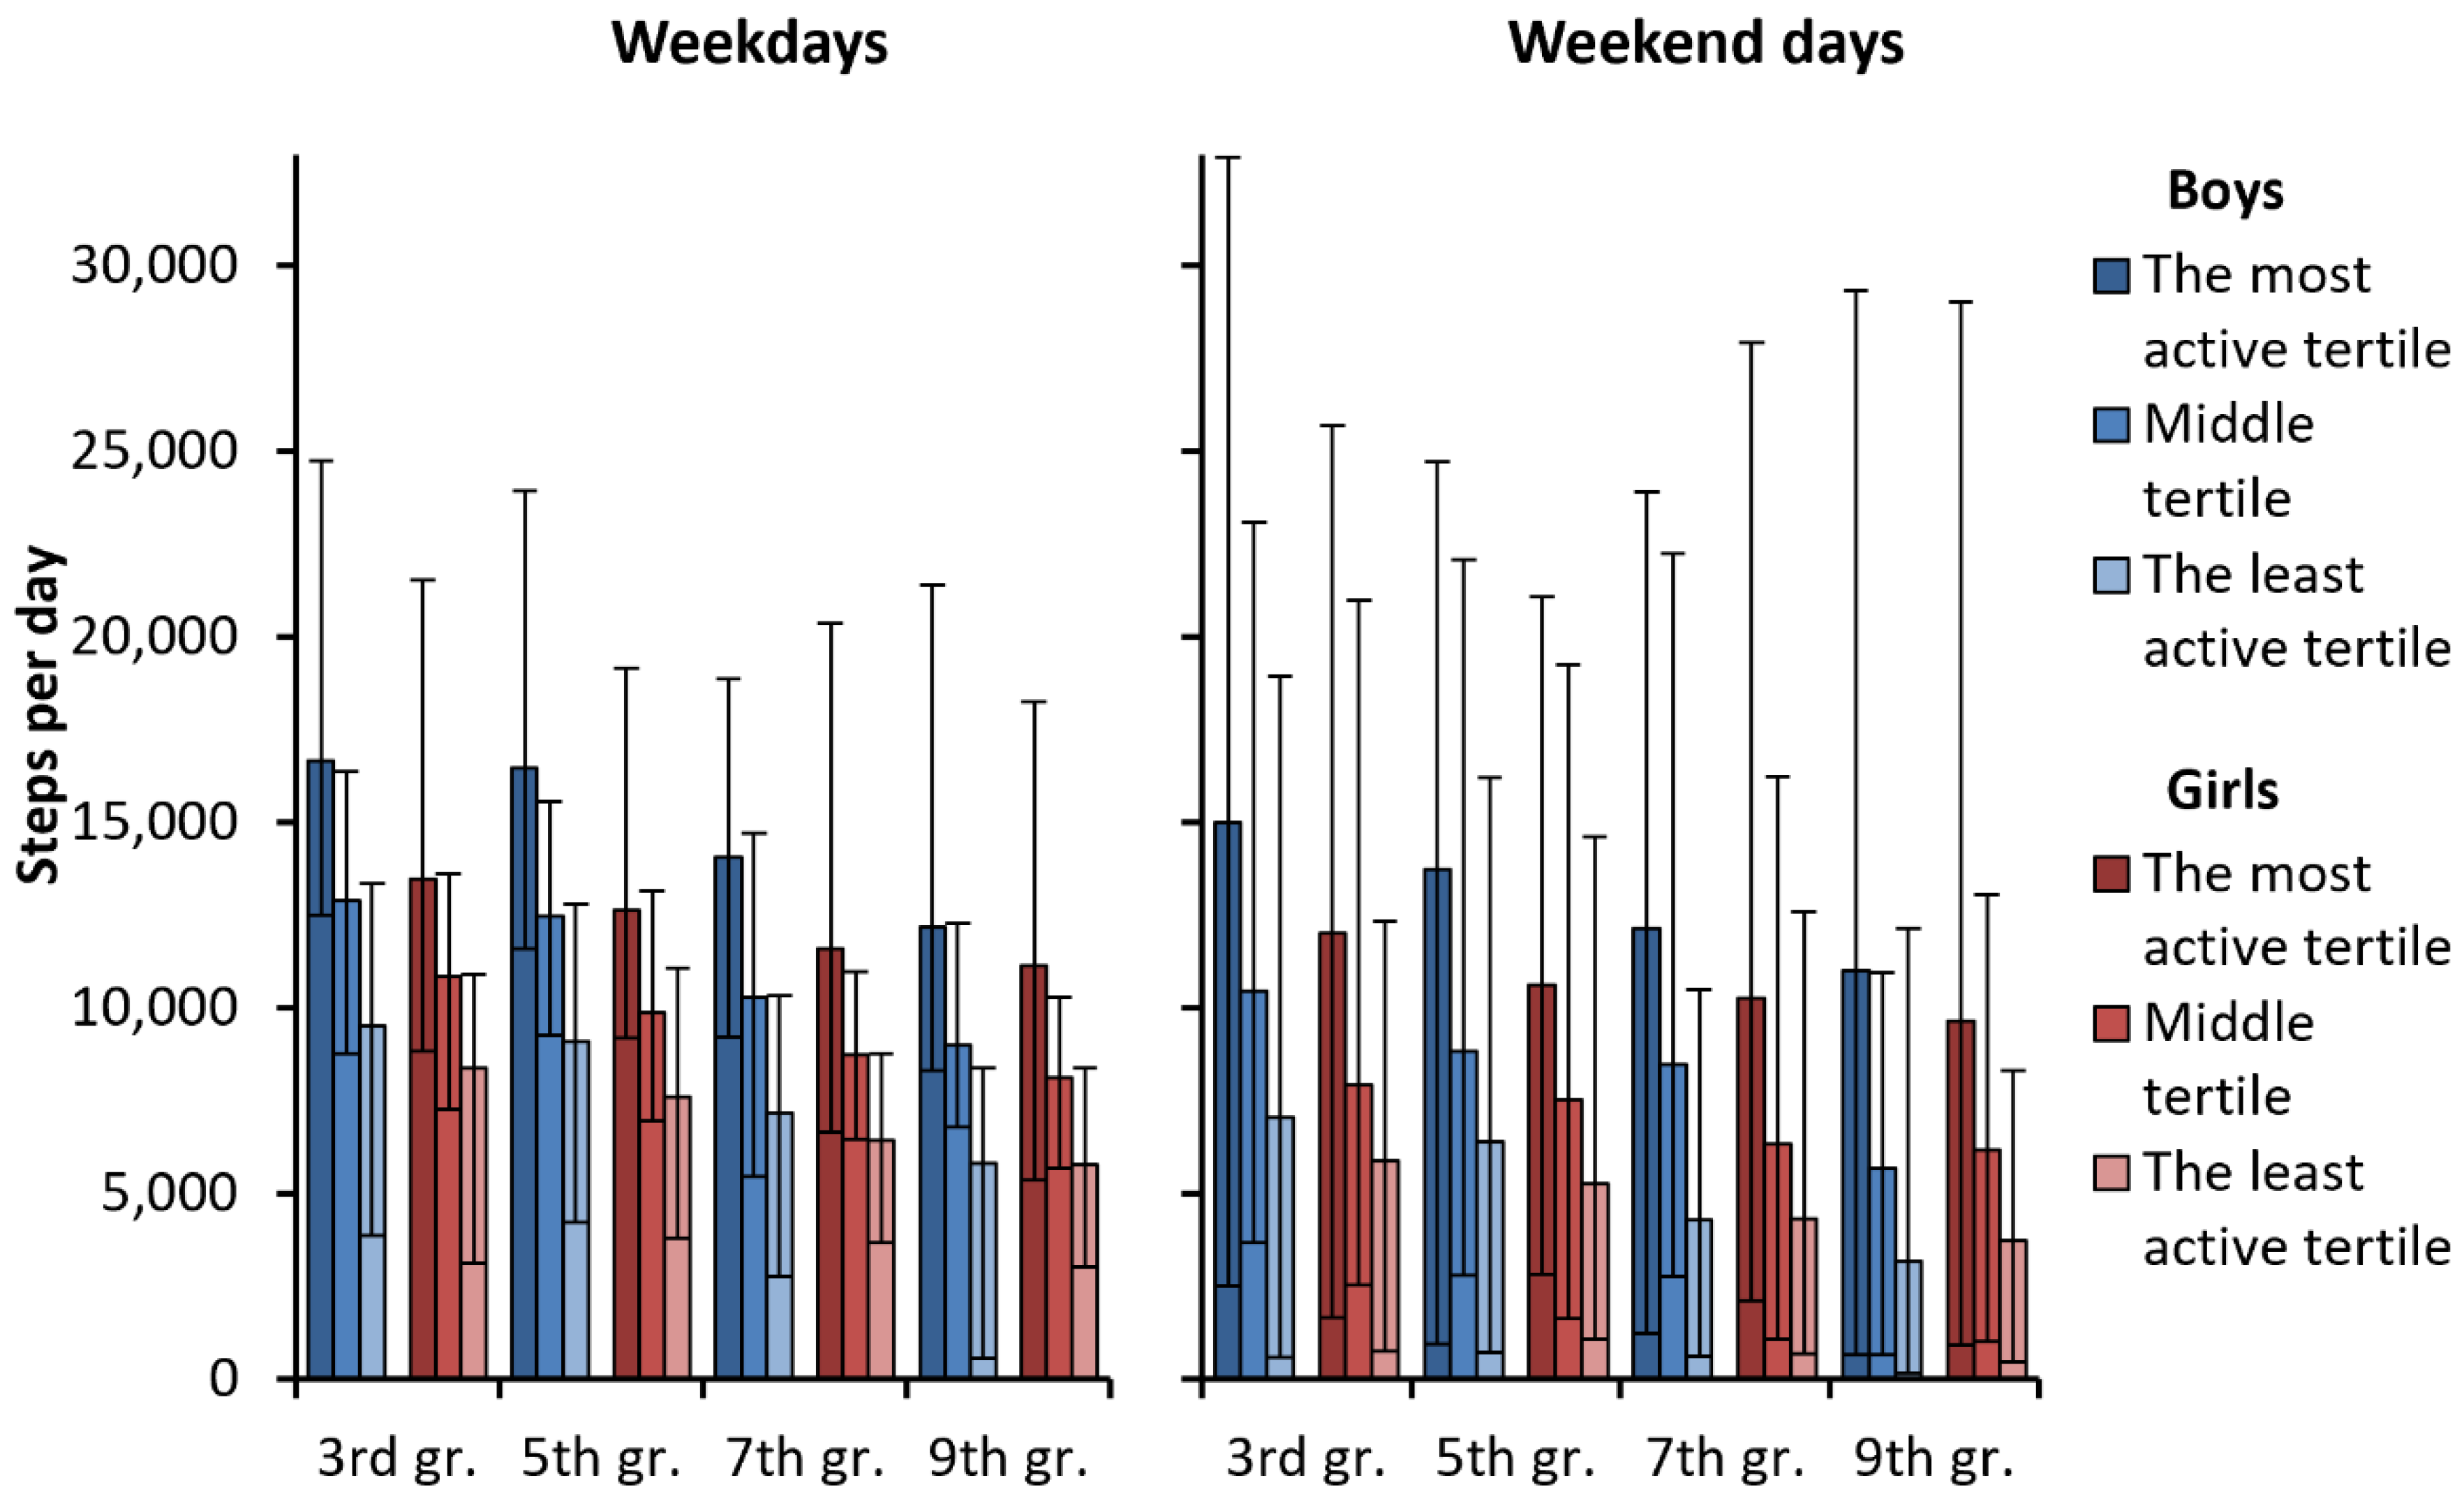
| Boys | ||||
| 3rd grade | 5th grade | 7th grade | 9th grade | |
| the most active group | ≥13,465 | ≥12,943 | ≥11,1889 | ≥9233 |
| the middle group | 13,464–10,950 | 12,942–10,056 | 11,188–8217 | 9232–6493 |
| the least active group | ≤10,949 | ≤10,055 | ≤8216 | ≤6492 |
| Girls | ||||
| 3rd grade | 5th grade | 7th grade | 9th grade | |
| the most active group | ≥11,058 | ≥10,100 | ≥9212 | ≥8419 |
| the middle group | 11,057–9048 | 10,099–8146 | 9211–7047 | 8418–6494 |
| the least active group | ≤9047 | ≤8145 | ≤7046 | ≤6493 |
Publisher’s Note: MDPI stays neutral with regard to jurisdictional claims in published maps and institutional affiliations. |
© 2022 by the authors. Licensee MDPI, Basel, Switzerland. This article is an open access article distributed under the terms and conditions of the Creative Commons Attribution (CC BY) license (https://creativecommons.org/licenses/by/4.0/).
Share and Cite
Jussila, A.-M.; Husu, P.; Vähä-Ypyä, H.; Tokola, K.; Kokko, S.; Sievänen, H.; Vasankari, T. Accelerometer-Measured Physical Activity Levels and Patterns Vary in an Age- and Sex-Dependent Fashion among Finnish Children and Adolescents. Int. J. Environ. Res. Public Health 2022, 19, 6950. https://doi.org/10.3390/ijerph19116950
Jussila A-M, Husu P, Vähä-Ypyä H, Tokola K, Kokko S, Sievänen H, Vasankari T. Accelerometer-Measured Physical Activity Levels and Patterns Vary in an Age- and Sex-Dependent Fashion among Finnish Children and Adolescents. International Journal of Environmental Research and Public Health. 2022; 19(11):6950. https://doi.org/10.3390/ijerph19116950
Chicago/Turabian StyleJussila, Anne-Mari, Pauliina Husu, Henri Vähä-Ypyä, Kari Tokola, Sami Kokko, Harri Sievänen, and Tommi Vasankari. 2022. "Accelerometer-Measured Physical Activity Levels and Patterns Vary in an Age- and Sex-Dependent Fashion among Finnish Children and Adolescents" International Journal of Environmental Research and Public Health 19, no. 11: 6950. https://doi.org/10.3390/ijerph19116950
APA StyleJussila, A.-M., Husu, P., Vähä-Ypyä, H., Tokola, K., Kokko, S., Sievänen, H., & Vasankari, T. (2022). Accelerometer-Measured Physical Activity Levels and Patterns Vary in an Age- and Sex-Dependent Fashion among Finnish Children and Adolescents. International Journal of Environmental Research and Public Health, 19(11), 6950. https://doi.org/10.3390/ijerph19116950