Article

The Elemental Characteristics and Human Health Risk of PM2.5 during Haze Episode and Non-Haze Episode in Chiang Rai Province, Thailand

by
Sarima Niampradit
1,
Wissanupong Kliengchuay
1,
Rachaneekorn Mingkhwan
1,
Suwalee Worakhunpiset
1,
Nuttapohn Kiangkoo
1,
Suntorn Sudsandee
2,
Anuttara Hongthong
2,
Weerayuth Siriratruengsuk
2,
Thunyaluk Muangsuwan
3 and
Kraichat Tantrakarnapa
1,*
1
Department of Social and Environmental Medicine, Faculty of Tropical Medicine, Mahidol University, Bangkok 10400, Thailand
2
School of Health Science, Mae Fah Luang University, Chiang Rai 57100, Thailand
3
National Science and Technology Development Agency, Pathum Thani 12120, Thailand
*
Author to whom correspondence should be addressed.
Int. J. Environ. Res. Public Health 2022, 19(10), 6127; https://doi.org/10.3390/ijerph19106127
Submission received: 18 March 2022 / Revised: 12 May 2022 / Accepted: 15 May 2022 / Published: 18 May 2022
(This article belongs to the Special Issue Air Pollution: Occupational Exposure and Public Health)

Abstract

:
Fine particle matter (PM2.5) was directly related to seasonal weather, and has become the influencing factor of air quality that is harmful for human health in Chiang Rai province. The aims were determining the elemental composition in PM2.5 and human health risk in haze (March 2021) and non-haze episodes (July–August 2021). Nine elements in PM2.5 were measured by using an Atomic Absorption Spectrophotometer, and an enrichment factor was used to identify the emission source. The results showed that the average concentration of PM2.5 was 63.07 μg/m3 in haze episodes, and 25.00 μg/m3 in a non-haze episode. The maximum concentration was 116.7 μg/m3 in March. The majority of elements originated from anthropogenic sources. In haze episodes, PM2.5 mean concentration was approximately 4.2 times that of the WHO guidelines (15 μg/m3 24 h), and 1.3 times that of the Thai Ambient Air Quality Standard (50 μg/m3). The analysis of backward air mass trajectory showed that transboundary and local sources significantly influenced PM2.5 at the monitoring site in the sampling period. In the health risk assessment, the non-carcinogenic risk of Cd was the highest, with a Hazard Quotient (HQ) of 0.048, and the cancer risk of Cr was classified as the highest cancer risk, with the values of 1.29 × 10⁻⁵, higher than the minimum acceptable level.

Graphical Abstract

1. Introduction

Currently, air pollution is one of the world’s most enormous environmental problems. An average of 7 million people across the globe die prematurely from breathing air containing a high level of pollutants every year [1]. The critical air pollutants were gaseous (e.g., sulfur dioxide, carbon monoxide, nitrogen oxides, ozone, and volatile organic compounds), persistent organic pollutants, heavy metals, and particulate matter [2]. One of the harmful airborne pollutants is particulate matter (PM), which can have a severe adverse health effect on humans [3,4]. PM can be classified in to different sizes, in general it is usually classified into PM10 and PM2.5 depending on the particle size. PM10 is a particle or droplet in the air with a diameter between 2.5 and 10 μm, and is commonly called coarse particulate matter. PM2.5, or fine particulate matter, consists of particles or droplets in the air with a diameter of less than 2.5 μm. Many previous studies found that a high PM concentration is associated with an increased risk of mortality and morbidity [5]. Approximately 3% of cardiopulmonary and 5% of lung cancer mortality worldwide are caused by PM [6]. It was reported that the increased level of PM10 by 10 μg/m3 led to a 0.2–0.6% increase in all-cause daily mortality. Prolonged exposure to PM2.5 is related to an increased 6–13% in the risk of cardiopulmonary mortality per 10 μg/m3 of PM2.5 [7]. Several previous studies showed the association between PM concentrations and adverse human health effects, especially particles with a diameter below 2.5 µm, which easily enters the human lungs and penetrates the alveoli, then diffuses into the capillaries and directly affects the blood circulation system [3,8]. This is because the smaller size and larger surface area of PM2.5 contribute to a great potential for adsorbing other pollutants, including PAHs and heavy metals, and promote their transport into the human body [9]. There is evidence that PM2.5 mainly decreases the vital capacity of lung function [10], induces lung cancer, and is associated with cardiovascular disease and both chronic and acute respiratory diseases [11,12,13]. Both natural sources (e.g., mineral dust, volcanic eruption, sea salt, and forest fire) and anthropogenic sources (e.g., charcoal combustion and vehicle emission) [14] are responsible for PM emissions into the air. The chemical components in PM2.5 are varied according to the source’s properties. Heavy metal composition in PM2.5 mainly originates from anthropogenic sources, including fossil fuel combustion emissions from vehicles and industrial sources. Moreover, the resuspended surface dust is also one of the contributions of releasing heavy metals into the atmosphere [15].
Several studies confirmed that exposure to some elemental compositions of PM2.5 could cause severe respiratory health effects [16]. PM2.5 contains a high level of toxic trace elements, for example, Cadmium (Cd), Chromium (Cr), Copper (Cu), Potassium (K), Manganese (Mn), Nickel (Ni), Lead (Pb), and Zinc (Zn). These toxic heavy metals bound to PM2.5 could enter the body through the inhalation route and cause health effects. For example, Cd can be absorbed into the blood circulation from the lung and accumulated in the kidney. Long-term results from Cd accumulation were tubular necrosis and diabetic nephropathy [17]. Mn exposure through the inhalation route was more rapidly transported to the brain, and can cause the neurobehavioral dysfunction that leads to Parkinson’s disease [18]. Pb accumulated in the skeleton and long-term Pb accumulation can affect the cardiovascular and nervous system [19]. One of the health effects associated with Ni exposure after inhalation is lung inflammation leading to lung and nasal cancer [20]. Cr was associated with tumors in respiratory and nasal tracts. Cu is essential to use iron and in the formation of hemoglobin. An excess concentration of Cu in the liver can cause hepatitis, leading to liver failure [21]. Zn is required for the cofactor of enzymes for the metabolism of protein. The level of Zn in atmospheric particles induces lung cell injury and inflammation [22].
Thailand has been facing air pollution problems, especially in the northern part, including Chiang Mai, Chiang Rai, Lampang, Lamphun, Mae Hong Son, Nan, Payao, and Phrae Province [23,24,25,26]. A haze episode is classified by a concentration of PM2.5 or PM10 that exceeds the National Ambient Air Quality Standard (NAAQS) given by the Thailand Pollution Control Department (PCD). The daily ambient standards of PM2.5 and PM10 are 50 and 120 μg/m3, respectively [27]. During the haze episode, we found the number of days that the PM2.5 concentration was higher than the standard. Chiang Rai is also one of the provinces included in the mentioned criteria. We would like to investigate the effect of exposure to the elemental composition in PM2.5 on human health.

2. Materials and Methods
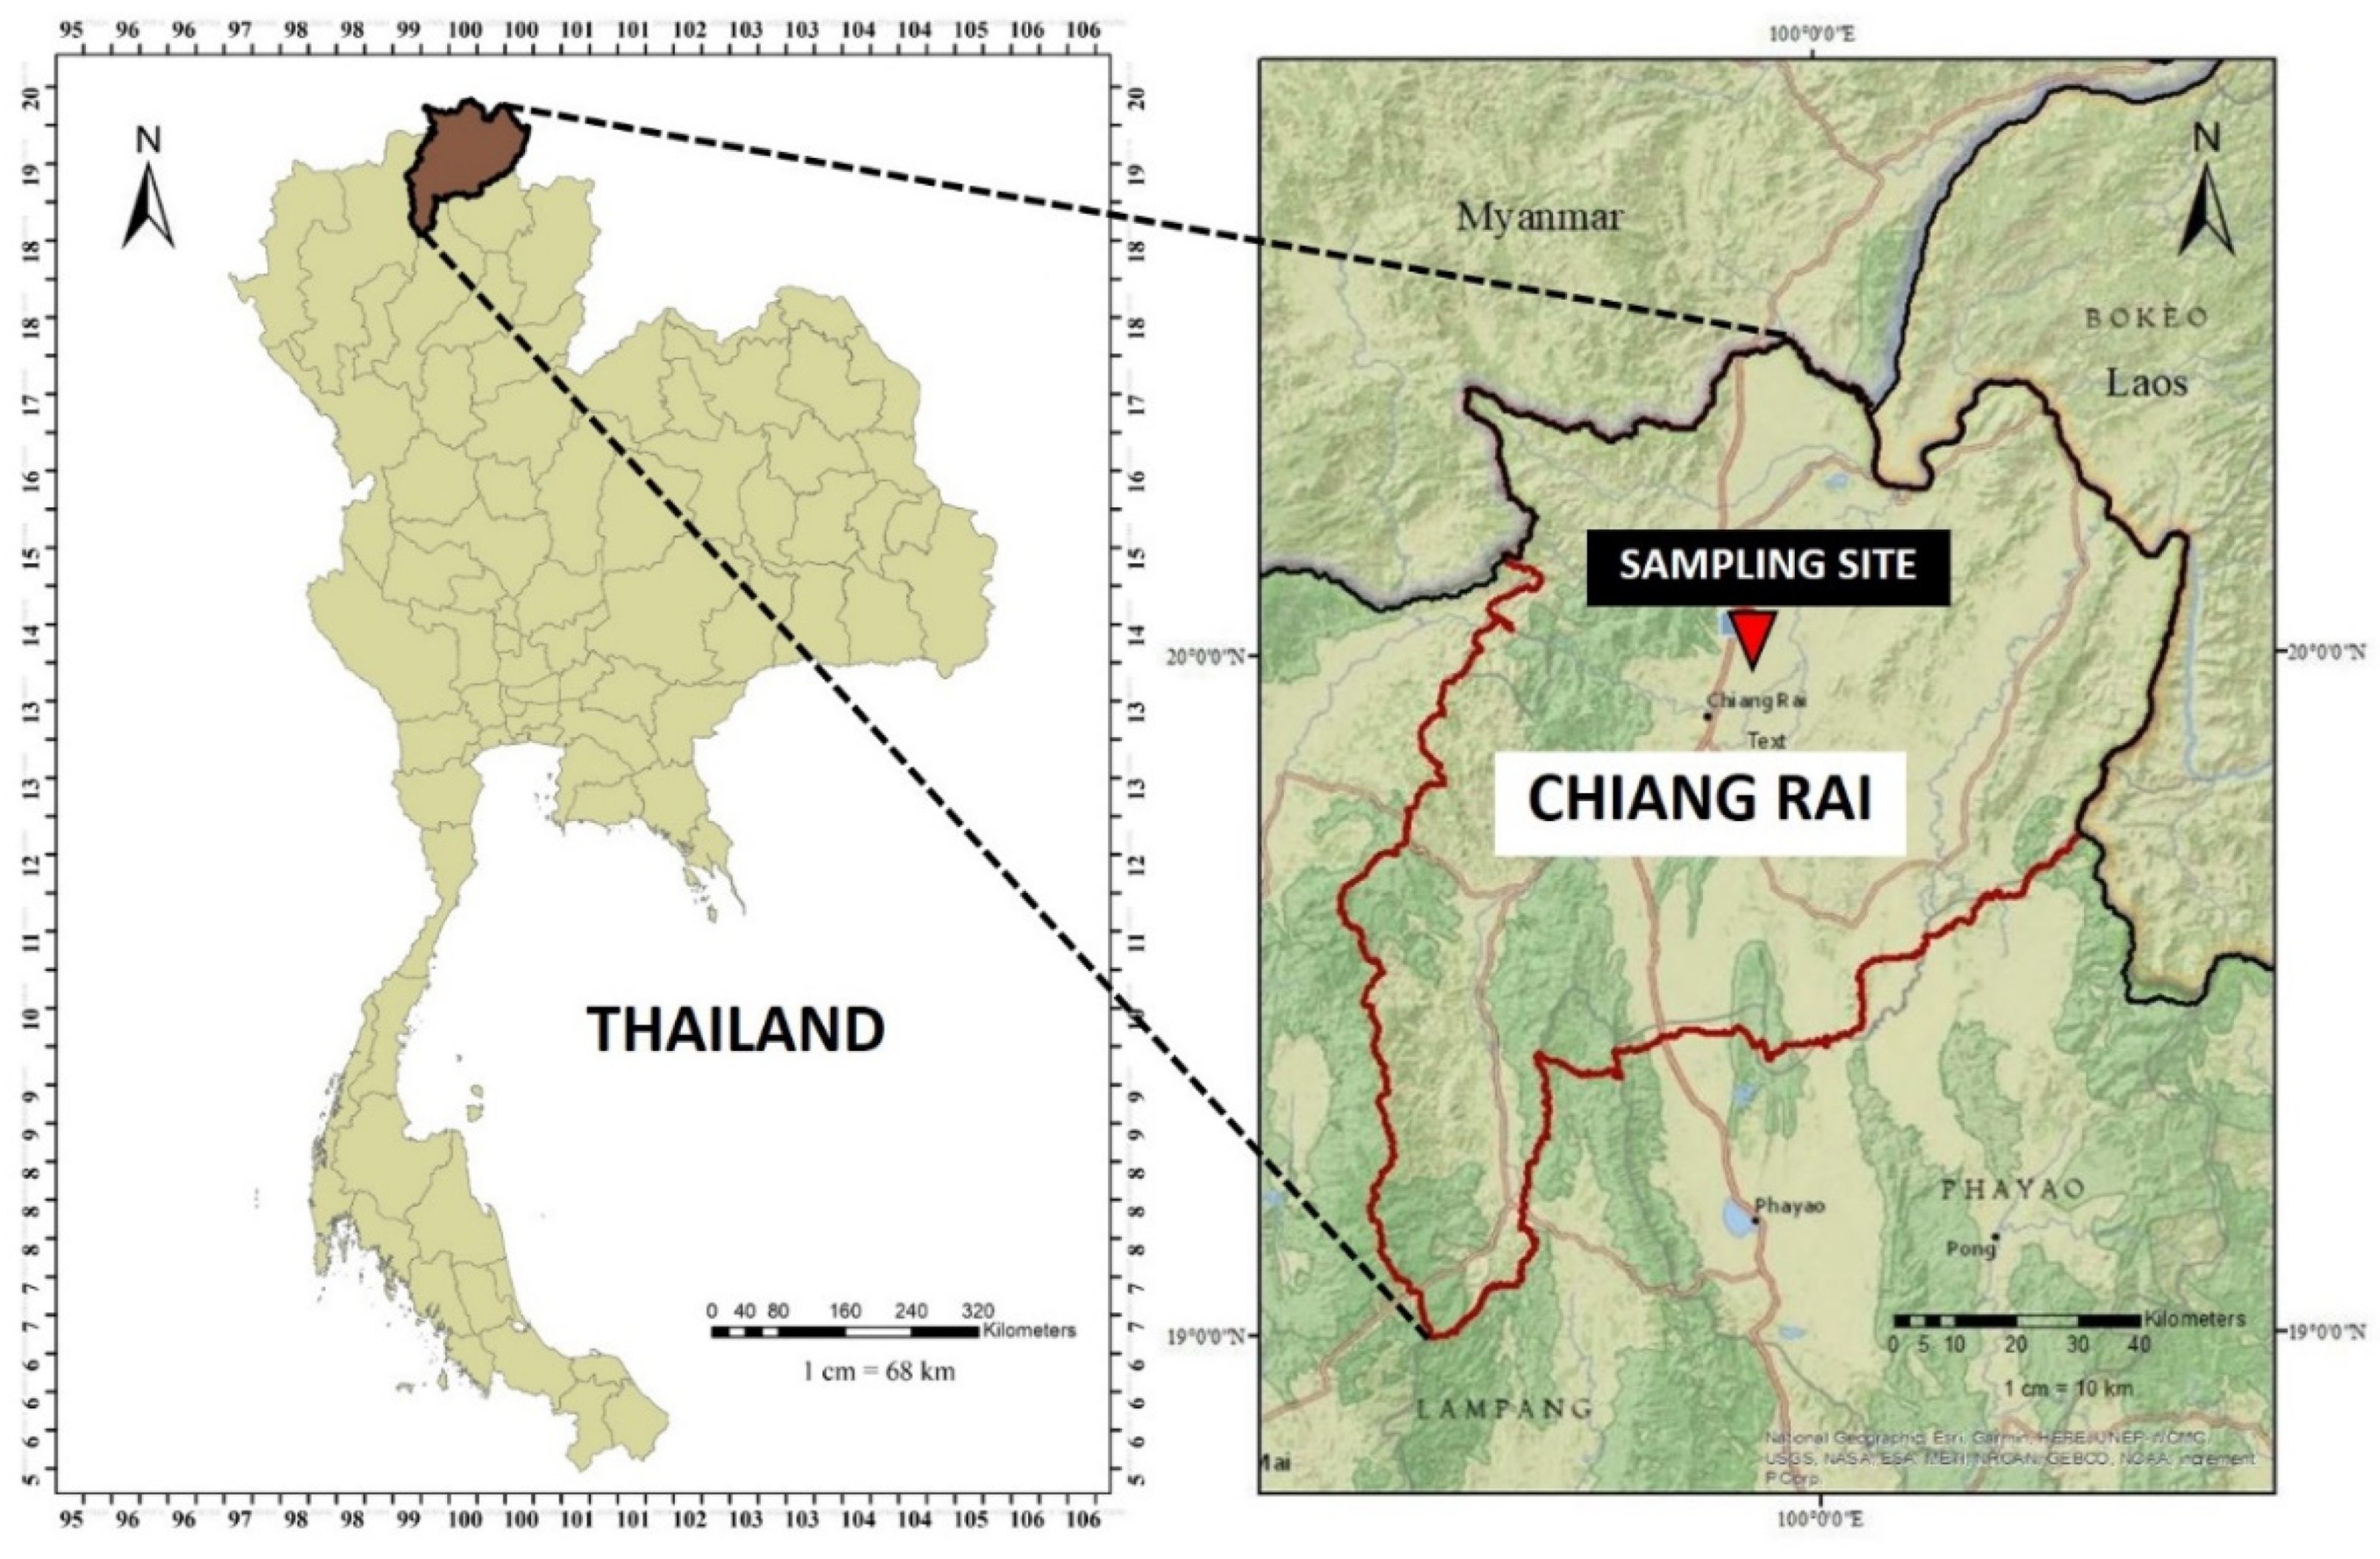
2.1. Study Area

The PM2.5 sampling site is at Mae Fah Luang University, 445 m above sea level (20°02′25″ N, 99°53′25″ E), and far from the industrial zone and main road. The sampling location is an open field of the university. This site is in Chiang Rai Province, with a population of 1.29 million in a total area of 11,678 square kilometers. Chiang Rai is in the northernmost part of Thailand; most areas are mountainous, with a flat terrain of agricultural areas between the mountains. This province is located and connected to Myanmar (Burma) and Laos. The location of the sampling area is illustrated in Figure 1.

2.2. Sample Collection

PM2.5 samples were collected for 26 days in the haze period from 5 to 30 March 2021, whereas the non-haze period was carried out during 19 July–30 August 2021 (42 days). One filter was used to collect PM2.5 collection for 24 h. Total samples were 26 and 42 for the haze and non-haze period, respectively. The sample was collected on a polytetrafluoroethylene (PTFE) filter with a 47 mm diameter, using an ambient air particulate sampler (Model PQ200, Mesa Laboratories, Inc., Butler, NJ, USA) at a flow rate of 16.7 L/min with 24-h sampling intervals. All the filters were weighed before and after sample collection by microbalance under controlled temperature (25 °C) and humidity conditions (40% RH). Then, filters were kept in a freezer until elemental composition analysis.

2.3. Elemental Analysis of PM2.5

The filter of PM2.5 sample was digested with a mixture of acid (6 mL of HNO3 and 1 mL of H2O2) by the microwave digester method, and then diluted to a final volume of 10 mL. After digestion of all samples, nine elements (Cd, Cr, Cu, Fe, K, Mn, Pb, Ni, and Zn) were analyzed by an Atomic Absorption Spectrophotometer Model: ZA3000 (Hitachi, Ltd., Tokyo, Japan). Each sample was repeated in triplicate.
Recoveries of heavy metals were used to conduct the quality assurance and quality control (QA/QC). The blank sample was taken, and the amount was adjusted. The calculation of percent recovery was employed by the equation (Equation (1)):
Recover (%) = (Measured values/Certified values) × 100
From the above equation, if the measured value is higher than certified values, it will lead to a percent recovery of over 100. The Standard Reference Materials (SRMs) urban dust 1648a (National Institute of Standard and Technology (NIST)) was used as a reference material to control the data quality.
The recoveries of all heavy metals were in the range of 81% (Pb)–118% (Mn). The percent recoveries of our study are in the range of acceptable under the criteria of Taverniers et al., 2004 [28]. They declared that a recovery range of 80–110% was acceptable. In the case of Mn, the recovery of 118% was also in the range of 115–120 according to the reference. The instrument detection limit (ILD) of Cd, Cr, Cu, Fe, Pb, Ni, Mn, K, and Zn were 0.07, 0.16, 0.28, 0.30, 1.01, 0.25, and 0.09 µg/L, and 0.054 and 0.003 mg/L, respectively. All of the procedures in the experiment used analytical grade chemicals and deionized water.

2.4. Data Analysis

Statistical analysis was conducted using XLSTAT Statistical Software; the version used for this analysis was XLSTAT 2021.3.1 (student version) by Addinsoft Inc. (New York, NY, USA). To make an analysis of PM2.5 and the bound element for the sampling period, descriptive statistics were calculated to explain data: average, min, max, and standard deviation. For the normal distribution, the Kolmogorov–Smirnov test was used for checking all of the samples. The Mann–Whitney U test was used to compare the levels of PM2.5 and the element for haze and non-haze episodes.

2.5. Enrichment Factor

The enrichment factor (EF) is used to differentiate the source of the element in a particulate matter that is caused by both anthropogenic sources, and that originating from the natural process and natural sources. The EF value of each component in PM2.5 was calculated by applying the following equation (Equation (2)):
EF = ( C x   ÷   C ref   ) sample ( C x   ÷   C ref   ) crust
where Cx is the average concentration of the element obtained from this study, and Cref is the average concentration of the reference element. Na, K, Al, Mg, Ca, Mn, or Fe are the common references which had to be clear, and that generate from a single source. Fe was selected as a reference element in this study because it is a component of the earth’s crust and has been successfully used by several researchers [29]. EF < 10 can indicate that the crust is the dominant elemental source, and EF > 10 suggests that the element has anthropogenic sources. Whereas 10 < EF < 100 indicate that the element is moderately enriched, EF > 100 indicates that it is highly enriched. This study used the elemental composition of uncontaminated Thai paddy soil as the continental crustal element [30,31].

2.6. Health Risk Assessment

In this study, the model used to estimate health risks caused by exposure to air pollution was developed by the US EPA [32]. The major exposure route for outdoor PM2.5 and its elemental composition is inhalation. This study analyzed the non-carcinogenic risk of Cd, Cr, Mn, and Ni, and the carcinogenic risk of Cd, Cr, Pb, and Ni.
The definitions of HQ, HI, CR, and IUR were used to determine the health risk assessment as indicated in the guidelines of the US EPA, and the equation of each definition is also illustrated in Equations (3)–(6). The meanings of them are as follows:
A Hazard Quotient (HQ) is the ratio of the potential exposure to a substance and the level at which no adverse effects are expected.
A Hazard Index (HI) is the sum of HQs for all pathways and similar toxic effects. A HQ of <0.2 for any given pathway is often considered acceptable, whereas an HI of <1.0 is considered acceptable.
Cancer risk (CR) is defined by the US EPA as “the incremental probability of an individual to develop cancer over a lifetime as a result of exposure to a potential carcinogen”.
IUR means the inhalation unit risk, and the cancer risk is defined by the US EPA as “the incremental probability of an individual to develop cancer over a lifetime as a result of exposure to a potential carcinogen”.
The exposure concentration (EC) via inhalation routes was determined using the following equation (Equation (3)):
EC inhalation = C   × ET   × EFd   × ED AT
where C is the concentration of each element in particulate matter (ng/m3); ET is the exposure time (ET = 24 h/day); EFd is the exposure frequency (EFd = 365 days/year); ED is the exposure duration (ED = 30 years); AT is averaging time (AT = ED × 365 days/year for non-carcinogenic risk and AT = 70 years × 365 days/year for carcinogenic risk).
The Hazard Quotient (HQ) for each element in PM2.5 was estimated by using the ratio of exposure concentration and reference concentration (RfC) obtained from IRIS, US EPA, and OEHHA [33,34] as presented in Equation (4). In addition, the Hazard Index (HI) was also estimated by using Equation (5) below. HI is estimated from the summation of the individual HQ that affects the same organ or organ system:
HQ = EC inhalation RfC
HI =   HQ
where the Hazard Quotient represents the non-carcinogenic risk level of each element via the inhalation route. If HQ or HI > 1, it can be considered that adverse health effects are possible in the exposed population, whereas for HQ or HI ≤ 1, the adverse health effects are not likely to occur or the risks are acceptable.
The cancer risk (CR) because of exposure to heavy metals can be calculated using the following equation (Equation (6)), which is defined as the potential of a person developing any type of cancer over a lifetime:
CR = ECinhalation × IUR
where IUR is the inhalation unit risk, which is defined as the lifetime cancer risk generated by continuous exposure to a carcinogen at a concentration of 1 µg/m3; in the air through an inhalation route. For risk characterization of carcinogenic risk, the US EPA has indicated that the level of cancer risk below one in a million chance to develop cancer (1.0 × 10⁻⁶) is the acceptable risk, and tolerable up to one in ten thousand (1.0 × 10⁻⁴), which means over one in ten thousand is an unacceptable health risk.

3. Results

3.1. PM2.5 Concentration

The average concentration of PM2.5 in Chiang Rai province during haze and non-haze episodes is presented in Table 1. In haze episodes (n = 23), the concentration of PM2.5 ranges from 12.50 to 116.70 μg/m3, with a mean concentration of 63.07 μg/m3. The level of PM2.5 was much higher (4.2 times) than the air quality guidelines of the World Health Organization (15 μg/m3 24-h mean). The emission source of the high concentration of particulate matter during March and April in northern Thailand was transboundary from neighboring countries. The major cause was open biomass burning in agricultural and forested areas [35]. For the non-haze episode (n = 12), the PM2.5 concentration fluctuated between 4.17 and 66.67 μg/m3, with an average of 25.00 μg/m3. The level of PM2.5 during the non-haze episode still exceeded the limits of the WHO guidelines, but was within limits of the Thailand National Ambient Air Quality Standard (NAAQS) (50 μg/m3). The Mann–Whitney test showed that the level of PM2.5 during haze episodes was significantly higher compared to non-haze. Similar research conducted in Chiang Rai reported an average PM2.5 concentration of 170 ± 59 μg/m3 from January to April 2019 [36]; this is much higher than the level of PM2.5 measured in this study, which shows that the PM2.5 concentration in Chiang Rai province has decreased this year.

3.2. Elemental Composition

The average concentration of elemental composition in PM2.5 is shown in Table 1, including minimum, maximum, mean, and standard deviation. Target elements were detected in all samples except for Cd and Zn in the non-haze episode. Among all elements in PM2.5 during the haze episode, the highest average concentration was K (77.44 ± 30.80 mg/m3), followed by Fe > Cr > Zn > Pb > Cu > Mn > Cd > Ni. Similar to the non-haze episode, K (11.70 ± 10.76 mg/m3) showed the highest concentration, followed by Fe > Cu > Pb > Cr > Mn > Ni. The World Health Organization has imposed limits on the concentration of several toxic metals to preserve outdoor air quality. The limits for Cd, Cr, Cu, Mn, Pb, and Ni are 5, 20, 70, 150, 500, and 0.4 ng/m3, respectively [37]. A comparison between the metal concentration and standard limits proposed by the WHO guidelines is presented in Table 1. The mean concentration for all of the elements measured in this study in both haze and non-haze episodes were below the WHO limits. These elements play an important role in the association between air pollution and human health [38,39]. Regarding the percentage of 5.4 and 8.1, they were calculated from the elements causing the health impact, namely: Cd, Cr, Mn, Pb, and Ni. Total concentrations of the mentioned parameters were divided by total concentration of all elements and multiplied by 100. The total concentration of haze and non-haze were 111.19 and 19.03 ng/m3, whereas the concentrations of the concerning parameters were 6.04 and 1.55 ng/m3 for haze and non-haze, respectively. The percentages were (6.04/111.19 × 100 =5.4) and (1.55/19.03 × 100 = 8.1) for haze and non-haze, respectively.
The comparison of the concentration of PM2.5 and their elemental composition between this current study and previous studies conducted in Thailand and other Asian countries is shown in Table 2. In other previous studies in Thailand, the level of most elements was lower than those found in Chiang Rai, Bangkok, and Chiang Mai, except for Cr, which was slightly higher than that reported in Bangkok [36,40]. However, most of the metal compositions in PM2.5 observed in this study had an average concentration less than other studies conducted in Asian countries except Korea and Taiwan.

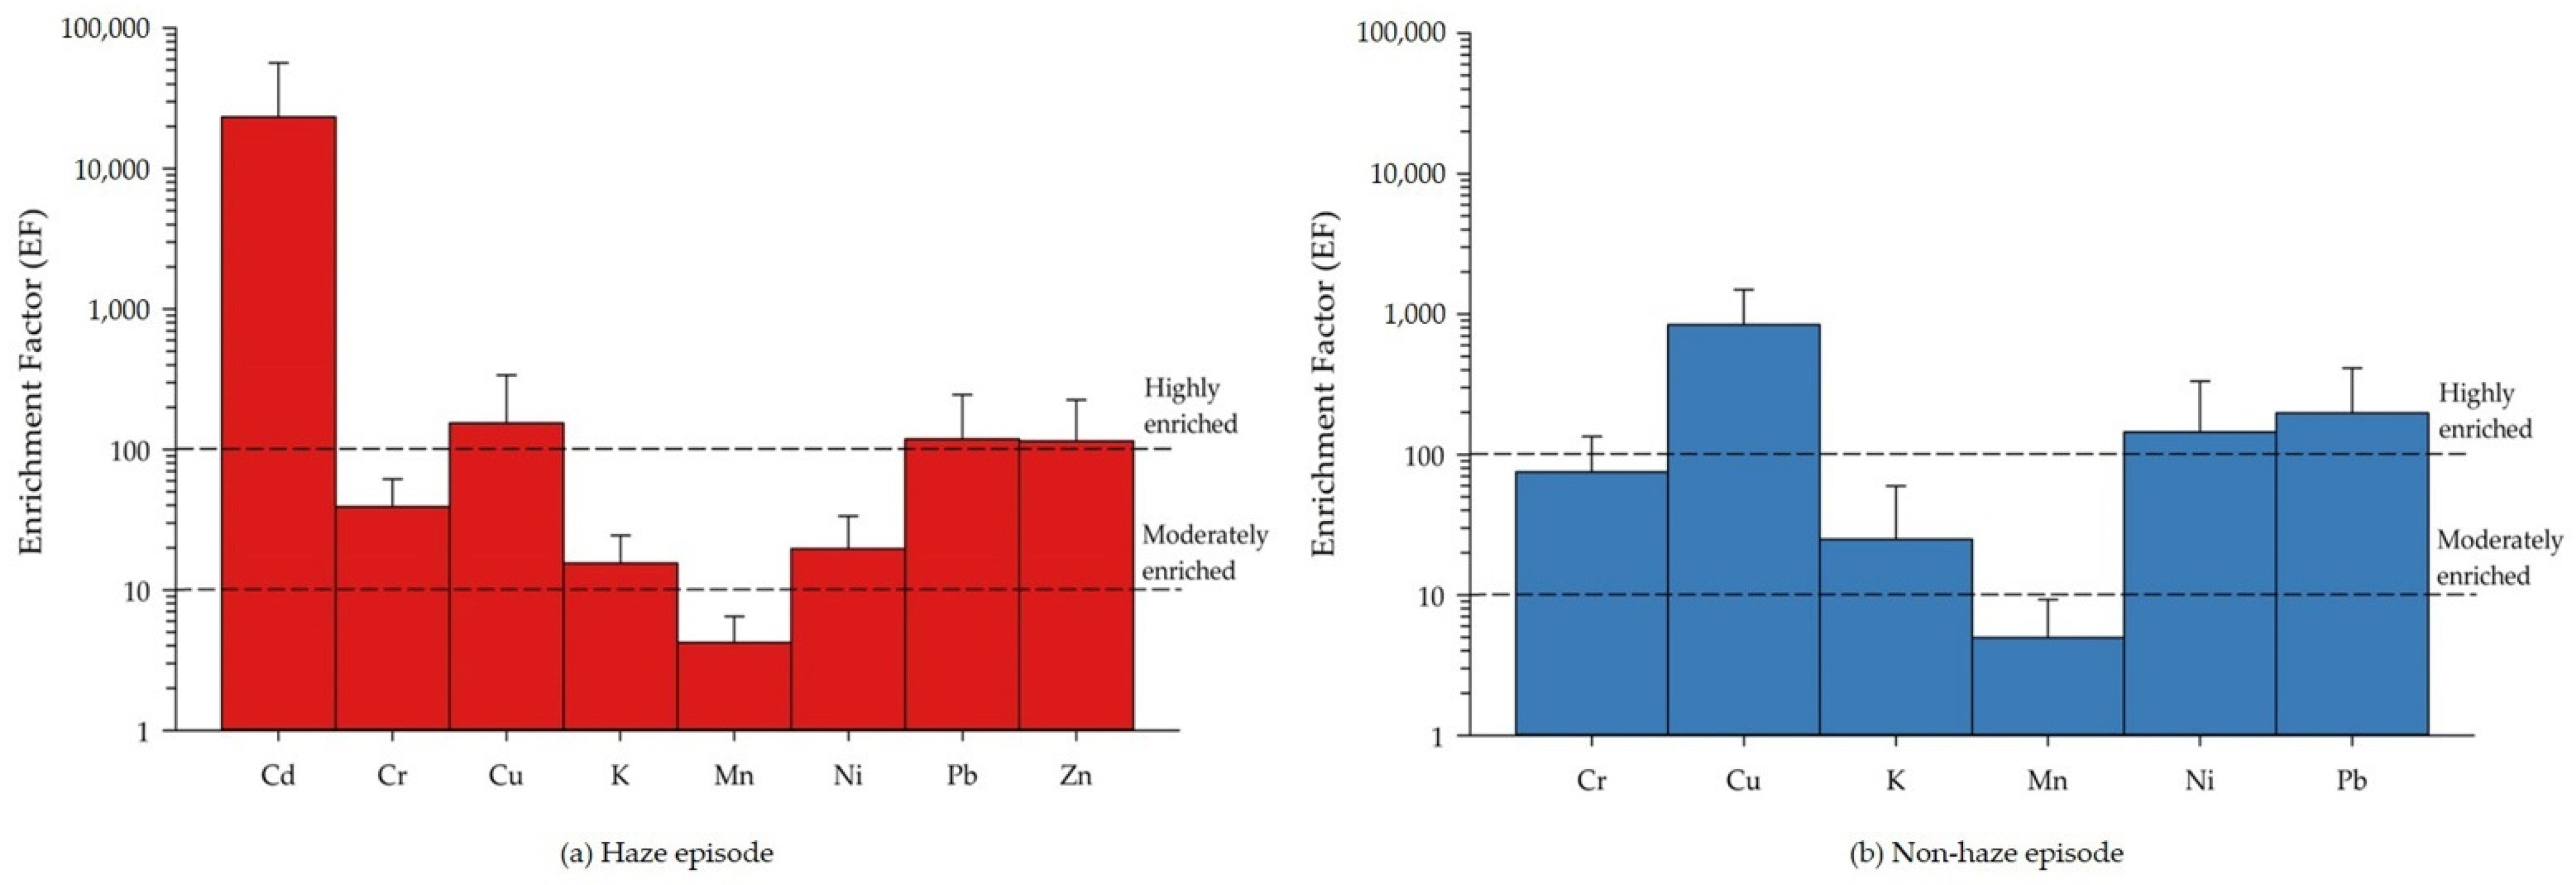
3.3. Enrichment Factor

Enrichment factors (EFs) of various elements were estimated using Equation (2). EF was used for identifying the enrichment of particulate elements either from crustal or anthropogenic origin. EF is the representation of the concentration ratio of the concerning heavy metal in particles to Fe in aerosols, and the average concentration of the heavy metal divided by the concentration of Fe in crust represents the corresponding heavy metal concentrations to Fe ratio in crustal matter per sample weight (mg/kg). Table 1 shows the concentration of heavy metal per volume of airmass (ng/m3). The estimated values of EFs during both the haze (a) and non-haze (b) episode are illustrated in Figure 2. EFs for the non-haze period were higher (at lower mass concentrations) than the haze period (when mass concentrations are higher); this might be due to the fact that the level of target elements detected in both periods are not much different, but the reference elements in the haze period are much higher than non-haze period, so the ratio of the (Cx/Cref) sample was greater, and led to the higher EF value in the non-haze period. The average EF values of the element in PM2.5 in haze and non-haze episodes are presented in Figure 2. In this study, the EF values of Cd, Cu, Ni, Pb, and Zn are highly enriched (over 100), showing that these elements are more likely to be emitted from anthropogenic sources. Cd had the highest EF value in haze episodes (approximately 23,000), which indicates that this element was weakly related to the crustal source, and mainly originated from anthropogenic sources, e.g., the metallurgical industry and waste incineration; this corresponds to Kayee et al., 2020 [36], who reported that the EF values were related to the sources of PM. An EF higher than 100 indicates the influence of strong anthropogenic sources. An EF greater than 10 indicates a moderate influence of anthropogenic sources. The elements with EF values between 10 to 100 include Cr and K, indicating that they are moderately enriched, and the source of these elements is anthropogenic. The EF value of Mn is below 10, indicating that this metal was not enriched and mainly originated from natural sources, such as re-suspended soil, natural rock weathering, and dust storms.

3.4. Statistical Analyses of Data

As shown in Table 3, the results of the Mann–Whitney U test confirm the hypothesis that there are significant differences between the two periods of samples found for PM2.5, Fe, K, and Mn, at a significance level of 95% relative to the location of the Mae Far Luang University sampling site in the periods of haze and non-haze. However, the results obtained for Cu, Cr, Ni, Pb, and enrichment factor were not significantly different. However, this evaluation could not be made for Cd and Zn, since these elements were not detected when the measurement of samples was performed in non-haze.

3.5. Human Health Risk Assessment

The estimation of carcinogenic and non-carcinogenic risk of elements (Cd, Cr, Mn, Ni, and Pb) in PM2.5 through inhalation is shown in Table 4. For the carcinogenic risk level defined by the CR value, the cancer risk of the elements was in the order of Cr > Cd > Pb > Ni. The CR value of Cr was higher than the minimum acceptable level (1 × 10⁻⁶), indicating significant health effects. In this study, Cr was analyzed as total Cr (Cr(III) and Cr(VI) were not analyzed separately). The toxicity of Cr was mainly from Cr(VI), which can be absorbed by the lungs and gastrointestinal tract or even by dermal contact, whereas Cr(III) cannot. Only Cr(VI) has been classified as Group A or known as a human carcinogen by exposure through an inhalation route [48]. Epidemiological studies reported that exposure to Cr(VI) has a strong association with lung cancer mortality, as well as positive associations with nose and nasal cavity cancer [49]. However, the CR value of Cd, Pb, and Ni was lower than 1 × 10⁻⁶, implying negligible cancer risk. The cumulative cancer risk value during haze and non-haze episodes were 1.33 × 10⁻⁵ and 3.02 × 10⁻⁶, respectively.
For the non-carcinogenic risk level of each element in PM2.5 represented by the HQ value, the HQ of all elements was lower than 1, which meant that adverse health effects are not likely to occur. The non-carcinogenic risk was ranked in the order of Cd > Cr > Mn > Ni in the haze episode, and Cd > Ni > Cr > Mn in the non-haze episode. The Hazard Index (HI) during haze and non-haze episodes were 0.11 and 0.02, respectively. However, the HI in both episodes was lower than 1.
The non-carcinogenic and carcinogenic risk of the elements in PM2.5 might be overestimated or underestimated, since each air sample was collected for 24 h in some period during a year, which might be affected by the meteorological condition and anthropogenic activity of the sampling period. The population were assumed to be exposed to a certain concentration of each element in PM2.5 for 24 h, which may have led to overestimation. When comparing to the level of elements in PM2.5 of other studies, as shown in Table 2, the air quality in Agra, India had the highest potential to cause adverse health effects to the exposed population.

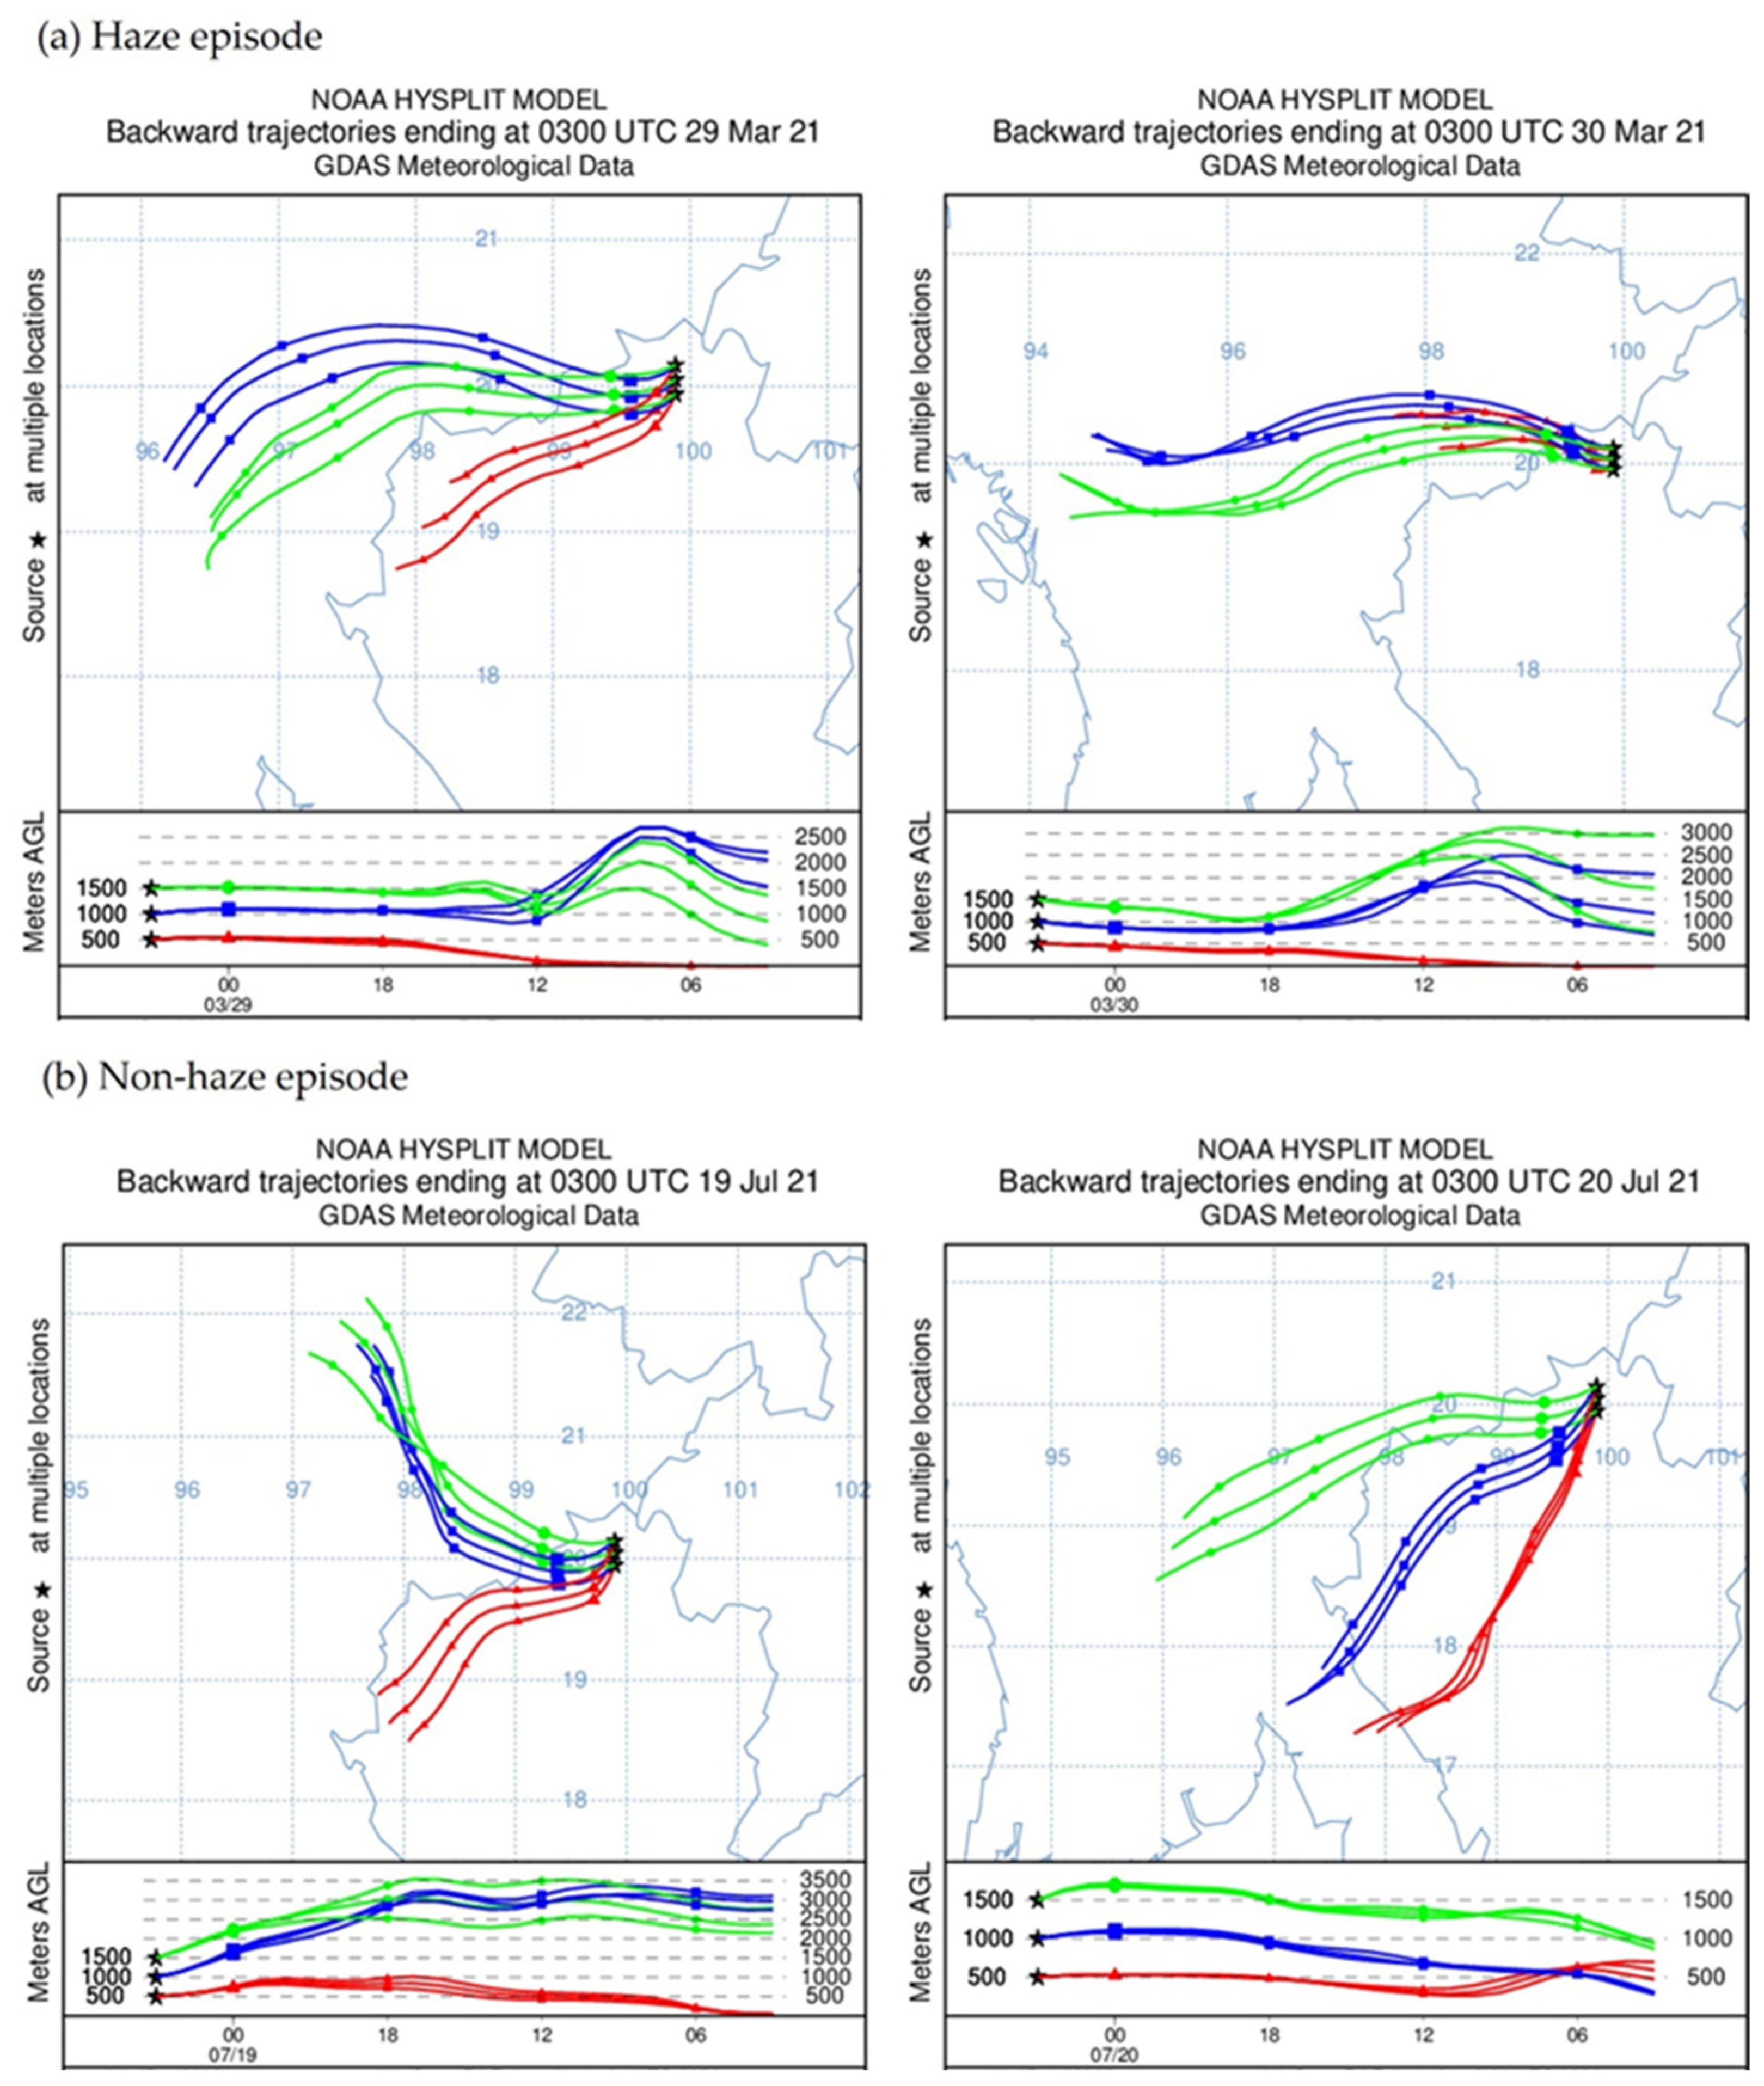
3.6. Evaluation of Backward Air Mass Trajectories

Haze episodes are the situation of a severe climate event, with potentially harmful effects to humans and living things. In the northern part of Thailand, haze episodes can be seasonal even in the dry season (February to April). The air movement took the pollutants both in the country as local sources, and the neighboring countries due to transboundary effects. Backward air mass trajectories are used to determine the pathway of an infinitesimal air parcel through a centerline of an advected air mass having vertical and horizontal dispersion from the previous periods. The archived data of NOAA were utilized in the Air Resources Laboratory (ARL) for the provision of the HYSPLIT transport and dispersion model, and/or the READY website [50,51]. The latitude of our study was 20.045172, and the longitude was 99.895189. Air mass backward trajectories arrived at 1000, 2000, and 3000 m above ground level using the GDAS1 meteorological data on 29–30 March 2019 (over 72 h), as calculated from the NOAA Integrated Trajectory (HYSPLIT) model (Figure 3a). In this study, air mass was a movement from inner Myanmar that passed through the Chiang Rai province, and was generated locally before reaching the Mae Far Luang University sampling site. The potential sources of PM2.5 might be biomass burning, forest fires, and local activities [52] transporting the air to Chiang Rai by westerly airflow, causing PM2.5 to increase rapidly. The maximum hourly concentration was 108.3 μg/m3, on 30 March 2020. A remote source caused high PM2.5 levels, affecting local air quality [53,54]. Figure 3b shows the direction at a short distance; air mass was generated locally before reaching the Mae Far Luang University sampling site. The maximum hourly concentration in the non-haze period was 66.7 μg/m3, on 20 July 2020.

4. Conclusions

PM2.5 was sampled in Chiang Rai province in the northern part of Thailand during haze and non-haze episodes. The elemental composition (Cd, Cr, Cu, Fe, K, Mn, Pb, Ni, and Zn) and identified potential sources of PM2.5 were assessed in this study. The results show the average concentration of PM2.5 rose to 63.07 μg/m3 during the haze episode, which exceeds the Thailand Air Quality Standard (50 μg/m3). The enrichment factor analysis suggests that most of the elemental components of PM2.5 in this study were generated from anthropogenic emissions, except Mn. For health risk assessment results, i.e., carcinogenic risk, Cr exceeded the minimum acceptable level, whereas non-carcinogenic risk was within a safe level in this study. Although the adverse health effects of elemental composition in PM2.5 are currently considered negligible, these risks should not be neglected in risk management in the future. Risks may increase the long-term impact on human health. During the dry season (February to April), the sources of PM2.5 were mainly caused by the mixing of local sources and transboundary transport. In general, there are three seasons in Thailand, namely: winter (October to February), rainy (May to October), and summer or dry season (February to April). The selected air measurement in March was representative of this area, since the particulate matter concentrations always annually exceed the NAAQS, and peak concentrations have been observed in March every year. This study suggests that the level of elements in PM2.5 was the highest in haze episodes that came from biomass burning, forest fires, local activities, and neighboring counties.

Author Contributions

Data curation by S.S.; formal analysis by R.M. and N.K.; investigation by W.K.; methodology by W.K. and K.T.; writing—original draft by S.N.; data preparation and analysis, proofreading by W.S. and A.H.; data preparation and analysis, proofreading by W.K. and S.S.; writing, review, and editing by K.T., S.W. and T.M.; reviewing and suggesting important scientific content by S.W. and K.T. All authors have read and agreed to the published version of the manuscript.

Funding

This research was funded by National Research Council of Thailand.

Institutional Review Board Statement

Not applicable.

Informed Consent Statement

Not applicable.

Acknowledgments

We thank NRCT for supporting our research, and the Faculty of Tropical Medicine, Mahidol University and Mae Fah Luang University for supporting the facilities and laboratory analysis.

Conflicts of Interest

The authors declare no conflict of interest.

References

  1. WHO. Air Pollution. 2016. Available online: https://www.who.int/health-topics/air-pollution#tab=tab_1 (accessed on 9 July 2020).
  2. Kampa, M.; Castanas, E. Human health effects of air pollution. Environ. Pollut. 2008, 151, 362–367. [Google Scholar] [CrossRef] [PubMed]
  3. Zhang, Y.; Huang, W.; Cai, T.; Fang, D.; Wang, Y.; Song, J.; Hu, M.; Zhang, Y. Concentrations and chemical compositions of fine particles (PM2.5) during haze and non-haze days in Beijing. Atmos. Res. 2016, 174–175, 62–69. [Google Scholar] [CrossRef]
  4. Fang, G.C.; Xiao, Y.F.; Zhuang, Y.J.; Cho, M.H.; Huang, C.Y.; Tsai, K.H. PM2.5 particulates and metallic elements (Ni, Cu, Zn, Cd and Pb) study in a mixed area of summer season in Shalu, Taiwan. Environ. Geochem. Health 2017, 39, 791–802. [Google Scholar] [CrossRef]
  5. Badaloni, C.; Cesaroni, G.; Cerza, F.; Davoli, M.; Brunekreef, B.; Forastiere, F. Effects of long-term exposure to particulate matter and metal components onmortality in the Rome longitudinal study. Environ. Int. 2017, 109, 146–154. [Google Scholar] [CrossRef]
  6. Fang, Y.; Naik, V.; Horowitz, L.W.; Mauzerall, D.L. Air pollution and associated human mortality: The role of air pollutant emissions, climate change and methane concentration increases from the preindustrial period to present. Atmos. Chem. Phys. 2013, 13, 1377–1394. [Google Scholar] [CrossRef] [Green Version]
  7. WHO. Health Effects of Particulate Matter. 2013. Available online: https://www.euro.who.int/__data/assets/pdf_file/0006/189051/Health-effects-of-particulate-matter-final-Eng.pdf (accessed on 16 July 2020).
  8. Yang, H.C.; Chang, S.H.; Lu, R.; Liou, D.M. The effect of particulate matter size on cardiovascular health in Taipei Basin, Taiwan. Comput. Methods Programs Biomed. 2016, 137, 261–268. [Google Scholar] [CrossRef]
  9. Martins, N.R.; Carrilho da Graça, G. Impact of PM2.5 in indoor urban environments: A review. Sustain. Cities Soc. 2018, 42, 259–275. [Google Scholar] [CrossRef]
  10. Chen, N.; Mo, Q.; He, L.; Huang, X.; Yang, L.; Zeng, J.; Gao, Q. Electrochimica Acta Heterostructured MoC-MoP/N-doped carbon nanofibers as efficient electrocatalysts for hydrogen evolution reaction. Electrochim. Acta 2019, 299, 708–716. [Google Scholar] [CrossRef]
  11. Anderson, J.O.; Thundiyil, J.G.; Stolbach, A. Clearing the air: A review of the effects of particulate matter air pollution on human health. J. Med. Toxicol. 2012, 8, 166–175. [Google Scholar] [CrossRef] [Green Version]
  12. Johnston, H.J.; Mueller, W.; Steinle, S.; Vardoulakis, S.; Tantrakarnapa, K.; Loh, M.; Cherrie, J.W. How Harmful Is Particulate Matter Emitted from Biomass Burning? A Thailand Perspective. Curr. Pollut. Rep. 2019, 5, 353–377. [Google Scholar] [CrossRef] [Green Version]
  13. Ruchiraset, A.; Tantrakarnapa, K. Time Series Modeling of Pneumonia Admissions and Its Association with Air Pollution and Climate Variables in Chiang Mai Province, Thailand. Environ. Sci. Pollut. Res. Int. 2018, 25, 33277–33285. [Google Scholar] [CrossRef] [PubMed] [Green Version]
  14. Acciai, C.; Zhang, Z.; Wang, F.; Zhong, Z.; Lonati, G. Characteristics and source Analysis of trace Elements in PM2.5 in the Urban Atmosphere of Wuhan in Spring. Aerosol Air Qual. Res. 2017, 17, 2224–2234. [Google Scholar] [CrossRef]
  15. Elhadi, R.E.; Abdullah, A.M.; Abdullah, A.H.; Ash’Aari, Z.H.; Khan, M.F. Seasonal variations of atmospheric particulate matter and its content of heavy metals in Klang valley, Malaysia. Aerosol Air Qual. Res. 2018, 18, 1148–1161. [Google Scholar] [CrossRef] [Green Version]
  16. Li, Q.; Liu, H.; Alattar, M.; Jiang, S.; Han, J.; Ma, Y. The Preferential Accumulation of Heavy Metals in Different Tissues Following Frequent Respiratory Exposure to PM2.5 in Rats. Sci. Rep. 2015, 5, 16936. [Google Scholar] [CrossRef] [Green Version]
  17. Ju, Y.; Chen, W.; Liao, C. Assessing human exposure risk to cadmium through inhalation and seafood consumption. J. Hazard. Mater. 2012, 227–228, 353–361. [Google Scholar] [CrossRef]
  18. Winder, B.S.; Salmon, A.G.; Marty, M.A. Inhalation of an essential metal: Development of reference exposure levels for manganese. Regul. Toxicol. Pharmacol. 2010, 57, 195–199. [Google Scholar] [CrossRef]
  19. Iyer, S.; Sengupta, C.; Velumani, A. Lead toxicity: An overview of prevalence in Indians. Clin. Chim. Acta 2015, 451, 161–164. [Google Scholar] [CrossRef]
  20. Fay, M. Toxicological Profile for Nickel; Agency for Toxic Substances and Disease Registry: Atlanta, GA, USA, 2005.
  21. Ballantyne, B.; Marrs, T.C.; Syversen, T. General and Applied Toxicology, 3rd ed.; Macmillan Reference Publishing: London, UK, 2009. [Google Scholar]
  22. Adamson, I.Y.R.; Prieditis, H.; Hedgecock, C.; Vincent, R.; Pharmacol, R.T.A. Zinc Is the Toxic Factor in the Lung Response to an Atmospheric Particulate Sample. Toxicol. Appl. Pharmacol. 2000, 119, 111–119. [Google Scholar] [CrossRef]
  23. Pinichka, C.; Makka, N.; Sukkumnoed, D.; Chariyalertsak, S.; Inchai, P.; Bundhamcharoe, K. Burden of disease attributed to ambient air pollution in Thailand: A GIS-based approach. PLoS ONE 2017, 12, e0189909. [Google Scholar] [CrossRef]
  24. Kliengchuay, W.; Worakhunpiset, S.; Limpanont, Y.; Meeyai, A.C.; Tantrakarnapa, K. Influence of the meteorological con-ditions and some pollutants on PM10 concentrations in Lamphun, Thailand. J. Environ. Health Sci. Eng. 2021, 19, 237–249. [Google Scholar] [CrossRef]
  25. Ruchiraset, A.; Tantrakarnapa, K. Association of climate factors and air pollutants with pneumonia incidence in Lam-pang province, Thailand: Findings from a 12-year longitudinal study. Int. J. Environ. Health Res. 2020, 32, 691–700. [Google Scholar] [CrossRef] [PubMed]
  26. Jaee, N.; Archer, D.; Nopsert, C. Air Quality in Thailand Understanding the Regulatory Context (Issue February). 2021. Available online: https://www.sei.org/publications/air-quality-thailand-regulatory-context/ (accessed on 10 February 2022).
  27. Pollution Control Department. Air Quality Index Data. 2018. Available online: http://air4thai.pcd.go.th/webV3/#/AQIInfo (accessed on 10 February 2022).
  28. Taverniers, I.; de Loose, M.; van Bockstaele, E. Trends in Quality in the Analytical Laboratory. II. Analytical Method Validation and Quality Assurance. TrAC-Trends Anal. Chem. 2004, 23, 535–552. [Google Scholar] [CrossRef]
  29. Zajusz-zubek, E.; Kaczmarek, K.; Mainka, A. Trace Elements Speciation of Submicron Particulate Matter (PM1) Collected in the Surroundings of Power Plants. Int. J. Environ. Res. Public Health 2015, 12, 13085–13103. [Google Scholar] [CrossRef] [Green Version]
  30. Zarcinas, B.A.; Pongsakul, P.; McLaughlin, M.J.; Cozens, G. Heavy metals in soils and crops in southeast Asia. 2. Thailand. Environ. Geochem. Health 2004, 26, 359–371. [Google Scholar] [CrossRef]
  31. Prakongkep, N.; Suddhiprakarn, A.; Kheoruenromne, I.; Smirk, M.; Gilkes, R.J. The geochemistry of Thai paddy soils. Geoderma 2008, 144, 310–324. [Google Scholar] [CrossRef]
  32. Fitz-Simons, T. Guideline for Reporting of Daily Air Quality: Air Quality Index (AQI). No. PB-99-169237/XAB; EPA-454/R-99/010; Environmental Protection Agency, Office of Air Quality Planning and Standards: Research Triangle Park, NC, USA, 1999.
  33. US EPA IRIS Assessments. Available online: https://iris.epa.gov/AtoZ/?list_type=alpha (accessed on 18 December 2021).
  34. OEHHA OEHHA. Chemical Database Meta Data. Available online: https://oehha.ca.gov/chemicals (accessed on 18 December 2021).
  35. Punsompong, P.; Chantara, S. Identi fi cation of potential sources of PM10 pollution from biomass burning in northern Thailand using statistical analysis of trajectories. Atmos. Pollut. Res. 2018, 9, 1038–1051. [Google Scholar] [CrossRef] [Green Version]
  36. Kayee, J.; Sompongchaiyakul, P.; Sanwlani, N.; Bureekul, S.; Wang, X.; Das, R. Metal Concentrations and Source Apportionment of PM2.5 in Chiang Rai and Bangkok, Thailand during a Biomass Burning Season. ACS Earth Space Chem. 2020, 4, 1213–1226. [Google Scholar] [CrossRef]
  37. WHO. Ambient (Outdoor) Air Pollution. 2014. Available online: https://www.who.int/en/news-room/fact-sheets/detail/ambient-(outdoor)-air-quality-and-health (accessed on 18 December 2021).
  38. Gao, J.; Tian, H.; Cheng, K. Seasonal and spatial variation of trace elements in multi-size airborne particulate matters of Beijing, China: Mass concentration, enrichment characteristics, source apportionment, chemical speciation and bioavailability. Atmos. Environ. 2014, 99, 257–265. [Google Scholar] [CrossRef]
  39. Tsai, P.-J.; Young, L.-H.; Hwang, B.-F.; Lin, M.-Y.; Chen, Y.-C.; Hsu, H.-T. Source and health risk apportionment for PM2.5 collected in Sha-Lu area, Taiwan. Atmos. Pollut. Res. 2020, 11, 851–858. [Google Scholar] [CrossRef]
  40. Khamkaew, C.; Chantara, S.; Wiriya, W. Atmospheric PM2.5 and Its Elemental Composition from near Source and Receptor Sites during Open Burning Season in Chiang Mai, Thailand. Int. J. Environ. Sci. Dev. 2016, 7, 436–440. [Google Scholar] [CrossRef]
  41. Wang, F.; Wang, J.; Han, M.; Jia, C.; Zhou, Y. Heavy metal characteristics and health risk assessment of PM2.5 in students’ dormitories in a university in Nanjing, China. Build. Environ. 2019, 160, 106206. [Google Scholar] [CrossRef]
  42. Zhang, J.; Zhou, X.; Wang, Z.; Yang, L.; Wang, J.; Wang, W. Trace elements in PM2.5 in Shandong Province: Source identification and health risk assessment. Sci. Total. Environ. 2018, 621, 558–577. [Google Scholar] [CrossRef] [PubMed]
  43. Zhang, J.; Wei, E.; Wu, L.; Fang, X.; Li, F.; Yang, Z.; Wang, T.; Mao, H. Elemental Composition and Health Risk Assessment of PM10 and PM2.5 in the Roadside Microenvironment in Tianjin, China. Aerosol Air Qual. Res. 2018, 18, 1817–1827. [Google Scholar] [CrossRef] [Green Version]
  44. Sharma, S.K.; Mandal, T.K. Chemical composition of fine mode particulate matter (PM2.5) in an urban area of Delhi, India and its source apportionment. Urban Clim. 2017, 21, 106–122. [Google Scholar] [CrossRef]
  45. Sah, D.; Verma, P.K.; Kandikonda, M.K.; Lakhani, A. Pollution characteristics, human health risk through multiple exposure pathways, and source apportionment of heavy metals in PM10 at Indo-Gangetic site. Urban Clim. 2019, 27, 149–162. [Google Scholar] [CrossRef]
  46. Heo, J.B.; Hopke, P.K.; Yi, S.M. Source apportionment of PM2.5 in Seoul, Korea. Atmos. Chem. Phys. 2009, 9, 4957–4971. [Google Scholar] [CrossRef] [Green Version]
  47. Han, Y.J.; Kim, H.W.; Cho, S.H.; Kim, P.R.; Kim, W.J. Metallic elements in PM2.5 in different functional areas of Korea: Concentrations and source identification. Atmos. Res. 2015, 153, 416–428. [Google Scholar] [CrossRef]
  48. US EPA. Chromium(VI) CASRN 18540-29-9 | DTXSID7023982. Available online: https://iris.epa.gov/ChemicalLanding/&substance_nmbr=144 (accessed on 8 June 2020).
  49. Yatera, K.; Morimoto, Y.; Ueno, S.; Noguchi, S.; Kawaguchi, T.; Tanaka, F.; Suzuki, H.; Higashi, T. Cancer risks of hexavalent chromium in the respiratory tract. J. UOEH 2018, 40, 157–172. [Google Scholar] [CrossRef] [Green Version]
  50. Stein, A.F.; Draxler, R.R.; Rolph, G.D.; Stunder, B.J.B.; Cohen, M.D.; Ngan, F. NOAA’s HYSPLIT atmospheric transport and dispersion modeling system. Bull. Amer. Meteor. Soc. 2015, 96, 2059–2077. [Google Scholar] [CrossRef]
  51. Rolph, G.; Stein, A.; Stunder, B. Real-time Environmental Applications and Display system: READY. Environ. Model. Softw. 2017, 95, 210–228. [Google Scholar] [CrossRef]
  52. Kliengchuay, W.; Meeyai, A.C.; Worakhunpiset, S.; Tantrakarnapa, K. Relationships between meteorological parameters and particulate matter in Mae Hong Son province, Thailand. Int. J. Environ. Res. Public Health 2018, 15, 2801. [Google Scholar] [CrossRef] [PubMed] [Green Version]
  53. Zhou, H.; Li, Y.; Liu, H.; Fan, Z.; Xia, J.; Chen, S.; Zheng, Y.; Chen, X. Temporal Distribution, Influencing Factors and Pollution Sources of Urban Ambient Air Quality in Nanchong, China. Environ. Eng. Res. 2015, 20, 260–267. [Google Scholar] [CrossRef]
  54. Kliengchuay, W.; Srimanus, R.; Srimanus, W.; Niampradit, S.; Preecha, N.; Mingkhwan, R.; Worakhunpiset, S.; Limpanont, Y.; Moonsri, K.; Tantrakarnapa, K. Particulate matter (PM10) prediction based on multiple linear regression: A case study in Chiang Rai Province, Thailand. BMC Public Health 2021, 251, 2149. [Google Scholar] [CrossRef] [PubMed]
Figure 1. Location of sampling site in Chiang Rai, Thailand.
Ijerph 19 06127 g001
Figure 2. The average enrichment factor of element in PM2.5 during haze episode and non-haze episode.
Ijerph 19 06127 g002
Figure 3. Backward trajectories result for PM2.5 monitoring in haze episode and non-haze episode.
Ijerph 19 06127 g003
Table 1. Average concentration of PM2.5 (µg/m3) and elemental component (ng/m3).
2021 (Haze Episode) (n = 23)2021 (Non-Haze Episode) (n = 12)WHO Guideline
MeanSDMinMaxMeanSDMinMax
PM2.563.0726.1112.5116.725.0021.654.1766.6715
Cd0.480.380.050.81N.D.N.D.N.D.N.D.5
Cr2.511.410.883.330.590.870.012.3320
Cu1.691.920.067.061.491.260.123.4970
Fe23.9511.2411.9958.484.292.591.188.56-
K77.4430.8028.54156.4611.7010.761.4633.58-
Mn1.090.610.413.080.150.220.010.67150
Pb1.741.930.507.430.690.740.002.17500
Ni0.220.140.030.480.130.090.030.230.4
Zn2.071.740.035.15N.D.N.D.N.D.N.D.-
N.D. = Not Detected.
Table 2. Comparison of concentration of PM2.5 (μg/m3) and elemental composition (ng/m3).
LocationSeasons for the Sampling PeriodPM2.5CdCrCuFeKMnNiPbZnReference
Chiang Rai, Thailand2021 (Haze)63.070.482.511.6923.9577.441.091.740.222.07This study
2021 (Non-haze)25.00N.D.0.591.494.2911.700.150.690.13N.D.This study
Chiang Rai, Thailand2019170-32.6142-6.61.46.415[36]
Bangkok, Thailand201991-1.84.4123-7.31.69.734[36]
Chiang Mai, Thailand201374.575551612231102438-[40]
Nanjing, China2016–201779.923.344.6626.83602.83-41.843.0684.91240.31[41]
Shandong, China2006–2007123.9615.43203011804840808.4130630[42]
Wuhan, China201495.53-9.8130.131820.763733.4876.463.57180.79419.21[14]
Tianjin, China201578.90.396.924.823454643.314.5110.7819.7580.54[43]
Sha-Lu, Taiwan2013–201439.20.22.4560.9-3.62.5834.5[39]
New Delhi, India2013–2014125.5-8040260494020-20130[44]
Agra, India2016–2017214.67.04238.57193.112737.18-206.57201.84205.39481.09[45]
Seoul, Korea2003–200643.502--17364409192.351115[46]
Chuncheon, Korea2012–20132317.40.4474.481101685.911.1212.338.7[47]
Yeongwol, Korea2012–201319.710.11.024.4765.51647.831.8114.541.3[47]
Table 3. Comparison of the element indices values between haze episode and non-haze episode using the Mann–Whitney U test.
ParameterSampling PeriodsResults of Mann–Whitney U Test
Haze Episode (Median)Non-Haze Episode (Median)Test Value UProbability Test (p)
PM2.560.412.5076.00.0015
Fe22.013.9252.5<0.0001
K77.638.8863.00.0003
Mn0.920.0666.00.0009
Cu0.931.1555.00.9254
Cr3.320.265.00.0952
Ni0.210.1138.00.5418
Pb1.120.41104.50.1317
Cd0.530.06--
Zn1.734.23--
Enrichment factor77.06109.8421.00.3531
p value for the location in haze and non-haze periods of the year for different intensites of PM2.5 and elements. Significance level α = 0.05. Italic values show the realization of condition of the Mann–Whitney test.
Table 4. The average HQ and cancer risk from elemental composition in PM2.5.
ElementRfC (mg/m3)IUR (μg/m3-Day)Haze SeasonNon-Haze Season
HQCancer RiskHQCancer Risk
Cd1.00 × 10−5 *1.80 × 10−3 *4.78 × 10−23.69 × 10−76.96 × 10−35.37 × 10−8
Cr1.00 × 10−4 *1.20 × 10−2 *2.51 × 10−21.29 × 10−55.87 × 10−33.02 × 10−6
Mn5.00 × 10−5 *-2.18 × 10⁻²-2.93 × 10⁻³-
Ni1.40 × 10−5 **2.60 × 10⁻⁴ **1.58 × 10−22.46 × 10−86.89 × 10−31.40 × 10−8
Pb-1.20 × 10⁻⁵ **-8.96 × 10⁻⁹-3.55 × 10−9
* [28]; ** [29].
Publisher’s Note: MDPI stays neutral with regard to jurisdictional claims in published maps and institutional affiliations.

