
Factors Driving Coordinated Development of Urban Green Economy: An Empirical Evidence from the Chengdu-Chongqing Economic Circle


Abstract
:1. Introduction
2. Theoretical Analyses and Research Hypotheses
2.1. Green Economy and Coordinated Development
2.2. Driving Factors of Coordinated Development of Urban Agglomeration
3. Measurement and Space-Time Analysis of Coordinated Development
3.1. Data Sources
3.2. Measurement Method
3.2.1. Evaluation Index System and Measurement Methods of Urban Green Economy Development (GED)
3.2.2. Estimation Method of the Coordination Degree of GED
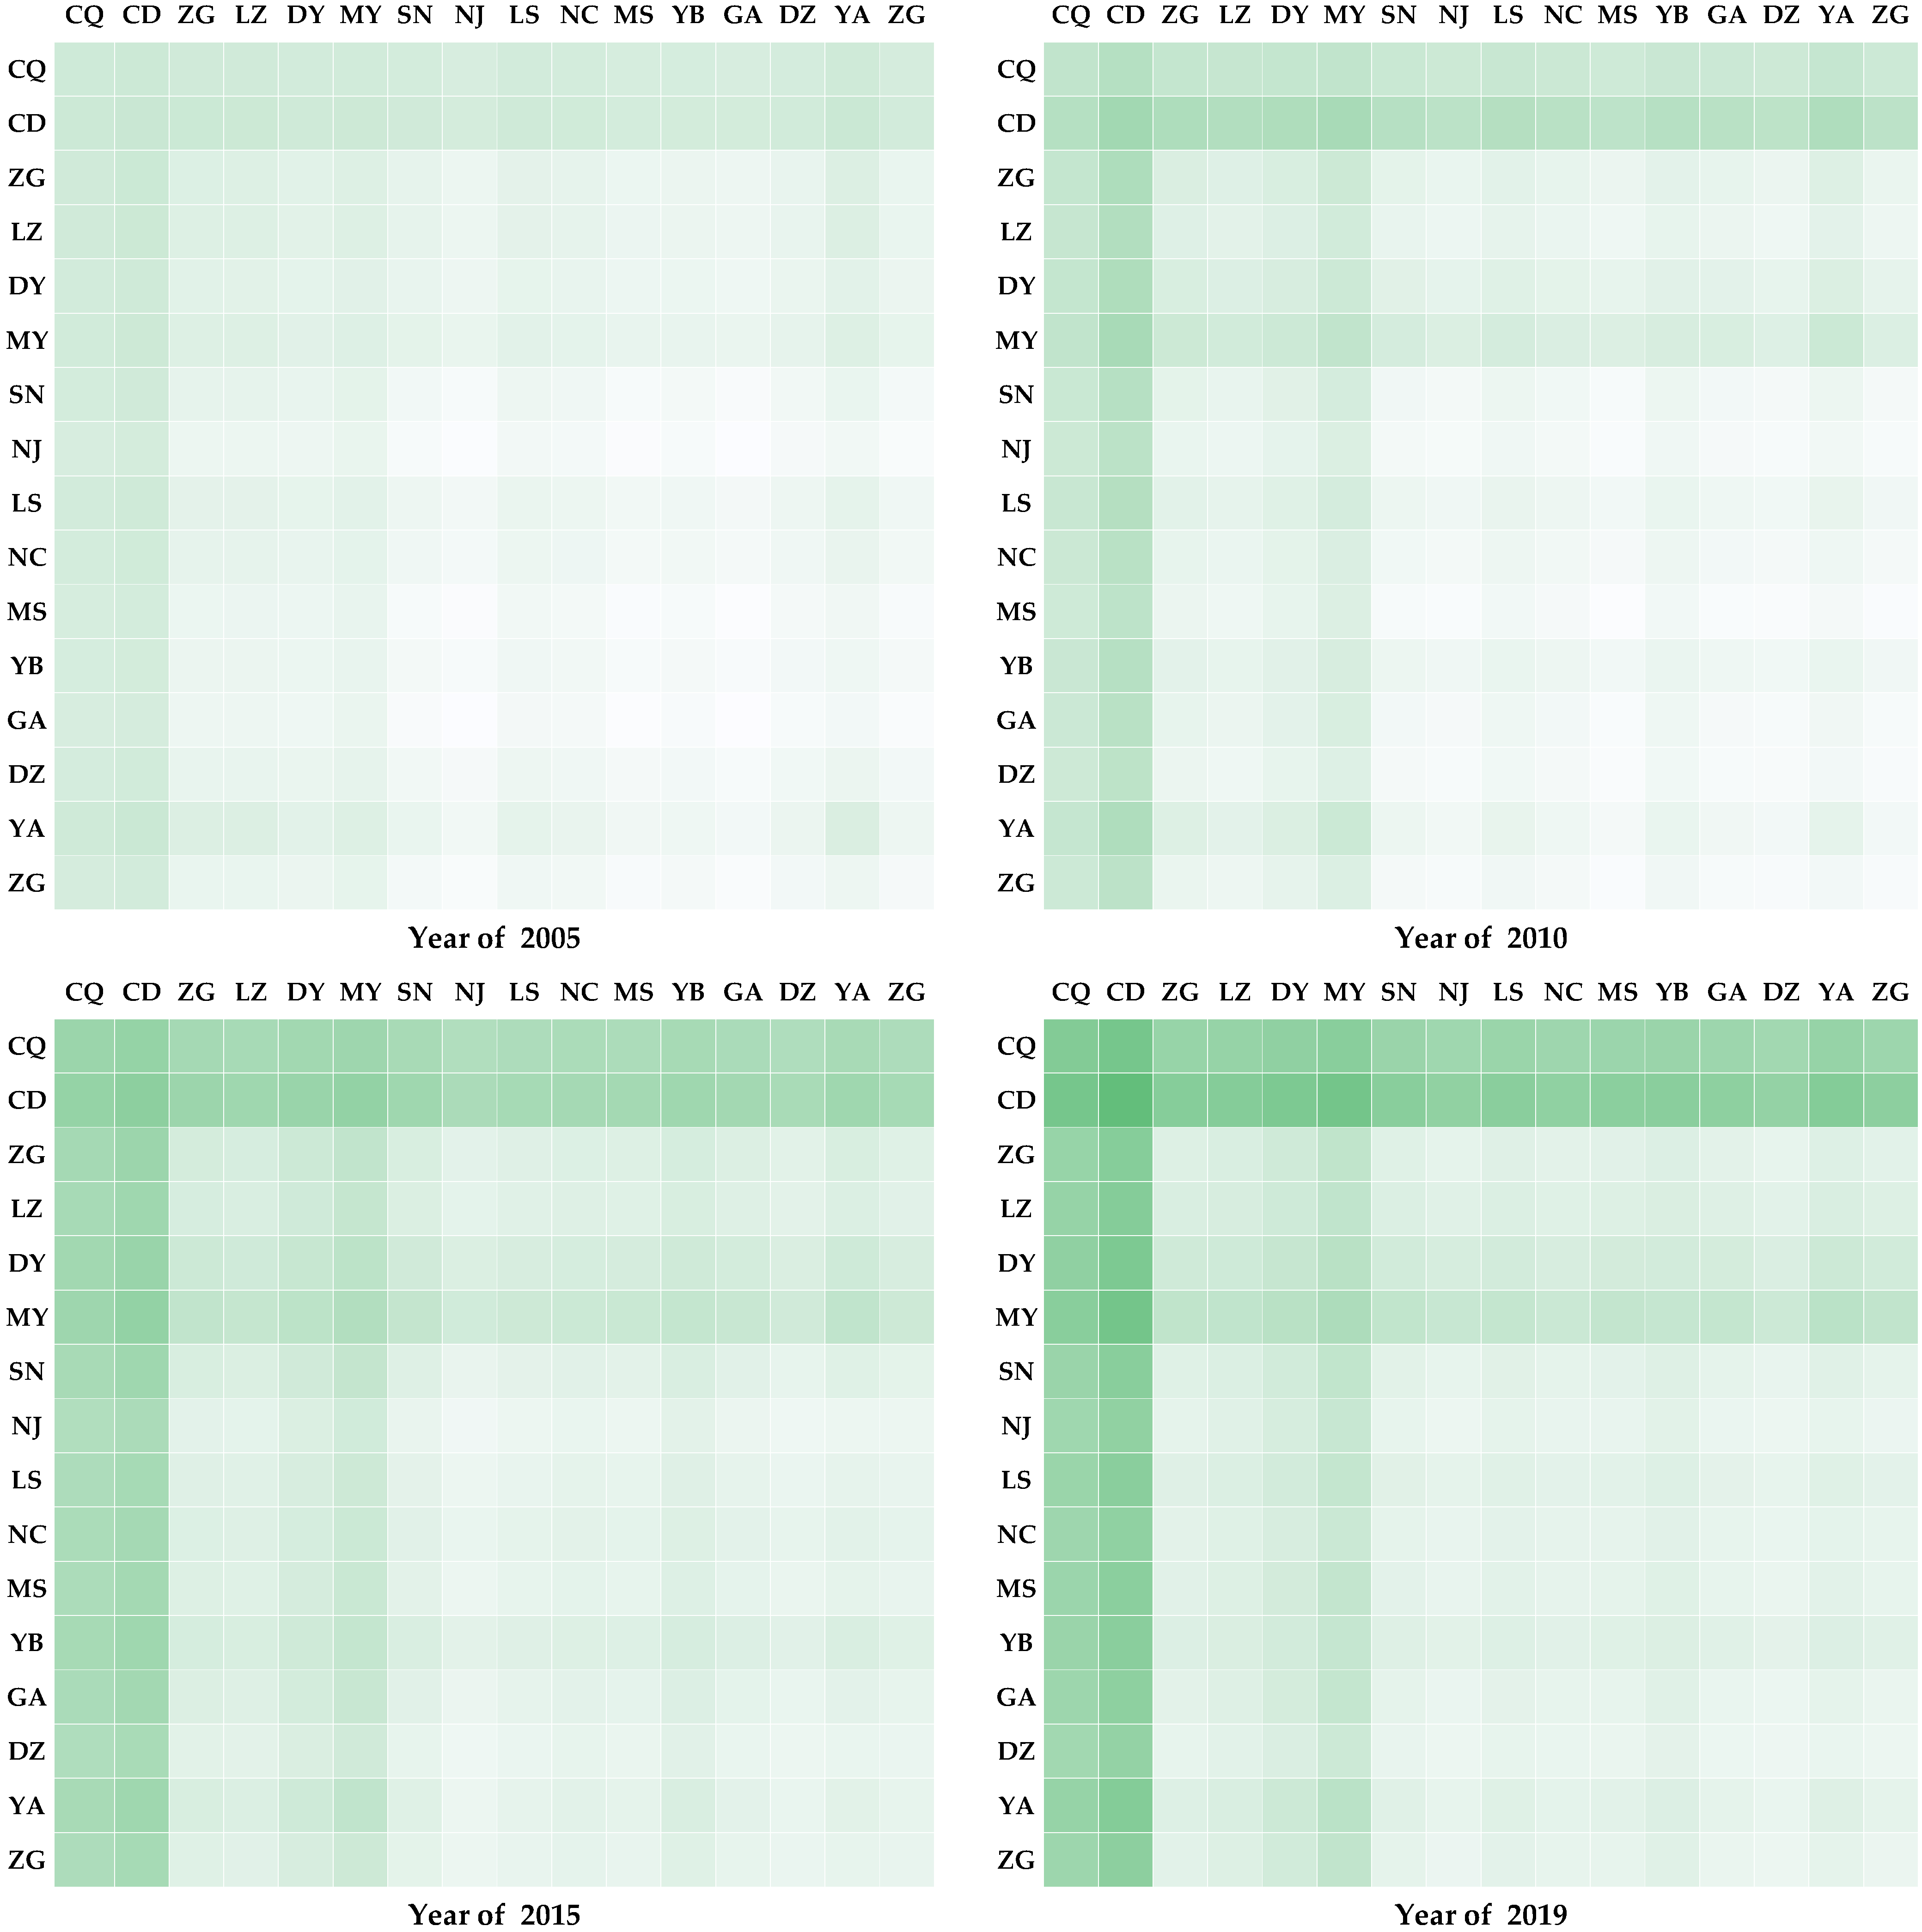
3.2.3. Analysis of the Measurement Results of the Level of Coordinated Development of a Green Economy
4. Empirical Analysis of Driving Factors
4.1. Empirical Model
4.2. Variable Selection
4.3. Empirical Results and Explanations of Driving Factors
4.3.1. Test of Influencing Factors
4.3.2. Verification of Catastrophe Theory
4.3.3. Distinguishing the Pulling Force and Pushing Effect of Influencing Factors
5. Discussion of Empirical Results
6. Conclusions and Policy Recommendations
Author Contributions
Funding
Institutional Review Board Statement
Informed Consent Statement
Data Availability Statement
Acknowledgments
Conflicts of Interest
References
- Dogail, N.M. Water and Civilization: Using History to Reframe Water Policy Debates and to Build a New Ecological Realism. Dirasat Hum. Soc. Sci. 2005, 32, 439–448. [Google Scholar]
- Grossman, G.M.; Krueger, A.B. Economic Growth and the Environment. Q. J. Econ. 1995, 110, 353–377. [Google Scholar] [CrossRef] [Green Version]
- Atif, S.; Umar, M.; Ullah, F.J.N.H. Investigating the flood damages in Lower Indus Basin since 2000: Spatiotemporal analyses of the major flood events. Nat. Hazards 2021, 108, 2357–2383. [Google Scholar] [CrossRef]
- Wehling, P. Agreement on the Nile River Basin Cooperative Framework. In Nile Water Rights; Springer: Berlin/Heidelberg, Germany, 2020; pp. 181–217. [Google Scholar]
- Kumar, D. River Ganges—Historical, cultural and socioeconomic attributes. Aquat. Ecosyst. Health Manag. 2017, 20, 20–28. [Google Scholar] [CrossRef]
- Ji, Y.; Zhang, L. Comparative analysis of spatial–temporal differences in sustainable development between the Yangtze River Economic Belt and the Yellow River Economic Belt. Environ. Dev. Sustain. 2022, 1–16. [Google Scholar] [CrossRef]
- Garnier, J.; Cébron, A.; Tallec, G.; Billen, G.; Sebilo, M.; Martinez, A.J.B. Nitrogen Behaviour and Nitrous Oxide Emission in the Tidal Seine River Estuary (France) as Influenced by Human Activities in the Upstream Watershed. Biogeochemistry 2006, 77, 305–326. [Google Scholar] [CrossRef]
- Uehlinger, U.; Arndt, H.; Wantzen, K.M.; Leuven, R. The Rhine river basin. In Rivers of Europe; Academic Press: London, UK, 2009; pp. 199–245. [Google Scholar]
- Fick, A.; Thomas, S.M.; Williams, D.L.; Hayden, J. Perceptions of cancer and its causes among “Industrial Corridor” residents: The LMRICS Planning Project. Lower Mississippi River Interagency Cancer Study. J. La. State Med. Soc. 1999, 151, 182–188. [Google Scholar]
- Klečka, G.; Persoon, C.; Currie, R. Chemicals of emerging concern in the Great Lakes Basin: An analysis of environmental exposures. In Reviews of Environmental Contamination and Toxicology; Springer: Berlin/Heidelberg, Germany, 2010; Volume 207, pp. 1–93. [Google Scholar]
- Malsy, M.; Flörke, M.; Borchardt, D. What drives the water quality changes in the Selenga Basin: Climate change or socio-economic development? Reg. Environ. Change 2016, 17, 1977–1989. [Google Scholar] [CrossRef]
- Huang, Y.; Salama, M.S.; Krol, M.S.; Su, Z.; Hoekstra, A.Y.; Zeng, Y.; Zhou, Y.J.W.R.R. Estimation of human induced changes in terrestrial water storage through integration of GRACE satellite detection and hydrological modeling: A case study of the Yangtze River basin. Water Resour. Res. 2015, 51, 8494–8516. [Google Scholar] [CrossRef]
- Huang, L.; Yang, P.; Zhang, B.; Hu, W. Spatio-Temporal Coupling Characteristics and the Driving Mechanism of Population-Land-Industry Urbanization in the Yangtze River Economic Belt. Land 2021, 10, 400. [Google Scholar] [CrossRef]
- Robinson, A.R. Erosion and sediment control in China’s Yellow River Basin. J. Soil Water Conserv. 1981, 36, 125–127. [Google Scholar]
- Chen, W.; Chen, Y. Two-Step Measurement of Water–Energy–Food Symbiotic Coordination and Identification of Key Influencing Factors in the Yangtze River Basin. Entropy 2021, 23, 798. [Google Scholar] [CrossRef] [PubMed]
- He, L.; Liu, Y.; He, P.; Zhou, H. Relationship between Air Pollution and Urban Forms: Evidence from Prefecture-Level Cities of the Yangtze River Basin. Int. J. Environ. Res. Public Health 2019, 16, 3459. [Google Scholar] [CrossRef] [PubMed] [Green Version]
- Miao, C.-Y.; Ni, J.-R. Variation of Natural Streamflow since 1470 in the Middle Yellow River, China. Int. J. Environ. Res. Public Health 2009, 6, 2849–2864. [Google Scholar] [CrossRef] [Green Version]
- Liu, X.; Wang, Y.; Li, M. How to Identify Future Priority Areas for Urban Development: An Approach of Urban Construction Land Suitability in Ecological Sensitive Areas. Int. J. Environ. Res. Public Health 2021, 18, 4252. [Google Scholar] [CrossRef]
- LiuHui, Y. Impacts of the Belt and Road Initiative on the spatial pattern of territory development in China. Prog. Geogr. 2015, 34, 545–553. [Google Scholar]
- Zeng, S.; Zhou, Y. Foreign Direct Investment’s Impact on China’s Economic Growth, Technological Innovation and Pollution. Int. J. Environ. Res. Public Health 2021, 18, 2839. [Google Scholar] [CrossRef]
- Zhou, L.; Zhou, C.; Che, L.; Wang, B. Spatio-temporal evolution and influencing factors of urban green development efficiency in China. J. Geogr. Sci. 2020, 30, 724–742. [Google Scholar] [CrossRef]
- Liu, N.; Liu, C.; Xia, Y.; Ren, Y.; Liang, J. Examining the Coordination Between Green Finance and Green Economy Aiming for Sustainable Development: A Case Study of China. Sustainability 2020, 12, 3717. [Google Scholar] [CrossRef]
- Dai, H.; Xie, X.; Xie, Y.; Liu, J.; Masui, T. Green growth: The economic impacts of large-scale renewable energy development in China. Appl. Energy 2016, 162, 435–449. [Google Scholar] [CrossRef]
- Wu, Y.; Wang, P.; Liu, X.; Chen, J.; Song, M. Analysis of regional carbon allocation and carbon trading based on net primary productivity in China. China Econ. Rev. 2020, 60, 101401. [Google Scholar] [CrossRef]
- Gao, Y.; Zhang, M.; Zheng, J. Accounting and determinants analysis of China’s provincial total factor productivity considering carbon emissions. China Econ. Rev. 2020, 65, 101576. [Google Scholar] [CrossRef]
- Dogaru, L. Green Economy and Green Growth—Opportunities for Sustainable Development. Proceedings 2020, 63, 70. [Google Scholar]
- Li, Y.; Zhang, X.; Lin, K.; Huang, Q. The Analysis of a Simulation of a Port City Green Cooperative Development, Based on System Dynamics: A Case Study of Shanghai Port, China. Sustainability 2019, 11, 5948. [Google Scholar] [CrossRef] [Green Version]
- Droste, N.; Hansjürgens, B.; Kuikman, P.J.; Otter, N.R.; Antikainen, R.; Leskinen, P.; Pitkänen, K.; Saikku, L.; Loiseau, E.; Thomsen, M. Steering innovations towards a green economy: Understanding government intervention. J. Clean. Prod. 2016, 135, 426–434. [Google Scholar] [CrossRef]
- Li, H.; Zhou, L.-A. Political turnover and economic performance: The incentive role of personnel control in China. J. Public Econ. 2005, 89, 1743–1762. [Google Scholar] [CrossRef]
- He, J.; Liu, H.; Salvo, A. Severe Air Pollution and Labor Productivity: Evidence from Industrial Towns in China. Am. Econ. J. Appl. Econ. 2019, 11, 173–201. [Google Scholar] [CrossRef] [Green Version]
- Ye, Y.; LeGates, R.T.; Qin, B. Coordinated Urban-Rural Development Planning in China. J. Am. Plan. Assoc. 2013, 79, 125–137. [Google Scholar] [CrossRef]
- Groenendijk, J.G. Coordination of Urban Economic Development Policies in The Netherlands. Tijdschr. Econ. Soc. Geogr. 1990, 81, 289–298. [Google Scholar] [CrossRef]
- Thom, R. Structural Stability and Morphogenesis: An Outline of a General Theory of Models; CRC Press: Boca Raton, FL, USA, 1989. [Google Scholar]
- Van Dijk, F.; Nijkamp, P. Analysis of conflicts in dynamical environmental systems via catastrophe theory. Reg. Sci. Urban Econ. 1980, 10, 429–451. [Google Scholar] [CrossRef]
- Zeeman, E.C.; Barrett, T.W. Catastrophe Theory, Selected Papers 1972–1977. IEEE Trans. Syst. Man Cybern. 1979, 9, 609–610. [Google Scholar] [CrossRef]
- Henley, S. Catastrophe theory models in geology. J. Int. Assoc. Math. Geol. 1976, 8, 649–655. [Google Scholar] [CrossRef]
- Tan, N.D. Applying the “Pull-push” Theory in the Study of the Current Free Labour Migration from Rural to Urban Areas for Jobs in Vietnam. VNU J. Sci. Policy Manag. Stud. 2019, 35. [Google Scholar] [CrossRef]
- Imbert, C.; Seror, M.; Zhang, Y.; Zylberberg, Y. Migrants and Firms: Evidence from China; CESifo Working Paper Series; CESifo GmbH: Munich, Germany, 2018. [Google Scholar]
- Hao, L. Cumulative Causation of Rural Migration and Initial Peri-Urbanization in China. Chin. Sociol. Rev. 2012, 44, 33–36. [Google Scholar] [CrossRef] [Green Version]
- Gries, T.; Kraft, M.; Simon, M. Explaining inter-provincial migration in China. Pap. Reg. Sci. 2016, 95, 709–731. [Google Scholar] [CrossRef]
- Slichter, C.P. Principles of Magnetic Resonance; Springer: Berlin/Heidelberg, Germany, 1963; Volume 1. [Google Scholar]
- Wang, H.; Zhang, B.; Liu, Y.; Liu, Y.; Xu, S.; Zhao, Y.; Chen, Y.; Hong, S. Urban expansion patterns and their driving forces based on the center of gravity-GTWR model: A case study of the Beijing-Tianjin-Hebei urban agglomeration. J. Geogr. Sci. 2020, 30, 297–318. [Google Scholar] [CrossRef]
- Chen, M.; Zhou, Y.; Hu, M.; Zhou, Y. Influence of Urban Scale and Urban Expansion on the Urban Heat Island Effect in Metropolitan Areas: Case Study of Beijing-Tianjin-Hebei Urban Agglomeration. Remote Sens. 2020, 12, 3491. [Google Scholar] [CrossRef]
- Lee, C.-I. Agglomeration, search frictions and growth of cities in developing economies. Ann. Reg. Sci. 2015, 55, 421–451. [Google Scholar] [CrossRef]
- Zhao, Y.-L. Market Access, Border Effect and Economic Concentration—Based on Urban Economic Activity and Center-Periphery Model. China Ind. Econ. 2012, 3, 71–83. [Google Scholar] [CrossRef]
- He, H.; Lyu, B. The Measurement on Economic Connection in Changzhutan Urban Agglomeration. Econ. Geogr. 2014, 34, 67–74. [Google Scholar]
- Glaeser, E.L. Cities, Agglomeration and Spatial Equilibrium; OUP Oxford: Oxford, UK, 2008. [Google Scholar]
- Sassen, S. On concentration and centrality in the global city. World Cities World Syst. 1995, 63, 71. [Google Scholar]
- Stanilov, K. (Ed.) The Post-Socialist City: Urban Form and Space Transformations in Central and Eastern Europe after Socialism; Springer Science & Business Media: Berlin/Heidelberg, Germany, 2007. [Google Scholar]
- Gwee, T.M.; Eng, B. Exploring the Economic Impacts of Agglomeration Economies in Urban Rail Projects. Ph.D. Thesis, Monash University, Melbourne, Australia, 2010. [Google Scholar]
- Cui, X.; Fang, C.; Liu, H.; Liu, X. Assessing sustainability of urbanization by a coordinated development index for an Urbanization-Resources-Environment complex system: A case study of Jing-Jin-Ji region, China. Ecol. Indic. 2019, 96, 383–391. [Google Scholar] [CrossRef]
- Cai, L.; Liu, W. Decisions on the Orderliness and Collaborative Operation Mechanism of Each Subsystem under the Organizational Model of the Internet of Things. Sci. Program. 2021, 2021, 2179343. [Google Scholar] [CrossRef]
- Jing, Z.; Wang, J. Sustainable development evaluation of the society–economy–environment in a resource-based city of China: A complex network approach. J. Clean. Prod. 2020, 263, 121510. [Google Scholar] [CrossRef]
- Liu, Y.; Xu, J.; Luo, H. An Integrated Approach to Modelling the Economy-Society-Ecology System in Urbanization Process. Sustainability 2014, 6, 1946–1972. [Google Scholar] [CrossRef] [Green Version]
- Zhao, L.; Zhang, G. Evaluation and welfare effect of coordinated ecological development of the Beijing–Tianjin–Hebei region. Chin. J. Popul. Resour. Environ. 2021, 19, 283–290. [Google Scholar] [CrossRef]
- Capozza, I.; Rachel, S. Towards Green Growth in Emerging Market Economies; OECD Green Growth Papers; OECD Publishing: Paris, France, 2019. [Google Scholar]
- Sueyoshi, T. Damages to return with a possible occurrence of eco-technology innovation measured by DEA environmental assessment. J. Econ. Struct. 2017, 6, 7. [Google Scholar] [CrossRef] [Green Version]
- Wang, Q.; Yuan, X.; Zhang, J.; Gao, Y.; Hong, J.; Zuo, J.; Liu, W. Assessment of the Sustainable Development Capacity with the Entropy Weight Coefficient Method. Sustainability 2015, 7, 13542–13563. [Google Scholar] [CrossRef] [Green Version]
- Zhang, M.; Li, B. How to Improve Regional Innovation Quality from the Perspective of Green Development? Findings From Entropy Weight Method and Fuzzy-Set Qualitative Comparative Analysis. IEEE Access 2020, 8, 32575–32586. [Google Scholar] [CrossRef]
- Wencheng, H.; Bin, S.; Jing, Z.; Lei, W.; Jie, M. Corrected Entropy Based Operation Performance Evaluation about Urban Rail Transportation Non-Networks System. J. Transp. Syst. Eng. Inf. Technol. 2016, 16, 115–121. [Google Scholar]
- Zuo, Z.; Guo, H.; Cheng, J.; Li, Y. How to achieve new progress in ecological civilization construction? Based on cloud model and coupling coordination degree model. Ecol. Indic. 2021, 127, 107789. [Google Scholar] [CrossRef]
- Sun, C.; Zhang, S.; Song, C.; Xu, J.; Fan, F. Investigation of Dynamic Coupling Coordination between Urbanization and the Eco-Environment A Case Study in the Pearl River Delta Area. Land 2021, 10, 190. [Google Scholar] [CrossRef]
- Geng, Y.; Wei, Z.; Zhang, H.; Maimaituerxun, M. Analysis and Prediction of the Coupling Coordination Relationship between Tourism and Air Environment: Yangtze River Economic Zone in China as Example. Discret. Dyn. Nat. Soc. 2020, 2020, 1406978. [Google Scholar] [CrossRef]
- Geng, Y.; Zhang, H. Coordination assessment of environment and urbanization: Hunan case. Environ. Monit. Assess. 2020, 192, 637. [Google Scholar] [CrossRef] [PubMed]
- Tomal, M. Evaluation of coupling coordination degree and convergence behaviour of local development: A spatiotemporal analysis of all Polish municipalities over the period 2003–2019. Sustain. Cities Soc. 2021, 71, 102992. [Google Scholar] [CrossRef]
- Zhang, J.; Dong, Z. Assessment of Coupling Coordination Degree and Water Resources Carrying Capacity of Hebei Province (China) based on WRESP2D2P framework and GTWR approach. Sustain. Cities Soc. 2022, 82, 103862. [Google Scholar] [CrossRef]
- Song, Q.; Zhou, N.; Liu, T.; Siehr, S.A.; Qi, Y. Investigation of a “coupling model” of coordination between low-carbon development and urbanization in China. Energy Policy 2018, 121, 346–354. [Google Scholar] [CrossRef] [Green Version]
- Tang, Z.; Zhang, Z.; Zuo, L.; Wang, X.; Hu, S.; Zhu, Z. Spatial econometric analysis of the relationship between urban land and regional economic development in the Beijing–Tianjin–Hebei coordinated development region. Sustainability 2020, 12, 8451. [Google Scholar] [CrossRef]
- Li, Y.; Wang, J.; Liu, Y.-s.; Long, H. Problem regions and regional problems of socioeconomic development in China: A perspective from the coordinated development of industrialization, informatization, urbanization and agricultural modernization. J. Geogr. Sci. 2014, 24, 1115–1130. [Google Scholar] [CrossRef]
- Zhang, J.; Chang, Y.; Zhang, L.; Li, D. Do technological innovations promote urban green development: A spatial econometric analysis of 105 cities in China. J. Clean. Prod. 2018, 182, 395–403. [Google Scholar] [CrossRef]
- Fu, M. Geographical Distance and Technological Spillover Effects: A Spatial Econometric Explanation of Technological and Economic Agglomeration Phenomena. China Econ. Q. 2009, 8, 1549–1566. [Google Scholar]
- Lee, Y.; Hemmert, M.; Kim, J. What drives the international ownership strategies of Chinese firms? The role of distance and home-country institutional factors in outward acquisitions. Asian Bus. Manag. 2014, 13, 197–225. [Google Scholar] [CrossRef]
- Wang, R. The Influence of Environmental Regulation on the Efficiency of China s Regional Green Economy Based on the GMM Model. Pol. J. Environ. Stud. 2020, 29, 2395–2402. [Google Scholar] [CrossRef]
- Xiao, Y.; Li, Y.; Huang, H. Conflict or coordination? Assessment of coordinated development between socioeconomic and ecological environment in resource-based cities: Evidence from Sichuan province of China. Environ. Sci. Pollut. Res. 2021, 28, 66327–66339. [Google Scholar] [CrossRef]
- Yan, S.; Chen, C. The Spatial Transformation of Traditional Rural Villages Driven by Private Investment in China’s Developed Areas: The Case of Daxi Village, Anji County. J. Reg. City Plan. 2018, 29, 156–168. [Google Scholar] [CrossRef] [Green Version]
- Li, Z.; Chan, P.W.; Biling, L.; Lijie, Z. Why the number of haze days in Shenzhen, China has reduced since 2005: From a perspective of industrial structure. Mausam 2018, 69, 45–54. [Google Scholar] [CrossRef]
- Rupasingha, A.; Marre, A.W. Moving to the hinterlands: Agglomeration, search costs and urban to rural business migration. J. Econ. Geogr. 2020, 20, 123–153. [Google Scholar] [CrossRef]
- Xiwei, W.; Jing, G.; Chengrong, D. Regional Development, Economic Opportunities, Income Returns and Inter-provincial Migration. South China Popul. 2013, 6, 54–61. [Google Scholar]
- Lin, S.; Chen, Z.; He, Z. Rapid Transportation and Green Technology Innovation in Cities from the View of the Industrial Collaborative Agglomeration. Appl. Sci. 2021, 11, 8110. [Google Scholar] [CrossRef]
- Lu, X.; Wang, M.; Tang, Y. The Spatial Changes of Transportation Infrastructure and Its Threshold Effects on Urban Land Use Efficiency: Evidence from China. Land 2021, 10, 346. [Google Scholar] [CrossRef]
- Li, Z.; Ding, C.; Niu, Y. Industrial structure and urban agglomeration: Evidence from Chinese cities. Ann. Reg. Sci. 2019, 63, 191–218. [Google Scholar] [CrossRef]
- Cervero, R. Efficient Urbanisation: Economic Performance and the Shape of the Metropolis. Urban Stud. 2001, 38, 1651–1671. [Google Scholar] [CrossRef]

| Order Parameter | Specific Index | Unit | Nature | Symbol |
|---|---|---|---|---|
| Subsystem 1: Economic growth | ||||
| Level of development | Per capita GDP | Yuan/person | Positive | X1 |
| Structural upgrading | The proportion of tertiary industry in GDP | % | Positive | X2 |
| Technical innovation | R&D staff equivalent to full-time staff | 10,000 people/person | Positive | X3 |
| Degree of openness | Import and export per 10,000 people | 10,000 yuan/person | Positive | X4 |
| Subsystem 2: Social development | ||||
| Urban development | Urbanization rate | % | Positive | X5 |
| Standard of living | Engel system of urban households | % | Negative | X6 |
| Urban per capita disposable income | Yuan/person | Positive | X7 | |
| Input in education | Per capita financial expenditure on Education | Yuan/person | Positive | X8 |
| Medical input | Hospital beds per capita | Bed/person | Positive | X9 |
| Transportation | Urban road area per capita | /person | Positive | X10 |
| Subsystem 3: Environment quality | ||||
| Pollution discharge | Industrial SO2 Emissions Per capita | Tons/person | Negative | X11 |
| Industrial NOx Emissions per capita | Tons/person | Negative | X12 | |
| Industrial soot and dust emissions per capita | Tons/person | Negative | X13 | |
| Subsystem 4: Natural capital | ||||
| Ecological security | Water production capacity per capita | Tons/person | Positive | X14 |
| Number of forest fires per capita | Times/person | Positive | X15 | |
| Green City | Green coverage rate of built-up area | % | Positive | X16 |
| Per capita park green space area | /person | Positive | X17 | |
| Subsystem 5: Policy response | ||||
| Ecological impact | Harmless treatment rate of garbage | % | Positive | X18 |
| Harmless treatment rate of domestic waste | % | Positive | X19 | |
| Variable Code | Variable Name | Average | Standard Error | Min | Max |
|---|---|---|---|---|---|
| lny | Synergy degree | 0.380 | 0.074 | 0.271 | 0.638 |
| Ln economic agglomeration (LEA) | Similarity of economic agglomeration | 0.658 | 0.047 | 0.430 | 0.693 |
| Ln resource endowment (LRE) | Similarity of resource endowment | 0.546 | 0.144 | 0.154 | 0.693 |
| Ln traffic (LT) | Similarity of transportation infrastructure | 0.672 | 0.032 | 0.466 | 0.693 |
| Ln regional opening (LRO) | Regional openness similarity | 0.569 | 0.122 | 0.172 | 0.693 |
| Ln market subject (LMS) | Market subject similarity | 0.693 | 0.001 | 0.689 | 0.693 |
| Ln industrial structure (LIS) | Industrial structure similarity | 0.689 | 0.008 | 0.649 | 0.693 |
| Ln Chengdu (LCD) | Per capita GDP of Chengdu | 10.823 | 0.523 | 9.885 | 11.546 |
| Ln Chongqing (LCQ) | Per capita GDP of Chongqing | 10.475 | 0.595 | 9.420 | 11.236 |
| D economic agglomeration (DEA) | Economic agglomeration and distance interaction term | 3.409 | 0.420 | 2.059 | 4.457 |
| D market subject (DMS) | Market and distance interaction item | 3.590 | 0.374 | 2.513 | 4.457 |
| Model 5 | Model 6 | Model 7 | ||||
|---|---|---|---|---|---|---|
| Panel A. Empirical Results | ||||||
| LEA | −0.488 *** | (0.077) | −0.488 *** | (0.077) | −2.829 *** | (0.741) |
| LRE | −0.064 *** | (0.008) | −0.064 *** | (0.008) | −0.066 *** | (0.008) |
| LT | 0.246 *** | (0.043) | 0.246 *** | (0.043) | 0.229 *** | (0.043) |
| LRO | −0.101 *** | (0.006) | −0.101 *** | (0.006) | −0.095 *** | (0.006) |
| LMS | −5.095 *** | (1.137) | −5.095 *** | (1.137) | −67.583 *** | (10.390) |
| LIS | 0.434 *** | (0.121) | 0.434 *** | (0.121) | 0.340 *** | (0.120) |
| LCD | 1.587 *** | (0.182) | 1.568 *** | (0.179) | ||
| LCQ | −1.404 *** | (0.166) | -1.389 *** | (0.163) | ||
| DEA | 0.457 *** | (0.142) | ||||
| DMS | 11.781 *** | (1.944) | ||||
| Constant | 3.816 *** | (0.804) | 1.364 * | (0.824) | 2.446 *** | (0.834) |
| Urban fixed effect | YES | YES | YES | |||
| Year fixed effect | YES | YES | YES | |||
| N | 1800 | 1800 | 1800 | |||
| R2 | 0.705 | 0.705 | 0.713 | |||
| Panel B. Tests | ||||||
| Hausman test | 225.25 *** | 251.39 *** | 251.39 *** | |||
| Wald test | 6894.73 *** | 6894.73 *** | 7394.87 *** | |||
| Pesaran test | 2.833 *** | 2.833 *** | 2.825 *** | |||
| Wooldridge test | 411.516 *** | 660.998 *** | 678.327 *** | |||
| Panel C. Robustness checks | ||||||
| LEA | −1.868 *** | (0.158) | −1.868 *** | (0.158) | −2.498 | (1.531) |
| LRE | −0.090 *** | (0.016) | −0.090 *** | (0.016) | −0.098 *** | (0.016) |
| LT | 0.572 *** | (0.089) | 0.572 *** | (0.089) | 0.539 *** | (0.088) |
| LRO | −0.216 *** | (0.012) | −0.216 *** | (0.012) | −0.209 *** | (0.012) |
| LMS | −11.045 *** | (2.341) | −11.045 *** | (2.341) | −135.845 *** | (21.482) |
| LIS | 1.446 *** | (0.249) | 1.446 *** | (0.249) | 1.265 *** | (0.249) |
| LCD | 0.960 ** | (0.374) | 0.945 ** | (0.371) | ||
| LCQ | −0.830 ** | (0.341) | −0.817 ** | (0.338) | ||
| DEA | 0.133 | (0.294) | ||||
| DMS | 23.495 *** | (4.020) | ||||
| Constant | 7.743 *** | (1.657) | 6.072*** | (1.697) | 8.317 *** | (1.725) |
| Urban fixed effect | YES | YES | YES | |||
| Year fixed effect | YES | YES | YES | |||
| N | 1800 | 1800 | 1800 | |||
| R2 | 0.492 | 0.492 | 0.502 | |||
| 2005–2010 | 2011–2015 | 2016–2019 | |||||||
|---|---|---|---|---|---|---|---|---|---|
| Model 5 | Model 6 | Model 7 | Model 5 | Model 6 | Model 7 | Model 5 | Model 6 | Model 7 | |
| LEA | −0.746 *** | −0.746 *** | −1.950 *** | 0.414 ** | 0.414 ** | −1.250 | −0.792 * | −0.792 * | −8.050 * |
| (0.064) | (0.064) | (0.609) | (0.167) | (0.167) | (1.807) | (0.449) | (0.449) | (4.180) | |
| LRE | −0.018 ** | −0.018 ** | −0.018 ** | 0.008 | 0.008 | 0.008 | 0.030 *** | 0.030 *** | 0.032 *** |
| (0.007) | (0.007) | (0.007) | (0.007) | (0.007) | (0.007) | (0.010) | (0.010) | (0.010) | |
| LT | 0.020 | 0.020 | 0.023 | −0.742 *** | −0.742 *** | −0.738 *** | −0.394 *** | −0.394 *** | −0.398 *** |
| (0.026) | (0.026) | (0.026) | (0.094) | (0.094) | (0.094) | (0.112) | (0.112) | (0.112) | |
| LRO | −0.019 *** | −0.019 *** | −0.018 *** | −0.031 *** | −0.031 *** | −0.031 *** | −0.006 | −0.006 | −0.006 |
| (0.006) | (0.006) | (0.006) | (0.008) | (0.008) | (0.008) | (0.009) | (0.009) | (0.009) | |
| LMS | 0.682 | 0.682 | 5.104 | 10.754 *** | 10.754 *** | −51.987 * | −6.337 *** | −6.337 *** | −14.124 |
| (1.056) | (1.056) | (9.224) | (3.580) | (3.580) | (31.180) | (1.291) | (1.291) | (11.742) | |
| LIS | −1.625 *** | −1.625 *** | −1.608 *** | 0.621 ** | 0.621 ** | 0.554 ** | 1.529 *** | 1.529 *** | 1.483 *** |
| (0.140) | (0.140) | (0.140) | (0.243) | (0.243) | (0.244) | (0.202) | (0.202) | (0.205) | |
| LCD | 0.514 *** | 0.513 *** | 0.035 *** | 0.035 *** | −0.084 *** | −0.084 *** | |||
| (0.115) | (0.115) | (0.007) | (0.007) | (0.014) | (0.014) | ||||
| LCQ | −0.447 *** | −0.446 *** | 0.061 *** | 0.060 *** | 0.298 *** | 0.295 *** | |||
| (0.104) | (0.104) | (0.005) | (0.005) | (0.029) | (0.029) | ||||
| DEA | 0.233 ** | 0.322 | 1.435 * | ||||||
| (0.117) | (0.343) | (0.818) | |||||||
| DMS | −0.829 | 11.476 ** | 1.508 | ||||||
| (1.726) | (5.661) | (2.204) | |||||||
| cons | 1.488 ** | 0.618 | 0.521 | −7.272 *** | −8.284 *** | −5.974 ** | 4.509 *** | 2.159 ** | 2.072 ** |
| (0.725) | (0.734) | (0.748) | (2.433) | (2.433) | (2.685) | (0.957) | (0.961) | (0.978) | |
| Urban fixed effect | YES | YES | YES | YES | YES | YES | YES | YES | YES |
| Year fixed effect | YES | YES | YES | YES | YES | YES | YES | YES | YES |
| N | 720 | 720 | 720 | 600 | 600 | 600 | 480 | 480 | 480 |
| R2 | 0.633 | 0.633 | 0.636 | 0.911 | 0.911 | 0.912 | 0.643 | 0.643 | 0.647 |
| Model 5 | Model 6 | Model 7 | |
|---|---|---|---|
| LEA | −0.143 *** | −0.143 *** | −0.721 |
| (0.047) | (0.047) | (0.465) | |
| LRE | −0.001 | −0.001 | −0.003 |
| (0.006) | (0.006) | (0.006) | |
| LT | −0.204 *** | −0.204 *** | −0.230 *** |
| (0.049) | (0.049) | (0.049) | |
| LRO | −0.011 * | −0.011 * | −0.010 |
| (0.006) | (0.006) | (0.006) | |
| LMD | 3.013 *** | 3.013 *** | −25.041 *** |
| (0.790) | (0.790) | (7.486) | |
| LIS | 0.619 *** | 0.619 *** | 0.556 *** |
| (0.117) | (0.117) | (0.119) | |
| LCD | 1.056 *** | 1.117 *** | |
| (0.186) | (0.184) | ||
| LCQ | −0.871 *** | −0.927 *** | |
| (0.170) | (0.168) | ||
| DEA | 0.115 | ||
| (0.090) | |||
| DMS | 5.175 *** | ||
| (1.372) | |||
| Constant | −1.879 *** | −4.114 *** | −3.672 *** |
| (0.556) | (0.590) | (0.593) | |
| Urban fixed effect | YES | YES | YES |
| Year fixed effect | YES | YES | YES |
| N | 420 | 420 | 420 |
| R2 | 0.978 | 0.978 | 0.979 |
| I | II | Ⅲ | Ⅳ | |
|---|---|---|---|---|
| LEA | −0.488 *** | −2.829 *** | −0.488 *** | −2.829 *** |
| (0.077) | (0.741) | (0.077) | (0.741) | |
| LRE | −0.064 *** | −0.066 *** | −0.064 *** | −0.066 *** |
| (0.008) | (0.008) | (0.008) | (0.008) | |
| LT | 0.246 *** | 0.229 *** | 0.246 *** | 0.229 *** |
| (0.043) | (0.043) | (0.043) | (0.043) | |
| LRO | −0.101 *** | −0.095 *** | −0.101 *** | −0.095 *** |
| (0.006) | (0.006) | (0.006) | (0.006) | |
| LMD | −5.095 *** | −67.583 *** | −5.095 *** | −67.583 *** |
| (1.137) | (10.390) | (1.137) | (10.390) | |
| LIS | 0.434 *** | 0.340 *** | 0.434 *** | 0.340 *** |
| (0.121) | (0.120) | (0.121) | (0.120) | |
| LCD | 0.052 *** | 0.051 *** | ||
| (0.001) | (0.001) | |||
| DEA | 0.457 *** | 0.457 *** | ||
| (0.142) | (0.142) | |||
| DMS | 11.781 *** | 11.781 *** | ||
| (1.944) | (1.944) | |||
| LCQ | 0.047 *** | 0.046 *** | ||
| (0.001) | (0.001) | |||
| Constant | 3.307 *** | 4.367 *** | 3.372 *** | 4.431 *** |
| (0.803) | (0.814) | (0.803) | (0.814) | |
| Urban fixed effect | YES | YES | YES | YES |
| Year fixed effect | YES | YES | YES | YES |
| N | 1800 | 1800 | 1800 | 1800 |
| R2 | 0.705 | 0.713 | 0.705 | 0.713 |
Publisher’s Note: MDPI stays neutral with regard to jurisdictional claims in published maps and institutional affiliations. |
© 2022 by the authors. Licensee MDPI, Basel, Switzerland. This article is an open access article distributed under the terms and conditions of the Creative Commons Attribution (CC BY) license (https://creativecommons.org/licenses/by/4.0/).
Share and Cite
Wu, S.; Deng, X.; Qi, Y. Factors Driving Coordinated Development of Urban Green Economy: An Empirical Evidence from the Chengdu-Chongqing Economic Circle. Int. J. Environ. Res. Public Health 2022, 19, 6107. https://doi.org/10.3390/ijerph19106107
Wu S, Deng X, Qi Y. Factors Driving Coordinated Development of Urban Green Economy: An Empirical Evidence from the Chengdu-Chongqing Economic Circle. International Journal of Environmental Research and Public Health. 2022; 19(10):6107. https://doi.org/10.3390/ijerph19106107
Chicago/Turabian StyleWu, Sentao, Xin Deng, and Yanbin Qi. 2022. "Factors Driving Coordinated Development of Urban Green Economy: An Empirical Evidence from the Chengdu-Chongqing Economic Circle" International Journal of Environmental Research and Public Health 19, no. 10: 6107. https://doi.org/10.3390/ijerph19106107
APA StyleWu, S., Deng, X., & Qi, Y. (2022). Factors Driving Coordinated Development of Urban Green Economy: An Empirical Evidence from the Chengdu-Chongqing Economic Circle. International Journal of Environmental Research and Public Health, 19(10), 6107. https://doi.org/10.3390/ijerph19106107