
Effects of Tetraselmis chuii Microalgae Supplementation on Anthropometric, Hormonal and Hematological Parameters in Healthy Young Men: A Double-Blind Study

 ,
,  ,
, 
 ,
,  and
and
Abstract
:1. Introduction
2. Materials and Methods
2.1. Subjects
2.2. Study Design
2.3. Anthropometry
2.4. Nutritional Assessment
2.5. Blood Collection and Determination of Hematological Parameters
2.6. Hormone Determination
2.7. Statistical Analysis
3. Results
4. Discussion
5. Conclusions
Author Contributions
Funding
Institutional Review Board Statement
Informed Consent Statement
Data Availability Statement
Acknowledgments
Conflicts of Interest
References
- Eseberri, I.; Gómez-Zorita, S.; Trepiana, J.; González-Arceo, M.; Aguirre, L.; Milton-Laskibar, I.; González, M.; Fernández-Quintela, A.; Portillo, M.P. Anti-Obesity Effects of Microalgae. Int. J. Mol. Sci. 2019, 21, 41. [Google Scholar] [CrossRef] [Green Version]
- Wang, J.; Hu, X.; Chen, J.; Wang, T.; Huang, X.; Chen, G. The Extraction of β-Carotene from Microalgae for Testing Their Health Benefits. Foods 2022, 11, 502. [Google Scholar] [CrossRef] [PubMed]
- Koyande, A.K.; Chew, K.W.; Rambabu, K.; Tao, Y.; Chu, D.T.; Show, P.L. Microalgae: A potential alternative to health supplementation for humans. Food Sci. Hum. Wellness 2019, 8, 16–24. [Google Scholar] [CrossRef]
- Sathasivam, R.; Radhakrishnan, R.; Hashem, A.; Abd Allah, E.F. Microalgae metabolites: A rich source for food and medicine. Saudi J. Biol. Sci. 2019, 26, 709–722. [Google Scholar] [CrossRef] [PubMed]
- Gaignard, C.; Gargouch, N.; Dubessay, P.; Delattre, C.; Pierre, G.; Laroche, C.; Fendri, I.; Abdelkafi, S.; Michaud, P. New horizons in culture and valorization of red microalgae. Biotechnol. Adv. 2019, 37, 193–222. [Google Scholar] [CrossRef]
- da Silva Vaz, B.; Moreira, J.B.; de Morais, M.G.; Costa, J.A.V. Microalgae as a new source of bioactive compounds in food supplements. Curr. Opin. Food Sci. 2016, 7, 73–77. [Google Scholar] [CrossRef]
- Toro, V.; Siquier-Coll, J.; Bartolomé, I.; Robles-Gil, M.C.; Rodrigo, J.; Maynar-Mariño, M. Effects of tetraselmis chuii microalgae supplementation on ergospirometric, haematological and biochemical parameters in amateur soccer players. Int. J. Environ. Res. Public Health 2020, 17, 6885. [Google Scholar] [CrossRef]
- Seghiri, R.; Kharbach, M.; Essamri, A. Functional composition, nutritional properties, and biological activities of moroccan spirulina microalga. J. Food Qual. 2019, 2019, 3707219. [Google Scholar] [CrossRef] [Green Version]
- Akbarian, M.; Khani, A.; Eghbalpour, S.; Uversky, V.N. Bioactive Peptides: Synthesis, Sources, Applications, and Proposed Mechanisms of Action. Int. J. Mol. Sci. 2022, 23, 1445. [Google Scholar] [CrossRef]
- Cunha, S.A.; Pintado, M.E. Bioactive peptides derived from marine sources: Biological and functional properties. Trends Food Sci. Technol. 2022, 119, 348–370. [Google Scholar] [CrossRef]
- Saide, A.; Martínez, K.A.; Ianora, A.; Lauritano, C. Unlocking the Health Potential of Microalgae as Sustainable Sources of Bioactive Compounds. Int. J. Mol. Sci. 2021, 22, 4383. [Google Scholar] [CrossRef] [PubMed]
- Remize, M.; Brunel, Y.; Silva, J.L.; Berthon, J.Y.; Filaire, E. Microalgae n-3 PUFAs Production and Use in Food and Feed Industries. Mar. Drugs 2021, 19, 113. [Google Scholar] [CrossRef]
- Decamp, A.; Michelo, O.; Rabbat, C.; Laroche, C.; Grizeau, D.; Pruvost, J.; Gonçalves, O. A New, Quick, and Simple Protocol to Evaluate Microalgae Polysaccharide Composition. Mar. Drugs 2021, 19, 101. [Google Scholar] [CrossRef] [PubMed]
- Silva, S.C.; Ferreira, I.C.F.R.; Dias, M.M.; Filomena Barreiro, M. Microalgae-Derived Pigments: A 10-Year Bibliometric Review and Industry and Market Trend Analysis. Molecules 2020, 25, 3406. [Google Scholar] [CrossRef] [PubMed]
- Alpat, S.K.; Alpat, Ş.; Kutlu, B.; Özbayrak, Ö.; Büyükişik, H.B. Development of biosorption-based algal biosensor for Cu(II) using Tetraselmis chuii. Sens. Actuators B Chem. 2007, 128, 273–278. [Google Scholar] [CrossRef]
- Muller-Feuga, A. The role of microalgae in aquaculture: Situation and trends. J. Appl. Phycol. 2000, 12, 527–534. [Google Scholar] [CrossRef]
- Mantecón, L.; Moyano, R.; Cameán, A.M.; Jos, A. Safety assessment of a lyophilized biomass of Tetraselmis chuii (TetraSOD®) in a 90 day feeding study. Food Chem. Toxicol. 2019, 133, 110810. [Google Scholar] [CrossRef]
- Bellido, J.R.; Maynar, M. Dehesa. In Repositorio Institucional de la Universidad de Extremadura: Efectos de la Ingesta de Tetraselmis chuii Sobre el Estrés Oxidativo en Deportistas; Universidad de Extremadura: Badajoz, Spain, 2017. [Google Scholar]
- Sharp, M.; Wilson, J.; Stefan, M.; Gheith, R.; Lowery, R.; Ottinger, C.; Reber, D.; Orhan, C.; Sahin, N.; Tuzcu, M.; et al. Marine phytoplankton improves recovery and sustains immune function in humans and lowers proinflammatory immunoregulatory cytokines in a rat model. Phys. Act. Nutr. 2021, 25, 42. [Google Scholar] [CrossRef]
- Ramírez, P.; Torres, S.; Lama, C.; Mantecón, L.; Unamunzaga, C.; Infante, C. TetraSOD® activates the antioxidant response pathway in human cells: An in vitro approach. Afr. J. Biotechnol. 2020, 19, 367–373. [Google Scholar] [CrossRef]
- Lee, P.H.; Macfarlane, D.J.; Lam, T.H.; Stewart, S.M. Validity of the international physical activity questionnaire short form (IPAQ-SF): A systematic review. Int. J. Behav. Nutr. Phys. Act. 2011, 8, 115. [Google Scholar] [CrossRef] [Green Version]
- Marfell-Jones, M.; Stewart, A.; Olds, T. Kinanthropometry IX: Proceedings of the 9th International Conference of the International Society for the Advancement of Kinanthropometry; Routledge: London, UK, 2006; p. 156. [Google Scholar]
- Cervera, P. Tablas de composición de alimentos. Rev. Enferm. 1983, 6, 14–16. [Google Scholar] [PubMed]
- Barat, M.; Ferrús, M.A.; Font, G.; Hardisson, A.; Herrera, A.; Lorente, F.; Marcos, A.; Martín, M.R.; Martínez, M.R.; Martínez, A.; et al. Report of the Scientific Committee of the Spanish Agency for Food Safety and Nutrition on a request for initial assessment for marketing of the marine microalgae Tetraselmis chuii under Regulation (EC) No 258/97 on novel foods and novel food ingredients. Rev. Com. Científico AESAN 2013, 18, 11–28. [Google Scholar]
- Nasirian, F.; Mesbahzadeh, B.; Maleki, S.A.; Mogharnasi, M.; Kor, N.M. The effects of oral supplementation of Spirulina platensis microalgae on hematological parameters in streptozotocin-induced diabetic rats. Am. J. Transl. Res. 2017, 9, 5238. [Google Scholar]
- Effect of C-phycocyanin from Spirulina platensis on erythropoiesis in mice. Chin. J. Mar. Drugs 1994, 4, 136–150.
- Hayashi, O.; Ono, S.; Ishii, K.; Shi, Y.H.; Hirahashi, T.; Katoh, T. Enhancement of proliferation and differentiation in bone marrow hematopoietic cells by Spirulina (Arthrospira) platensis in mice. J. Appl. Phycol. 2006, 18, 47–56. [Google Scholar] [CrossRef]
- Levine, I.; Fleurence, J. Microalgae in Health and Disease Prevention; Academic Press: San Diego, CA, USA, 2018; ISBN 978-0-12-811405-6. [Google Scholar]
- Nakuluri, K.; Mukhi, D.; Mungamuri, S.K.; Pasupulati, A.K. Stabilization of hypoxia-inducible factor 1α by cobalt chloride impairs podocyte morphology and slit-diaphragm function. J. Cell. Biochem. 2019, 120, 7667–7678. [Google Scholar] [CrossRef]
- Ho, E.N.M.; Chan, G.H.M.; Wan, T.S.M.; Curl, P.; Riggs, C.M.; Hurley, M.J.; Sykes, D. Controlling the misuse of cobalt in horses. Drug Test. Anal. 2015, 7, 21–30. [Google Scholar] [CrossRef]
- Skjånes, K.; Aesoy, R.; Herfindal, L.; Skomedal, H.; Jensen, P.-E. Bioactive peptides from microalgae: Focus on anti-cancer and immunomodulating activity. Wiley Online Libr. 2021, 173, 612–623. [Google Scholar] [CrossRef]
- Sakhno, L.V.; Shevela, E.Y.; Lykov, A.P.; Poveshchenko, O.V.; Ostanin, A.A.; Chernykh, E.R. Effect of Apoptotic Neutrophils on the Production of Erythropoietin, MMP-9, and TIMP-1 in Cultures of Human Macrophages. Bull. Exp. Biol. Med. 2019, 167, 755–758. [Google Scholar] [CrossRef]
- Sadahira, Y.; Mori, M. Role of the macrophage in erythropoiesis. Pathol. Int. 1999, 49, 841–848. [Google Scholar] [CrossRef]
- Chernykh, E.R.; Shevela, E.Y.; Sakhno, L.V.; Tikhonova, M.A.; Petrovsky, Y.L.; Ostanin, A.A. The generation and properties of human M2-like macrophages: Potential candidates for CNS repair? Cell. Ther. Transplant. 2010, 1–82. [Google Scholar] [CrossRef]
- Farag, M.R.; Abd EL-Aziz, R.M.; Ali, H.A.; Ahmed, S.A. Evaluating the ameliorative efficacy of Spirulina platensis on spermatogenesis and steroidogenesis in cadmium-intoxicated rats. Environ. Sci. Pollut. Res. Int. 2016, 23, 2454–2466. [Google Scholar] [CrossRef]
- Sikiru, A.B.; Arangasamy, A.; Alemede, I.C.; Egena, S.S.A.; Bhatta, R. Dietary supplementation effects of Chlorella vulgaris on performances, oxidative stress status and antioxidant enzymes activities of prepubertal New Zealand White rabbits. Bull. Natl. Res. Cent. 2019, 43, 162. [Google Scholar] [CrossRef]
- Azim, N.H.; Subki, A.; Yusof, Z.N.B. Abiotic stresses induce total phenolic, total flavonoid and antioxidant properties in Malaysian indigenous microalgae and cyanobacterium. Malays. J. Microbiol. 2018, 14, 25–33. [Google Scholar]
- Martin, L.J.; Touaibia, M. Improvement of Testicular Steroidogenesis Using Flavonoids and Isoflavonoids for Prevention of Late-Onset Male Hypogonadism. Antioxidants 2020, 9, 237. [Google Scholar] [CrossRef] [PubMed] [Green Version]
- Widowati, I.; Zainuri, M.; Kusumaningrum, H.P.; Susilowati, R.; Hardivillier, Y.; Leignel, V.; Bourgougnon, N.; Mouget, J.-L. Antioxidant activity of three microalgae Dunaliella salina, Tetraselmis chuii and Isochrysis galbana clone Tahiti. IOP Conf. Ser. Earth Environ. Sci. 2017, 55, 012067. [Google Scholar] [CrossRef] [Green Version]
- Cay, M.; Ucar, C.; Senol, D.; Cevirgen, F.; Ozbag, D.; Altay, Z.; Yildiz, S. Effect of increase in cortisol level due to stress in healthy young individuals on dynamic and static balance scores. North. Clin. Istanb. 2018, 5, 295. [Google Scholar] [CrossRef]
- Lee, A.V.; You, L.; Oh, S.Y.; Li, Z.; Code, A.; Zhu, C.; Fisher-Heffernan, R.E.; Regnault, T.R.H.; Lange, C.F.M.D.; Huber, L.A.; et al. Health benefits of supplementing nursery pig diets with microalgae or fish oil. Animals 2019, 9, 80. [Google Scholar] [CrossRef] [Green Version]
- Robertson, R.C.; Seira Oriach, C.; Murphy, K.; Moloney, G.M.; Cryan, J.F.; Dinan, T.G.; Paul Ross, R.; Stanton, C. Omega-3 polyunsaturated fatty acids critically regulate behaviour and gut microbiota development in adolescence and adulthood. Brain Behav. Immun. 2017, 59, 21–37. [Google Scholar] [CrossRef]
- Xie, X.; Wang, X.; Mick, G.J.; Kabarowski, J.H.; Wilson, L.S.; Barnes, S.; Walcott, G.P.; Luo, X.; McCormick, K. Effect of n-3 and n-6 Polyunsaturated Fatty Acids on Microsomal P450 Steroidogenic Enzyme Activities and In Vitro Cortisol Production in Adrenal Tissue From Yorkshire Boars. Endocrinology 2016, 157, 1512–1521. [Google Scholar] [CrossRef] [Green Version]
- Chiu, H.F.; Lee, H.J.; Han, Y.C.; Venkatakrishnan, K.; Golovinskaia, O.; Wang, C.K. Beneficial effect of Chlorella pyrenoidosa drink on healthy subjects: A randomized, placebo-controlled, double-blind, cross-over clinical trial. J. Food Biochem. 2021, 45, e13665. [Google Scholar] [CrossRef]
- Mazziotti, G.; Giustina, A. Glucocorticoids and the regulation of growth hormone secretion. Nat. Rev. Endocrinol. 2013, 9, 265–276. [Google Scholar] [CrossRef] [PubMed] [Green Version]
- Al-Samerria, S.; Aloqaily, B.; Negron, A.; Wondisford, F.E.; Radovick, S. Interrupted IGF-1 Feedback in GHRH Neurons and Somatotrophs Results in Impaired Weight Gain and Increased Energy Expenditure. J. Endocr. Soc. 2021, 5, A52. [Google Scholar] [CrossRef]
- Cho, J.A.; Baek, S.Y.; Cheong, S.H.; Kim, M.R. Spirulina Enhances Bone Modeling in Growing Male Rats by Regulating Growth-Related Hormones. Nutrients 2020, 12, 1187. [Google Scholar] [CrossRef]
- Fournier, C.; Rizzoli, R.; Bouzakri, K.; Ammann, P. Selective protein depletion impairs bone growth and causes liver fatty infiltration in female rats: Prevention by Spirulina alga. Osteoporos. Int. 2016, 27, 3365–3376. [Google Scholar] [CrossRef]
- Birzniece, V. Hepatic actions of androgens in the regulation of metabolism. Curr. Opin. Endocrinol. Diabetes Obes. 2018, 25, 201–208. [Google Scholar] [CrossRef] [PubMed]
- Birzniece, V.; Ho, K.K.Y. MECHANISMS IN ENDOCRINOLOGY: Paracrine and endocrine control of the growth hormone axis by estrogen. Eur. J. Endocrinol. 2021, 184, R269–R278. [Google Scholar] [CrossRef]
- Lewis, M.P. Androgens Affect Myogenesis in vitro and Increase Local IGF-1 Expression. Med. Sci. Sports Exerc. 2011, 43, 413. [Google Scholar] [CrossRef]
- Birzniece, V.; Meinhardt, U.J.; Umpleby, M.A.; Handelsman, D.J.; Ho, K.K.Y. Interaction between Testosterone and Growth Hormone on Whole-Body Protein Anabolism Occurs in the Liver. J. Clin. Endocrinol. Metab. 2011, 96, 1060–1067. [Google Scholar] [CrossRef] [Green Version]
- Villar, R.; Laguna, R.; Martínez, D.; Núñez, L.; Núñez, N.; Jiménez, C. Anti-Aggregant Effects on Human Platelets of the Crude Aqueous Extract and Polar Fractions of the Microalga Dunaliella tertiolecta. Phytother. Res. 1997, 11, 70–72. [Google Scholar] [CrossRef]
- Badimon, L.; Vilahur, G.; Rocca, B.; Patrono, C. The key contribution of platelet and vascular arachidonic acid metabolism to the pathophysiology of atherothrombosis. Cardiovasc. Res. 2021, 117, 2001–2015. [Google Scholar] [CrossRef] [PubMed]
- Shimizu, M.; Natori, T.; Tsuda, K.; Yoshida, M.; Kamada, A.; Oi, K.; Ishigaku, Y.; Oura, K.; Narumi, S.; Yamamoto, M.; et al. Thrombin-induced platelet aggregation −effect of dabigatran using automated platelet aggregometry−. Platelets 2019, 31, 360–364. [Google Scholar] [CrossRef] [PubMed]
- Koukouraki, P.; Tsoupras, A.; Sotiroudis, G.; Demopoulos, C.A.; Sotiroudis, T.G. Antithrombotic properties of Spirulina extracts against platelet-activating factor and thrombin. Food Biosci. 2020, 37, 100686. [Google Scholar] [CrossRef]
- Adili, R.; Hawley, M.; Holinstat, M. Regulation of platelet function and thrombosis by omega-3 and omega-6 polyunsaturated fatty acids. Prostaglandins Other Lipid Mediat. 2018, 139, 10–18. [Google Scholar] [CrossRef]
- Dinicolantonio, J.J.; Okeefe, J. Importance of maintaining a low omega-6/omega-3 ratio for reducing platelet aggregation, coagulation and thrombosis. Open Heart 2019, 6, e001011. [Google Scholar] [CrossRef]
- Gao, L.G.; Cao, J.; Mao, Q.-X.; Lu, X.-C.; Zhou, X.-L.; Fan, L. Influence of omega-3 polyunsaturated fatty acid-supplementation on platelet aggregation in humans: A meta-analysis of randomized controlled trials. Atherosclerosis 2013, 226, 328–334. [Google Scholar] [CrossRef]
- da Silva Chagas, F.D.; Lima, G.C.; dos Santos, V.I.N.; Costa, L.E.C.; de Sousa, W.M.; Sombra, V.G.; de Araújo, D.F.; Barros, F.C.N.; Marinho-Soriano, E.; de Andrade Feitosa, J.P.; et al. Sulfated polysaccharide from the red algae Gelidiella acerosa: Anticoagulant, antiplatelet and antithrombotic effects. Int. J. Biol. Macromol. 2020, 159, 415–421. [Google Scholar] [CrossRef]
- Fuentes, E.; Trostchansky, A.; Reguengo, L.M.; Junior, M.R.M.; Palomo, I. Antiplatelet Effects of Bioactive Compounds Present in Tomato Pomace. Curr. Drug Targets 2021, 22, 1716–1724. [Google Scholar] [CrossRef]
- Simpore, J.; Pignatelli, S.; Musumeci, S. The effects of Spiruline on the immune functions of HIV-infected undernourished children. J. Infect. Dev. Ctries 2007, 1, 112–117. [Google Scholar]
- Cai, B.; Zhao, X.; Luo, L.; Wan, P.; Chen, H.; Pan, J. Structural characterization, and in vitro immunostimulatory and antitumor activity of an acid polysaccharide from Spirulina platensis. Int. J. Biol. Macromol. 2022, 196, 46–53. [Google Scholar] [CrossRef]
- De Jesus Raposo, M.F.; De Morais, R.M.S.C.; De Morais, A.M.M.B. Bioactivity and Applications of Sulphated Polysaccharides from Marine Microalgae. Mar. Drugs 2013, 11, 233–252. [Google Scholar] [CrossRef] [Green Version]
- Gupta, S.; Gupta, C.; Garg, A.P.; Prakash, D. Prebiotic efficiency of blue green algae on probiotics microorganisms. J. Microbiol. Exp. 2017, 4, 120. [Google Scholar] [CrossRef] [Green Version]
- He, X.; Wang, H.; Jin, T.; Xu, Y.; Mei, L.; Yang, J. TLR4 Activation Promotes Bone Marrow MSC Proliferation and Osteogenic Differentiation via Wnt3a and Wnt5a Signaling. PLoS ONE 2016, 11, e0149876. [Google Scholar] [CrossRef] [PubMed]
- Chiba, Y.; Mizoguchi, I.; Hasegawa, H.; Ohashi, M.; Orii, N.; Nagai, T.; Sugahara, M.; Miyamoto, Y.; Xu, M.; Owaki, T.; et al. Regulation of myelopoiesis by proinflammatory cytokines in infectious diseases. Cell. Mol. Life Sci. 2018, 75, 1363–1376. [Google Scholar] [CrossRef]
- Peng, X.; Hou, L.; Zhao, Y.; Lin, T.; Wang, H.; Gao, L.; Yue, J. Frailty and testosterone level in older adults: A systematic review and meta-analysis. Eur. Geriatr. Med. 2022, 1, 1–11. [Google Scholar] [CrossRef] [PubMed]
- Yoshida, T.; Delafontaine, P. Mechanisms of IGF-1-Mediated Regulation of Skeletal Muscle Hypertrophy and Atrophy. Cells 2020, 9, 1970. [Google Scholar] [CrossRef] [PubMed]
- Kopchick, J.J.; Berryman, D.E.; Puri, V.; Lee, K.Y.; Jorgensen, J.O.L. The effects of growth hormone on adipose tissue: Old observations, new mechanisms. Nat. Rev. Endocrinol. 2019, 16, 135–146. [Google Scholar] [CrossRef]
- Heo, M.G.; Choung, S.Y. Anti-obesity effects of Spirulina maxima in high fat diet induced obese rats via the activation of AMPK pathway and SIRT1. Food Funct. 2018, 9, 4906–4915. [Google Scholar] [CrossRef]
- Allur Subramaniyan, S.; Begum, N.; Kim, S.; Choi, Y.; Nam, T.J. Biopeptides of Pyropia yezoensis and their potential health benefits: A review. Asian Pac. J. Trop. Biomed. 2021, 11, 375. [Google Scholar] [CrossRef]

| Component | Quantity | Component | Quantity |
|---|---|---|---|
| Protein(mg/pill) | 75.2 ± 2.51 | Manganese (mg/g) | 5.06 ± 0.09 |
| Carbohydrates (mg/pill | 63.2 ± 2.67 | Iodine (mg/kg) | 5.03 ± 5.78 |
| Lipids (mg/pill) | 13.4 ± 1.04 | Calcium (mg/g) | 33.8 ± 0.26 |
| Aspartic acid (mg/pill) | 1.39 ± 0.06 | Phosphorus (mg/g) | 6.27 ± 1.87 |
| Glutamic acid (mg/pill) | 1.75 ± 0.08 | Magnesium (mg/g) | 5.06 ± 0.09 |
| Saturated fatty acids (mg/pill) | 4.06 ± 0.41 | Sodium (mg/g) | 14.33 ± 4.16 |
| Monounsaturated fatty acids (mg/pill) | 7.05 ± 0.86 | Chloride (mg/g) | 17.77 ± 0.25 |
| Polyunsaturated fatty acids (mg/pill) | 6.26 ± 0.77 | Copper (mg/g) | 0.006 ± 0.00 |
| Leucine (mg/pill) | 1.15 ± 0.08 | Iron (mg/g) | 2.01 ± 0.01 |
| Arginine (mg/pill) | 1.00 ± 0.06 | Potassium (mg/g) | 10.40 ± 0.56 |
| PG (n = 16) | SG 25 (n = 15) | SG 200 (n = 15) | ||
|---|---|---|---|---|
| Total intake (Kcal/day) | Baseline | 1923.50 ± 345.20 | 2117.10 ± 256.7 20 | 2227.80 ± 234.43 |
| Final | 2234.10 ± 421.60 | 2005.10 ± 341.60 | 1927.40 ± 342.10 | |
| Proteins (g/day) | Baseline | 125.30 ± 25.80 | 130.20 ± 17.20 | 127.10 ± 23.12 |
| Final | 128.40 ± 27.60 | 127.20 ± 19.80 | 133.50 ± 34.10 | |
| Carbohydrates (mg/dL) | Baseline | 283.00 ± 63.10 | 255.70 ± 32.00 | 251.34 ± 65.70 |
| Final | 288.10 ± 56.20 | 253.60 ± 68.20 | 268.21 ± 43.20 | |
| SFA (g/day) | Baseline | 24.21 ± 20.13 | 21.03 ± 19.70 | 22.35 ± 16.40 |
| Final | 28.45 ± 26.40 | 20.70 ± 20.30 | 24.12 ± 19.20 | |
| MFA (g/day) | Baseline | 27.89 ± 120.00 | 29.34 ± 34.00 | 28.56 ± 21.30 |
| Final | 28.34 ± 21.30 | 27.67 ± 35.10 | 30.31 ± 45.10 | |
| PUFA (g/day) | Baseline | 11.78 ± 4.12 | 12.54 ± 3.45 | 12.03 ± 5.60 |
| Final | 11.02 ± 5.60 | 13.21 ± 2.56 | 11.40 ± 2.34 | |
| Cholesterol (mg/day) | Baseline | 328.10 ± 87.10 | 340.23 ± 89.45 | 338.45 ± 65.70 |
| Final | 330.23 ± 78.30 | 338.67 ± 67.80 | 343.67 ± 65.90 |
| PG (n = 16) | SG 25 (n = 15) | SG 200 (n = 15) | ||
|---|---|---|---|---|
| Total weight (kg) | Baseline | 72.14 ± 7.18 | 71.28 ± 8.26 | 72.29 ± 11.13 |
| Month 1 | 72.18 ± 6.86 | 72.00 ± 8.55 | 72.00 ± 11.40 | |
| Month 2 | 72.86 ± 6.90 Ω # | 71.10 ± 7.50 | 72.00 ± 10.81 | |
| Desadaptation | 73.12 ± 7.05 Ω µ | 72.60 ± 8.03 | 72.41 ± 11.12 | |
| Ʃ6 skinfolds (mm) | Baseline | 85.27 ± 23.99 | 82.14 ± 20.21 | 87.11 ± 23.50 |
| Month 1 | 86.45 ± 30.24 | 79.49 ± 21.50 | 80.95 ± 21.35 | |
| Month 2 | 88.95 ± 30.00 | 77.74 ± 24.70 | 80.31 ± 20.30 Ω | |
| Desadaptation | 88.03 ± 29.36 | 85.42 ± 31.30 # | 89.95 ± 27.07 | |
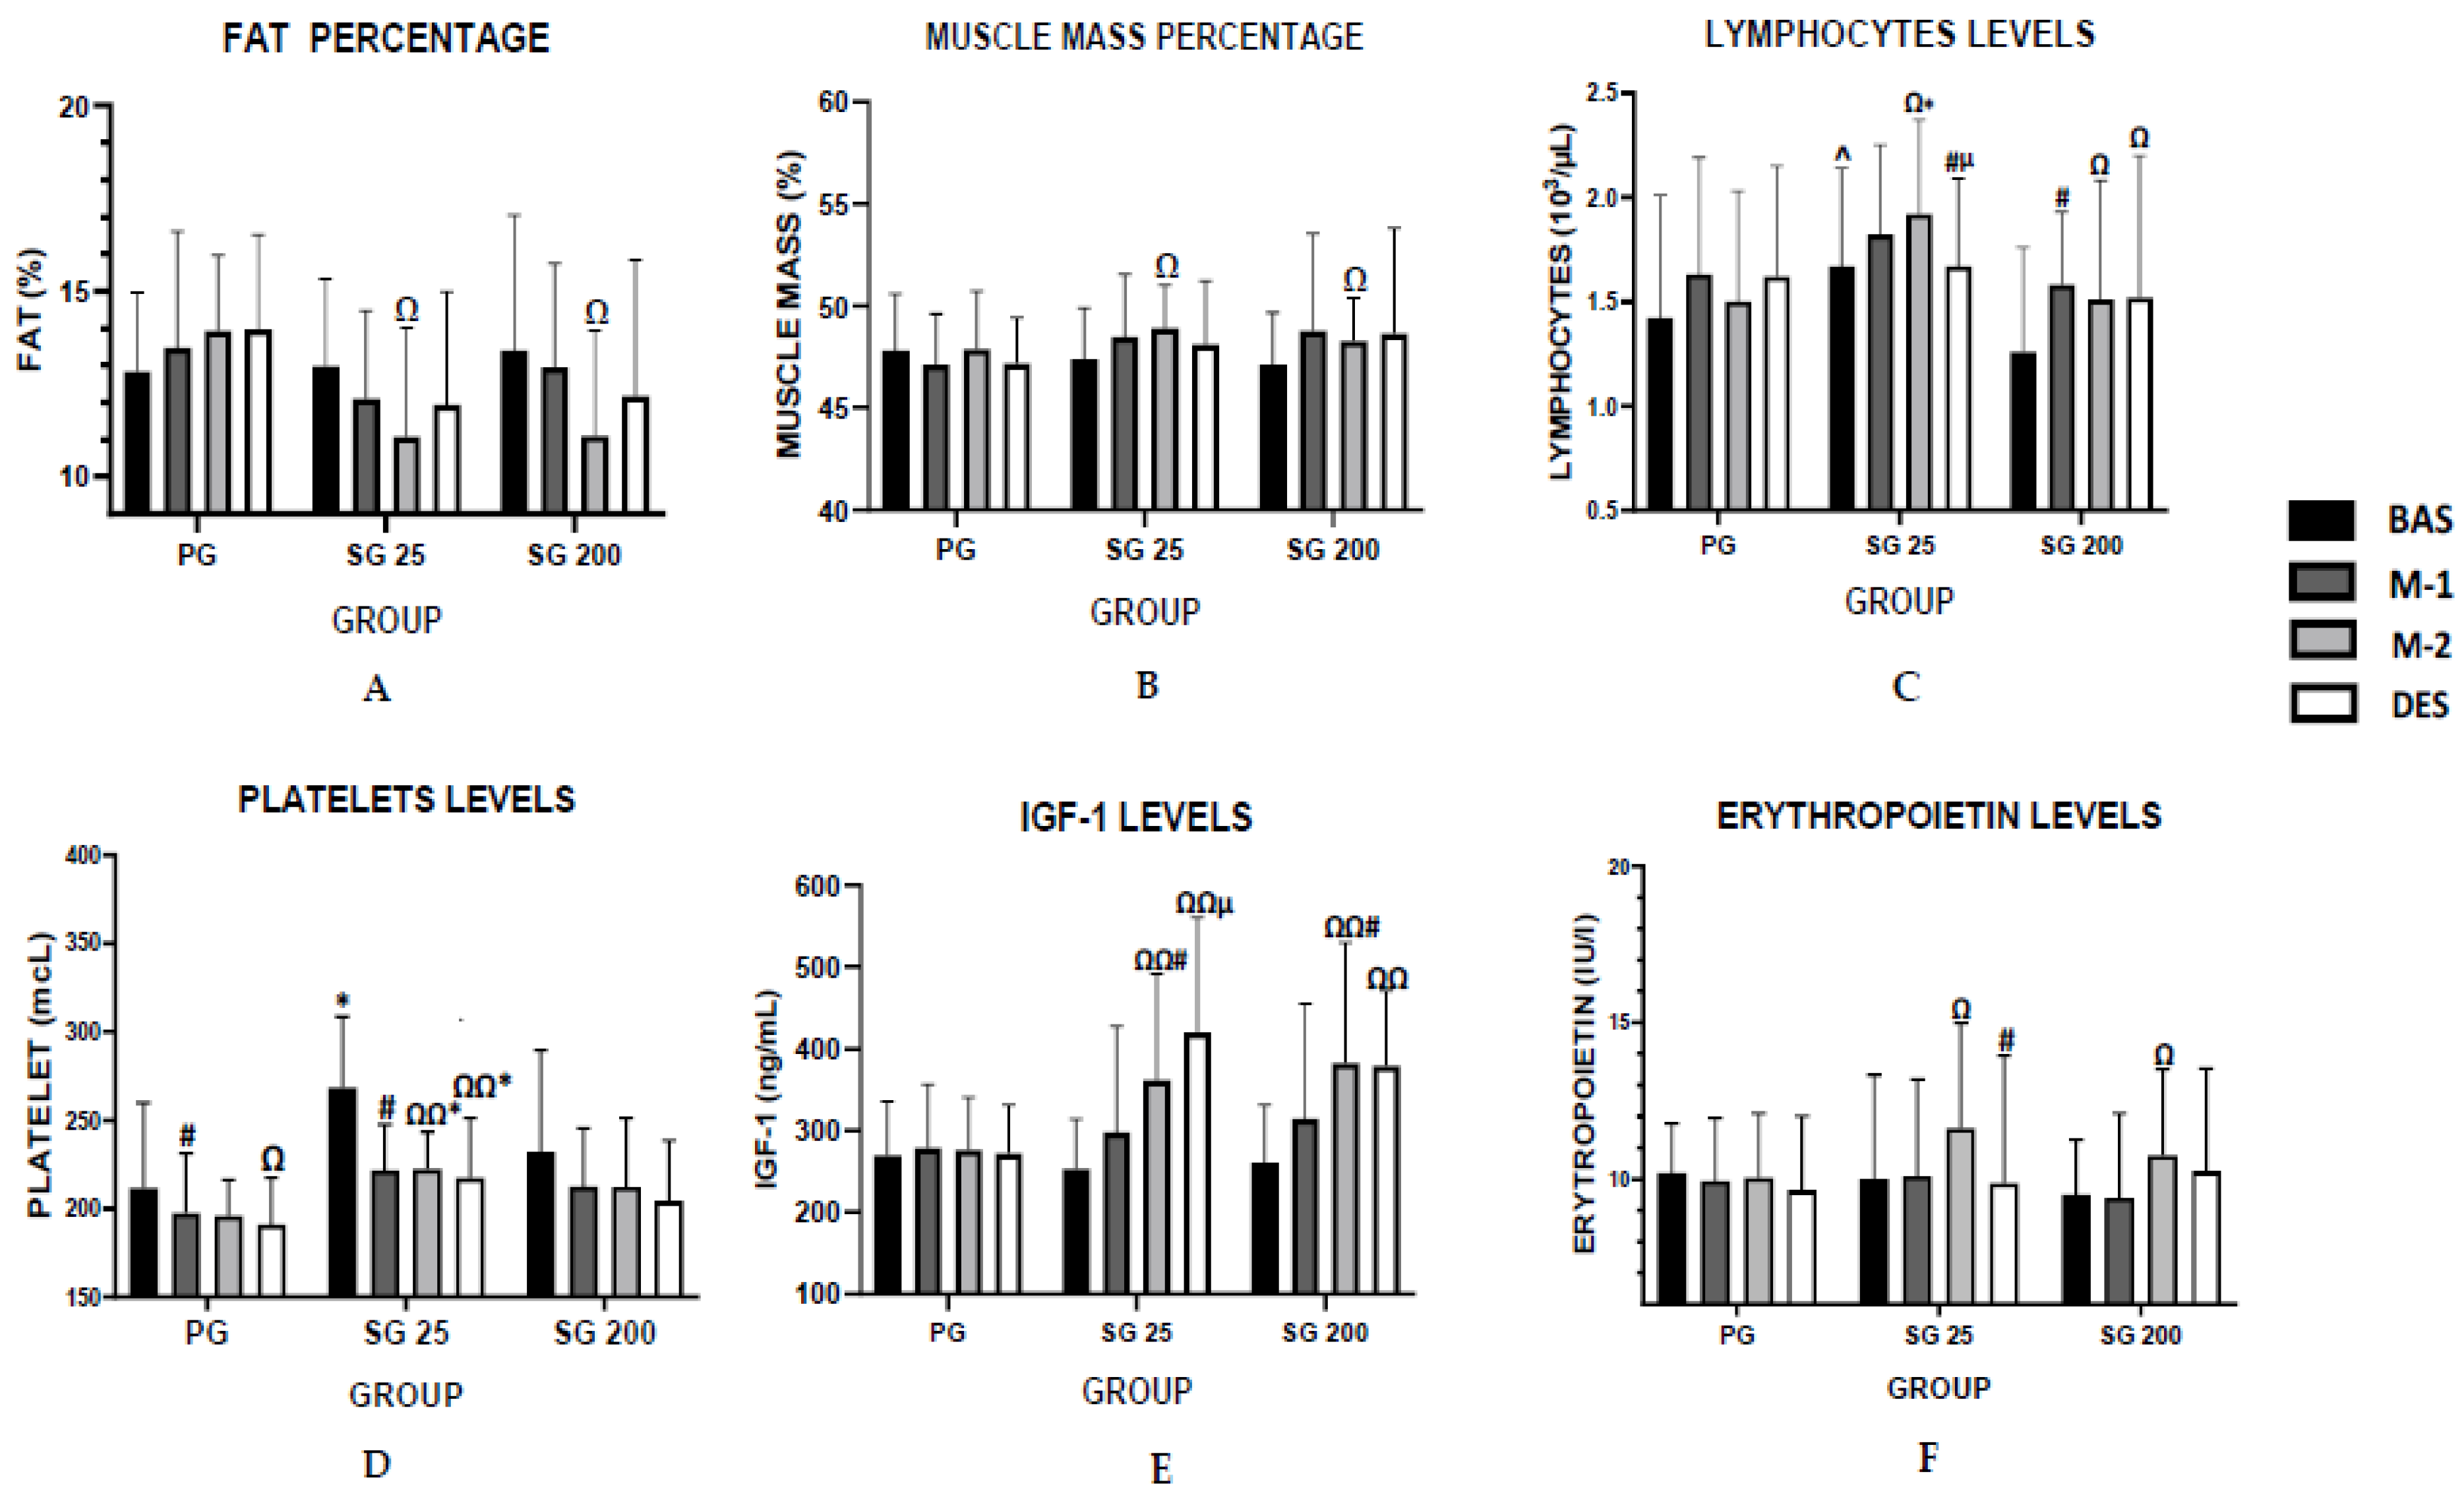
| Fat percentage (%) | Baseline | 12.84 ± 2.11 | 12.98 ± 2.34 | 13.4 ± 3.65 |
| Month 1 | 13.48 ± 3.12 | 12.10 ± 2.37 | 12.94 ± 2.81 | |
| Month 2 | 13.94 ± 2.02 | 11.08 ± 2.93 Ω | 11.10 ± 2.85 Ω | |
| Desadaptation | 13.97 ± 2.55 | 11.93 ± 3.04 | 12.17 ± 3.66 | |
| Muscle percentage (%) | Baseline | 47.82 ± 2.75 | 47.39 ± 2.50 | 47.12 ± 2.56 |
| Month 1 | 47.11 ± 2.50 | 48.47 ± 3.07 | 48.79 ± 4.77 | |
| Month 2 | 47.89 ± 2.81 | 48.91 ± 2.10 Ω | 48.28 ± 2.10 Ω | |
| Desadaptation | 47.17 ± 2.27 | 48.13 ± 3.10 | 48.66 ± 5.16 |
| PG (n = 16) | SG 25 (n = 15) | SG 200 (n = 15) | ||
|---|---|---|---|---|
| Erythropoietin (IU/L) | Baseline | 10.18 ± 1.60 | 10.00 ± 3.33 | 9.49 ± 1.76 |
| Month 1 | 9.93 ± 2.03 | 10.08 ± 3.12 | 9.39 ± 2.72 | |
| Month 2 | 10.05 ± 2.06 | 11.63 ± 3.35 Ω | 10.76 ± 2.75 Ω | |
| Desadaptation | 9.64 ± 2.37 | 9.86 ± 4.09 # | 10.25 ± 3.28 | |
| Free testosterone (pg/mL) | Baseline | 21.39 ± 5.04 | 18.31 ± 4.03 | 22.4 ± 5.28 |
| Month 1 | 18.51 ± 5.51 | 22.67 ± 11.45 | 24.18 ± 7.58 * | |
| Month 2 | 18.98 ± 5.67 | 21.55 ± 5.63 Ω | 23.73 ± 9.99 | |
| Desadaptation | 22.84 ± 8.87 µ | 21.87 ± 6.13 Ω | 26.71 ± 11.80 | |
| Cortisol (mcg/dL) | Baseline | 12.51 ± 2.81 | 12.55 ± 2.30 | 14.02 ± 3.20 |
| Month 1 | 12.78 ± 2.60 | 12.67 ± 2.69 | 12.5 ± 2.84 | |
| Month 2 | 13.62 ± 3.09 | 12.57 ± 3.43 | 13.07 ± 3.44 | |
| Desadaptation | 14.13 ± 2.83 Ω µ | 15.01 ± 3.53 | 15.04 ± 2.74 | |
| DHEA (mcg/mL) | Baseline | 3.43 ± 0.90 | 3.30 ± 0.91 | 4.16 ± 1.35 |
| Month 1 | 3.50 ± 1.22 | 3.43 ± 1.17 | 4.16 ± 1.23 | |
| Month 2 | 3.33 ± 1.18 | 3.41 ± 1.06 | 4.20 ± 1.03 * | |
| Desadaptation | 3.97 ± 1.94 # | 3.91 ± 1.33 Ω | 4.32 ± 1.09 | |
| GH (ng/mL) | Baseline | 0.83 ± 1.93 | 0.32 ± 0.41 | 0.51 ± 0.94 |
| Month 1 | 0.60 ± 1.13 | 0.64 ± 1.08 | 0.45 ± 0.60 | |
| Month 2 | 0.34 ± 1.01 | 1.12 ± 1.90 | 0.26 ± 0.43 | |
| Desadaptation | 0.14 ± 0.17 µ Ω | 0.12 ± 0.12 | 0.11 ± 0.12 µ | |
| IGF-1 (ng/mL) | Baseline | 269.68 ± 65.55 | 253.25 ± 60.9 | 260.5 ± 70.92 |
| Month 1 | 278.81 ± 77.71 | 298 ± 129.68 | 314.67 ± 140.53 | |
| Month 2 | 276.59 ± 63.90 | 361.58 ± 129.77 Ω Ω # | 382.66 ± 147.67 Ω Ω # | |
| Desadaptation | 271.87 ± 58.97 | 420.31 ± 140.45 Ω Ω µ | 379.08 ± 91.61 Ω Ω |
| PG (n = 16) | SG 25 (n = 15) | SG 200 (n = 15) | ||
|---|---|---|---|---|
| Leukocytes (Thousands) | Baseline | 5.89 ± 1.02 | 5.85 ± 1.22 | 6.64 ± 2.29 |
| Month 1 | 5.66 ± 1.28 | 6.28 ± 1.13 # | 6.16 ± 1.45 | |
| Month 2 | 6.39 ± 1.33 # | 6.27 ± 1.19 | 5.97 ± 1.15 | |
| Desadaptation | 6.37 ± 1.42 µ | 7.25 ± 1.88 Ω | 6.5 ± 1.16 | |
| Neutrophils (103/µL) | Baseline | 3.64 ± 0.70 | 3.4 ± 0.68 | 4.45 ± 1.88 |
| Month 1 | 3.37 ± 0.80 | 3.54 ± 0.65 | 3.7 ± 1.18 | |
| Month 2 | 4.13 ± 1.19 # | 3.55 ± 0.71 | 3.62 ± 0.82 | |
| Desadaptation | 4.06 ± 1.05 µ | 4.65 ± 1.69 Ω µ | 4.05 ± 0.80 | |
| Basophils (103/µL) | Baseline | 0.07 ± 0.03 | 0.08 ± 0.06 | 0.12 ± 0.08 |
| Month 1 | 0.05 ± 0.05 | 0.14 ± 0.16 * | 0.12 ± 0.11 | |
| Month 2 | 0.07 ± 0.05 | 0.08 ± 0.06 | 0.04 ± 0.03 | |
| Desadaptation | 0.06 ± 0.06 | 0.07 ± 0.03 | 0.07 ± 0.04 | |
| Eosinophils (103/µL) | Baseline | 0.3 ± 0.24 | 0.25 ± 0.16 | 0.25 ± 0.1 |
| Month 1 | 0.21 ± 0.13 | 0.22 ± 0.18 | 0.22 ± 0.08 | |
| Month 2 | 0.20 ± 0.11 | 0.18 ± 0.09 Ω | 0.22 ± 0.07 | |
| Desadaptation | 0.21 ± 0.12 | 0.27 ± 0.16 # | 0.26 ± 0.1 | |
| Monocytes (103/µL) | Baseline | 0.47 ± 0.12 | 0.47 ± 0.15 | 0.6 ± 0.24 |
| Month 1 | 0.42 ± 0.14 | 0.56 ± 0.21* | 0.54 ± 0.20 | |
| Month 2 | 0.50 ± 0.16 | 0.55 ± 0.22 | 0.52 ± 0.13 | |
| Desadaptation | 0.55 ± 0.15 | 0.6 ± 0.19 | 0.6 ± 0.21 | |
| Lymphocytes (103/µL) | Baseline | 1.42 ± 0.59 | 1.67 ± 0.47 ^ | 1.26 ± 0.50 |
| Month 1 | 1.63 ± 0.56 | 1.82 ± 0.43 | 1.58 ± 0.35 # | |
| Month 2 | 1.50 ± 0.53 | 1.92 ± 0.45 Ω * | 1.51 ± 0.57 Ω | |
| Desadaptation | 1.62 ± 0.53 | 1.67 ± 0.42 # µ | 1.52 ± 0.68 Ω | |
| Platelets (thousands) | Baseline | 211.81 ± 48.01 | 268.58 ± 40.12 * | 232.08 ± 57.57 |
| Month 1 | 197.37 ± 33.98 # | 221.50 ± 26.11 # | 212.50 ± 32.90 | |
| Month 2 | 196.00 ± 20.16 | 222.33 ± 21.03 Ω Ω * | 212.17 ± 38.94 | |
| Desadaptation | 190.94 ± 26.56 Ω | 217.42 ± 33.90 Ω Ω * | 204.25 ± 34.39 | |
| Plateletocrit (%) | Baseline | 0.20 ± 0.04 | 0.25 ± 0.05 * | 0.20 ± 0.04 ^ |
| Month 1 | 0.19 ± 0.03 | 0.21 ± 0.03 # | 0.18 ± 0.04 | |
| Month 2 | 0.20 ± 0.00 | 0.20 ± 0.00 | 0.20 ± 0.04 | |
| Desadaptation | 0.19 ± 0.02 | 0.18 ± 0.04 Ω | 0.19 ± 0.03 | |
| MPV (fL) | Baseline | 8.88 ± 0.93 | 8.81 ± 0.47 | 8.49 ± 0.46 |
| Month 1 | 8.98 ± 0.96 | 8.75 ± 0.57 | 8.53 ± 0.65 | |
| Month 2 | 8.88 ± 0.91 | 8.76 ± 0.60 | 8.52 ± 0.61 | |
| Desadaptation | 8.88 ± 0.84 | 8.67 ± 0.69 µ | 8.50 ± 0.67 | |
| PG (n = 16) | SG 25 (n = 15) | SG 200 (n = 15) | ||
|---|---|---|---|---|
| Red blood cells (millions) | Baseline | 5.22 ± 0.64 | 5.21 ± 0.55 | 5.05 ± 0.45 |
| Month 1 | 5.06 ± 0.29 | 5.24 ± 0.54 | 5.11 ± 0.27 | |
| Month 2 | 5.07 ± 0.21 | 5.29 ± 0.80 | 5.15 ± 0.32 | |
| Desadaptation | 5.06 ± 0.22 | 5.19 ± 0.6 | 5.06 ± 0.26 | |
| Hemoglobin (gr %) | Baseline | 15.68 ± 1.73 | 15.05 ± 1.31 | 15.14 ± 1.37 |
| Month 1 | 15.07 ± 0.73 | 14.95 ± 1.71 | 14.97 ± 0.67 | |
| Month 2 | 15.2 ± 0.73 | 14.98 ± 1.52 | 15.05 ± 0.57 | |
| Desadaptation | 15.2 ± 0.73 | 15.01 ± 1.52 | 15.14 ± 0.67 | |
| Hematocrit (%) | Baseline | 46.31 ± 5.48 | 45.07 ± 3.51 | 45.26 ± 4.25 |
| Month 1 | 45.31 ± 3.43 | 45.59 ± 4.27 | 45.84 ± 2.34 | |
| Month 2 | 45.47 ± 2.71 | 45.79 ± 3.34 | 46.22 ± 2.33 | |
| Desadaptation | 44.63 ± 3.15 | 44.16 ± 3.23 µ # | 44.39 ± 2.64 µ # | |
| MCV (fL) | Baseline | 87.07 ± 4.05 | 85.42 ± 9.02 | 87.93 ± 3.83 |
| Month 1 | 87.68 ± 4.11 # | 85.77 ± 9.01 | 87.93 ± 4.30 | |
| Month 2 | 87.84 ± 4.16 Ω | 85.68 ± 9.28 | 87.73 ± 4.37 | |
| Desadaptation | 86.65 ± 4.01 # | 84.58 ± 9.42 | 86.09 ± 4.15 µ | |
| MCH (Pg) | Baseline | 29.52 ± 1.49 | 28.61 ± 3.75 | 29.41 ± 1.15 |
| Month 1 | 29.19 ± 1.27 # | 28.13 ± 3.56 # | 28.73 ± 1.6 # | |
| Month 2 | 29.36 ± 1.25 | 28.02 ± 3.51 Ω | 28.58 ± 1.27 Ω | |
| Desadaptation | 29.50 ± 1.54 | 28.8 ± 3.45 µ # | 29.39 ± 1.34 µ # |
Publisher’s Note: MDPI stays neutral with regard to jurisdictional claims in published maps and institutional affiliations. |
© 2022 by the authors. Licensee MDPI, Basel, Switzerland. This article is an open access article distributed under the terms and conditions of the Creative Commons Attribution (CC BY) license (https://creativecommons.org/licenses/by/4.0/).
Share and Cite
García, Á.; Toro-Román, V.; Siquier-Coll, J.; Bartolomé, I.; Muñoz, D.; Maynar-Mariño, M. Effects of Tetraselmis chuii Microalgae Supplementation on Anthropometric, Hormonal and Hematological Parameters in Healthy Young Men: A Double-Blind Study. Int. J. Environ. Res. Public Health 2022, 19, 6060. https://doi.org/10.3390/ijerph19106060
García Á, Toro-Román V, Siquier-Coll J, Bartolomé I, Muñoz D, Maynar-Mariño M. Effects of Tetraselmis chuii Microalgae Supplementation on Anthropometric, Hormonal and Hematological Parameters in Healthy Young Men: A Double-Blind Study. International Journal of Environmental Research and Public Health. 2022; 19(10):6060. https://doi.org/10.3390/ijerph19106060
Chicago/Turabian StyleGarcía, Ángel, Víctor Toro-Román, Jesús Siquier-Coll, Ignacio Bartolomé, Diego Muñoz, and Marcos Maynar-Mariño. 2022. "Effects of Tetraselmis chuii Microalgae Supplementation on Anthropometric, Hormonal and Hematological Parameters in Healthy Young Men: A Double-Blind Study" International Journal of Environmental Research and Public Health 19, no. 10: 6060. https://doi.org/10.3390/ijerph19106060
APA StyleGarcía, Á., Toro-Román, V., Siquier-Coll, J., Bartolomé, I., Muñoz, D., & Maynar-Mariño, M. (2022). Effects of Tetraselmis chuii Microalgae Supplementation on Anthropometric, Hormonal and Hematological Parameters in Healthy Young Men: A Double-Blind Study. International Journal of Environmental Research and Public Health, 19(10), 6060. https://doi.org/10.3390/ijerph19106060