
Exploring Usability and Patient Attitude towards a Smart Hospital Service with the Technology Acceptance Model


Abstract
:1. Introduction
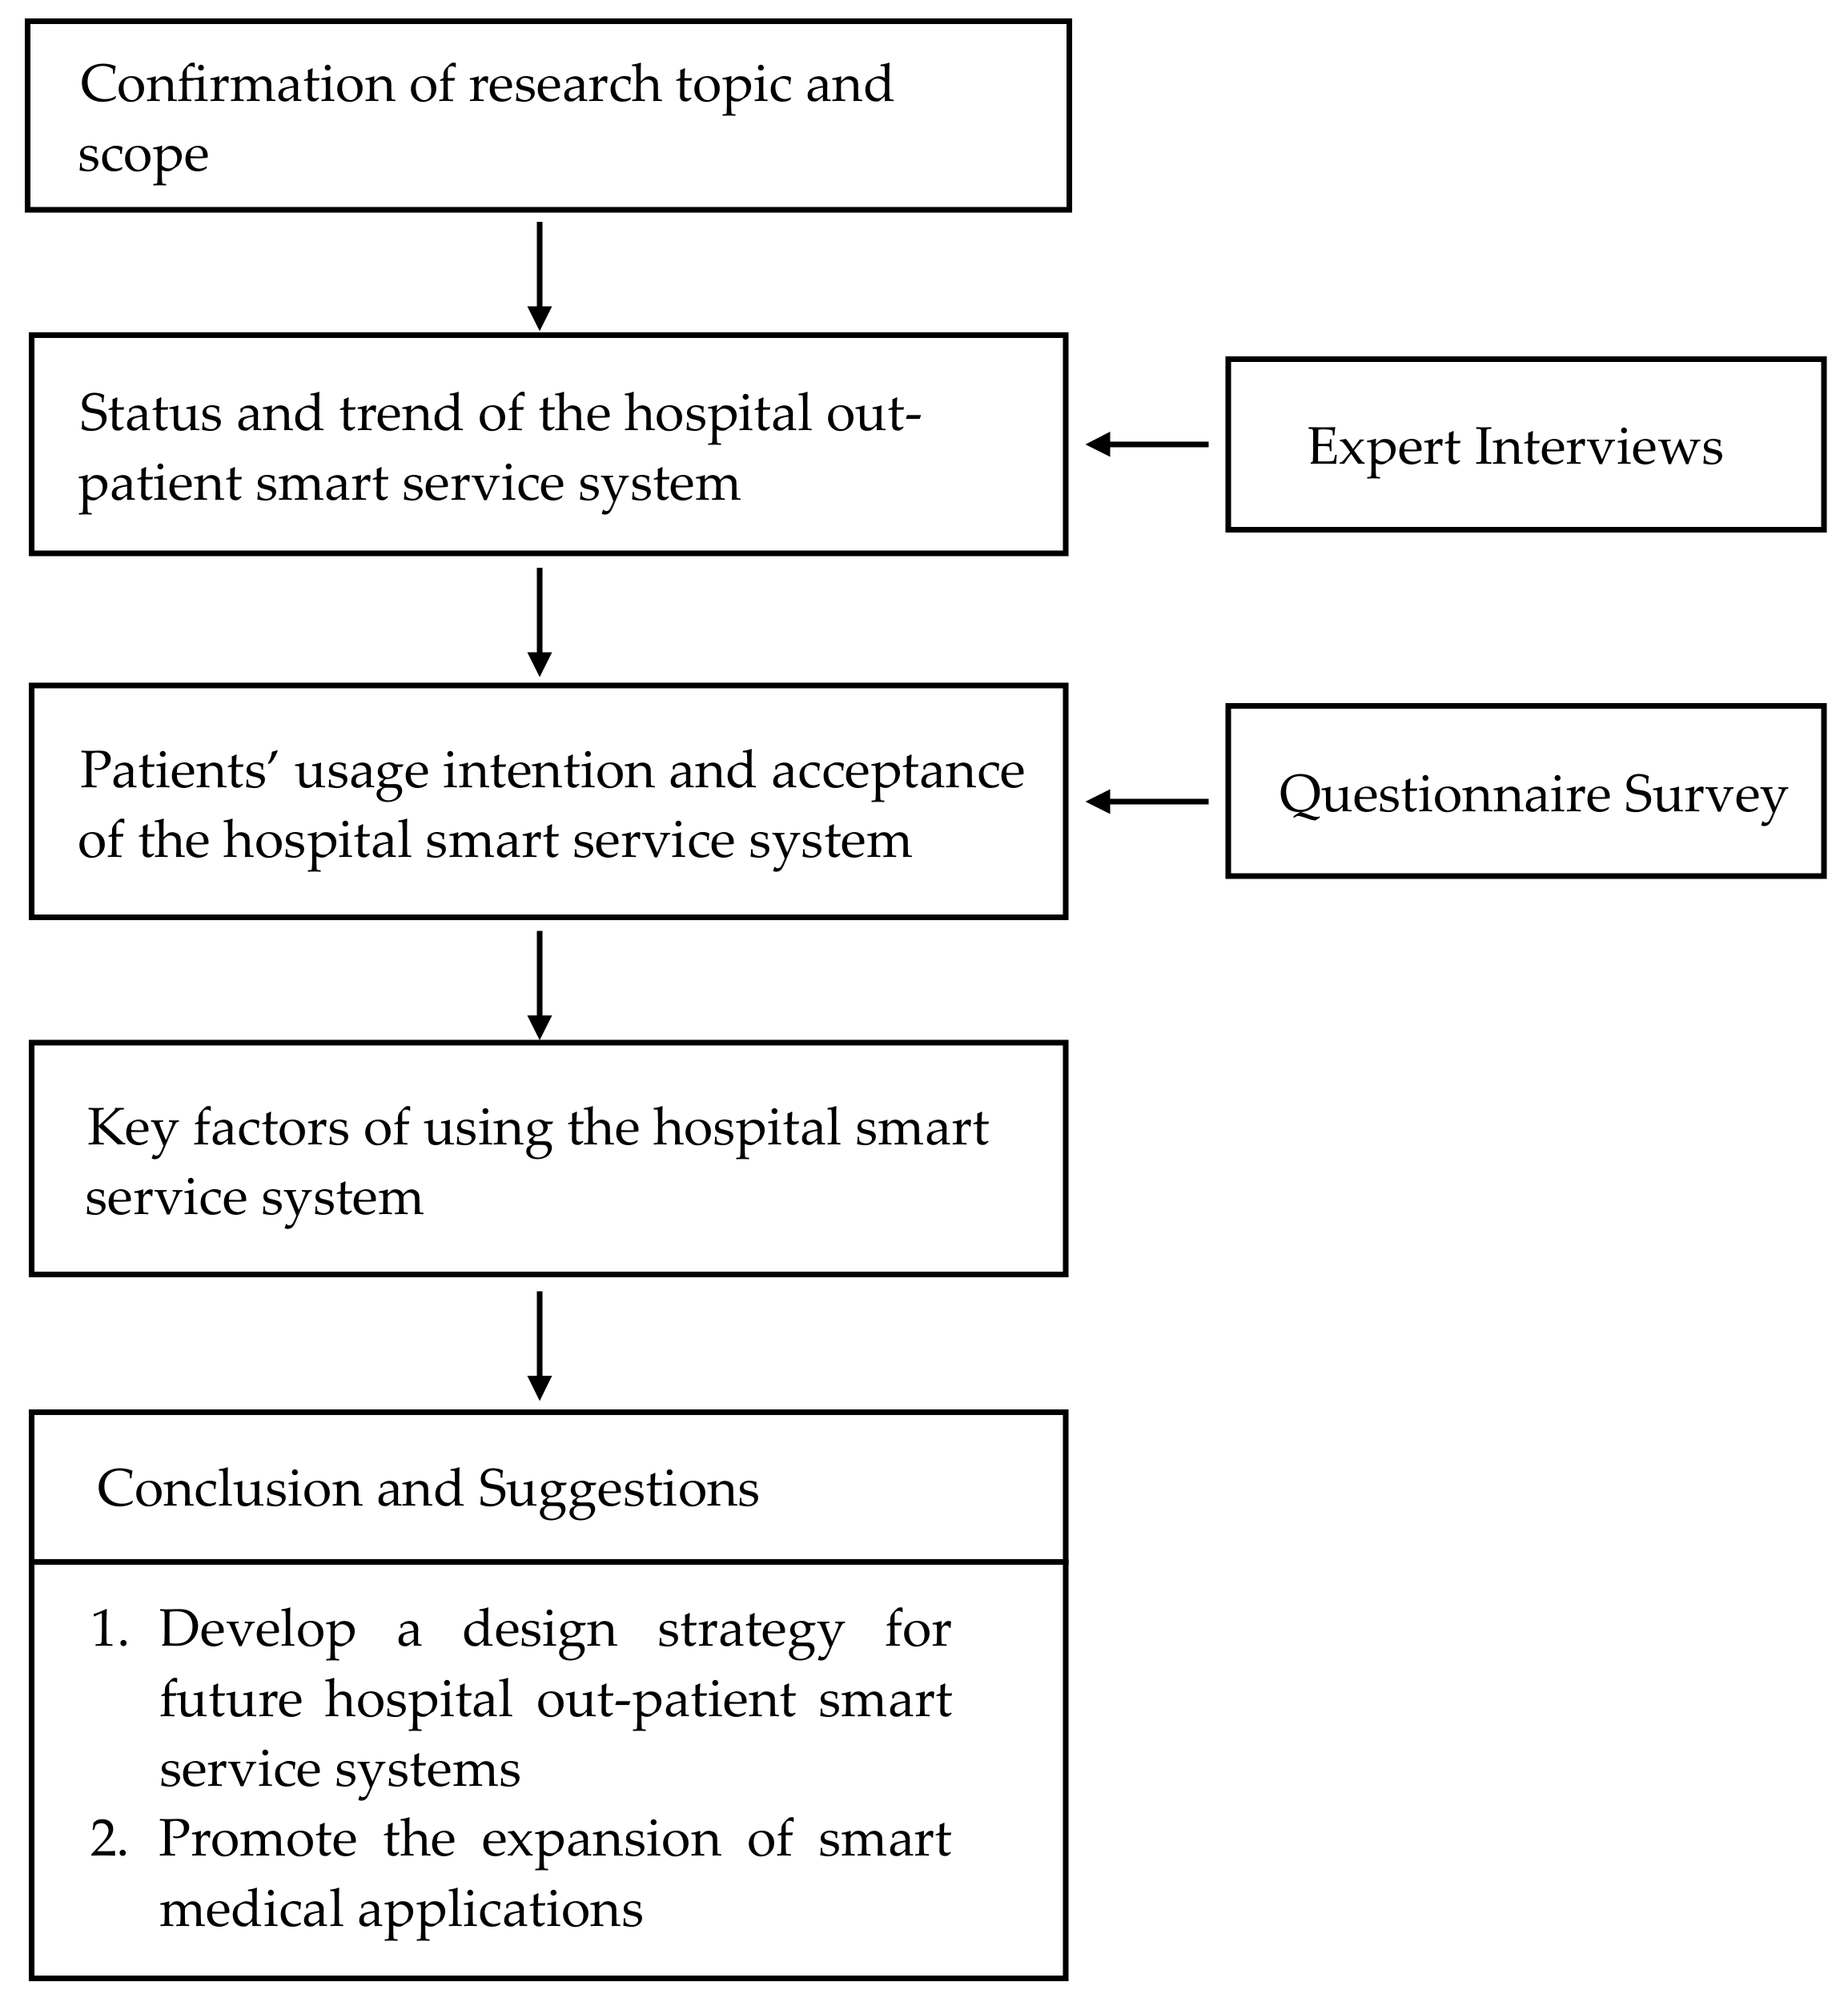
- To understand the development status and development trend of the hospital smart service system.
- To analyze patients’ willingness to use and accept such services through a technology acceptance model.
- To explore the influencing factors on patients’ use of the hospital smart service system.
- To further develop the design strategy of the future hospital outpatient smart service system and promote the expansion and the advantages of smart medical applications.
2. Materials and Methods
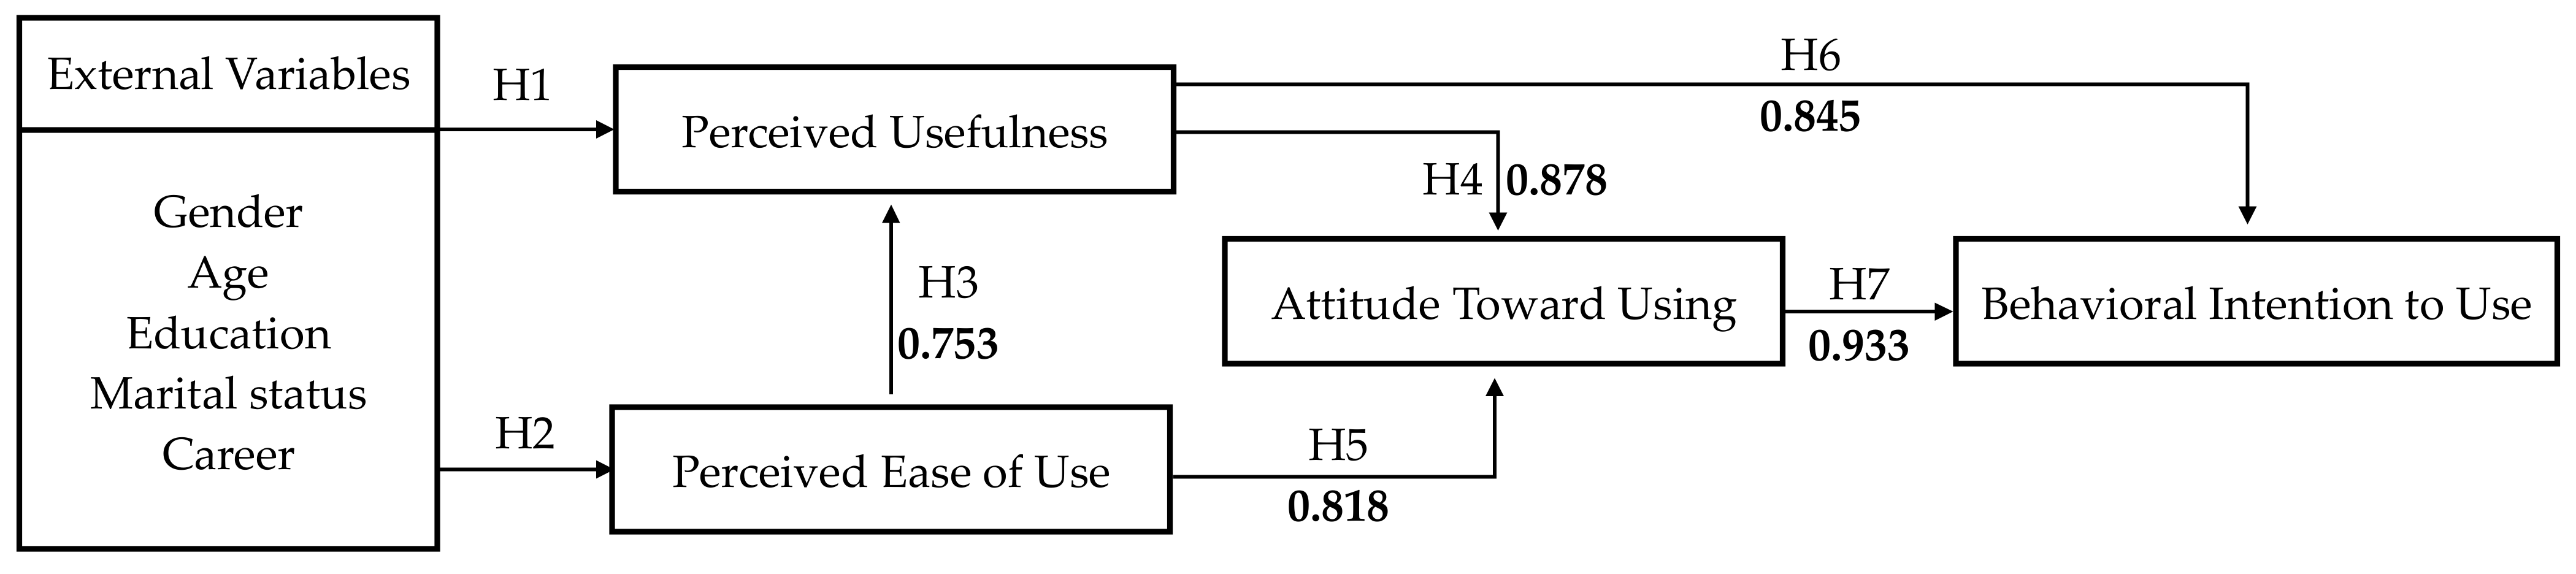
2.1. Research Structure
2.2. Research Subjects
2.3. Research Method
2.4. Data Analysis Methodology
- Descriptive Statistics
- 2.
- t-test and one-way ANOVA
- 3.
- Analysis of Correlation
- 4.
- Regression Analysis
3. Results
3.1. Summary of the Expert Interview Contents
3.2. Questionnaire Analysis
3.2.1. Reliability and Validity Analysis
3.2.2. Analysis of the Respondents’ Basic Data
3.2.3. Analysis of the Respondents’ Technology Acceptance
4. Discussion
- Social benefits of and users’ needs for hospital smart service systems
- 2.
- Patients’ willingness to use hospital smart service systems and the influencing factors
- 3.
- Design strategies for hospital smart service systems
Limitations and Recommendations
5. Conclusions
Author Contributions
Funding
Institutional Review Board Statement
Informed Consent Statement
Data Availability Statement
Acknowledgments
Conflicts of Interest
References
- World Health Organization. World Health Statistics 2020: Monitoring Health for the SDGs, Sustainable Development Goals; World Health Organization: Geneva, Switzerland, 2020; p. 9. [Google Scholar]
- Deloitte. 2021 Global Health Care Outlook; Deloitte: London, UK, 2021; p. 17. [Google Scholar]
- United Nations. World Population Prospects 2019: Highlights; United Nations: New York, NY, USA, 2019. [Google Scholar]
- Ministry of the Interior. Internal Statistics Bulletin, Week 15, 107; Ministry of the Interior: Taipei, Taiwan, 2018; p. 2.
- National Development Council. Trend in Dependency Ratio. Available online: https://pop-proj.ndc.gov.tw/chart.aspx?c=11&uid=67&pid=60 (accessed on 21 January 2020).
- Ministry of Health and Welfare. 108 Universal Health Insurance Health Statistics; Ministry of Health and Welfare: Taipei, Taiwan, 2020.
- Healthcare Information and Management Systems Society. Digital Health Transformation. Available online: https://www.himss.org/what-we-do-solutions/digital-health-transformation/achievement-list (accessed on 21 April 2022).
- National Health Commission of People’s Republic of China. Hospital Smart Service Grading and Evaluation Standard System; National Health Commission of People’s Republic of China: Beijing, China, 2019.
- Nikkei. Japan Plans 10′ AI Hospitals’ to Ease Doctor Shortages. Available online: https://asia.nikkei.com/Politics/Japan-plans-10-AI-hospitals-to-ease-doctor-shortages (accessed on 21 April 2022).
- China Medical University Hospital. The Quality of medical Care Is on Par with International Standards—China Medical University Hospital Passed the highest Level of HIMSS EMRAM Certification. Available online: https://www.cmuh.cmu.edu.tw/NewsInfo/NewsArticle?no=4675 (accessed on 21 April 2022).
- Tsai, J.-H. Lin Kou Chang Gung Memorial Hospital Becomes Taiwan’s First HIMSS EMRAM Level 7 Electronic Medical Record International Certification Organization; CGMH e-Newsletter: Taipei, Taiwan, 2019; Volume 40, pp. 245–246. [Google Scholar]
- World Health Organization. World Report on Ageing and Health; World Health Organization: Geneva, Switzerland, 2015. [Google Scholar]
- Meuter, M.L.; Ostrom, A.L.; Roundtree, R.I.; Bitner, M.J. Self-Service Technologies: Understanding Customer Satisfaction with Technology-Based Service Encounters. J. Mark. 2000, 64, 50–64. [Google Scholar] [CrossRef] [Green Version]
- Hsiao, Y.-C. A Research on The Acceptance of Self-Service Technology Applied to Healthcare with Unified Theory of Acceptance and Use of Technology, UTAUT—A Case of Hospital Service Process; National Sun Yat-sen University: Kaohsiung, Taiwan, 2018. [Google Scholar]
- Hsieh, C.-T. Implementing Self-Service Technology To Gain Competitive Advantages. Commun. IIMA 2005, 5, 77–83. [Google Scholar]
- Mansurov, B.; Rosengren, R. Self-Service Technologies: Investigation on How Self-Service Technologies Influence the Consumer S Perception of Quality; School of Business, Society and Engineering, Mälardalen University: Västerås, Sweden, 2017. [Google Scholar]
- Hu, Y. An improvement or a gimmick? The importance of user perceived values, previous experience, and industry context in human–robot service interaction. J. Destin. Mark. Manag. 2021, 21, 100645. [Google Scholar] [CrossRef]
- Center for Medical Quality Management. Taipei Veterans General Hospital 109th Annual Outpatient Experience Survey Report; Center for Medical Quality Management: Taipei, Taiwan, 2020. [Google Scholar]
- Armitage, C.J.; Conner, M. Efficacy of the Theory of Planned Behaviour: A meta-analytic review. Br. J. Soc. Psychol. 2001, 40, 471–499. [Google Scholar] [CrossRef] [PubMed] [Green Version]
- Fishman, J.; Yang, C.; Mandell, D. Attitude theory and measurement in implementation science: A secondary review of empirical studies and opportunities for advancement. Implement. Sci. 2021, 16, 87. [Google Scholar] [CrossRef] [PubMed]
- Sheeran, P. Intention—Behavior Relations: A Conceptual and Empirical Review. Eur. Rev. Soc. Psychol. 2002, 12, 1–36. [Google Scholar] [CrossRef]
- Chang, S.-S.; Chang, P.-Y.; Tsai, C.-J.; Chen, H.-J.; Tasi, T.-Y. A Study on Relation of Experiences with Medical Services, the Quality of Physician-Patient Relationship and Loyalty. J. Glob. Bus. Openration Manag. 2017, 9, 55–66. [Google Scholar]
- Chandra, S.; Mohammadnezhad, M.; Ward, P. Trust and Communication in a Doctor- Patient Relationship: A Literature Review. J. Healthc. Commun. 2018, 3, 36. [Google Scholar] [CrossRef]
- Tsai, H.-W.; Huang, S.-W.; Hung, Y.-L.; Hsu, Y.-S.; Huang, C.-C. Use of the Smart Lean Method to Conduct High-Quality Integrated Perioperative Management Prior to Hospitalization. Int. J. Environ. Res. Public Health 2021, 18, 13391. [Google Scholar] [CrossRef]
- Ajzen, I.; Fishbein, M. Understanding Attitudes and Predicting Social Behavior; Pearson College Div: New York, NY, USA, 1980. [Google Scholar]
- Ko, Y.-J. An Empirical Study of Consumer’s Behavioral Intention of Smart Phone Mobile Banking—Based on the Theory of Reasoned Action and Technology Acceptance Model; National Cheng Kung University: Tainan Country, Taiwan, 2011. [Google Scholar]
- Davis, F.; Davis, F. Perceived Usefulness, Perceived Ease of Use, and User Acceptance of Information Technology. MIS Q. 1989, 13, 319. [Google Scholar] [CrossRef] [Green Version]
- Rahimi, B.; Nadri, H.; Lotfnezhad Afshar, H.; Timpka, T. A Systematic Review of the Technology Acceptance Model in Health Informatics. Appl. Clin. Inform. 2018, 9, 604–634. [Google Scholar] [CrossRef] [Green Version]
- Chimento-Díaz, S.; Sánchez-García, P.; Franco-Antonio, C.; Santano-Mogena, E.; Espino-Tato, I.; Cordovilla-Guardia, S. Factors Associated with the Acceptance of New Technologies for Ageing in Place by People over 64 Years of Age. Int. J. Environ. Res. Public Health 2022, 19, 2947. [Google Scholar] [CrossRef]
- Tsai, C.-H. Integrating Social Capital Theory, Social Cognitive Theory, and the Technology Acceptance Model to Explore a Behavioral Model of Telehealth Systems. Int. J. Environ. Res. Public Health 2014, 11, 4905–4925. [Google Scholar] [CrossRef]
- Bunnell, B.E.; Barrera, J.F.; Paige, S.R.; Turner, D.; Welch, B.M. Acceptability of Telemedicine Features to Promote Its Uptake in Practice: A Survey of Community Telemental Health Providers. Int. J. Environ. Res. Public Health 2020, 17, 8525. [Google Scholar] [CrossRef]
- Peek, S.T.M.; Wouters, E.J.M.; van Hoof, J.; Luijkx, K.G.; Boeije, H.R.; Vrijhoef, H.J.M. Factors influencing acceptance of technology for aging in place: A systematic review. Int. J. Med. Inform. 2014, 83, 235–248. [Google Scholar] [CrossRef] [Green Version]
- Li, W.; Shen, S.; Yang, J.; Tang, Q. Internet-Based Medical Service Use and Eudaimonic Well-Being of Urban Older Adults: A Peer Support and Technology Acceptance Model. Int. J. Environ. Res. Public Health 2021, 18, 12062. [Google Scholar] [CrossRef]
- Nguyen, M.; Fujioka, J.; Wentlandt, K.; Onabajo, N.; Wong, I.; Bhatia, R.S.; Bhattacharyya, O.; Stamenova, V. Using the technology acceptance model to explore health provider and administrator perceptions of the usefulness and ease of using technology in palliative care. BMC Palliat. Care 2020, 19, 138. [Google Scholar] [CrossRef]
- Su, S.-R. A Discussion of Privacy in Hospital Outpatient Department; National Taiwan University: Taipei, Taiwan, 2004. [Google Scholar]
- Mercer, S.W.; Reynolds, W.J. Empathy and quality of care. Br. J. Gen. Pract. 2002, 52, S9–S12. [Google Scholar]
- Arneill, A.; Devlin, A. Perceived quality of care: The influence of the waiting room environment. J. Environ. Psychol. 2002, 22, 345–360. [Google Scholar] [CrossRef]
- Lin, S.-P. Hospital History, National Taiwan University Medical College Hospital, Yunlin Branch. Available online: https://www.ylh.gov.tw/?aid=60&pid=90 (accessed on 15 March 2022).
- Chou, L.-L. [NTU Hospital’s Yunlin Branch] Becomes a Model of Telemedicine in Remote Areas. Available online: https://ibmi.taiwan-healthcare.org/zh/member_news_detail.php?REFDOCID=0qqpsvmp418p4q0t (accessed on 16 April 2021).
- Kalayou, M.H.; Endehabtu, B.F.; Tilahun, B. The Applicability of the Modified Technology Acceptance Model (TAM) on the Sustainable Adoption of eHealth Systems in Resource-Limited Settings. J. Multidiscip. Healthc. 2020, 13, 1827–1837. [Google Scholar] [CrossRef]
- Wang, E.S.-T.; Chou, N.P.-Y. Consumer Characteristics, Social Influence, and System Factors on Online Group-Buying Repurchasing Intention. J. Electron. Commer. Res. 2014, 15, 119. [Google Scholar]
- Lin, H.C.; Chang, T.Y.; Kuo, S.H. Effects of Social Influence and System Characteristics on Traceable Agriculture Product Reuse Intention of Elderly People: Integrating Trust and Attitude Using the Technology Acceptance Model. J. Res. Educ. Sci. 2018, 63, 291–319. [Google Scholar] [CrossRef]
- Abdullah, F.; Ward, R.; Ahmed, E. Investigating the influence of the most commonly used external variables of TAM on students’ Perceived Ease of Use (PEOU) and Perceived Usefulness (PU) of e-portfolios. Comput. Hum. Behav. 2016, 63, 75–90. [Google Scholar] [CrossRef]
- Park, E.S.; Park, M.S. Factors of the Technology Acceptance Model for Construction IT. Appl. Sci. 2020, 10, 8299. [Google Scholar] [CrossRef]
- Chen, C.-C. Statistical Analysis Using SPSS, 2nd ed.; WU-NAN BOOK INC.: Miaoli, Taiwan, 2013. [Google Scholar]
- Cook, R.D.; Weisberg, S. Criticism and Influence Analysis in Regression. Sociol. Methodol. 1982, 13, 313–361. [Google Scholar] [CrossRef]
- Venkatesh, V. Determinants of Perceived Ease of Use: Integrating Control, Intrinsic Motivation, and Emotion into the Technology Acceptance Model. Inf. Syst. Res. 2000, 11, 342–365. [Google Scholar] [CrossRef] [Green Version]
- Liao, C.; Chen, J.-L.; Yen, D.C. Theory of planning behavior (TPB) and customer satisfaction in the continued use of e-service: An integrated model. Comput. Hum. Behav. 2007, 23, 2804–2822. [Google Scholar] [CrossRef]
- Lee, D.; Moon, J.; Kim, Y.J.; Yi, M.Y. Antecedents and consequences of mobile phone usability: Linking simplicity and interactivity to satisfaction, trust, and brand loyalty. Inf. Manag. 2015, 52, 295–304. [Google Scholar] [CrossRef]
- Lu, Y.-Y. A Study on the Behavioral Intention for the Public Use in the Responsive Web Design of Hospital Website; National Chung Cheng University: Chiayi Country, Taiwan, 2016. [Google Scholar]
- Chou, Y. 2021 Smart Medical Survey: Exploring the Present and Future of Medical Intelligence in Taiwan. Available online: https://www.digitimes.com.tw/iot/article.asp?cat=158&cat1=20&cat2=70&id=0000627569_1mt6y88u5kc84al038xbu (accessed on 23 April 2022).
- Lake, J.; Turner, M.S. Urgent Need for Improved Mental Health Care and a More Collaborative Model of Care. Perm. J. 2017, 21, 17–24. [Google Scholar] [CrossRef] [Green Version]
- Cheng, C.-M. Theoretical and Practical Research on Medical Technology Innovation and Humanistic Care Learning: Exploring Medical Behavior and Humanistic Care from Technology Innovation; Fooyin University Institutional Repository: Kaohsiung, Taiwan, 2005. [Google Scholar]
- Bradford, N.K.; Young, J.; Armfield, N.R.; Herbert, A.; Smith, A.C. Home telehealth and paediatric palliative care: Clinician perceptions of what is stopping us? BMC Palliat. Care 2014, 13, 29. [Google Scholar] [CrossRef]
- Rho, M.J.; Choi, I.Y.; Lee, J. Predictive factors of telemedicine service acceptance and behavioral intention of physicians. Int. J. Med. Inform. 2014, 83, 559–571. [Google Scholar] [CrossRef]
- Alice; Lin, C.-C.; Hsu, S.-C.; Chung, C.-Y.; Lin, Y.-C.; Huang, P.-C.; Chen, C.-K. Combining Eldercare Technology with Interactive Arts Environment. Taiwan J. Phys. Med. Rehabil. 2015, 43, 225–237. [Google Scholar] [CrossRef]
- Kamal, S.A.; Shafiq, M.; Kakria, P. Investigating acceptance of telemedicine services through an extended technology acceptance model (TAM). Technol. Soc. 2020, 60, 101212. [Google Scholar] [CrossRef]
- Liang, H.-W. A Study on Elderly Social Learning Behavior in Group Social Networks—A Case of Toy Clinic Shop; National Taiwan Normal University: Taipei, Taiwan, 2010. [Google Scholar]


| Year | 2017 | 2018 | 2019 | |
|---|---|---|---|---|
| Gender | ||||
| Male | 10,358,775 | 10,394,604 | 10,866,557 | |
| Female | 11,032,152 | 11,081,465 | 11,449,677 | |
| Total | 21,390,927 | 21,476,069 | 22,316,234 | |
| Type | Telephone & Interactive Voice Response | One-Line/Internet | Interactive Kiosks | Video/CD | |
|---|---|---|---|---|---|
| Function | |||||
| Customer Service | Outpatient registration Medical information | Medical consultation Outpatient registration Personal information inquiry Diagnosis and treatment progress inquiry | Outpatient registration Outpatient check-in Queue up Data query | Health education videos Health consultant | |
| Transaction | Voice prompt | Online Payment E-bank payment | Self-service payment ATM payment | Instructional video | |
| Self-service | Voice self-service navigation | Route navigation Health management Health education propaganda Information reminder | Self-service check Self-measurement Self-service form printing | Information reminder Self-assessment Health management | |
| Type | Equipment Introduction |
|---|---|
| Appointment and registration | A variety of registration methods are available in NTUH Yunlin Branch, including manual telephone registration, online registration, and on-site registration. Patients can use appropriate methods to make an appointment and register in advance. |
| Mobile service APP | NTUH launched the NTUH app in 2017. Patients can use it to make online appointments and registrations, check the number of waiting patients, and query medicines. |
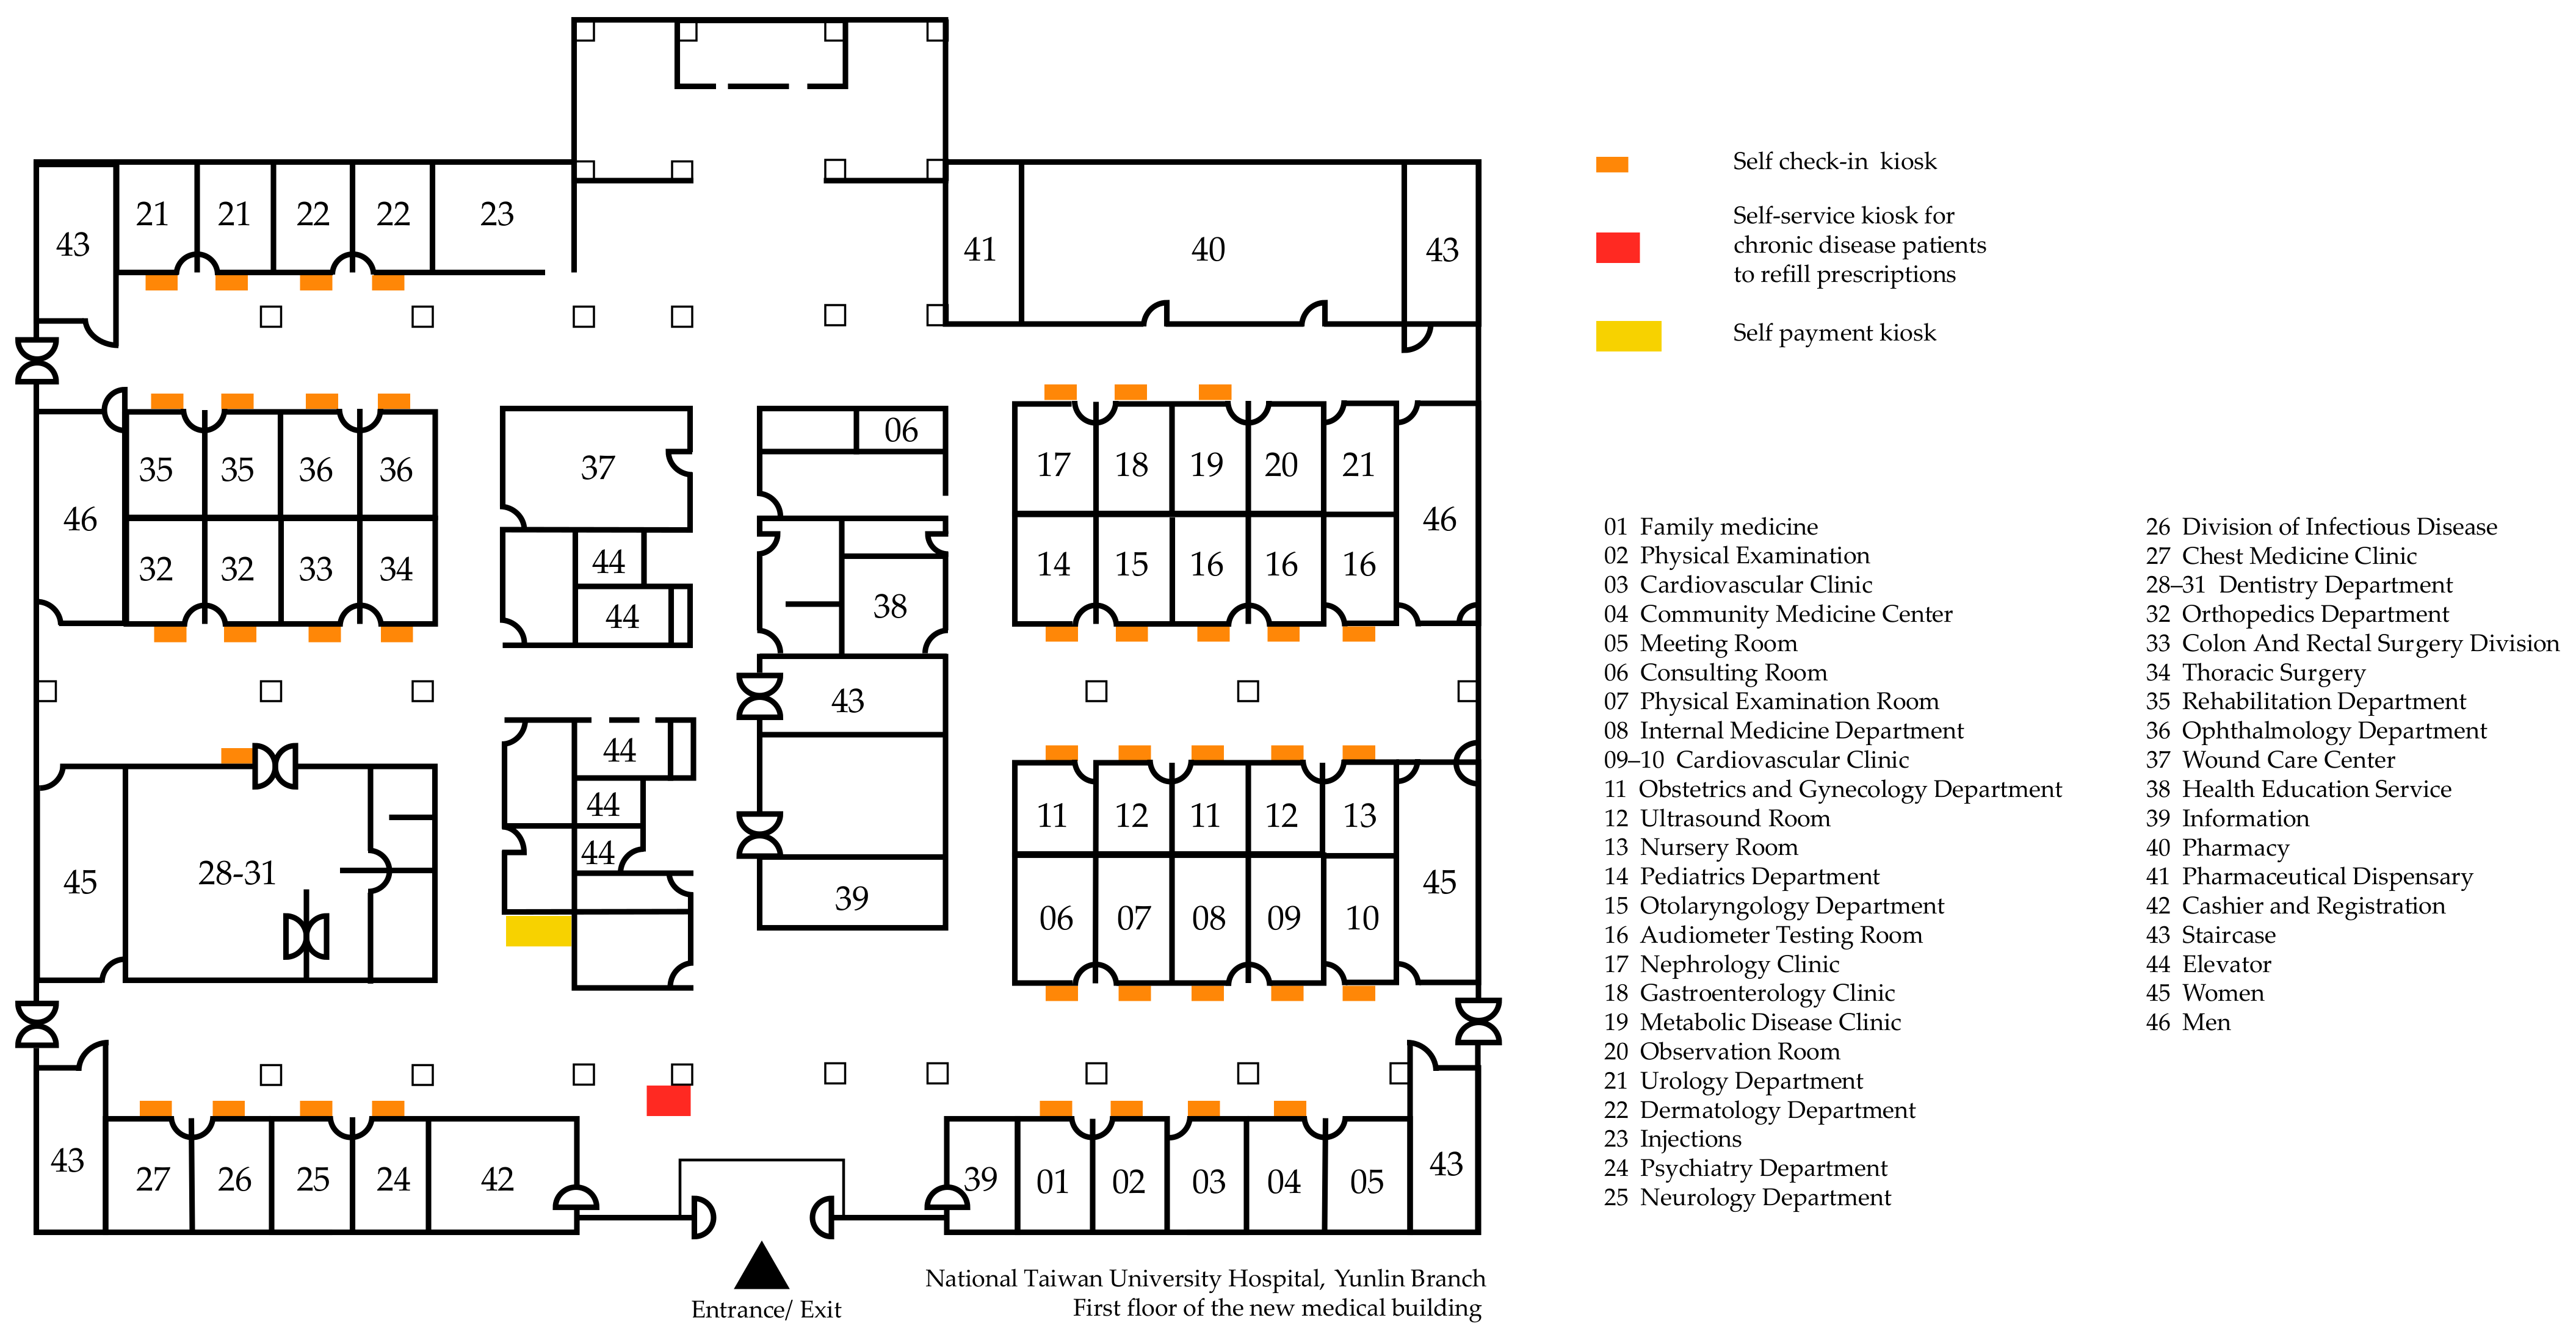
| Self check-in kiosk | When reporting to the doctor, the patient can insert their health insurance card into the card reader of the self-check-in kiosk at the entrance of the clinic to complete the check-in process. |
| Self payment kiosk | At present, NTUH Yunlin Branch has two self-service payment kiosks at the Douliu Campus location. They are located near the cashier and registration counter and provide cash payment and debit card transfer functions, as well as operating instructions and step-by-step diagrams, but the parking payment function is not available. |
| Self-service kiosk for chronic disease patients to refill prescriptions | For patients with chronic diseases, NTUH Yunlin Branch has also launched self-service kiosks for prescription refills. When the patient’s condition is stable, the doctor will consider issuing a long-term prescription so that the patient can collect the drugs without needing additional outpatient diagnoses and treatment. These self-service kiosks make it convenient for patients to receive the medicine quickly, as they can refill their medication simply by presenting the prescription, and it also facilitates family members filling prescriptions for elderly patients who may be unable to leave the home. |
| No. | Expert | Employer | Related Experience/Research Area | Years of Working in Related Areas |
|---|---|---|---|---|
| A | Mr. Pan | National Yunlin University of Science and Technology |
| 20 years |
| B | Mr. Tsai | National Yunlin University of Science and Technology |
| Over 10 years |
| C | Mr. Hong | NTUH Yunlin Branch |
| 20 years |
| Perceived Usefulness | |
| A-Q1 | I feel that using such smart services can increase the efficiency of my doctor visits. |
| A-Q2 | I feel that using smart services like this allows me to better manage my time when I seek medical care. |
| A-Q3 | I feel that using such smart services can make it easier for me to complete my medical appointments. |
| A-Q4 | Overall, I find it helpful to use such smart services. |
| Perceived ease of use | |
| B-Q1 | I find it easy for me to learn to use such smart services. |
| B-Q2 | I think the interface of such smart services is easy to operate. |
| B-Q3 | I find the use of such smart services to be clear and understandable. |
| B-Q4 | I feel like I can easily use the functions of such smart services. |
| B-Q5 | Overall, I find it easy and painless to use such smart services. |
| Attitude | |
| C-Q1 | I find it enjoyable to use such smart services. |
| C-Q2 | I think it is worthwhile to use such smart services when seeking medical treatment. |
| C-Q3 | I think using such smart services is convenient for me to seek medical treatment. |
| C-Q4 | I like using smart services like this when seeing a doctor. |
| C-Q5 | Overall, I think such smart services are worth using. |
| Behavioral intention | |
| D-Q1 | I think I will actively want to use such smart services when I seek medical treatment. |
| D-Q2 | Compared to manual counter service, I think I will like to use such smart services. |
| D-Q3 | I think I will recommend this type of smart service to friends and family. |
| D-Q4 | I feel like I would love to use this type of smart service to get medical care. |
| D-Q5 | In the future, I think I will use such smart services if there is a chance. |
| Factors Summarized | Key Points |
|---|---|
| Development status |
|
| Future trends |
|
| Social benefits |
|
| Current usage |
|
| Design strategies |
|
| Demographics | No. of Respondents | % of Respondents | |
|---|---|---|---|
| Gender | Female | 130 | 64.4% |
| Male | 72 | 35.6% | |
| Age | 20–25 | 38 | 18.8% |
| 26–30 | 7 | 3.5% | |
| 31–35 | 14 | 6.9% | |
| 36–40 | 14 | 6.9% | |
| 41–45 | 21 | 10.4% | |
| 46–50 | 25 | 12.4% | |
| 51 and above | 83 | 41.1% | |
| Education | Elementary School and below | 1 | 0.5% |
| Junior High School | 3 | 1.5% | |
| High School | 25 | 12.4% | |
| University | 145 | 71.8% | |
| Master and above | 28 | 13.9% | |
| Marital | Married | 134 | 72.7% |
| Single | 66 | 26.2% | |
| Widowed | 2 | 0.9% | |
| Occupation | Student | 22 | 10.9% |
| Agriculture and Fishery | 0 | 0% | |
| Business and Industry | 58 | 28.7% | |
| Government employees | 15 | 7.4% | |
| Service Industry | 50 | 24.8% | |
| Freelancer | 22 | 10.9% | |
| Retirement | 18 | 8.9% | |
| Other | 17 | 8.4% |
| Standard Deviation (Mean) | t | Degrees of Freedom | Significance (Two-Tailed) | Significant or Not | ||
|---|---|---|---|---|---|---|
| Male (N = 72) | Female (N = 130) | |||||
| Perceived Usefulness | 0.723 (4.614) | 0.734 (4.581) | 0.315 | 200 | 0.753 | Not significant |
| Standard Deviation (Mean) | t | Degrees of Freedom | Significance (Two-Tailed) | Significant or Not | ||
|---|---|---|---|---|---|---|
| Male (N = 72) | Female (N = 130) | |||||
| Perceived Ease of Use | 0.815 (4.327) | 0.811 (4.270) | 0.478 | 200 | 0.634 | Not significant |
| Item | Sum of Squares | Degrees of Freedom | Mean Square | F | Significance | Significant or Not | |
|---|---|---|---|---|---|---|---|
| Age | Between groups | 1.896 | 6 | 0.316 | 0.588 | 0.740 | Not significant |
| Within a group | 104.801 | 195 | 0.537 | ||||
| Educational level | Between groups | 20.042 | 4 | 5.011 | 11.391 | 0.000 | Significant |
| Within a group | 86.655 | 197 | 0.440 | ||||
| Marital status | Between groups | 0.514 | 2 | 0.257 | 0.483 | 0.618 | Not significant |
| Within a group | 106.183 | 199 | 0.534 | ||||
| Occupational category | Between groups | 0.983 | 6 | 0.164 | 0.302 | 0.935 | Not significant |
| Within a group | 105.714 | 195 | 0.542 |
| Item | Sum of Squares | Degrees of Freedom | Mean Square | F | Significance | Significant or Not | |
|---|---|---|---|---|---|---|---|
| Age | Between groups | 7.633 | 6 | 1.272 | 1.991 | 0.069 | Not significant |
| Within a group | 124.611 | 195 | 0.639 | ||||
| Educational level | Between groups | 24.749 | 4 | 6.187 | 11.339 | 0.000 | Significant |
| Within a group | 107.495 | 197 | 0.546 | ||||
| Marital status | Between groups | 2.573 | 2 | 1.287 | 1.974 | 0.142 | Not significant |
| Within a group | 129.671 | 199 | 0.652 | ||||
| Occupational category | Between groups | 5.096 | 6 | 0.849 | 1.303 | 0.258 | Not significant |
| Within a group | 127.148 | 195 | 0.652 |
| 1 | 2 | 3 | |
|---|---|---|---|
| 1. Perceived usefulness | - | ||
| 2. Perceived ease of use | 0.753 ** | - | |
| 3. Attitude | 0.878 ** | 0.818 ** | - |
| 4. Behavioral intention | 0.845 ** | 0.781 ** | 0.933 ** |
| Model | Dependent Variable | Constant | Standard Coefficient β | T | Significance |
|---|---|---|---|---|---|
| 1 | Perceived usefulness | Perceived ease of use | 0.753 | 16.182 | 0.000 |
| 2 | Attitude | Perceived usefulness | 0.878 | 25.954 | 0.000 |
| 3 | Attitude | Perceived ease of use | 0.818 | 20.139 | 0.000 |
| 4 | Behavioral intention | Perceived usefulness | 0.845 | 22.341 | 0.000 |
| 5 | Behavioral intention | Attitude | 0.933 | 36.578 | 0.000 |
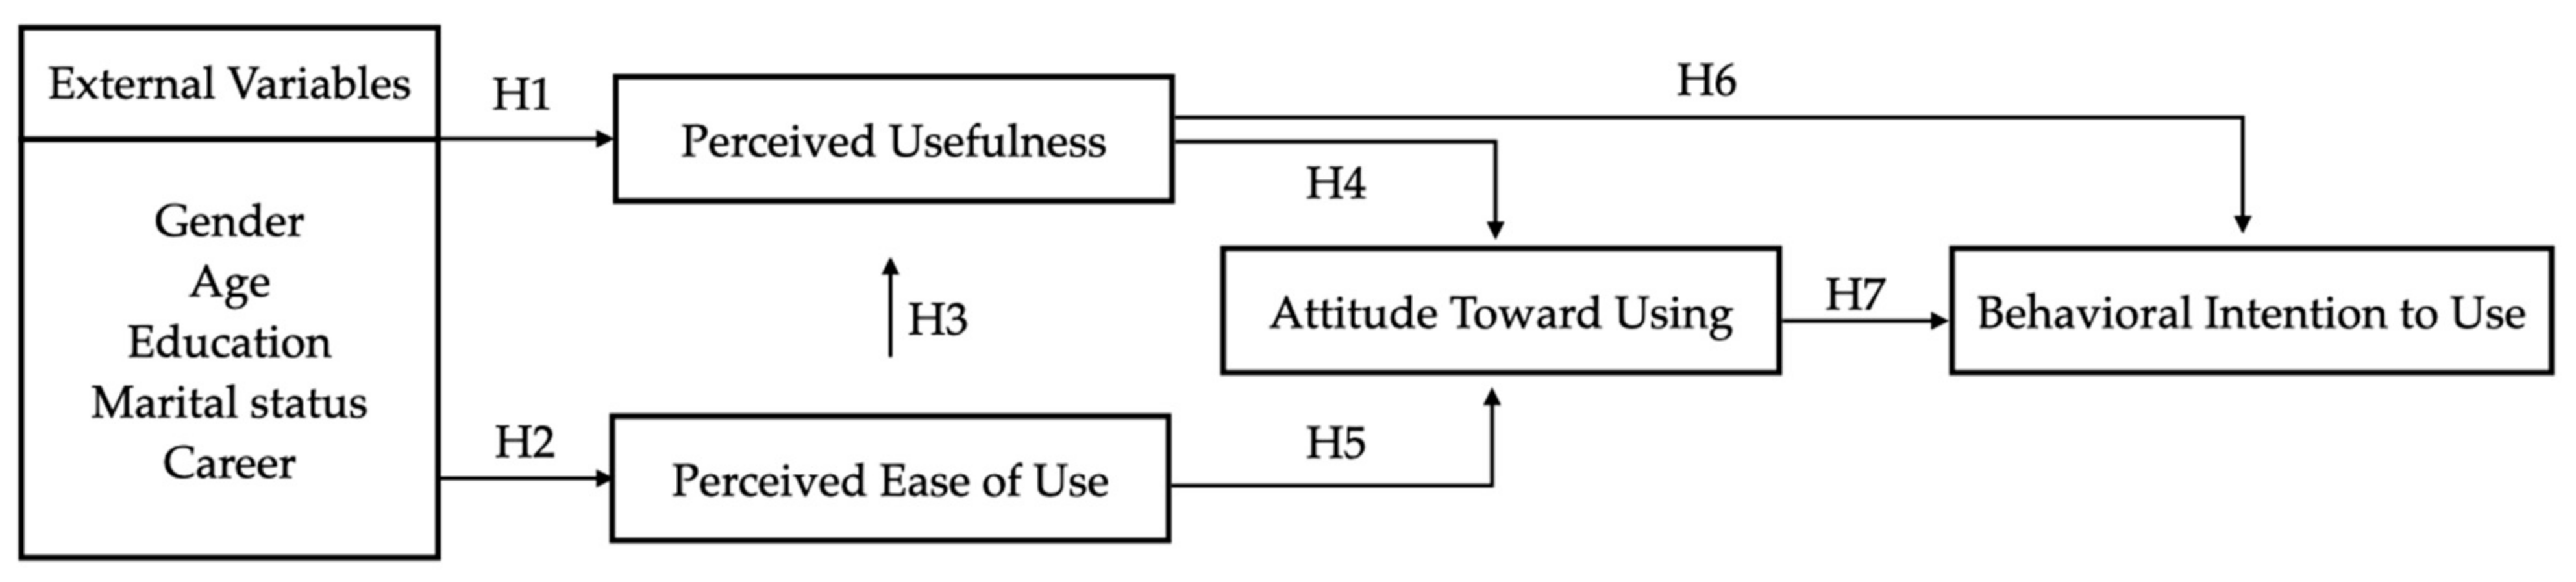
| Hypothesis | Description | Result |
|---|---|---|
| H1 | H1. External variables of patients’ perception of hospital smart service systems will positively affect perceived usefulness. | Partially established |
| H2 | H2. External variables of patients’ perception of hospital smart service systems will positively affect perceived ease of use. | Partially established |
| H3 | H3. Patients’ perceived ease of use of hospital smart service systems will positively affect perceived usefulness. | Established |
| H4 | H4. Patients’ perceived usefulness of hospital smart service systems will positively affect attitude. | Established |
| H5 | H5. Patients’ perceived ease of use of hospital smart service systemswill positively affect attitude. | Established |
| H6 | H6. Patients’ perceived usefulness of hospital smart service systemswill positively affect behavioral intention. | Established |
| H7 | H7. Patients’ attitudes toward using hospital smart service systemswill positively affect behavioral intention. | Established |
Publisher’s Note: MDPI stays neutral with regard to jurisdictional claims in published maps and institutional affiliations. |
© 2022 by the authors. Licensee MDPI, Basel, Switzerland. This article is an open access article distributed under the terms and conditions of the Creative Commons Attribution (CC BY) license (https://creativecommons.org/licenses/by/4.0/).
Share and Cite
Tu, J.-C.; Luo, S.C.; Lee, Y.-L.; Shih, M.-F.; Chiu, S.-P. Exploring Usability and Patient Attitude towards a Smart Hospital Service with the Technology Acceptance Model. Int. J. Environ. Res. Public Health 2022, 19, 6059. https://doi.org/10.3390/ijerph19106059
Tu J-C, Luo SC, Lee Y-L, Shih M-F, Chiu S-P. Exploring Usability and Patient Attitude towards a Smart Hospital Service with the Technology Acceptance Model. International Journal of Environmental Research and Public Health. 2022; 19(10):6059. https://doi.org/10.3390/ijerph19106059
Chicago/Turabian StyleTu, Jui-Che, Shi Chen Luo, Yi-Lin Lee, Ming-Feng Shih, and Shu-Ping Chiu. 2022. "Exploring Usability and Patient Attitude towards a Smart Hospital Service with the Technology Acceptance Model" International Journal of Environmental Research and Public Health 19, no. 10: 6059. https://doi.org/10.3390/ijerph19106059
APA StyleTu, J.-C., Luo, S. C., Lee, Y.-L., Shih, M.-F., & Chiu, S.-P. (2022). Exploring Usability and Patient Attitude towards a Smart Hospital Service with the Technology Acceptance Model. International Journal of Environmental Research and Public Health, 19(10), 6059. https://doi.org/10.3390/ijerph19106059