
Executive Overconfidence, Digital Transformation and Environmental Innovation: The Role of Moderated Mediator


Abstract
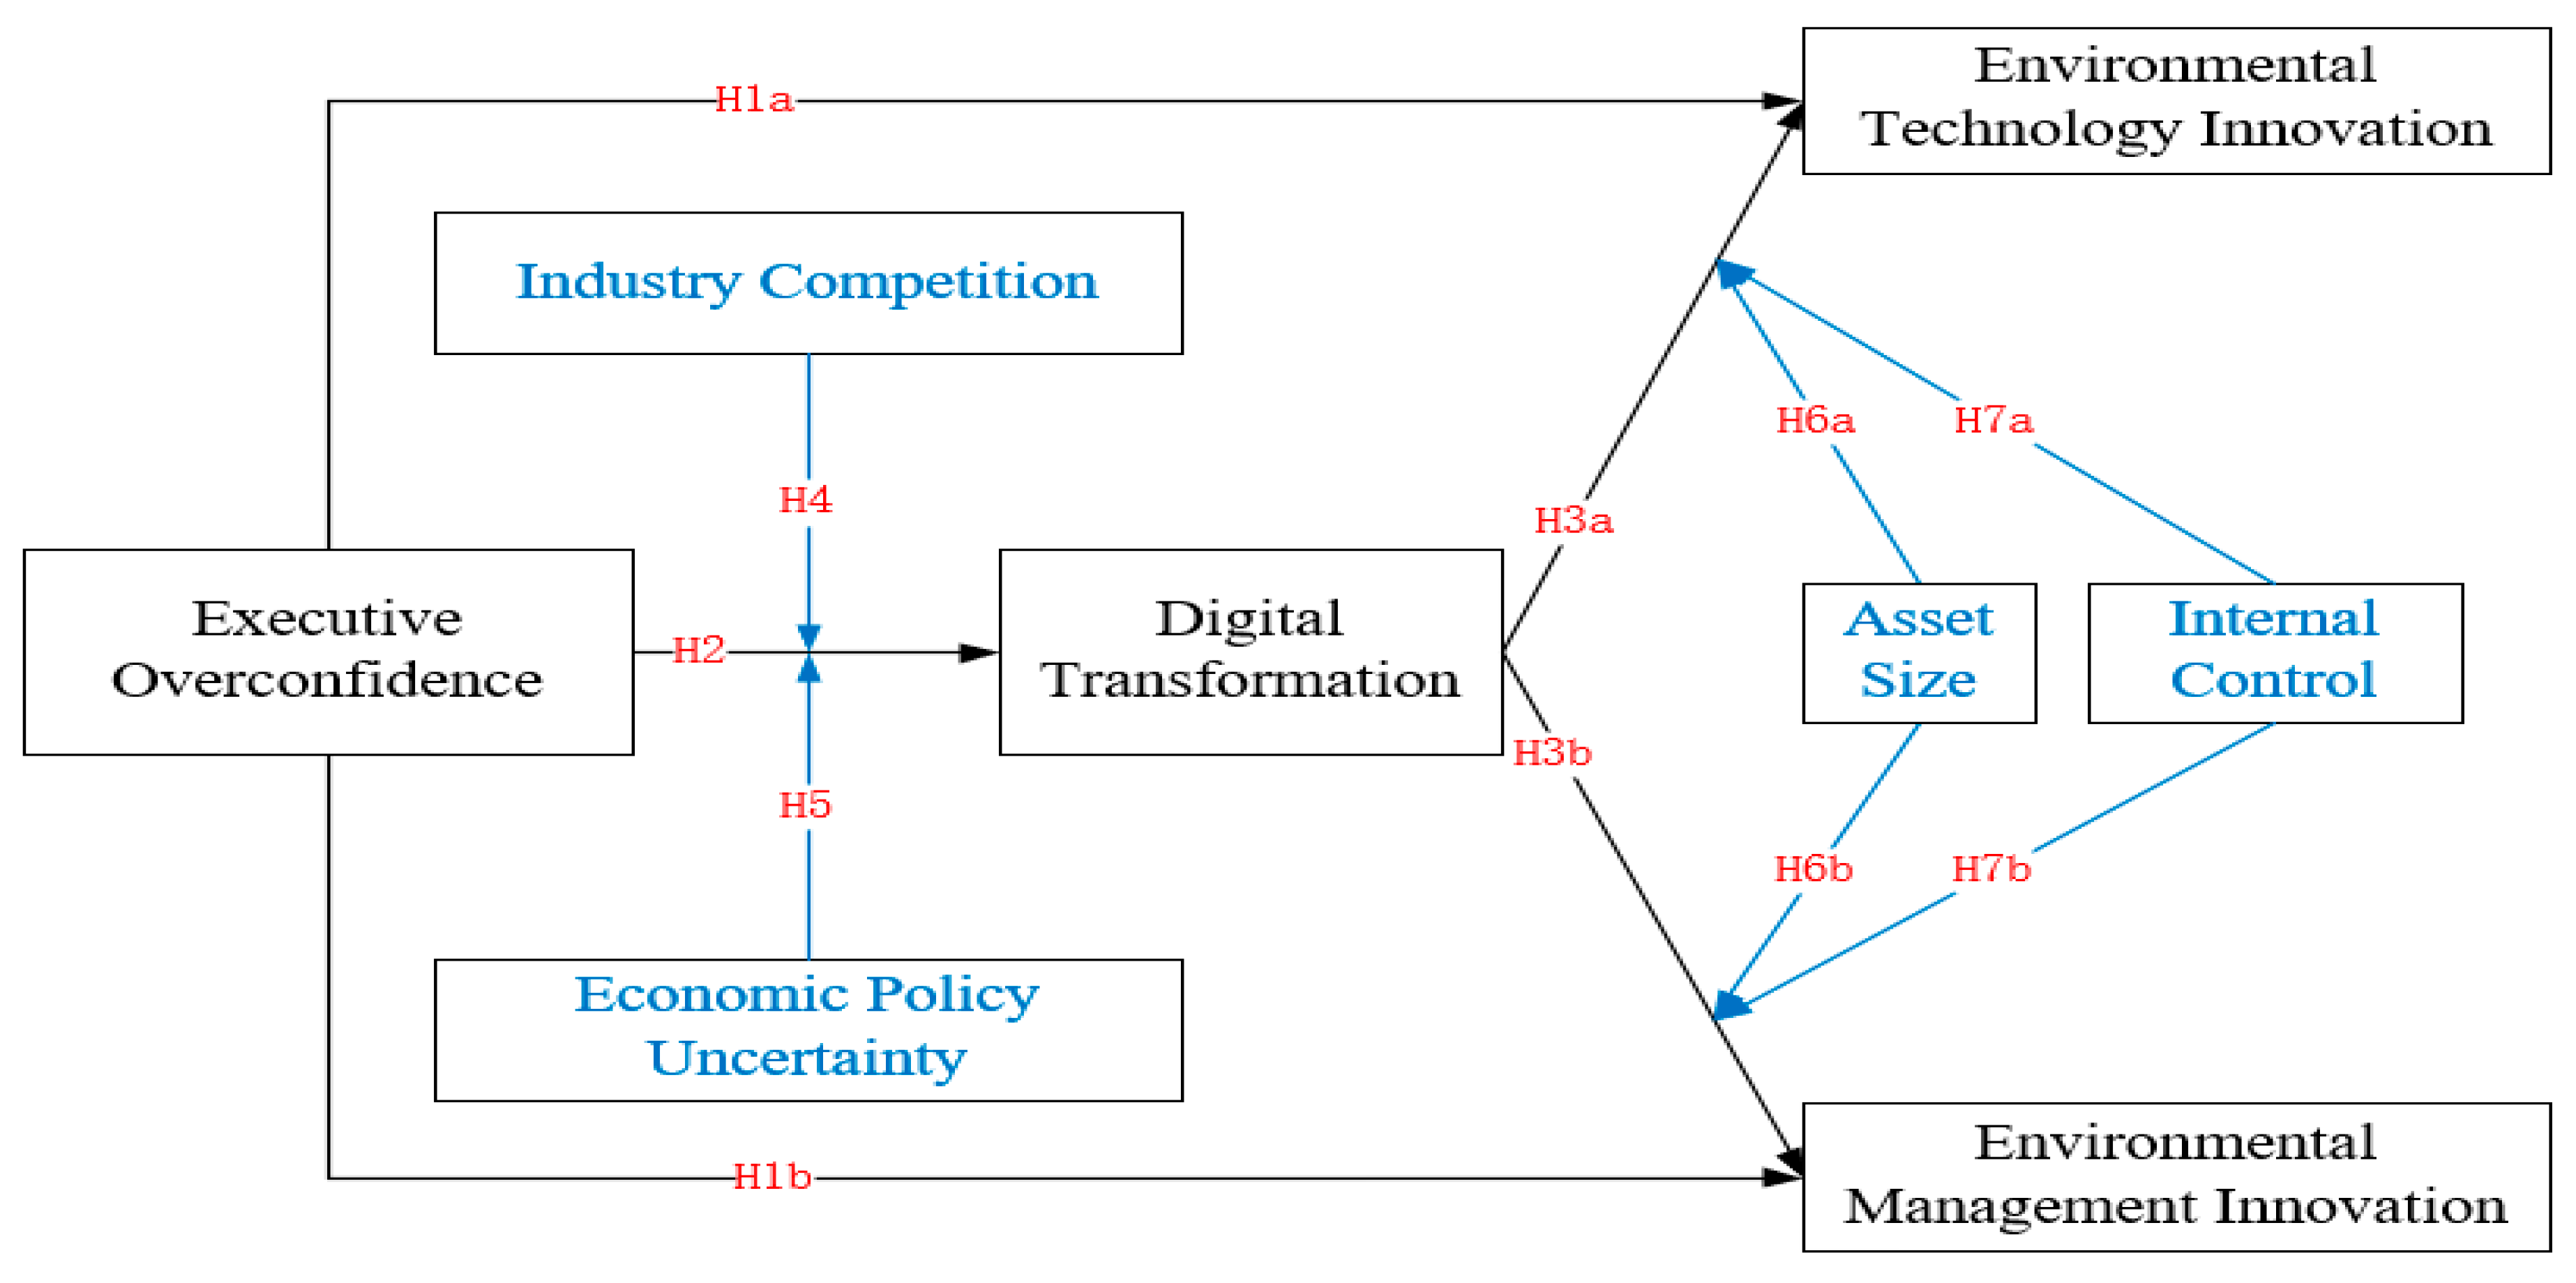
:1. Introduction
2. Literature Review and Hypothesis Development
2.1. Executive Overconfidence and Environmental Innovation
2.2. Executive Overconfidence and Digital Transformation
2.3. Executive Overconfidence, Digital Transformation, and Environmental Innovation
2.4. Moderating Factors between Executive Overconfidence and Digital Transformation
2.5. Moderating Factor between Digital Transformation and Environmental Innovation
3. Research Design
3.1. Sample and Data Collection
3.2. Variable Measures
3.2.1. Independent Variable: Executive Overconfidence (OC)
3.2.2. Dependent Variables: Environmental Innovation
3.2.3. Mediating Variable: Digital Transformation (DIG)
3.2.4. Control Variables
3.3. Regression Models
4. Empirical Results
4.1. Descriptive Statistics
4.2. Regression Results
4.3. Robustness Tests
4.3.1. Propensity Score Matching
4.3.2. Heckman Two-Stage Model
4.3.3. Sensitivity Tests
4.4. Further Analysis
5. Discussion
5.1. Theoretical Implications
5.2. Practical Implications
6. Conclusions and Limitations
6.1. Conclusions
6.2. Limitations and Future Research
Author Contributions
Funding
Institutional Review Board Statement
Informed Consent Statement
Data Availability Statement
Conflicts of Interest
Appendix A

| Industry | Industry Code | No. of Listed Companies | Obs. | Percent (%) |
|---|---|---|---|---|
| Farming, forestry, animal husbandry, and fishery | A1-A5 | 44 | 339 | 1.47 |
| The mining industry | B6-12 | 68 | 597 | 2.60 |
| Manufacturing | C13-43 | 1933 | 14,596 | 63.49 |
| Electricity, heat, gas, and water production and supply | D44-46 | 104 | 869 | 3.78 |
| The construction industry | E47-50 | 91 | 623 | 2.71 |
| Wholesale and Retail | F51-52 | 179 | 1323 | 5.75 |
| Transportation, warehousing, and postal services | G53-60 | 91 | 815 | 3.55 |
| Accommodation and Catering | H61-62 | 11 | 89 | 0.39 |
| Information transmission, software, and information technology services | I63-65 | 247 | 1274 | 5.54 |
| The real estate industry | K70 | 151 | 1168 | 5.08 |
| Leasing and business services | L71-72 | 55 | 254 | 1.10 |
| Scientific research and technology services | M73-75 | 33 | 149 | 0.65 |
| Water conservancy, environment, and public facilities management | N76-78 | 56 | 229 | 1.00 |
| Residential services, repairs, and other services | O79-81 | 7 | 22 | 0.10 |
| Education industry | P82 | 7 | 13 | 0.06 |
| Health and social work | Q83-84 | 9 | 39 | 0.17 |
| Culture, sports, and entertainment | R85-89 | 48 | 265 | 1.15 |
| Other | S90 | 79 | 325 | 1.41 |
| Total | 3213 | 22,989 | 100.00 |
| Panel A. Average Treatment Effect of OC | ||||
|---|---|---|---|---|
| Outcome | Treated | Controls | Difference | T-Value |
| ETI | 1.0116 | 0.7308 | 0.2809 | 11.27 *** |
| EMI | 0.2133 | 0.1941 | 0.0192 | 2.27 ** |
| DIG | 1.1328 | 0.7390 | 0.3938 | 16.33 *** |
| Panel B. Average Treatment Effect of DIG_D | ||||
| Outcome | Treated | Controls | Difference | T-Value |
| ETI | 1.0446 | 0.6891 | 0.3555 | 19.41 *** |
| EMI | 0.2212 | 0.1946 | 0.0266 | 4.22 *** |
| Panel A. Balance Test of OC | |||||
|---|---|---|---|---|---|
| Variables | Match | Treated Group | Controlled Group | %Bias | p-Value |
| LEV | Unmatched | 0.40227 | 0.4764 | −36.1 | 0.000 *** |
| Matched | 0.42636 | 0.42406 | 1.1 | 0.590 | |
| ROA | Unmatched | 0.03726 | 0.03222 | 7.7 | 0.000 *** |
| Matched | 0.03535 | 0.03563 | −0.4 | 0.842 | |
| SIZE | Unmatched | 21.905 | 22.325 | −33.9 | 0.000 *** |
| Matched | 22.033 | 22.028 | 0.5 | 0.821 | |
| Growth | Unmatched | 2.7946 | 8.4621 | −0.8 | 0.670 |
| Matched | 3.7 | 0.32241 | 0.5 | 0.303 | |
| CASH | Unmatched | 0.59186 | 0.53363 | 29.3 | 0.000 *** |
| Matched | 0.58128 | 0.58321 | −1.0 | 0.626 | |
| Tobin’s Q | Unmatched | 2.3874 | 2.1034 | 6.4 | 0.000 *** |
| Matched | 2.3567 | 2.3713 | −0.3 | 0.909 | |
| SOE | Unmatched | 0.24198 | 0.52373 | −60.6 | 0.000 *** |
| Matched | 0.31894 | 0.30529 | 2.9 | 0.160 | |
| AGE | Unmatched | 1.8219 | 2.2834 | −64.5 | 0.000 *** |
| Matched | 1.9756 | 1.9486 | 3.8 | 0.086 * | |
| DUAL | Unmatched | 0.53151 | 0.11534 | 99.3 | 0.000 *** |
| Matched | 0.3663 | 0.35969 | 1.6 | 0.513 | |
| IND | Unmatched | 0.37897 | 0.37145 | 13.4 | 0.000 *** |
| Matched | 0.37439 | 0.37469 | −0.5 | 0.800 | |
| BOARD | Unmatched | 2.105 | 2.1636 | −29.3 | 0.000 *** |
| Matched | 2.1273 | 2.1231 | 2.1 | 0.301 | |
| Panel B. Balance Test of DIG | |||||
| Variables | Match | Treated Group | Controlled Group | %Bias | p-Value |
| LEV | Unmatched | 0.42574 | 0.48004 | −26.1 | 0.000 *** |
| Matched | 0.44216 | 0.43985 | 1.1 | 0.466 | |
| ROA | Unmatched | 0.036 | 0.03171 | 6.6 | 0.000 *** |
| Matched | 0.03631 | 0.03651 | −0.3 | 0.831 | |
| SIZE | Unmatched | 22.304 | 22.144 | 12.3 | 0.000 *** |
| Matched | 22.272 | 22.264 | 0.6 | 0.677 | |
| Growth | Unmatched | 0.56982 | 11.785 | −1.3 | 0.345 |
| Matched | 0.60192 | 0.41226 | 0.0 | 0.455 | |
| CASH | Unmatched | 0.58074 | 0.52523 | 27.2 | 0.000 *** |
| Matched | 0.56381 | 0.56727 | −1.7 | 0.264 | |
| Tobin’s Q | Unmatched | 2.1929 | 2.1687 | 0.6 | 0.668 |
| Matched | 2.1938 | 2.1125 | 2.0 | 0.221 | |
| SOE | Unmatched | 0.3385 | 0.53204 | −39.8 | 0.000 *** |
| Matched | 0.3931 | 0.38622 | 1.4 | 0.364 | |
| AGE | Unmatched | 2.0829 | 2.2192 | −18.5 | 0.000 *** |
| Matched | 2.1234 | 2.1221 | 0.2 | 0.910 | |
| DUAL | Unmatched | 0.2815 | 0.18444 | 23.1 | 0.000 *** |
| Matched | 0.23226 | 0.23974 | −1.8 | 0.257 | |
| IND | Unmatched | 0.37775 | 0.3702 | 13.6 | 0.000 *** |
| Matched | 0.37443 | 0.37494 | −0.9 | 0.557 | |
| BOARD | Unmatched | 2.126 | 2.1646 | −19.1 | 0.000 *** |
| Matched | 2.1419 | 2.1394 | 1.2 | 0.424 | |
References
- Ren, S.; Sun, H.; Zhang, T. Do environmental subsidies spur environmental innovation? Empirical evidence from Chinese listed firms. Technol. Forecast. Soc. Chang. 2021, 173, 121123. [Google Scholar] [CrossRef]
- Ardito, L.; Raby, S.; Albino, V.; Bertoldi, B. The duality of digital and environmental orientations in the context of SMEs: Implications for innovation performance. J. Bus. Res. 2021, 123, 44–56. [Google Scholar] [CrossRef]
- Danso, A.; Adomako, S.; Amankwah-Amoah, J.; Owusu-Agyei, S.; Konadu, R. Environmental sustainability orientation, competitive strategy and financial performance. Bus. Strategy Environ. 2019, 28, 885–895. [Google Scholar] [CrossRef]
- Wang, F.; Feng, L.; Li, J.; Wang, L. Environmental regulation, tenure length of officials, and green innovation of enterprises. Int. J. Environ. Res. Public Health 2020, 17, 2284. [Google Scholar] [CrossRef] [Green Version]
- Zhang, Z.; Duan, H.; Shan, S.; Liu, Q.; Geng, W. The impact of green credit on the green innovation level of heavy-polluting enterprises-evidence from China. Int. J. Environ. Res. Public Health 2022, 19, 650. [Google Scholar] [CrossRef]
- Zhang, Y.; Zhang, J.; Cheng, Z. Stock market liberalization and corporate green innovation: Evidence from China. Int. J. Environ. Res. Public Health 2021, 18, 3412. [Google Scholar] [CrossRef]
- Zhu, Y.; Sun, Z.; Zhang, S.; Wang, X. Economic policy uncertainty, environmental regulation, and green innovation-an empirical study based on Chinese high-tech enterprises. Int. J. Environ. Res. Public Health 2021, 18, 9503. [Google Scholar] [CrossRef]
- He, K.; Chen, W.; Zhang, L. Senior management’s academic experience and corporate green innovation. Technol. Forecast. Soc. Chang. 2021, 166, 120664. [Google Scholar] [CrossRef]
- Amore, M.D.; Bennedsen, M. Corporate governance and green innovation. J. Environ. Econ. Manag. 2016, 75, 54–72. [Google Scholar] [CrossRef]
- Li, D.; Shen, W. Can corporate digitalization promote green innovation? The moderating roles of internal control and institutional ownership. Sustainability 2021, 13, 13983. [Google Scholar] [CrossRef]
- Zhao, S.; Zhang, B.; Shao, D.; Wang, S. Can top management teams’ academic experience promote green innovation output: Evidence from Chinese enterprises. Sustainability 2021, 13, 11453. [Google Scholar] [CrossRef]
- Li, Z.; Zhang, Y. Ceo overconfidence and corporate innovation outcomes: Evidence from China. Front. Psychol. 2022, 13, 760102. [Google Scholar] [CrossRef]
- He, R.; Cheng, Y.; Zhou, M.; Liu, J.; Yang, Q. Government regulation, executive overconfidence, and carbon information disclosure: Evidence from China. Front. Psychol. 2021, 12, 787201. [Google Scholar] [CrossRef]
- Matarazzo, M.; Penco, L.; Profumo, G.; Quaglia, R. Digital transformation and customer value creation in made in Italy SMEs: A dynamic capabilities perspective. J. Bus. Res. 2021, 123, 642–656. [Google Scholar] [CrossRef]
- Boeker, W.; Howard, M.D.; Basu, S.; Sahaym, A. Interpersonal relationships, digital technologies, and innovation in entrepreneurial ventures. J. Bus. Res. 2021, 125, 495–507. [Google Scholar] [CrossRef]
- Shankar, V.; Kleijnen, M.; Ramanathan, S.; Rizley, R.; Holland, S.; Morrissey, S. Mobile shopper marketing: Key issues, current insights, and future research avenues. J. Interact. Mark. 2016, 34, 37–48. [Google Scholar] [CrossRef]
- Amankwah-Amoah, J.; Khan, Z.; Wood, G.; Knight, G. COVID-19 and digitalization: The great acceleration. J. Bus. Res. 2021, 136, 602–611. [Google Scholar] [CrossRef]
- Jin, X.; Wu, H. Economic policy uncertainty and cost stickiness. Manag. Account. Res. 2021, 52, 100750. [Google Scholar] [CrossRef]
- Ocasio, W. Towards an attention-based view of the firm. Strateg. Manag. J. 1997, 18, 187–206. [Google Scholar] [CrossRef]
- Liu, J.-Y. An internal control system that includes corporate social responsibility for social sustainability in the new era. Sustainability 2018, 10, 3382. [Google Scholar] [CrossRef] [Green Version]
- Borghesi, S.; Cainelli, G.; Mazzanti, M. Linking emission trading to environmental innovation: Evidence from the Italian manufacturing industry. Res. Policy 2015, 44, 669–683. [Google Scholar] [CrossRef]
- Ziegler, A.; Rennings, K. Determinants of Environmental Innovations in Germany: Do Organizational Measures Matter? A Discrete Choice Analysis at the Firm Level. ZEW—Centre for European Economic Research Discus-sion Paper No. 04-030. 2004. Available online: https://ssrn.com/abstract=552082 (accessed on 31 May 2004).
- Nidumolu, R.; Prahalad, C.K.; Rangaswami, M.R. Why sustainability is now the key driver of innovation. IEEE. Eng. Manag. Rev. 2015, 43, 85–91. [Google Scholar] [CrossRef]
- Iatridis, K.; Kesidou, E. What drives substantive versus symbolic implementation of iso 14001 in a time of economic crisis? Insights from greek manufacturing companies. J. Bus. Ethics 2018, 148, 859–877. [Google Scholar] [CrossRef]
- Tung, A.; Baird, K.; Schoch, H. The association between the adoption of an environmental management system with organisational environmental performance. Australas. J. Environ. Manag. 2014, 21, 281–296. [Google Scholar] [CrossRef]
- Siachou, E.; Vrontis, D.; Trichina, E. Can traditional organizations be digitally transformed by themselves? The moderating role of absorptive capacity and strategic interdependence. J. Bus. Res. 2021, 124, 408–421. [Google Scholar] [CrossRef]
- Nambisan, S.; Wright, M.; Feldman, M. The digital transformation of innovation and entrepreneurship: Progress, challenges and key themes. Res. Policy 2019, 48, 103773. [Google Scholar] [CrossRef]
- Besson, P.; Rowe, F. Strategizing information systems-enabled organizational transformation: A transdisciplinary review and new directions. J. Strateg. Inf. Syst. 2012, 21, 103–124. [Google Scholar] [CrossRef]
- Verhoef, P.C.; Broekhuizen, T.; Bart, Y.; Bhattacharya, A.; Qi Dong, J.; Fabian, N.; Haenlein, M. Digital transformation: A multidisciplinary reflection and research agenda. J. Bus. Res. 2021, 122, 889–901. [Google Scholar] [CrossRef]
- Lam, C.; Law, R. Readiness of upscale and luxury-branded hotels for digital transformation. Int. J. Hosp. Manag. 2019, 79, 60–69. [Google Scholar] [CrossRef]
- Lee, D. Who drives green innovation? A game theoretical analysis of a closed-loop supply chain under different power structures. Int. J. Environ. Res. Public Health 2020, 17, 2274. [Google Scholar] [CrossRef] [Green Version]
- Galbreath, J. Drivers of green innovations: The impact of export intensity, women leaders, and absorptive capacity. J. Bus. Ethics 2019, 158, 47–61. [Google Scholar] [CrossRef]
- Hambrick, D.C.; Mason, P.A. Upper echelons: The organization as a reflection of its top managers. Acad. Manage. Rev. 1984, 9, 193–206. [Google Scholar] [CrossRef]
- Harmancioglu, N.; Grinstein, A.; Goldman, A. Innovation and performance outcomes of market information collection efforts: The role of top management team involvement. Int. J. Res. Mark. 2010, 27, 33–43. [Google Scholar] [CrossRef]
- Zhou, Y.; Zhou, Y.; Zhang, L.; Zhao, X.; Chen, W. Effects of top management team characteristics on patent strategic change and firm performance. Front. Psychol. 2021, 12, 762499. [Google Scholar] [CrossRef]
- Hai, B.; Gao, Q.; Yin, X.; Chen, J. R&d volatility and market value: The role of executive overconfidence. Chin. Manag. Stud. 2020, 14, 411–431. [Google Scholar] [CrossRef]
- Jafari-Sadeghi, V.; Garcia-Perez, A.; Candelo, E.; Couturier, J. Exploring the impact of digital transformation on technology entrepreneurship and technological market expansion: The role of technology readiness, exploration and exploitation. J. Bus. Res. 2021, 124, 100–111. [Google Scholar] [CrossRef]
- Broekhuizen, T.L.J.; Broekhuis, M.; Gijsenberg, M.J.; Wieringa, J.E. Introduction to the special issue—Digital business models: A multi-disciplinary and multi-stakeholder perspective. J. Bus. Res. 2021, 122, 847–852. [Google Scholar] [CrossRef]
- Sousa, M.J.; Rocha, Á. Skills for disruptive digital business. J. Bus. Res. 2019, 94, 257–263. [Google Scholar] [CrossRef]
- Eller, R.; Alford, P.; Kallmünzer, A.; Peters, M. Antecedents, consequences, and challenges of small and medium-sized enterprise digitalization. J. Bus. Res. 2020, 112, 119–127. [Google Scholar] [CrossRef]
- Cortellazzo, L.; Bruni, E.; Zampieri, R. The role of leadership in a digitalized world: A review. Front. Psychol. 2019, 10, 1938. [Google Scholar] [CrossRef] [Green Version]
- Nowak, R. Executive’s personality and group performance: The mediating role of absorptive capacity. Int. J. Innov. Manag. 2018, 22, 1850047. [Google Scholar] [CrossRef]
- Van Wart, M.; Roman, A.; Wang, X.; Liu, C. Integrating ICT adoption issues into (e-)leadership theory. Telemat. Inform. 2017, 34, 527–537. [Google Scholar] [CrossRef]
- Gupta, S.; Meissonier, R.; Drave, V.A.; Roubaud, D. Examining the impact of cloud ERP on sustainable performance: A dynamic capability view. Int. J. Inf. Manag. 2020, 51, 102028. [Google Scholar] [CrossRef]
- Joerß, T.; Hoffmann, S.; Mai, R.; Akbar, P. Digitalization as solution to environmental problems? When users rely on augmented reality-recommendation agents. J. Bus. Res. 2021, 128, 510–523. [Google Scholar] [CrossRef]
- Suoniemi, S.; Meyer-Waarden, L.; Munzel, A.; Zablah, A.R.; Straub, D. Big data and firm performance: The roles of market-directed capabilities and business strategy. Inf. Manag. 2020, 57, 103365. [Google Scholar] [CrossRef]
- Varadarajan, R. Customer information resources advantage, marketing strategy and business performance: A market resources based view. Ind. Mark. Manag. 2020, 89, 89–97. [Google Scholar] [CrossRef]
- Usai, A.; Fiano, F.; Messeni Petruzzelli, A.; Paoloni, P.; Farina Briamonte, M.; Orlando, B. Unveiling the impact of the adoption of digital technologies on firms’ innovation performance. J. Bus. Res. 2021, 133, 327–336. [Google Scholar] [CrossRef]
- Gupta, G.; Bose, I. Digital transformation in entrepreneurial firms through information exchange with operating environment. Inf. Manag. 2019, 59, 103243. [Google Scholar] [CrossRef]
- Romero-Martínez, A.M.; García-Muiña, F.E. Digitalization level, corruptive practices, and location choice in the hotel industry. J. Bus. Res. 2021, 136, 176–185. [Google Scholar] [CrossRef]
- Bonaime, A.; Gulen, H.; Ion, M. Does policy uncertainty affect mergers and acquisitions? J. Financ. Econ. 2018, 129, 531–558. [Google Scholar] [CrossRef]
- Morgan, T.; Anokhin, S.; Kretinin, A.; Frishammar, J. The dark side of the entrepreneurial orientation and market orientation interplay: A new product development perspective. Int. Small Bus. J. 2014, 33, 731–751. [Google Scholar] [CrossRef]
- Abbott, L.J.; Parker, S.; Peters, G.F.; Rama, D.V. Corporate governance, audit quality, and the Sarbanes-Oxley Act: Evidence from internal audit outsourcing. Account. Rev. 2007, 82, 803–835. [Google Scholar] [CrossRef]
- Zhou, D.; Kautonen, M.; Dai, W.; Zhang, H. Exploring how digitalization influences incumbents in financial services: The role of entrepreneurial orientation, firm assets, and organizational legitimacy. Technol. Forecast. Soc. Chang. 2021, 173, 121120. [Google Scholar] [CrossRef]
- Chen, D.; Kim, J.-B.; Li, O.Z.; Liang, S. China’s closed pyramidal managerial labor market and the stock price crash risk. Account. Rev. 2017, 93, 105–131. [Google Scholar] [CrossRef]
- Chen, C.; Gores, T.; Nasev, J. Managerial overconfidence and cost stickiness. SSRN Electron. J. 2013. [Google Scholar] [CrossRef]
- Serfling, M.A. Ceo age and the riskiness of corporate policies. J. Corp. Financ. 2014, 25, 251–273. [Google Scholar] [CrossRef]
- Byrnes, J.P.; Miller, D.C.; Schafer, W.D. Gender differences in risk taking: A meta-analysis. Psychol. Bull. 1999, 125, 367–383. [Google Scholar] [CrossRef]
- Liu, D.; Fisher, G.; Chen, G. Ceo attributes and firm performance: A sequential mediation process model. Acad. Manag. Ann. 2018, 12, 789–816. [Google Scholar] [CrossRef]
- Malmendier, U.; Tate, G. Ceo overconfidence and corporate investment. J. Financ. 2005, 60, 2661–2700. [Google Scholar] [CrossRef] [Green Version]
- Schrand, C.M.; Zechman, S.L.C. Executive overconfidence and the slippery slope to financial misreporting. J. Account. Econ. 2012, 53, 311–329. [Google Scholar] [CrossRef] [Green Version]
- Berrone, P.; Fosfuri, A.; Gelabert, L.; Gomez-Mejia, L.R. Necessity as the mother of ‘green’ inventions: Institutional pressures and environmental innovations. Strateg. Manag. J. 2013, 34, 891–909. [Google Scholar] [CrossRef]
- Wang, P.; Dong, C.; Chen, N.; Qi, M.; Yang, S.; Nnenna, A.B.; Li, W. Environmental regulation, government subsidies, and green technology innovation-a provincial panel data analysis from China. Int. J. Environ. Res. Public Health 2021, 18, 11991. [Google Scholar] [CrossRef] [PubMed]
- Meng, X.H.; Zeng, S.X.; Tam, C.M. From voluntarism to regulation: A study on ownership, economic performance and corporate environmental information disclosure in China. J. Bus. Ethics 2013, 116, 217–232. [Google Scholar] [CrossRef]
- Baron, R.M.; Kenny, D.A. The moderator-mediator variable distinction in social psychological research: Conceptual, strategic, and statistical considerations. J. Pers. Soc. Psychol. 1986, 51, 1173–1182. [Google Scholar] [CrossRef]
- Zou, H.L.; Zeng, S.X.; Lin, H.; Xie, X.M. Top executives’ compensation, industrial competition, and corporate environmental performance. Manag. Decis. 2015, 53, 2036–2059. [Google Scholar] [CrossRef]
- Baker, S.R.; Bloom, N.; Davis, S.J. Measuring economic policy uncertainty. Q. J. Econ. 2016, 131, 1593–1636. [Google Scholar] [CrossRef]
- Tucker, J. Selection bias and econometric remedies in accounting and finance research. J. Account. Lit. 2011, 29, 31–57. Available online: https://ssrn.com/abstract=1756911 (accessed on 10 February 2011).
| Items | Keywords of Digital Transformation |
|---|---|
| Artificial Intelligence | “Business intelligence”, “Artificial intelligence”, “Machine learning”, “Business intelligence”, “Intelligent robot”, “Deep learning”, “Face recognition”, “Image understanding”, “Intelligent data analysis”, “Intelligent transportation”… |
| Blockchain | “Blockchain”, “Digital currency”, “Intelligent contract”, “League chain”, “Distributed computing”, “Consensus mechanism”, “Bitcoin”, “Digital currency”… |
| Data Management | “Big data analysis”, “Data mining”, “Text mining”, “Heterogeneous data”, “Data visualization”, “Distributed database”, “Virtual reality”, “Augmented reality”… |
| Multichannel | “O2O”, “C2C”, “C2B”, “B2B”, “B2C”, “Online retail”, “Online”, “E-business”, “E-commerce”, “Digital marketing” … |
| Digital Infrastructure | “5G”, “The Internet of things”, “The Internet”, “Industrial Internet”, “Cloud computing” … |
| Variables | Definition |
|---|---|
| Independent Variable | |
| OC | Indicator variable that is equal to 1 if CEO is overconfident in a given year, and 0 otherwise. |
| Dependent Variables | |
| ETI | Natural logarithm of 1 plus the aggregate number of green patents filed in the application. |
| EMI | Indicator variable that is equal to 1 if the firm has ISO14001 certification in a given year, and 0 otherwise. |
| Mediating variable | |
| DIG | An ordered classification variable, equal to 0–5 according to the relevant statements in the company’s annual report. |
| Control Variables | |
| LEV | The ratio of total liabilities to total assets at the end of the fiscal year. |
| ROA | The ratio of net income to total assets at the end of the fiscal year. |
| Growth | The ratio of change in the current year’s sales revenue relative to last year’s sales revenue. |
| Cash | The ratio of cash and equivalents to total assets at the end of the fiscal year. |
| Tobin’s Q | The ratio of market value to book value at the end of the fiscal year. |
| SOE | Indicator variable that is equal to 1 if a firm is controlled by the state, and 0 otherwise. |
| AGE | The natural log of a firm’s age. |
| DUAL | Indicator variable that is equal to 1 if the CEO and the chairman of the board are the same people, and 0 otherwise. |
| IND | Percentage of independent (outside) directors on the board. |
| BOARD | The natural log of the number of members on the board of directors. |
| GDP | The percentage change from the preceding period in per capita real GDP. |
| Market | The natural log of the level of marketization in the listed company’s province. |
| Panel A: Distributional Properties | ||||||||
|---|---|---|---|---|---|---|---|---|
| Variables | N | Mean | Sd | P1 | P25 | P50 | P75 | P99 |
| A: OC | 22,989 | 0.267 | 0.442 | 0 | 0 | 0 | 1 | 1 |
| B: DIG | 22,989 | 0.785 | 1.085 | 0 | 0 | 0 | 1 | 4 |
| C: ETI | 22,989 | 0.807 | 1.165 | 0 | 0 | 0 | 1.386 | 4.522 |
| D: EMI | 22,989 | 0.198 | 0.398 | 0 | 0 | 0 | 0 | 1 |
| E: LEV | 22,989 | 0.457 | 0.210 | 0.0594 | 0.293 | 0.454 | 0.613 | 0.950 |
| F: ROA | 22,989 | 0.0335 | 0.0650 | −0.292 | 0.0121 | 0.0332 | 0.0619 | 0.197 |
| G: Growth | 22,989 | 6.966 | 893.3 | −0.568 | −0.0221 | 0.106 | 0.267 | 3.038 |
| H: CASH | 22,989 | 0.549 | 0.208 | 0.0855 | 0.405 | 0.561 | 0.705 | 0.956 |
| I: Tobin’s Q | 22,989 | 2.180 | 4.245 | 0.876 | 1.227 | 1.609 | 2.346 | 8.752 |
| G: SOE | 22,989 | 0.449 | 0.497 | 0 | 0 | 0 | 1 | 1 |
| K: AGE | 22,989 | 2.160 | 0.736 | 0.693 | 1.609 | 2.303 | 2.773 | 3.219 |
| L: DUAL | 22,989 | 0.226 | 0.418 | 0 | 0 | 0 | 0 | 1 |
| M: IND | 22,989 | 0.373 | 0.0556 | 0.333 | 0.333 | 0.333 | 0.429 | 0.571 |
| N: BOARD | 22,989 | 2.148 | 0.203 | 1.609 | 1.946 | 2.197 | 2.197 | 2.708 |
| O: GDP | 22,989 | 7.625 | 1.288 | 6.109 | 6.752 | 7.042 | 7.860 | 10.64 |
| P: Market | 22,989 | 2.182 | 0.242 | 1.327 | 2.113 | 2.224 | 2.345 | 2.442 |
| Panel B: Correlations Part I | ||||||||
| Variables | A | B | C | D | E | F | G | H |
| A: OC | 1 | |||||||
| B: DIG | 0.217 *** | 1 | ||||||
| C: ETI | 0.081 *** | 0.212 *** | 1 | |||||
| D: EMI | 0.029 *** | 0.038 *** | 0.122 *** | 1 | ||||
| E: LEV | −0.156 *** | −0.132 *** | 0.114 *** | −0.051 *** | 1 | |||
| F: ROA | 0.034 *** | 0.023 *** | 0.015 ** | 0.042 *** | −0.353 *** | 1 | ||
| G: Growth | −0.00300 | −0.00500 | −0.00500 | −0.00400 | 0.00700 | 0.00100 | 1 | |
| H: CASH | 0.123 *** | 0.140 *** | 0.048 *** | 0.026 *** | −0.021 *** | 0.105 *** | −0.00700 | 1 |
| I: Tobin’s Q | 0.030 *** | 0.0100 | −0.060 *** | −0.030 *** | −0.057 *** | 0.026 *** | −0.00100 | 0.044 *** |
| G: SOE | −0.250 *** | −0.205 *** | 0.00600 | −0.042 *** | 0.266 *** | −0.062 *** | 0.00600 | −0.165 *** |
| K: AGE | −0.277 *** | −0.086 *** | 0.014 ** | −0.058 *** | 0.318 *** | −0.132 *** | 0.00600 | −0.142 *** |
| L: DUAL | 0.439 *** | 0.119 *** | −0.00100 | 0.00100 | −0.122 *** | 0.019 *** | −0.00200 | 0.084 *** |
| M: IND | 0.060 *** | 0.071 *** | 0.051 *** | −0.012 * | −0.012 * | −0.029 *** | −0.00500 | 0.041 *** |
| N: BOARD | −0.128 *** | −0.104 *** | 0.036 *** | 0.023 *** | 0.150 *** | 0.032 *** | 0.00200 | −0.140 *** |
| O: GDP | −0.080 *** | −0.361 *** | −0.232 *** | −0.114 *** | 0.148 *** | 0.039 *** | 0.00200 | −0.037 *** |
| P: Market | 0.128 *** | 0.214 *** | 0.130 *** | 0.049 *** | −0.128 *** | 0.049 *** | −0.012 * | 0.116 *** |
| Panel C: Correlations Part II | ||||||||
| Variables | I | G | K | L | M | N | O | P |
| I: Tobin’s Q | 1 | |||||||
| G: SOE | −0.064 *** | 1 | ||||||
| K: AGE | 0.012 * | 0.414 *** | 1 | |||||
| L: DUAL | 0.032 *** | −0.286 *** | −0.203 *** | 1 | ||||
| M: IND | 0.022 *** | −0.067 *** | −0.029 *** | 0.098 *** | 1 | |||
| N: BOARD | −0.072 *** | 0.281 *** | 0.111 *** | −0.176 *** | −0.485 *** | 1 | ||
| O: GDP | 0.019 *** | 0.213 *** | −0.021 *** | −0.108 *** | −0.087 *** | 0.149 *** | 1 | |
| P: Market | −0.00900 | −0.191 *** | −0.105 *** | 0.119 *** | 0.019 *** | −0.115 *** | −0.286 *** | 1 |
| Variables | (1) | (2) | (3) | (4) | (5) | (6) | (7) |
|---|---|---|---|---|---|---|---|
| H1a: ETI | H1b: EMI | H2: DIG | H3a: ETI | H3a: ETI | H3b: EMI | H3b: EMI | |
| OC | 0.211 *** | 0.009 | 0.258 *** | 0.162 *** | 0.007 | ||
| (10.97) | (1.32) | (15.44) | (8.56) | (0.94) | |||
| DIG | 0.196 *** | 0.189 *** | 0.010 *** | 0.010 *** | |||
| (21.84) | (20.91) | (3.41) | (3.29) | ||||
| LEV | 1.176 *** | 0.011 | 0.124 *** | 1.148 *** | 1.153 *** | 0.010 | 0.010 |
| (28.72) | (0.81) | (3.66) | (28.61) | (28.79) | (0.71) | (0.72) | |
| ROA | 1.532 *** | 0.249 *** | 0.234 ** | 1.477 *** | 1.488 *** | 0.246 *** | 0.246 *** |
| (13.57) | (6.23) | (2.18) | (13.37) | (13.49) | (6.16) | (6.17) | |
| Growth | −0.000 *** | −0.000 *** | 0.000 *** | −0.000 *** | −0.000 *** | −0.000 *** | −0.000 *** |
| (−10.86) | (−4.81) | (3.48) | (−10.99) | (−11.24) | (−4.91) | (−4.91) | |
| CASH | 0.309 *** | 0.004 | 0.469 *** | 0.235 *** | 0.221 *** | −0.000 | −0.001 |
| (7.71) | (0.27) | (13.91) | (5.92) | (5.58) | (−0.03) | (−0.07) | |
| Tobin’s Q | −0.012 ** | −0.002 ** | −0.007 ** | −0.011 ** | −0.011 ** | −0.002 ** | −0.002 ** |
| (−2.39) | (−2.33) | (−2.26) | (−2.31) | (−2.33) | (−2.30) | (−2.31) | |
| SOE | 0.129 *** | 0.016 *** | −0.162 *** | 0.156 *** | 0.160 *** | 0.018 *** | 0.018 *** |
| (7.36) | (2.66) | (−11.51) | (9.04) | (9.26) | (2.90) | (2.92) | |
| AGE | 0.026 ** | −0.016 *** | 0.009 | 0.011 | 0.024 ** | −0.017 *** | −0.016 *** |
| (2.23) | (−3.77) | (0.89) | (0.94) | (2.12) | (−3.96) | (−3.79) | |
| DUAL | −0.133 *** | −0.028 *** | −0.025 | −0.065 *** | −0.129 *** | −0.025 *** | −0.028 *** |
| (−6.94) | (−3.96) | (−1.48) | (−3.82) | (−6.83) | (−3.84) | (−3.92) | |
| IND | 1.445 *** | 0.029 | 0.695 *** | 1.316 *** | 1.314 *** | 0.022 | 0.022 |
| (8.55) | (0.56) | (5.94) | (7.83) | (7.84) | (0.43) | (0.43) | |
| BOARD | 0.473 *** | 0.104 *** | 0.122 *** | 0.446 *** | 0.449 *** | 0.102 *** | 0.102 *** |
| (10.37) | (7.05) | (3.58) | (9.95) | (10.06) | (6.95) | (6.97) | |
| GDP | −0.109 *** | −0.022 *** | −0.126 *** | −0.086 *** | −0.085 *** | −0.020 *** | −0.020 *** |
| (−25.79) | (−14.88) | (−31.80) | (−20.52) | (−20.44) | (−13.65) | (−13.64) | |
| Market | 0.497 *** | 0.049 *** | 0.261 *** | 0.459 *** | 0.448 *** | 0.047 *** | 0.046 *** |
| (15.31) | (3.97) | (10.95) | (14.63) | (14.36) | (3.81) | (3.77) | |
| Constant | −1.922 *** | 0.052 | 0.541 *** | −2.006 *** | −2.024 *** | 0.047 | 0.238 *** |
| (−11.28) | (0.90) | (4.28) | (−11.97) | (−12.11) | (0.82) | (6.54) | |
| Year FE | YES | YES | YES | YES | YES | YES | YES |
| Industry FE | YES | YES | YES | YES | YES | YES | YES |
| Adjusted-R2 | 0.197 | 0.0626 | 0.351 | 0.214 | 0.217 | 0.0631 | 0.0631 |
| Observations | 22,989 | 22,989 | 22,989 | 22,989 | 22,989 | 22,989 | 22,989 |
| Sobel-test | 0.04870 *** | 0.00261 *** | |||||
| (13.91) | (3.402) | ||||||
| Bootstrap r(ind_eff) | 0.04870 *** | 0.00261 *** | |||||
| [95% Conf. Interval] | [0.04071 ⋯ 0.05670] | [0.00092 ⋯ 0.00430] | |||||
| Bootstrap r(dir_eff) | 0.16198 *** | 0.00658 | |||||
| [95% Conf. Interval] | [0.12583 ⋯ 0.19813] | [−0.00683 ⋯ 0.02000] | |||||
| Variables | (1) | (2) | (3) | (4) | (5) |
|---|---|---|---|---|---|
| ETI | EMI | DIG | ETI | EMI | |
| OC | 0.208 *** | −0.003 | 0.236 *** | ||
| (9.11) | (−0.39) | (11.77) | |||
| DIG | 0.149 *** | 0.013 *** | |||
| (15.08) | (3.72) | ||||
| LEV | 1.353 *** | 0.047 ** | 0.121 ** | 1.332 *** | 0.019 |
| (19.47) | (2.03) | (2.08) | (26.92) | (1.08) | |
| ROA | 1.421 *** | 0.334 *** | −0.272 | 1.490 *** | 0.254 *** |
| (7.63) | (5.29) | (−1.56) | (10.47) | (5.10) | |
| Growth | −0.000 *** | −0.000 | −0.000 *** | −0.000 | −0.000 * |
| (−2.83) | (−0.78) | (−4.03) | (−0.41) | (−1.86) | |
| CASH | 0.418 *** | −0.006 | 0.654 *** | 0.156 *** | 0.006 |
| (6.05) | (−0.27) | (10.96) | (3.17) | (0.37) | |
| Tobin’s Q | −0.006 ** | −0.001 ** | −0.004 | −0.010 * | −0.002 * |
| (−2.02) | (−2.02) | (−1.41) | (−1.93) | (−1.86) | |
| SOE | 0.072 ** | 0.023** | −0.152 *** | 0.229 *** | 0.012 |
| (2.39) | (2.18) | (−6.22) | (10.96) | (1.60) | |
| AGE | 0.060 *** | −0.004 | 0.024 | 0.020 | −0.014 *** |
| (3.37) | (−0.67) | (1.53) | (1.51) | (−2.78) | |
| DUAL | −0.120 *** | −0.043 *** | −0.036 * | −0.077 *** | −0.021 *** |
| (−4.99) | (−4.88) | (−1.71) | (−3.94) | (−2.82) | |
| IND | 1.241 *** | 0.105 | 0.954 *** | 1.413 *** | −0.006 |
| (4.36) | (1.26) | (4.60) | (6.86) | (−0.10) | |
| BOARD | 0.486 *** | 0.149 *** | 0.151 ** | 0.401 *** | 0.094 *** |
| (6.15) | (5.94) | (2.37) | (7.17) | (5.33) | |
| GDP | −0.228 *** | −0.048 *** | −0.319 *** | −0.085 *** | −0.019 *** |
| (−15.26) | (−8.07) | (−26.99) | (−17.96) | (−11.00) | |
| Market | 0.579 *** | 0.078 *** | 0.420 *** | 0.486 *** | 0.045 ** |
| (10.74) | (3.55) | (7.94) | (11.94) | (2.56) | |
| Constant | −1.568 *** | 0.008 | 1.089 *** | −2.121 *** | 0.075 |
| (−4.80) | (0.07) | (4.04) | (−10.13) | (1.03) | |
| Year FE | YES | YES | YES | YES | YES |
| Industry FE | YES | YES | YES | YES | YES |
| Adjusted-R2 | 0.182 | 0.0541 | 0.365 | 0.217 | 0.0608 |
| Observations | 9063 | 9063 | 9063 | 16,543 | 16,543 |
| Variables | (1) | (2) | (3) | (4) | (5) |
|---|---|---|---|---|---|
| ETI | EMI | DIG | ETI | EMI | |
| OC | 0.191 *** | 0.007 | 0.248 *** | ||
| (10.26) | (0.96) | (14.91) | |||
| DIG | 0.158 *** | 0.009 *** | |||
| (18.33) | (2.90) | ||||
| IMR_DIG | −0.525 *** | ||||
| (−16.49) | |||||
| IMR_ETI | −1.028 *** | −0.971 *** | |||
| (−40.53) | (−38.79) | ||||
| IMR_EMI | −0.291 *** | −0.289 *** | |||
| (−14.19) | (−14.11) | ||||
| LEV | 0.467 *** | 0.010 | 0.085 ** | 0.482 *** | 0.009 |
| (11.88) | (0.72) | (2.53) | (12.40) | (0.64) | |
| ROA | 0.566 *** | 0.007 | 0.048 | 0.573 *** | 0.007 |
| (5.29) | (0.17) | (0.45) | (5.42) | (0.15) | |
| Growth | 0.000 *** | 0.005 *** | 0.000 *** | 0.000 *** | 0.004 *** |
| (16.42) | (9.34) | (16.59) | (16.09) | (9.22) | |
| CASH | 0.051 | −0.015 | 0.189 *** | 0.007 | −0.018 |
| (1.31) | (−1.03) | (5.01) | (0.19) | (−1.28) | |
| Tobin’s Q | 0.008 *** | 0.010 *** | −0.001 | 0.008 *** | 0.010 *** |
| (5.95) | (6.88) | (−0.25) | (7.56) | (6.89) | |
| SOE | 0.015 | −0.003 | −0.095 *** | 0.043 ** | −0.001 |
| (0.90) | (−0.42) | (−6.49) | (2.55) | (−0.19) | |
| AGE | 0.059 *** | 0.000 | 0.022 ** | 0.042 *** | −0.000 |
| (5.36) | (0.10) | (2.20) | (3.96) | (−0.02) | |
| DUAL | −0.094 *** | −0.010 | −0.052 *** | −0.033 ** | −0.008 |
| (−5.07) | (−1.33) | (−3.08) | (−1.97) | (−1.16) | |
| IND | 0.861 *** | −0.024 | 0.268 ** | 0.790 *** | −0.030 |
| (5.35) | (−0.46) | (2.24) | (4.92) | (−0.57) | |
| BOARD | 0.114 *** | 0.013 | 0.018 | 0.112 ** | 0.013 |
| (2.60) | (0.84) | (0.51) | (2.57) | (0.80) | |
| GDP | 0.004 | −0.001 | −0.110 *** | 0.039 *** | 0.001 |
| (0.39) | (−0.28) | (−7.48) | (3.66) | (0.25) | |
| Market | −0.002 | −0.004 | 0.089 *** | −0.003 | −0.006 |
| (−0.07) | (−0.36) | (3.66) | (−0.12) | (−0.49) | |
| Constant | 0.834 *** | 0.607 *** | 1.621 *** | 0.481 *** | 0.590 *** |
| (4.65) | (8.37) | (11.52) | (2.68) | (8.12) | |
| Year FE | YES | YES | YES | YES | YES |
| Industry FE | YES | YES | YES | YES | YES |
| Adjusted-R2 | 0.256 | 0.0707 | 0.358 | 0.266 | 0.0710 |
| Observations | 22,988 | 22,908 | 22,988 | 22,988 | 22,908 |
| OC→ETI | (1) Alternative OC Measure | (6) Sub-Sample I Year: 2012–2019 | (11) Sub-Sample II Manufacturing | (16) Lag Effect OCt-1 | (21) Lag Effect OCt-2 | (26) Fixed-Effects Estimator |
|---|---|---|---|---|---|---|
| OC | 0.128 *** | 0.221 *** | 0.112 *** | 0.210 *** | 0.218 *** | 0.083 *** |
| (8.66) | (9.96) | (5.10) | (9.94) | (9.33) | (3.20) | |
| Controls | YES | YES | YES | YES | YES | YES |
| Year FE | YES | YES | YES | YES | YES | YES |
| Industry FE | YES | YES | YES | YES | YES | YES |
| Adjusted-R2 | 0.195 | 0.188 | 0.261 | 0.201 | 0.205 | 0.1971 |
| Observations | 22,989 | 17,908 | 14,596 | 19,250 | 16,192 | 20,372 |
| OC→EMI | (2) Alternative OC Measure | (7) Sub-SampleI Year: 2012–2019 | (12) Sub-SampleII Manufacturing | (17) Lag Effect OCt-1 | (22) Lag Effect OCt-2 | (27) Fixed-Effects Estimator |
| OC | −0.007 | 0.009 | −0.007 | 0.011 | 0.022 *** | −0.014 |
| (−1.30) | (1.16) | (−0.81) | (1.46) | (2.62) | (−1.21) | |
| Controls | YES | YES | YES | YES | YES | YES |
| Year FE | YES | YES | YES | YES | YES | YES |
| Industry FE | YES | YES | YES | YES | YES | YES |
| Adjusted-R2 | 0.0626 | 0.0566 | 0.049 | 0.0633 | 0.0632 | 0.0217 |
| Observations | 22,989 | 17,908 | 14,596 | 19,250 | 16,192 | 20,372 |
| OC→DIG | (3) Alternative OC and DIG Measure | (8) Sub-SampleI Year: 2012–2019 | (13) Sub-SampleII Manufacturing | (18) Lag Effect OCt-1 | (23) Lag Effect OCt-2 | (28) Fixed-Effects Estimator |
| OC | 1.719 *** | 0.281 *** | 0.164 *** | 0.279 *** | 0.290 *** | 0.261 *** |
| (7.27) | (14.01) | (9.15) | (15.20) | (14.35) | (9.87) | |
| Controls | YES | YES | YES | YES | YES | YES |
| Year FE | YES | YES | YES | YES | YES | YES |
| Industry FE | YES | YES | YES | YES | YES | YES |
| Adjusted-R2 | 0.248 | 0.304 | 0.330 | 0.349 | 0.338 | 0.2517 |
| Observations | 22,989 | 17,908 | 14,596 | 19,250 | 16,192 | 20,372 |
| DIG→ETI | (4) Alternative DIG Measure | (9) Sub-SampleI Year: 2012–2019 | (14) Sub-SampleII Manufacturing | (19) Lag Effect DIGt-1 | (24) Lag Effect DIGt-2 | (29) Fixed-Effects Estimator |
| DIG | 0.008 *** | 0.195 *** | 0.161 *** | 0.215 *** | 0.243 *** | 0.047 *** |
| (14.77) | (20.87) | (13.55) | (20.31) | (19.68) | (6.28) | |
| Controls | YES | YES | YES | YES | YES | YES |
| Year FE | YES | YES | YES | YES | YES | YES |
| Industry FE | YES | YES | YES | YES | YES | YES |
| Adjusted-R2 | 0.205 | 0.206 | 0.272 | 0.219 | 0.225 | 0.199 |
| Observations | 22,989 | 17,908 | 14,596 | 19,250 | 16,192 | 20,372 |
| DIG→EMI | (5) Alternative DIG Measure | (10) Sub-SampleI Year: 2012–2019 | (15) Sub-SampleII Manufacturing | (20) Lag Effect DIGt-1 | (25) Lag Effect DIGt-2 | (30) Fixed-Effects Estimator |
| DIG | 0.001 *** | 0.009 *** | 0.009 ** | 0.013 *** | 0.016 *** | 0.012 ** |
| (5.01) | (2.94) | (2.02) | (3.77) | (3.99) | (2.52) | |
| Controls | YES | YES | YES | YES | YES | YES |
| Year FE | YES | YES | YES | YES | YES | YES |
| Industry FE | YES | YES | YES | YES | YES | YES |
| Adjusted-R2 | 0.0637 | 0.0570 | 0.0298 | 0.0639 | 0.0638 | 0.0139 |
| Observations | 22,989 | 17,908 | 14,596 | 19,250 | 16,192 | 13,848 |
| Variables | (1) | (2) | (3) | (4) | (5) | (6) |
|---|---|---|---|---|---|---|
| DIG | DIG | ETI | EMI | ETI | EMI | |
| OC | 0.327 *** | 0.186 *** | ||||
| (15.19) | (6.17) | |||||
| DIG | −1.263 *** | 0.013 | 0.059 | 0.046 ** | ||
| (−9.02) | (0.31) | (0.91) | (2.49) | |||
| HHI | −0.569 *** | |||||
| (−5.32) | ||||||
| EPU | 0.0004 *** | |||||
| (2.53) | ||||||
| SIZE | 0.063 *** | −0.000 | ||||
| (9.91) | (−0.13) | |||||
| ICQ | 0.020 ** | −0.006 ** | ||||
| (2.01) | (−1.99) | |||||
| HHI | −0.029 | |||||
| (−0.54) | ||||||
| EPU | 0.007 *** | |||||
| (15.84) | ||||||
| SIZE | 0.326 *** | 0.019 *** | ||||
| (37.56) | (6.65) | |||||
| ICQ | 0.118 *** | 0.019 *** | ||||
| (10.79) | (5.23) | |||||
| Controls | YES | YES | YES | YES | YES | YES |
| Year FE | YES | YES | YES | YES | YES | YES |
| Industry FE | YES | YES | YES | YES | YES | YES |
| Adjusted-R2 | 0.352 | 0.351 | 0.313 | 0.0650 | 0.222 | 0.0639 |
| Observations | 22,989 | 22,989 | 22,989 | 22,989 | 22,989 | 22,989 |
Publisher’s Note: MDPI stays neutral with regard to jurisdictional claims in published maps and institutional affiliations. |
© 2022 by the authors. Licensee MDPI, Basel, Switzerland. This article is an open access article distributed under the terms and conditions of the Creative Commons Attribution (CC BY) license (https://creativecommons.org/licenses/by/4.0/).
Share and Cite
Zhou, P.; Zhou, S.; Zhang, M.; Miao, S. Executive Overconfidence, Digital Transformation and Environmental Innovation: The Role of Moderated Mediator. Int. J. Environ. Res. Public Health 2022, 19, 5990. https://doi.org/10.3390/ijerph19105990
Zhou P, Zhou S, Zhang M, Miao S. Executive Overconfidence, Digital Transformation and Environmental Innovation: The Role of Moderated Mediator. International Journal of Environmental Research and Public Health. 2022; 19(10):5990. https://doi.org/10.3390/ijerph19105990
Chicago/Turabian StyleZhou, Peiyan, Shuya Zhou, Ming Zhang, and Shujuan Miao. 2022. "Executive Overconfidence, Digital Transformation and Environmental Innovation: The Role of Moderated Mediator" International Journal of Environmental Research and Public Health 19, no. 10: 5990. https://doi.org/10.3390/ijerph19105990
APA StyleZhou, P., Zhou, S., Zhang, M., & Miao, S. (2022). Executive Overconfidence, Digital Transformation and Environmental Innovation: The Role of Moderated Mediator. International Journal of Environmental Research and Public Health, 19(10), 5990. https://doi.org/10.3390/ijerph19105990