Article

Development and Validation of the Coping Capacity Measurement Scale of Public Health Emergencies in China

1
School of Engineering and Technology, China University of Geosciences, Beijing 100083, China
2
Department of Architecture and Civil Engineering, City University of Hong Kong, Hong Kong 999077, China
*
Author to whom correspondence should be addressed.
Int. J. Environ. Res. Public Health 2022, 19(1), 94; https://doi.org/10.3390/ijerph19010094
Submission received: 11 November 2021 / Revised: 18 December 2021 / Accepted: 21 December 2021 / Published: 23 December 2021

Abstract

:
Public health emergency coping capacity has been an important direction in crisis research in recent years. The use of the public health emergency coping capacity scale to evaluate the public’s response and feelings regarding public health emergencies is one of the essential ways to improve the effectiveness of public health emergency response. Based on literature research, this paper constructed the theoretical dimension of public health emergency coping ability and completed the development of the items of the initial scale in China. After using SPSS 22.0-conducted exploratory factor analysis, confirmatory factor analysis, and reliability test, the scale dimensions and items were deleted and optimized. The final public health emergency coping capacity measurement scale in China included 12 items and four dimensions. The results showed that the developed scale has high reliability and validity, which is helpful for the relevant personnel to understand the level of public health emergency coping ability and provides an essential basis for timely and accurate emergency prevention and control interventions.

1. Introduction

Public health emergencies are unpredictable and can cause significant material and economic losses. They are related to national security, social stability, people’s health, and the long-term and stable development of the world’s economy and society. Coping ability is the ability of individuals to solve problems in everyday life at minimal cost and refers to the adaptability of individuals’ intuition, cognition, emotions, and behaviors [1], and can be reflected by individuals’ behaviors; usually changes in personal ways of thinking, emotions, and behaviors that occur when individuals are challenged by environmental needs, individual needs, expectations, and goals [2]. Current research related to coping capacity focuses on psychology [3,4,5], disaster control [6,7], educational theory and educational management [8]. Although it is difficult to avoid public health emergencies, improving the ability to respond, mastering the relevant knowledge and skills, and taking appropriate measures quickly and in a timely manner will play an invaluable role in the onset of a crisis. Currently, as COVID-19 is a global pandemic public health emergency, whether the public has a high coping capacity during the pandemic determines whether they can quickly adapt to many changes during the outbreak. In the current situation, it seems that the public’s cognition of emergencies is insufficient. From college students with high levels of knowledge and culture, to front-line medical and nursing staff to the general public, all lack emergency response knowledge to varying degrees [9], and their ability to cope with emergencies is generally low. Therefore, it is of great significance to quantitatively evaluate the public’s ability to respond to public health emergencies. However, there are few coping capacity measurement scales for public health emergencies. There are still many questions as to whether the existing coping capacity measurement scales can be fully applicable to the specific environment of public health events.
Public health emergency coping research has attracted much attention since SARS, especially after the COVID-19 outbreak in 2020. Most scholars have discussed the public’s emergency awareness, psychological state and emergency management ability. Rana et al. [10] selected Pakistan as the case study area and designed a 40-item questionnaire, aiming to understand gender differences in COVID-19 risk perception and coping mechanisms; Yin and Ni [11] believed that the effect of COVID-19 on the emotions or behaviors of employees in tourism companies is worth studying, revealing that the intensity of COVID-19 events indirectly affects coping behavior through fear of external threats or psychological security, and that supervisor safety support moderates the effect of psychological safety on this coping behavior. Chen, Zou and Gao [12] investigated the risk and protective factors of psychological distress among Hubei during the peak of the pandemic, and concluded that various stressors related to the new coronavirus outbreak, including risk disclosure, limited access to medical care, inadequate basic supplies, reduced income, overexposure to coronavirus-related information, and perceived discrimination, were associated with psychological stress. Moreover, individual scholars focused on establishing and improving emergency mechanisms and medical protection. Minyoung [13] summarized and analyzed the shortage of healthcare resources, the redistribution of healthcare capacity, reuse of hospitals, and close cooperation between the government and the healthcare commission during the COVID-19 outbreak in South Korea. Another study explored the issue of civic engagement. Zhao et al. [14] conducted in-depth semi-structured interviews with nursing staff to explore the challenges and coping strategies experienced by nursing staff during COVID-19 in China, arguing that different groups encountered different sources of pressure and adopted different coping strategies to fulfill their responsibilities. It is worth mentioning that many studies on COVID-19 have tried to capture the pulse of the nation, and different scholars have used different data sources: Porcher and Renault [15] constructed a novel database containing hundreds of thousands of geotagged messages related to the COVID-19 pandemic sent on Twitter, then analyzed the number of tweets containing various keywords to capture social distancing beliefs and concluded that an increase in the Twitter index of social distancing on the previous day was associated with a decrease in mobility on the following day; Brodeur, Clark, Fleche, and Powdthavee [16] used Google Trends data to test whether COVID-19 and the associated lockdowns implemented in Europe and America led to changes in well-being-related search terms by using difference-in-differences and a regression discontinuity design, and this lead to the conclusion that people’s mental health may have been severely affected by the pandemic and lockdown. It is evident that the outbreak of the COVID-19 pandemic has focused scholars’ attention on the study of response capacity to public health emergencies. However, the development of its measurement tools remains a minority in terms of research.
In terms of coping ability, most of the studies focus on coping ability for a specific group. In contrast, coping ability here primarily refers to addressing all challenges and obstacles in a general and non-directive way. Bode et al. [5] conducted a four-phase group intervention aimed at improving positive coping skills in people aged 50 to 75 years and investigated the positive and negative side effects and differential effects of this educational program. Ito, Seo, Maeno, Ogawa, and Maeno [17] investigated whether Consistency of indicators of stress coping capacity (SOC) could be used to predict depression two years after the beginning of clinical training in Japan through a questionnaire survey. Mahbobeh [18] randomly selected 642 college students to answer two questionnaires to test the validity and reliability of the coping response scale for Iranian college students. The other studies investigate the coping ability of the public, relevant institutions and government departments to natural disasters. Ting, Linsheng, Shaohong, Jiangbo, and Binggan [19] proposed an evaluation method for natural disaster response capability, attempting to quantify the natural disaster response capability to disaster levels and applying it to typhoon prevention and response. Walkling and Haworth [20] conducted in-depth interviews with 12 retired populations in flood risk areas in North Wales, UK, to determine risk perception, coping ability and risk communication preference, to understand the risk experience of the elderly in more detail and provide information for disaster risk reduction (DRR) and communication methods. Chisty and Rahman [6] attempted to understand the vulnerability status of the study area with respect to fire, using a specific vulnerability assessment tool and the existing fire response capabilities of the study area residents. Additionally, a great deal of research in public administration has tried to capture the difference in capabilities and insist on cultural differences: Brian and Shui-Yan [21] fills this gap in the debate by comparing COVID-19 responses among five advanced economies in East Asia: Taiwan, Hong Kong, South Korea, Singapore, and Japan. These studies have specific theoretical and practical significance, and can be used as a reference for public coping capacity for public health emergencies to a certain extent. However, most questionnaires have no measurement indicators, lack modifications and updates after the occurrence of COVID-19, focusing on general coping ability and targeted research.
To sum up, in this study, against the background of the frequent occurrence of global emergencies in recent years and the continued impact of COVID-19 on countries around the world, we attempted to explore the structural model of the public’s ability to respond to public health emergencies from a psychological perspective, using the national situation of China as the basis of the study, develop a scale for investigation, and construct and verify the scale of coping ability of public health emergencies in the background of frequent global emergencies and COVID-19 continues to affect the whole world, to provide a measuring tool for future research on coping ability of public health emergencies. The research results can provide a solid empirical basis for the government and relevant departments to take measures in time.

2. Methods

This study discusses the theoretical model of public health emergency coping ability from the perspective of psychology, and was carried out according to the steps of first draft project preparation, scale pretrial and project analysis, exploratory factor analysis, Confirmatory factor analysis and reliability test, which refers to Devellis’ “Scale Development: Theory and Application” [22].

2.1. The Theoretical Structure of Public Health Emergency Response Capacity

From the perspective of psychology, this paper refers to the dimension proposed by Epstein and Meier [23], that is, the coping ability factor obtained through factor analysis is composed of one overall factor and six main factors: Global Constructive Thinking; Emotional Coping; Behavioral Coping; Categorical Thinking; Negative Thinking; Superstitious Thinking; Naive Optimism. The details are as follows:
  • Global Constructive Thinking: High scorers are flexible and can adapt their way of thinking to the situation. When the condition is dangerous, they may be pessimistic, but if there is a possible or feasible way to control the problem, they will try to control it. They also accept conditions beyond their control; they accept others as well as themselves; they do not judge others, but they think about how to solve problems.
  • Emotional Coping: High scorers deal with difficult situations in ways that do not create undue stress; they accept themselves and do not take things personally; they are not very sensitive to words such as disapproval, failure and rejection.
  • Behavioral Coping: High scorers are optimistic, enthusiastic, energetic and responsible. Action is usually taken quickly and time is allocated to focus on solving practical problems.
  • Categorical Thinking: High scorers are characterized by extreme thinking, intolerance and distrust of others.
  • Superstitious Thinking: High scorers lack critical thinking and rely too much upon personal judgment.
  • Negative Thinking: High scorers tend to be defensive against threats, and as a result, tend to be pessimistic, unhelpful, and depressed.
  • Naive Optimism: Reasonable optimism is adaptable, energetic and well-liked; on the other hand, the negative side will be simple-minded, the wrong face of adversity.
This paper refers to the six main dimensions of the mature coping capacity measurement scale designed by Epstein and Meier [23], summarizes the literature on the coping capacity of various groups during COVID-19 [24], and combines the characteristics of public health emergencies and anti-pandemic measures taken by China with the coping measures taken by different countries to cope with COVID-19. The ability to cope with public health emergencies was divided into seven dimensions: emotional coping, behavioral coping, absolute thinking, superstitious thinking, negative thinking, pure optimism and disease prevention.

2.2. Preparation of Public Coping Capacity for Public Health Emergencies

This paper refers to the Constructive Thinking Inventory (CTI) compiled by Epstein and Meier [23], also known as the “Constructive Thinking Scale”, combined with the characteristics of the paper concept and public health emergencies, for specific deletions and modifications, to obtain a partial coping ability measurement scale. The complete predictive scale included basic population information and three questions, which were general single choice questions, and there are 23 items in the coping ability scale, which is a five-point Likert scale, with a total of 26 items. The specific items and their corresponding dimensions are shown in Table A1 in Appendix A.

2.3. Statistical Analysis

In the exploratory factor analysis (EFA), the principal component analysis was adopted in this study to screen factors with eigenvalues greater than 1 in order to provide initial solutions for factor analysis; in addition, the maximum variance rotation method was adopted for factor rotation so that the elements of the columns of the transformed factor loading matrix have the maximum variance after squaring each element while maintaining independence from each other.
In the confirmatory factor analysis (CFA), we performed a common method bias (CMV) analysis, in which all the measures (i.e., the measurement scale items corresponding to all the factors) were placed inside a factor and then analyzed, and if the measures showed that the model fit indicators, such as χ2/df, RMSEA, RMR, CFI, etc., could not be met, then the model fit was poor, i.e., it indicated that all the measures were not supposed to belong to the same factor (bad model when placed together), thus indicating that there was no common method bias problem with the data.

3. Results

3.1. Development of the Initial Scale of Public Health Emergency Coping Capacity

3.1.1. Distribution and Recovery of Pre-Test Questionnaires

The questionnaire was not targeted at a specific group of people and was distributed within mainland China. The questionnaire was prepared and distributed through a questionnaire distribution website, and then disseminated and diffused in the form of websites and social media, and the sample was drawn by snowball sampling. The data was collected from 11 June 2021, 9:18 to 16 June 2021, 12:24. A total of 162 questionnaires were distributed and 162 valid questionnaires were returned, with a valid return rate of 100%. There were 26 items on the scale, and 162 valid questionnaires were much more extensive than three times the number of items, so they were suitable for follow-up analysis.
The scale adopts the five-point scale; that is, there are five options for each item, “strongly inconsistent”, “quite inconsistent”, “consistent”, “quite consistent” and “strongly consistent”, corresponding to 1–5 points, respectively.

3.1.2. Descriptive Statistics

The demographic data of the primary test subjects were analyzed. The results showed that the issues were mainly female, accounting for 56.17% of the whole sample. Most of them were aged between 18 and 25, accounting for 48.77% of the whole sample. The vast majority of the interviewees have a bachelor degree or above, accounting for 78.39% of the full sample. The specific results are shown in Table 1.

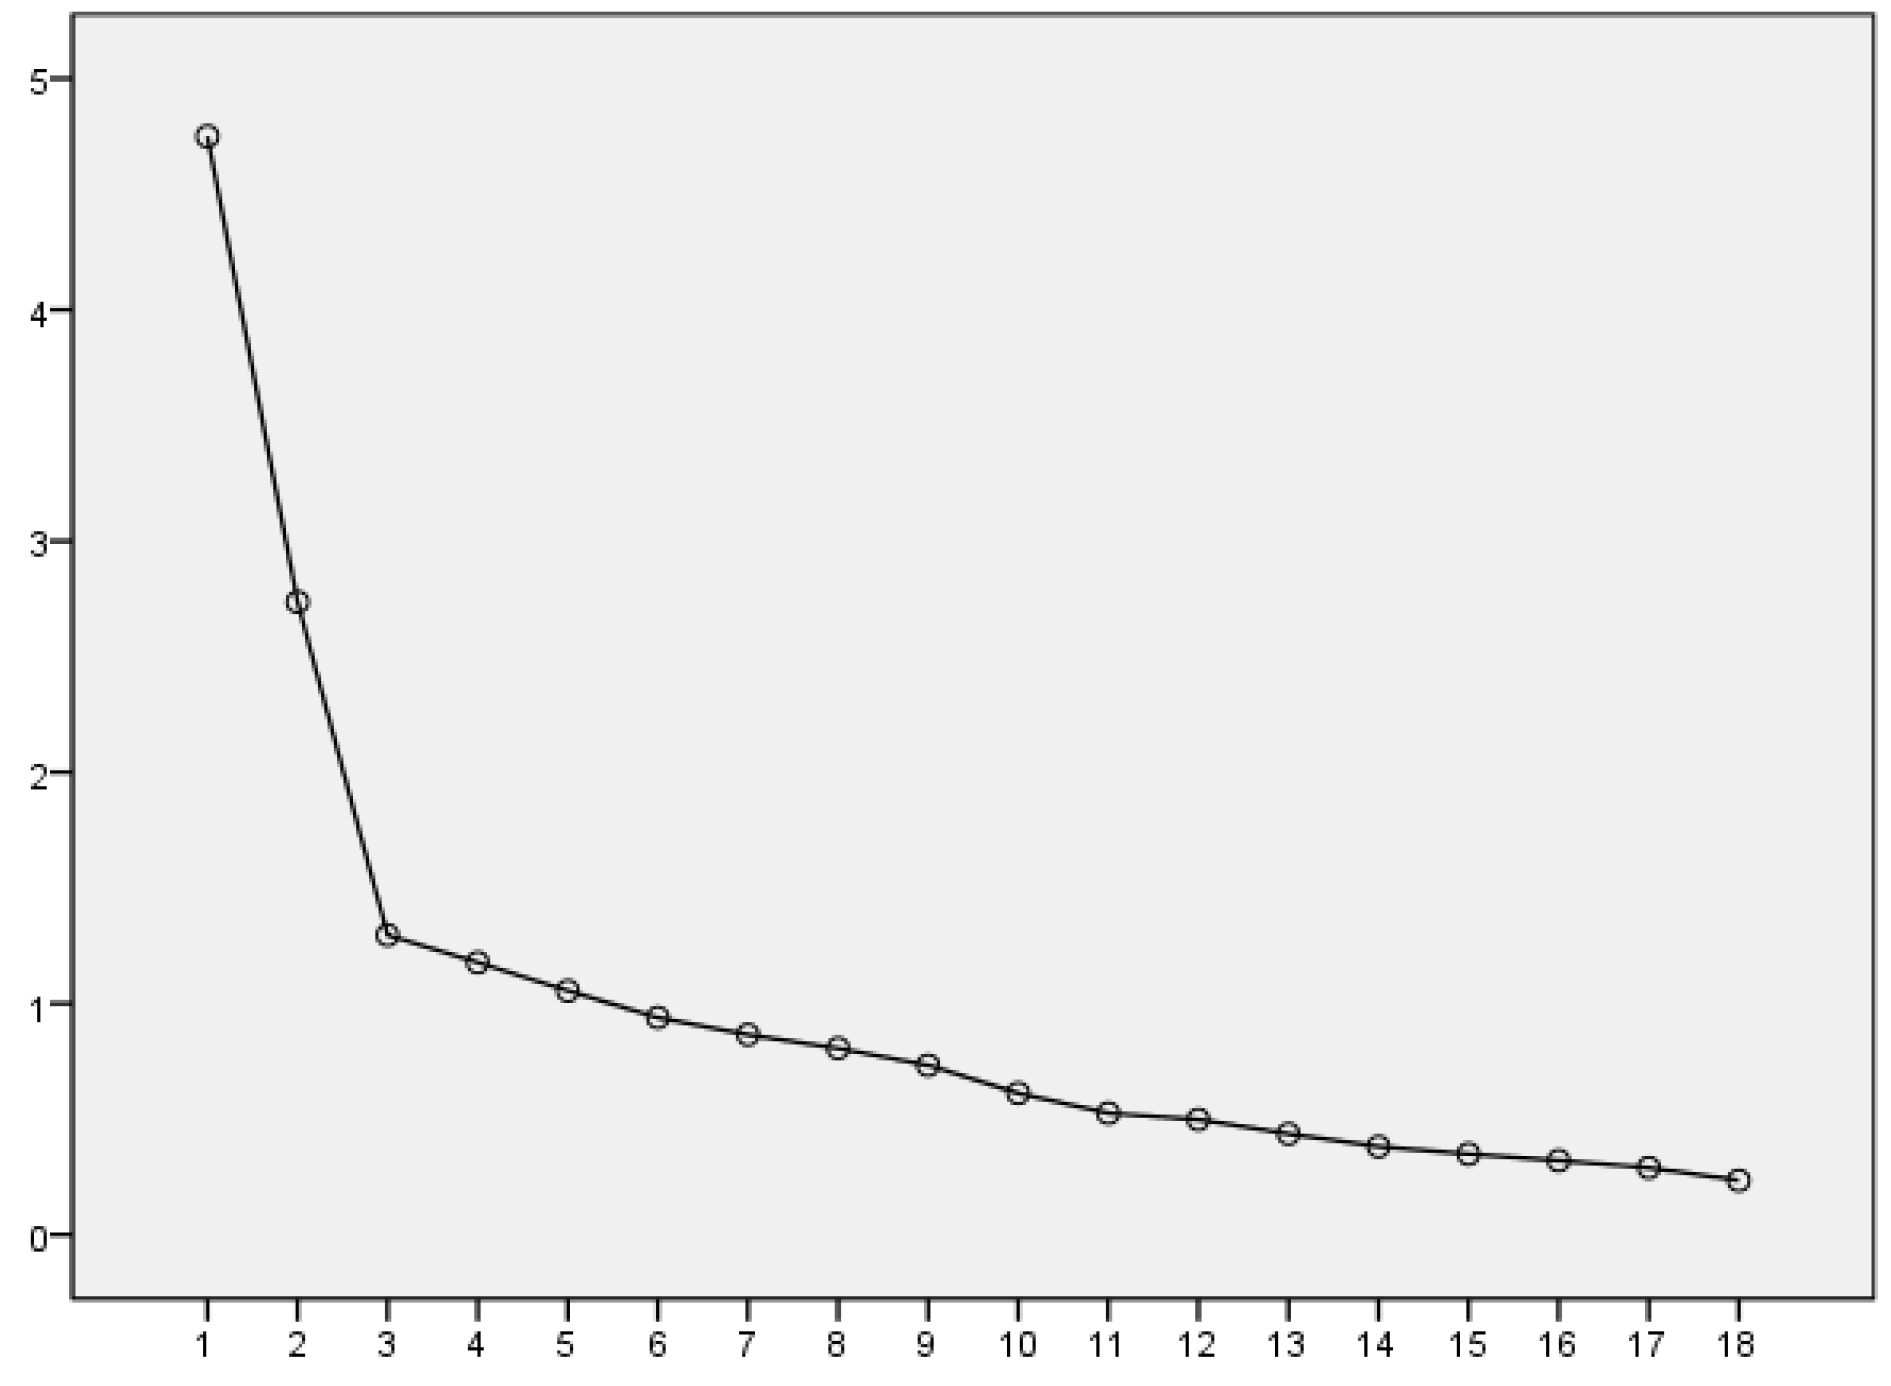
3.1.3. Exploratory Factor Analysis

Firstly, KMO and Bartlett sphericity tests were carried out on 23 items, and the results showed that there was a correlation between variables, which was very suitable for factor analysis. Cox et al. showed that the factor load factor should not be less than 0.40, and this paper stipulates that it should not be less than 0.50. The first factor analysis showed that the factor loading coefficients of Q5, Q6, Q17 and Q24 were not up to standard. Therefore, the second factor analysis after deleting these four items showed that the common degree of Q4 was less than 0.4. The third factor analysis was performed after the item was deleted. The following Table 2 shows the results of the KMO and Bartlett sphericity test after the item was deleted.
The results showed that the corresponding P-value of the sphericity test was less than 0.05, and the approximate Chi-square was 956.916 (153 degrees of freedom), which reached a significant level. The KMO value was 0.779, which was more significant than 0.70, indicating a correlation between variables and it was suitable for factor analysis.
Five common factors were obtained according to variance explained rate and gravel map, and their variance explained rates were 13.944%, 13.442%, 9.903%, 9.039%, 7.757% and 6.785%, accounting for 60.870% of the total, as shown below in Table 3. The eigenvalue gravel plot obtained from the factor analysis is shown in Figure 1.
The commonality of factor analysis results can be used to represent the validity of the scale. The common degree is 0–1, which indicates the ratio of the variance of the original variable determined by the common factor. The closer the commonness value is to 1, showing that the more the original variable information contained in the variable, the better the measurement effect. The common coefficient is generally considered more significant than 0.5, meaning high validity. According to factor analysis results, the items are sorted by dimension and factor load coefficient, and the consequences of specific scale analysis are shown in Table 4.
As can be seen from the table, 18 question items and five factors were finally obtained. The original two dimensions of Categorical Thinking and Disease Prevention are deleted, and the Naive Optimism dimension is renamed as Optimistic Thinking. In contrast, the Negative Thinking dimension is renamed as Pessimistic Thinking. Therefore, the five factors are named Pessimistic Thinking, Behavioral Coping, Emotional Coping, Superstitious Thinking and Optimistic Thinking. In addition, after the selection of items, the remaining items after deletion are reclassified in dimensions. Finally, the initial scale items and dimensions are shown in Table A2 in Appendix A.

3.1.4. Reliance Analysis

To test the validity of the developed scale, this section uses the most common internal consistency reliability to test the reliability of the initial scale of public emergency response capacity after deleting invalid items. The results are shown in Table 5.
From the above table, we can see that the reliability coefficient value is 0.817, and the reliability is more significant than 0.8, which indicates that the study can withstand the repeatability test. The measurement results are accurate, stable and credible. It shows that after the deletion of invalid items, the remaining items should not be deleted, and the next round of evaluation and analysis can be carried out.

3.2. Verification of the Initial Scale Public of Coping Capacity to Public Health Emergencies

Based on the analysis results of the initial questionnaire, confirmatory factor analysis was carried out on the initial scale, and reliability and validity analysis was carried out on the coping ability of public health emergencies and its dimensions to ensure the content validity and structural validity of the questionnaire. The scale items were renumbered before analysis. The scale still used the five-point scale method; that is, each item had five options, “strongly inconsistent”, “quite inconsistent”, “consistent”, “quite consistent” and “strongly consistent”, corresponding to 1–5 points, respectively. The higher the score, the higher the capacity to cope with public health emergencies.
The questionnaire was not targeted at a specific group of people and was distributed within mainland China. Similarly, the questionnaire was prepared and distributed through a questionnaire distribution website, and then disseminated and diffused in the form of websites and social media with a snowball sampling of the sample. The data was collected from 24 June 2021, 13:06 until 14 July 2021, 20:29. A total of 556 questionnaires were issued; questionnaires that have been completed in too short or too long a time (according to the number of questionnaire items and topic description judgment, less than 20 seconds or more than 1000 seconds for questionnaire time is too short or too long, respectively), or with the same answers have been deleted. A total of 514 valid questionnaires were recovered, at a recovery rate of 92.4%. There were 18 scale items; as the number of valid questionnaires, 514, was much larger than 10 times the number of items, it was suitable for confirmatory analysis.
The results showed that the samples were mainly female, accounting for 58.02% of the whole sample. Most of them were aged between 26 and 30, accounting for 31.35% of the whole sample. The vast majority of the interviewees have a bachelor degree or above, accounting for 87.57% of the full sample. The specific results are shown in Table 6.

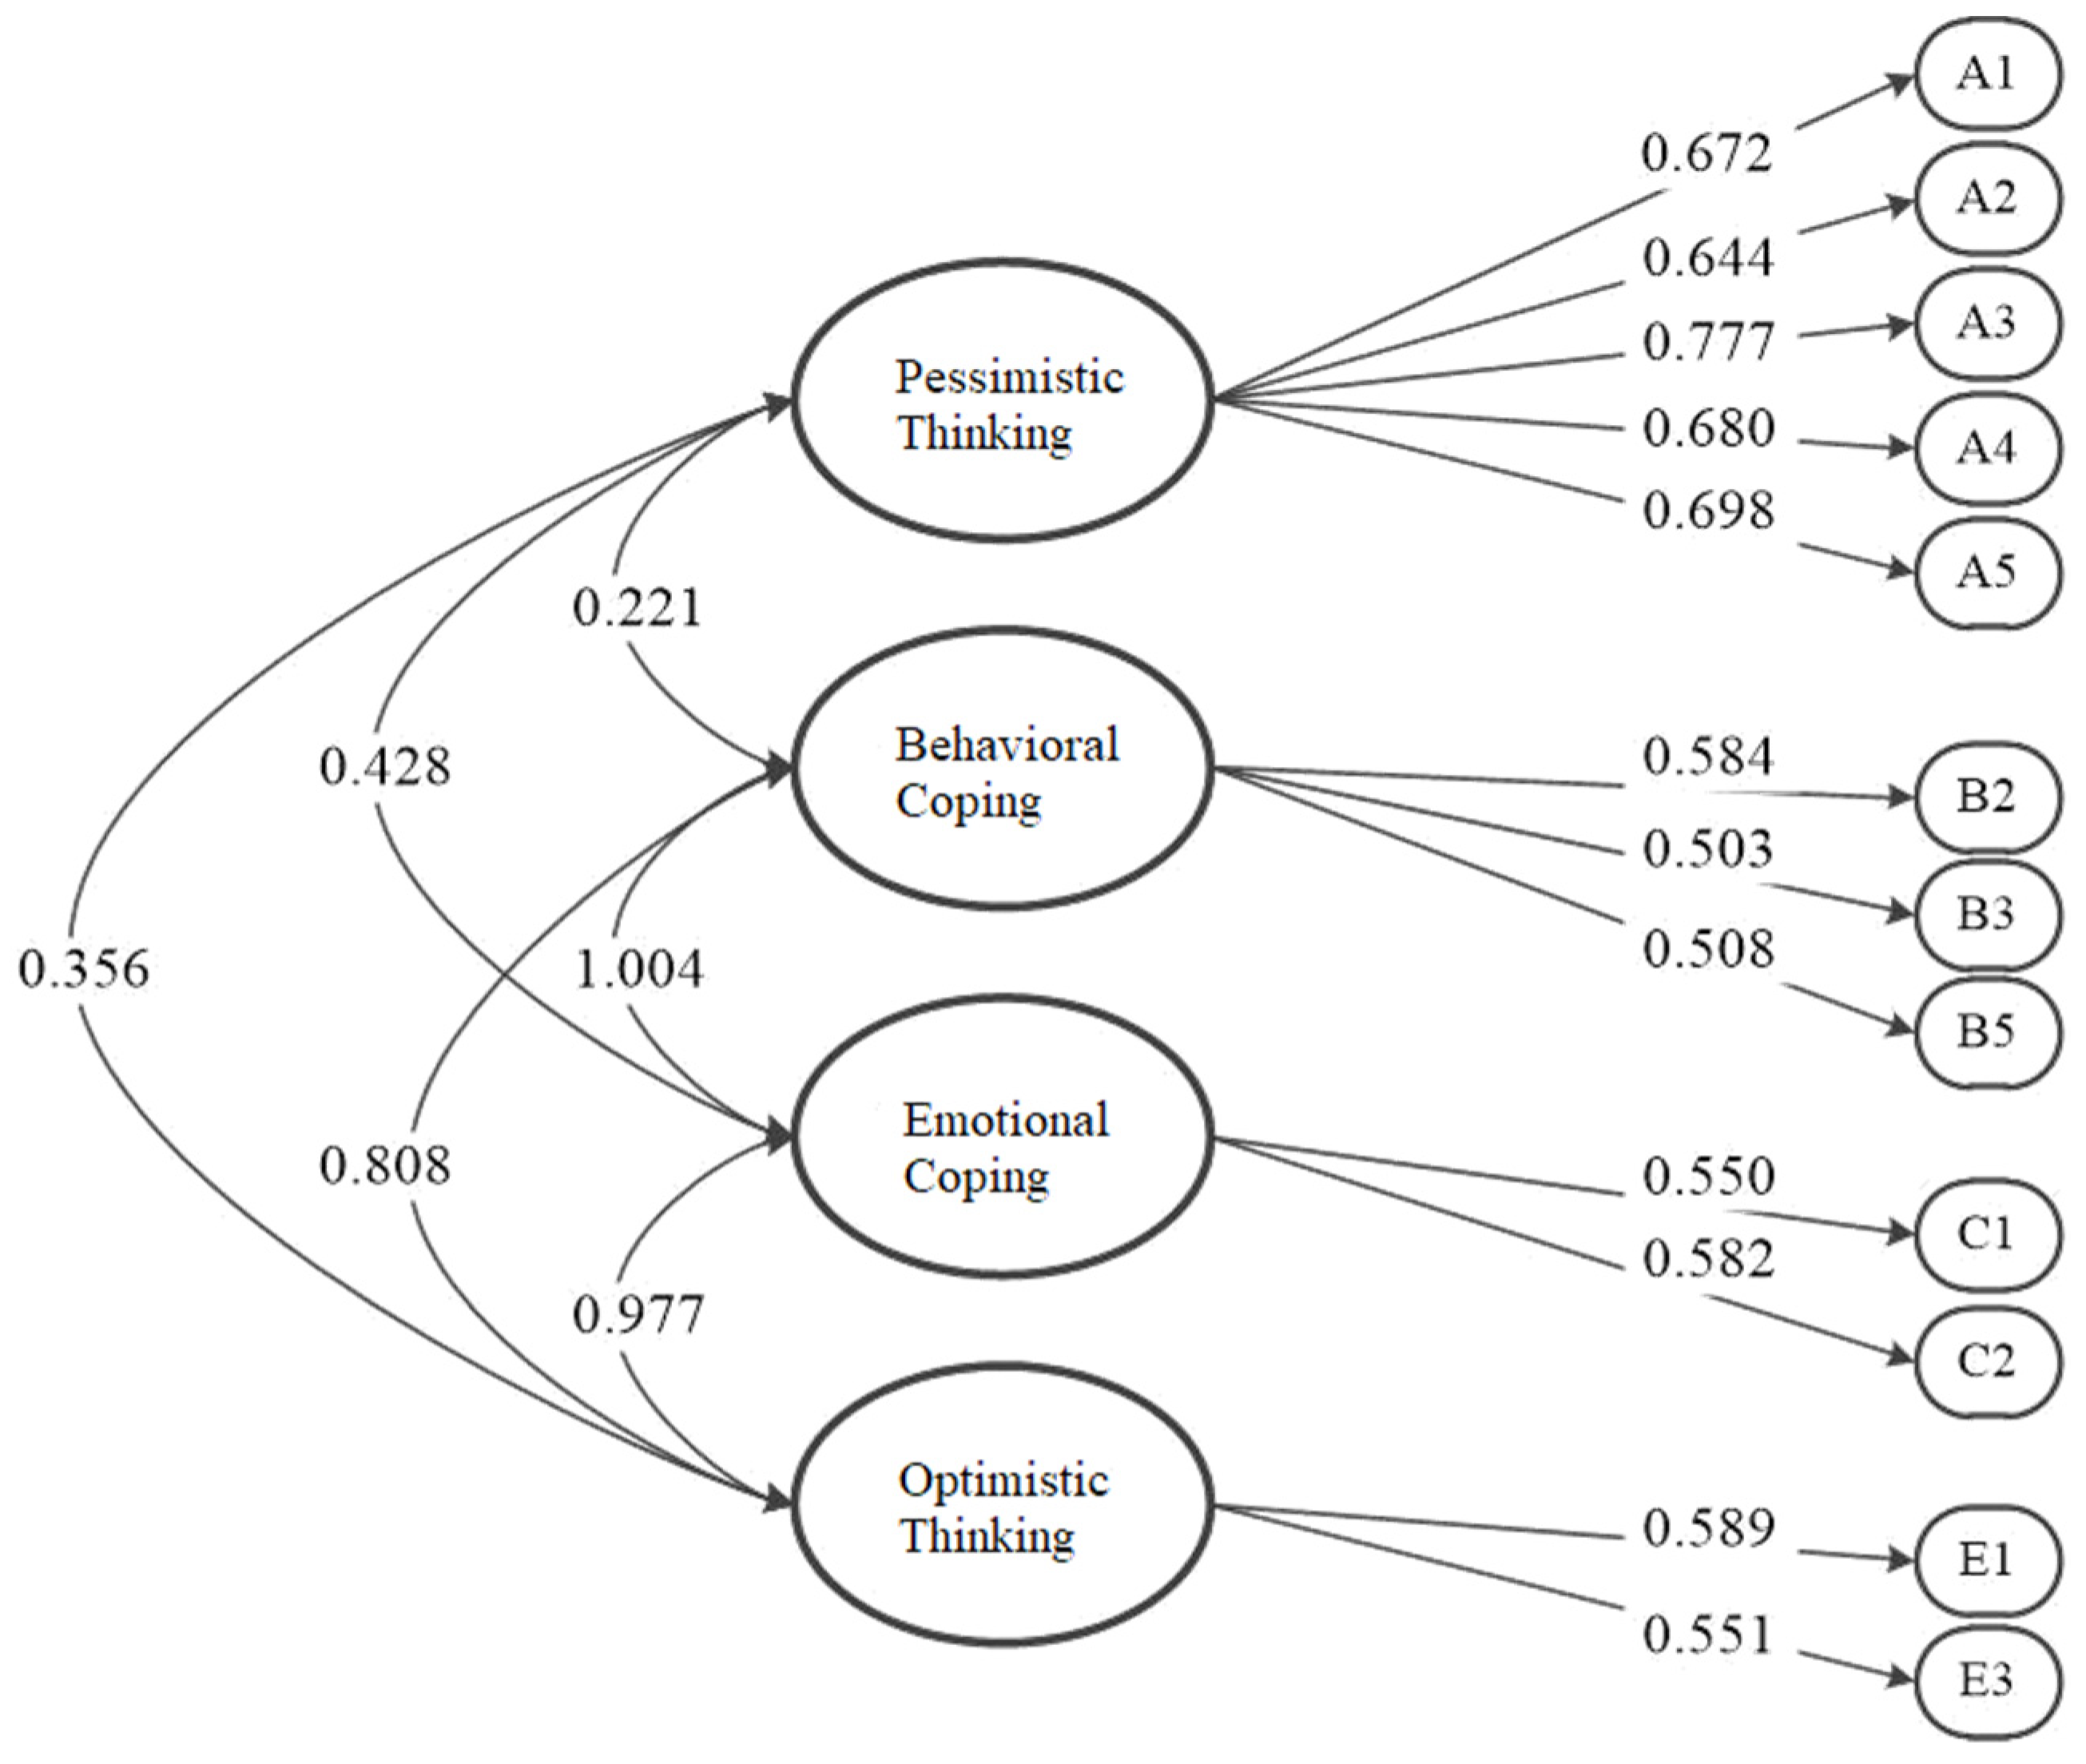
3.2.1. Confirmatory Factor Analysis

Based on the previous exploratory factor analysis, this study uses confirmatory factor analysis (CFA) to verify further the structural validity of the variables in the extensive sample data obtained by formal research. After the first confirmatory factor is completed, the factor load coefficient table (Table 7) and the confirmatory factor fitting results (Table 8) are obtained.
After confirmatory factor analysis, it is found that the load coefficient of several items is not up to standard (less than 0.5), and the validity analysis results also have room for improvement. After combining the content and context of the items, we delete the superstitious thinking dimension and the items D1 and D2 contained in it, and delete the items B1, B4, C3 and E2, and re-conduct the confirmatory factor analysis. The results are shown in Table 9 and Table 10. At this time, the GFI and CFI indexes reached the satisfactory level, and the χ2/df, NFI, TLI and RMSEA indexes reached the acceptable level.
After factor covariance analysis, the public’s ability to cope with public health emergencies and its factors all showed significantly (p ≤ 0.001), indicating that there was a specific correlation between each factor. Table 11 shows the relationship between factors and factors.
According to the estimated load coefficient of factor 10 and covariance of factor 11 in Table, the model is shown in Figure 2.

3.2.2. Reliability and Validity Analysis

The reliability analysis results of SPSS 22.0 software showed that the scale had 12 items and 514 samples, and the Cronbach ‘s α coefficient was 0.786, which was above 0.5, indicating that the scale was reliable.
After Pearson correlation analysis, Table 12 shows the discriminant validity of each dimension of the scale
According to Table 12, the square root value of AVE for each dimension is more significant than the maximum value of the absolute value of the correlation coefficient between the factors, implying that each dimension has good discriminant validity.
In conclusion, the official public health emergency response capacity scale in China includes four dimensions and 12 items. The four dimensions are Pessimistic Thinking, Behavioral Coping, Emotional Coping and Optimistic Thinking. For the formal scale, see Table A3 in Appendix A.

4. Discussion

4.1. Overview of the Leading Research Results

This study demonstrates the process of compiling and validating the scale of public health emergency response-ability, to obtain a measurement tool that can accurately measure the level of public health emergency response-ability. The final scale consists of four dimensions and 12 items. Its substructure is different from that of the Constructive Thinking Scale (CTI) compiled by Epstein and Meier [23], which may be caused by differences in research contents. Public health emergencies have their unique nature, which seriously threatens human health, causes huge economic losses, and even causes mass panic [25]. Measuring the ability to cope with public health emergencies is not only for the investigation and study of people’s physical or mental health, but also for the adjustment of coping measures to public health emergencies in the future. Therefore, the design of the scale dimensions and scale items integrated the characteristics of public health emergencies.
The 12-item coping capacity scale of public health emergencies was optimized based on the original 23-item coping capacity scale. The analysis results show that the coping ability scale verified the characteristics of public health emergencies. Adamantios, Marko, Christoph, Petra, and Sebastian [26] suggested that the highest factor loadings could be selected as an assessment metric for a single-item measure, with the 12 items retained all having high factor loadings. In addition, the number of items was significantly reduced compared to the scale of 23 items, making it less time-consuming for respondents to answer the questions and preventing them from becoming bored or tired to a greater extent. It can help emergency managers or other responders quickly access data on people’s ability to respond to public health emergencies so that further targeted measures can be taken.
CTI developed by Epstein and Meier [23] is applicable to measure the coping capacity of the general population in the face of all frustrating challenges, and fewer studies have been conducted for specific domains. Therefore, there is a need to revalidate the resilience scale and test its applicability in the realm of public health emergencies. The 12-item scale is more convenient and has the advantage of being more specific to the field of public health emergencies than other coping capacity scales. The Constructive Thinking Inventory (CTI) developed by Epstein and Meier [23] suggested that traditional measures of coping capacity tend to be one-dimensional, such as depressive sensitivity [27], and do not adequately reflect the richness and complexity of the actual assessment and response process. The 12-item public coping capacity scale developed in this paper is similar to the CTI. The 12-item, six-dimensional scale can well assess public coping capacity during public health emergencies without sacrificing the cognitive and behavioral richness of the process [28]. In conclusion, the 12-item scale developed and validated in this study provides a solid picture of the public’s ability to cope with the various challenges and obstructions that may arise in future public health emergencies.

4.2. Theoretical and Practical Significance

This study makes a valuable contribution to current research on health event prevention and control by developing and validating a robust, credible factor structure of the public response capacity to public health emergencies. Unlike previous measurement scales, the scale developed in this study is more appropriate for studying the field of public health emergencies. The scale contributes to the study of response capacity for outbreak prevention and control in the foreseeable future by providing a uniform measure. In addition, the developed and validated scale includes four dimensions: Pessimistic Thinking, Behavioral Coping, Emotional Coping, and Optimistic Thinking, and has high reliability and validity based on 12 question items. The results also indicate that coping competencies are essential for safety management practices during a pandemic, and the validated coping competency scale derived from this study can be used as a primary benchmarking tool between different sectors or firms, thus contributing to the overall safety of the society. The implementation of the coping capacity scale can also provide rich feedback to policymakers and managers to develop public health emergency coping capacity interventions along four dimensions.

4.3. Limitations and Future Research Prospects

Although this study has contributed to measuring coping capacity in the field of public health emergencies, future research is needed. This study did not refine the selection of the study population to refer to the public group in general, and future research needs to focus on specific occupational field groups and integrate the characteristics of their work to research coping capacity. In addition, a number of studies have concluded that there are gender differences in stress and coping with stress [29,30], so future studies will be supplemented with corresponding studies that take into account the impact of gender differences on the ability to cope with public health emergencies.
In addition, further validation of the scale should be addressed. The only internal consistency and discriminant values of the subscales were examined. However, neither test–retest reliability nor convergent validity (e.g., correlations with other stress and coping questionnaires) were addressed. Additionally, this study was conducted from June to July 2021, when the new COVID-19 pandemic in China was at a completely different stage. The stress levels and stressors changed dramatically during this phase compared to the beginning of the COVID-19 pandemic in 2020. Therefore, future studies can compare the stress levels and stressors faced by the public in different periods.
During the data analysis, we used factor validity to test the validity of the entire scale. Therefore, in future studies, scholars should continue to explore the above issues in a comprehensive, in-depth, and detailed manner to obtain measurement tools that are more suitable for studying the public’s ability to cope with public health emergencies and to explore further the factor structure of the public’s ability to cope with public health emergencies in a multidimensional and dynamic manner. In addition, an empirical study with a larger sample and demographic difference analysis can be conducted on the scale to validate its applicability further.

5. Conclusions

This study first builds a theoretical dimension of the public health emergency coping capability in China based on literature research. After the steps of compiling the first draft project, the preliminary trial of the scale, exploratory factor analysis, verification factor analysis and letter validity test, the scale dimension and question items are deleted and optimized, and the public health emergency coping capacity measurement scale has been developed. The scale includes a total of 12 question items and four dimensions. The four dimensions are Pessimistic Thinking, Behavioral Coping, Emotional Coping, and Optimistic Thinking. The scale has high reliability and validity, which helps relevant personnel to understand the level of public coping to public health emergencies, and to provide a basis for the timely and accurate adoption of targeted emergency prevention and control intervention measures for public health emergencies. However, the research sample size is not large enough and has certain limitations. Future research should expand the sample size and improve the selection of research subjects. Further research can be considered for specific groups, or expand the research scope to further explore the applicability of the scale.

Author Contributions

Conceptualization, X.W., A.Z. and H.Y.; methodology, A.Z. and J.G.; software, A.Z. and X.L.; validation, A.Z., J.G. and X.W.; formal analysis, A.Z.; investigation, A.Z. and J.G.; resources, X.W. and A.Z.; data curation, A.Z.; writing—original draft preparation, A.Z.; writing—review and editing, A.Z. and J.G.; visualization, A.Z.; supervision, X.W., H.Y. and X.L.; project administration, X.W.; funding acquisition, X.W. All authors have read and agreed to the published version of the manuscript.

Funding

This research was funded by the MOE (Ministry of Education in China) Project of Humanities and Social Sciences (18YJCZH191), and the Fundamental Research Funds for the Central Universities of China (2652019073).

Institutional Review Board Statement

Not applicable.

Informed Consent Statement

Not applicable.

Data Availability Statement

The data presented in this study are available in the Web of Science core database.

Conflicts of Interest

The authors declare no conflict of interest.

Appendix A

Table A1. Predictive test scale.
ContentNo.Question Item
Basic population informationQ1Gender
Q2Age
Q3Academic Level (including ongoing studies)
Coping capacity measurement scaleEmotional CopingQ4I do not let little things bother me.
Q5I tend to take things personally.
Behavioral CopingQ6I am the kind of person who takes action rather than just thinks or complains about the situation.
Q7I avoid challenges because it hurts too much when I fail.
Q8When faced with upcoming unpleasant events, I usually carefully think through how I will deal with them.
Categorical ThinkingQ9I think there are many wrong ways, but only one right way, to almost anything.
Q10I tend to classify people as either for me or against me.
Superstitious ThinkingQ11I do not believe in any superstition.
Q12When something happens to me, I believe it is likely to be balanced by something bad.
Negative ThinkingQ15When I am faced a new situation, I tend to think the worst possible outcome will happen.
Q16I tend to dwell more on pleasant than unpleasant incidents from the past.
Q17I get so distressed when I notice that I am doing poorly in something that makes me do worse.
Naive OptimismQ13If I do well on an important test, I feel like a total success.
Q14I believe that people can accomplish anything they want to if they have enough willpower.
Disease PreventionQ18I will often pay attention to the dynamics of public health emergencies, and if there are signs of an epidemic, I will take precautions.
Q19I only believe in the information released by the official (government, relevant medical institutions).
Q20I would expect the possible consequences of a public health emergency.
Q21I will respond after the disaster news in the media.
Q22I have the habit of washing hands with soap or hand sanitizer.
Q23I have the habit of avoiding touching my eyes and nose as much as possible in public.
Q24I am in ill health, and I will choose to seek medical treatment as soon as possible.
Q25I am very concerned about the independent use of personal items like towels, toiletries, etc.
Q26I have the habit of deliberately avoiding crowded places.
Table A2. Initial scale dimensions and question items.
DimensionNo.Question Item
Pessimistic ThinkingQ10I tend to classify people as either for me or against me.
Q9I think there are many wrong ways, but only one right way, to almost anything.
Q12When something happens to me, I believe it is likely to be balanced by something bad.
Q7I avoid challenges because it hurts too much when I fail.
Q15When I am faced a new situation, I tend to think the worst possible outcome will happen.
Behavioral CopingQ26I have the habit of deliberately avoiding crowded places.
Q18I will often pay attention to the dynamics of public health emergencies, and if there are signs of an epidemic, I will take precautions.
Q19I only believe in the information released by the official (government, relevant medical institutions).
Q22I have the habit of washing hands with soap or hand sanitizer.
Q23I have the habit of avoiding touching my eyes and nose as much as possible in public.
Emotional CopingQ8When faced with upcoming unpleasant events, I usually carefully think through how I will deal with them.
Q20I would expect the possible consequences of a public health emergency.
Q25I am very concerned about the independent use of personal items like towels, toiletries, etc.
Superstition ThinkingQ11I do not believe in any superstition.
Q21I will respond after the disaster news in the media.
Optimistic ThinkingQ13If I do well on an important test, I feel like a total success.
Q16I tend to dwell more on pleasant than unpleasant incidents from the past.
Q14I believe that people can accomplish anything they want to if they have enough willpower.
Table A3. Formal scale of public coping capacity to public health emergencies.
DimensionNo.Question Item
Pessimistic ThinkingA1I tend to classify people as either for me or against me.
A2I think there are many wrong ways, but only one right way, to almost anything.
A3When something happens to me, I believe it is likely to be balanced by something bad.
A4I avoid challenges because it hurts too much when I fail.
A5When I am faced a new situation, I tend to think the worst possible outcome will happen.
Behavioral CopingB1I will often pay attention to the dynamics of public health emergencies, and if there are signs of an epidemic, I will take precautions.
B2I only believe in the information released by the official (government, relevant medical institutions).
B3I have the habit of avoiding touching my eyes and nose as much as possible in public.
Emotional CopingC1When faced with upcoming unpleasant events, I usually carefully think through how I will deal with them.
C2I would expect the possible consequences of a public health emergency.
Optimistic ThinkingD1If I do well on an important test, I feel like a total success.
D2I believe that people can accomplish anything they want to if they have enough willpower.

References

  1. Epstein, S.; Katz, L. Coping ability, stress, productive load, and symptoms. J. Personal. Soc. Psychol. 1992, 62, 813–825. [Google Scholar] [CrossRef]
  2. Myburgh, C.P.; Niehaus, L.; Poggenpoel, M. School and nursing service managers’ ability to hold their own amidst daily demands. Curationis 1999, 22, 36–45. [Google Scholar]
  3. Nicholls, A.R.; Levy, A.R.; Carson, F.; Thompson, M.A.; Perry, J.L. The applicability of self-regulation theories in sport: Goal adjustment capacities, stress appraisals, coping, and well-being among athletes. Psychol. Sport Exerc. 2016, 27, 47–55. [Google Scholar] [CrossRef]
  4. Ožura, A.; Šega, S. Profile of depression, experienced distress and capacity for coping with stress in multiple sclerosis patients—A different perspective. Clin. Neurol. Neurosurg. 2013, 115 (Suppl. 1), S12–S16. [Google Scholar] [CrossRef]
  5. Bode, C.; De Ridder, D.T.D.; Kuijer, R.G.; Bensing, J.M. Effects of an Intervention Promoting Proactive Coping Competencies in Middle and Late Adulthood. Gerontologist 2007, 47, 42–51. [Google Scholar] [CrossRef]
  6. Chisty, M.A.; Rahman, M. Coping capacity assessment of urban fire disaster: An exploratory study on ward no: 30 of Old Dhaka area. Int. J. Disaster Risk Reduct. 2020, 51, 101878. [Google Scholar] [CrossRef]
  7. Saldaña-Zorrilla, S.O. Stakeholders’ views in reducing rural vulnerability to natural disasters in Southern Mexico: Hazard exposure and coping and adaptive capacity. Glob. Environ. Chang. 2008, 18, 583–597. [Google Scholar] [CrossRef]
  8. Hogan, R.; Orr, F.; Fox, D.; Cummins, A.; Foureur, M. Developing nursing and midwifery students’ capacity for coping with bullying and aggression in clinical settings: Students’ evaluation of a learning resource. Nurse Educ. Pr. 2018, 29, 89–94. [Google Scholar] [CrossRef]
  9. McCarthy, K.M.; Tempia, S.; Kufa, T.; Kleynhans, J.; Wolter, N.; Jassat, W.; Ebonwu, J.; von Gottberg, A.; Erasmus, L.; Muchengeti, M.; et al. The importation and establishment of community transmission of SARS-CoV-2 during the first eight weeks of the South African COVID-19 epidemic. E. Clin. Med. 2021, 39, 101072. [Google Scholar]
  10. Rana, I.A.; Bhatti, S.S.; Aslam, A.B.; Jamshed, A.; Ahmad, J.; Shah, A.A. COVID-19 risk perception and coping mechanisms: Does gender make a difference? Int. J. Disaster Risk Reduct. 2021, 55, 102096. [Google Scholar] [CrossRef] [PubMed]
  11. Yin, J.; Ni, Y. COVID-19 event strength, psychological safety, and avoidance coping behaviors for employees in the tourism industry. J. Hosp. Tour. Manag. 2021, 47, 431–442. [Google Scholar] [CrossRef]
  12. Chen, X.; Zou, Y.; Gao, H. Role of neighborhood social support in stress coping and psychological wellbeing during the COVID-19 pandemic: Evidence from Hubei, China. Heal. Place 2021, 69, 102532. [Google Scholar] [CrossRef] [PubMed]
  13. Her, M. Repurposing and reshaping of hospitals during the COVID-19 outbreak in South Korea. One Health 2020, 10, 100137. [Google Scholar] [CrossRef] [PubMed]
  14. Zhao, S.; Yin, P.; Xiao, L.D.; Wu, S.; Li, M.; Yang, X.; Zhang, D.; Liao, L.; Feng, H. Nursing home staff perceptions of challenges and coping strategies during COVID-19 pandemic in China. Geriatr. Nurs. 2021, 42, 887–893. [Google Scholar] [CrossRef]
  15. Porcher, S.; Renault, T. Social distancing beliefs and human mobility: Evidence from Twitter. PLoS ONE 2021, 16, e0246949. [Google Scholar] [CrossRef] [PubMed]
  16. Brodeur, A.; Clark, A.E.; Fleche, S.; Powdthavee, N. COVID-19, lockdowns and well-being: Evidence from Google Trends. J. Public Econ. 2021, 193, 104346. [Google Scholar] [CrossRef]
  17. Ito, M.; Seo, E.; Maeno, T.; Ogawa, R.; Maeno, T. Relationship Between Depression and Stress Coping Ability Among Residents in Japan: A Two-Year Longitudinal Study. J. Clin. Med. Res. 2018, 10, 715–721. [Google Scholar] [CrossRef] [Green Version]
  18. Chinaveh, M. The Examination of Reliability and Validity of Coping Responses Inventory Among Iranian Students. Procedia—Soc. Behav. Sci. 2013, 84, 607–614. [Google Scholar] [CrossRef] [Green Version]
  19. Wang, T.; Yang, L.; Wu, S.; Gao, J.; Wei, B. Quantitative Assessment of Natural Disaster Coping Capacity: An Application for Typhoons. Sustainability 2020, 12, 5949. [Google Scholar] [CrossRef]
  20. Walkling, B.; Haworth, B.T. Flood risk perceptions and coping capacities among the retired population, with implications for risk communication: A study of residents in a north Wales coastal town, UK. Int. J. Disaster Risk Reduct. 2020, 51, 101793. [Google Scholar] [CrossRef]
  21. An, B.Y.; Tang, S.-Y. Lessons From COVID-19 Responses in East Asia: Institutional Infrastructure and Enduring Policy Instruments. Am. Rev. Public Adm. 2020, 50, 027507402094370. [Google Scholar] [CrossRef]
  22. DeVellis, R.F.; Thorpe, C.T. Scale Development: Theory and Applications; Sage: Newbury Park, CA, USA, 1991; p. 121. [Google Scholar]
  23. Epstein, S.; Meier, P. Constructive thinking: A broad coping variable with specific components. J. Personal. Soc. Psychol. 1989, 57, 332–350. [Google Scholar] [CrossRef]
  24. Tran, B.X.; Nguyen, H.T.; Pham, H.Q.; Le, H.T.; Vu, G.T.; Latkin, C.A.; Ho, C.S.; Ho, R.C. Capacity of local authority and community on epidemic response in Vietnam: Implication for COVID-19 preparedness. Saf. Sci. 2020, 130, 104867. [Google Scholar] [CrossRef] [PubMed]
  25. Shen, Z.; Zhong, Z.; Xie, J.; Ding, S.; Li, S.; Li, C. Development and psychometric assessment of the public health emergency risk perception scale: Under the outbreak of COVID-19. Int. J. Nurs. Sci. 2020, 8, 87–94. [Google Scholar] [CrossRef]
  26. Diamantopoulos, A.; Sarstedt, M.; Fuchs, C.; Wilczynski, P.; Kaiser, S. Guidelines for choosing between multi-item and single-item scales for construct measurement: A predictive validity perspective. J. Acad. Mark. Sci. 2012, 40, 434–449. [Google Scholar] [CrossRef] [Green Version]
  27. Byrne, D. The repression-sensitization scale: Rationale, reliability, and validity1. J. Pers. 1961, 29, 334–349. [Google Scholar] [CrossRef]
  28. Folkman, S.; Lazarus, R.S. Reply to Shinn and Krantz. J. Heal. Soc. Behav. 1981, 22, 457. [Google Scholar] [CrossRef]
  29. Mirkovic, B.; Belloncle, V.; Pellerin, H.; Guilé, J.-M.; Gérardin, P. Gender Differences Related to Spirituality, Coping Skills and Risk Factors of Suicide Attempt: A Cross-Sectional Study of French Adolescent Inpatients. Front. Psychiatry 2021, 12, 1027. [Google Scholar] [CrossRef]
  30. Nicholls, A.R.; Polman, R.; Levy, A.; Taylor, J.; Cobley, S. Stressors, coping, and coping effectiveness: Gender, type of sport, and skill differences. J. Sports Sci. 2007, 25, 1521–1530. [Google Scholar] [CrossRef]
Figure 1. Gravel plot from exploratory factor analysis.
Ijerph 19 00094 g001
Figure 2. CFA Model Diagram.
Ijerph 19 00094 g002
Table 1. Demographic data analysis of the initial scale measurements.
Statistical ContentSample ClassificationNumberPercentage (%)Accumulative Percentage (%)
GenderMale7143.8343.83
Female9156.17100.00
AgeUnder 1821.231.23
18~257948.7750.00
26~302917.9067.90
31~402414.8182.71
41~50169.8892.59
51~60116.7999.38
Over 6010.62100.00
Degree levelJunior high school or below63.703.70
High school2917.9021.60
Undergraduate7345.0666.66
Master5131.4898.14
Dr31.85100.00
Table 2. Results of the KMO and Bartlett spherical tests.
KMO0.779
Bartlett spherical testApproximate chi-square956.916
df153
Sig.0.000
Table 3. Variance explained rate.
Factor NumberCharacteristic RootVariance Explained RateVariance Explained Rate after Rotation
CRVER
(%)
VERAR
(%)
CRVER
(%)
VERAR
(%)
CRVER
(%)
VERAR (%)
14.750 26.391 26.391 4.750 26.391 26.391 2.856 15.868 15.868
22.736 15.202 41.593 2.736 15.202 41.593 2.763 15.348 31.216
31.295 7.197 48.789 1.295 7.197 48.789 1.945 10.804 42.019
41.177 6.539 55.328 1.177 6.539 55.328 1.772 9.845 51.864
51.055 5.860 61.188 1.055 5.860 61.188 1.678 9.324 61.188
60.939 5.215 66.403 ------
70.865 4.805 71.208 ------
80.806 4.477 75.685 ------
90.733 4.069 79.755 ------
100.612 3.398 83.153 ------
110.525 2.917 86.070 ------
120.498 2.766 88.836 ------
130.436 2.422 91.258 ------
140.381 2.115 93.373 ------
150.349 1.937 95.311 ------
160.320 1.778 97.089 ------
170.289 1.608 98.697 ------
180.235 1.303 100.000 ------
Table 4. Factor load coefficient after rotation.
ItemFactor Load CoefficientCommon Degree
Factor 1Factor 2Factor 3Factor 4Factor 5
Q100.791 0.674
Q90.728 0.590
Q120.702 0.675
Q70.692 0.571
Q150.689 0.637
Q26 0.749 0.683
Q18 0.718 0.691
Q19 0.703 0.557
Q22 0.579 0.554
Q23 0.538 0.572
Q8 0.727 0.602
Q20 0.581 0.659
Q25 0.533 0.562
Q11 0.779 0.640
Q21 0.620 0.655
Q13 0.729 0.600
Q16 0.687 0.660
Q14 0.542 0.432
Note: If there are numbers in the table, the absolute value of the factor load coefficient is more significant than 0.5.
Table 5. Brief table of Cronbach reliability analysis.
Sample SizeCronbach’αCronbach’α Based on the Standardization ProjectItem Number
1620.8170.82118
Table 6. Demographic data analysis of the scale measurements.
Statistical ContentSample ClassificationNumberPercentage (%)Accumulative Percentage (%)
GenderMale23341.9841.98
Female32258.02100.00
AgeUnder 1871.261.26
18~2516730.0931.35
26~3017431.3562.70
31~4015227.3990.09
41~50315.5995.68
51~60203.6099.28
Over 6040.72100.00
Degree levelJunior high school or below122.162.16
High school5710.2712.43
Undergraduate38869.9182.34
Master8815.8698.20
Dr101.80100.00
Table 7. Table of factor loading coefficient.
Factor
(Subvariable)
No.Measurement Item (Dominant Variable)Coef.Std. Errorz pStd. Estimate
Pessimistic ThinkingA1I tend to classify people as either for me or against me.1.000---0.666
A2I think there are many wrong ways, but only one right way, to almost anything.1.0510.08612.1720.0000.640
A3When something happens to me, I believe it is likely to be balanced by something bad.1.3050.09314.0350.0000.776
A4I avoid challenges because it hurts too much when I fail.1.0920.08512.9100.0000.689
A5When I am faced a new situation, I tend to think the worst possible outcome will happen.1.1580.08813.0860.0000.701
Behavioral CopingB1I have the habit of deliberately avoiding crowded places.1.000---0.309
B2I will often pay attention to the dynamics of public health emergencies, and if there are signs of an epidemic, I will take precautions.1.5140.2526.0080.0000.547
B3I only believe in the information released by the official (government, relevant medical institutions).1.3870.2345.9360.0000.524
B4I have the habit of washing hands with soap or hand sanitizer.1.4130.2455.7610.0000.477
B5I have the habit of avoiding touching my eyes and nose as much as possible in public.1.6170.2705.9900.0000.541
Emotional CopingC1When faced with upcoming unpleasant events, I usually carefully think through how I will deal with them.1.000---0.568
C2I would expect the possible consequences of a public health emergency.0.9970.1009.9390.0000.540
C3I am very concerned about the independent use of personal items like towels, toiletries, etc.0.8280.0909.1980.0000.488
Superstition ThinkingD1I do not believe in any superstition.1.000---0.473
D2I will respond after the disaster news in the media.1.0970.1219.1030.0000.642
Optimistic ThinkingE1If I do well on an important test, I feel like a total success.1.000---0.569
E2I tend to dwell more on pleasant than unpleasant incidents from the past.0.7210.1017.1120.0000.417
E3I believe that people can accomplish anything they want to if they have enough willpower.1.0230.1148.9650.0000.584
Table 8. The fitted results for CFA.
Indicators of Fittingχ2/dfGFINFICFITLIRMSEA
The fit value3.5860.9120.8180.8600.8290.071
Standard valueSatisfied<5>0.90>0.90>0.90>0.90<0.05
Acceptable3~50.85~0.900.80~0.900.80~0.900.80~0.900.05~0.08
Insufficient>5<0.85<0.80<0.80<0.80>0.10
Table 9. Table of factor loading coefficient.
Factor
(Subvariable)
No.Measurement Item (Dominant Variable)Coef.Std. Errorz pStd. Estimate
Pessimistic ThinkingA1I tend to classify people as either for me or against me.1.000 ---0.672
A2I think there are many wrong ways, but only one right way, to almost anything.1.048 0.085 12.322 0.000 0.644
A3When something happens to me, I believe it is likely to be balanced by something bad.1.295 0.091 14.178 0.000 0.777
A4I avoid challenges because it hurts too much when I fail.1.067 0.083 12.877 0.000 0.680
A5When I am faced a new situation, I tend to think the worst possible outcome will happen.1.142 0.087 13.148 0.000 0.698
Behavioral CopingB2I will often pay attention to the dynamics of public health emergencies, and if there are signs of an epidemic, I will take precautions.1.000 ---0.584
B3I only believe in the information released by the official (government, relevant medical institutions).0.824 0.102 8.090 0.000 0.503
B5I have the habit of avoiding touching my eyes and nose as much as possible in public.0.938 0.115 8.136 0.000 0.508
Emotional CopingC1When faced with upcoming unpleasant events, I usually carefully think through how I will deal with them.1.000 ---0.550
C2I would expect the possible consequences of a public health emergency.1.111 0.116 9.606 0.000 0.582
Optimistic ThinkingE1If I do well on an important test, I feel like a total success.1.000 ---0.589
E3I believe that people can accomplish anything they want to if they have enough willpower.0.931 0.112 8.343 0.000 0.551
Table 10. The fitted results for CFA.
Indicators of Fittingχ2/dfGFINFICFITLIRMSEA
The fit value3.9780.9400.8800.9070.8710.076
Standard valueSatisfied<5>0.90>0.90>0.90>0.90<0.05
Acceptable3~50.85~0.900.80~0.900.80~0.900.80~0.900.05~0.08
Insufficient>5<0.85<0.80<0.80<0.80>0.10
Table 11. The Factor covariance table.
FactorFactorCoef.Std.ErrorzpStd.Estimate
Behavioral CopingPessimistic Thinking0.163 0.030 5.418 0.000 0.428
Behavioral CopingEmotional Coping0.150 0.032 4.710 0.000 0.356
Behavioral CopingOptimistic Thinking0.093 0.029 3.235 0.001 0.221
Emotional CopingPessimistic Thinking0.278 0.035 7.931 0.000 1.004
Emotional CopingOptimistic Thinking0.247 0.034 7.169 0.000 0.808
Optimistic ThinkingPessimistic Thinking0.269 0.035 7.768 0.000 0.977
Table 12. Discriminant validity: Pearson correlation and AVE square root value.
Pessimistic ThinkingBehavioral CopingEmotional CopingOptimistic Thinking
Pessimistic Thinking0.698
Behavioral Coping0.163 0.532
Emotional Coping0.269 0.520 0.567
Optimistic Thinking0.234 0.428 0.476 0.570
Note: The number on the diagonal is the AVE square root value.
Publisher’s Note: MDPI stays neutral with regard to jurisdictional claims in published maps and institutional affiliations.

