Author Contributions
Conceptualization, I.R. and G.O.; Methodology, I.R., A.I., M.Z., A.C. and G.O.; software, I.R.; formal analysis, I.R. and G.O.; resources, A.I. and A.C.; data curation, A.I. and A.C.; writing—original draft preparation, I.R. and G.O.; writing—review and editing, A.I. and A.C.; supervision, M.Z., A.C. and G.O. All authors have read and agreed to the published version of the manuscript.
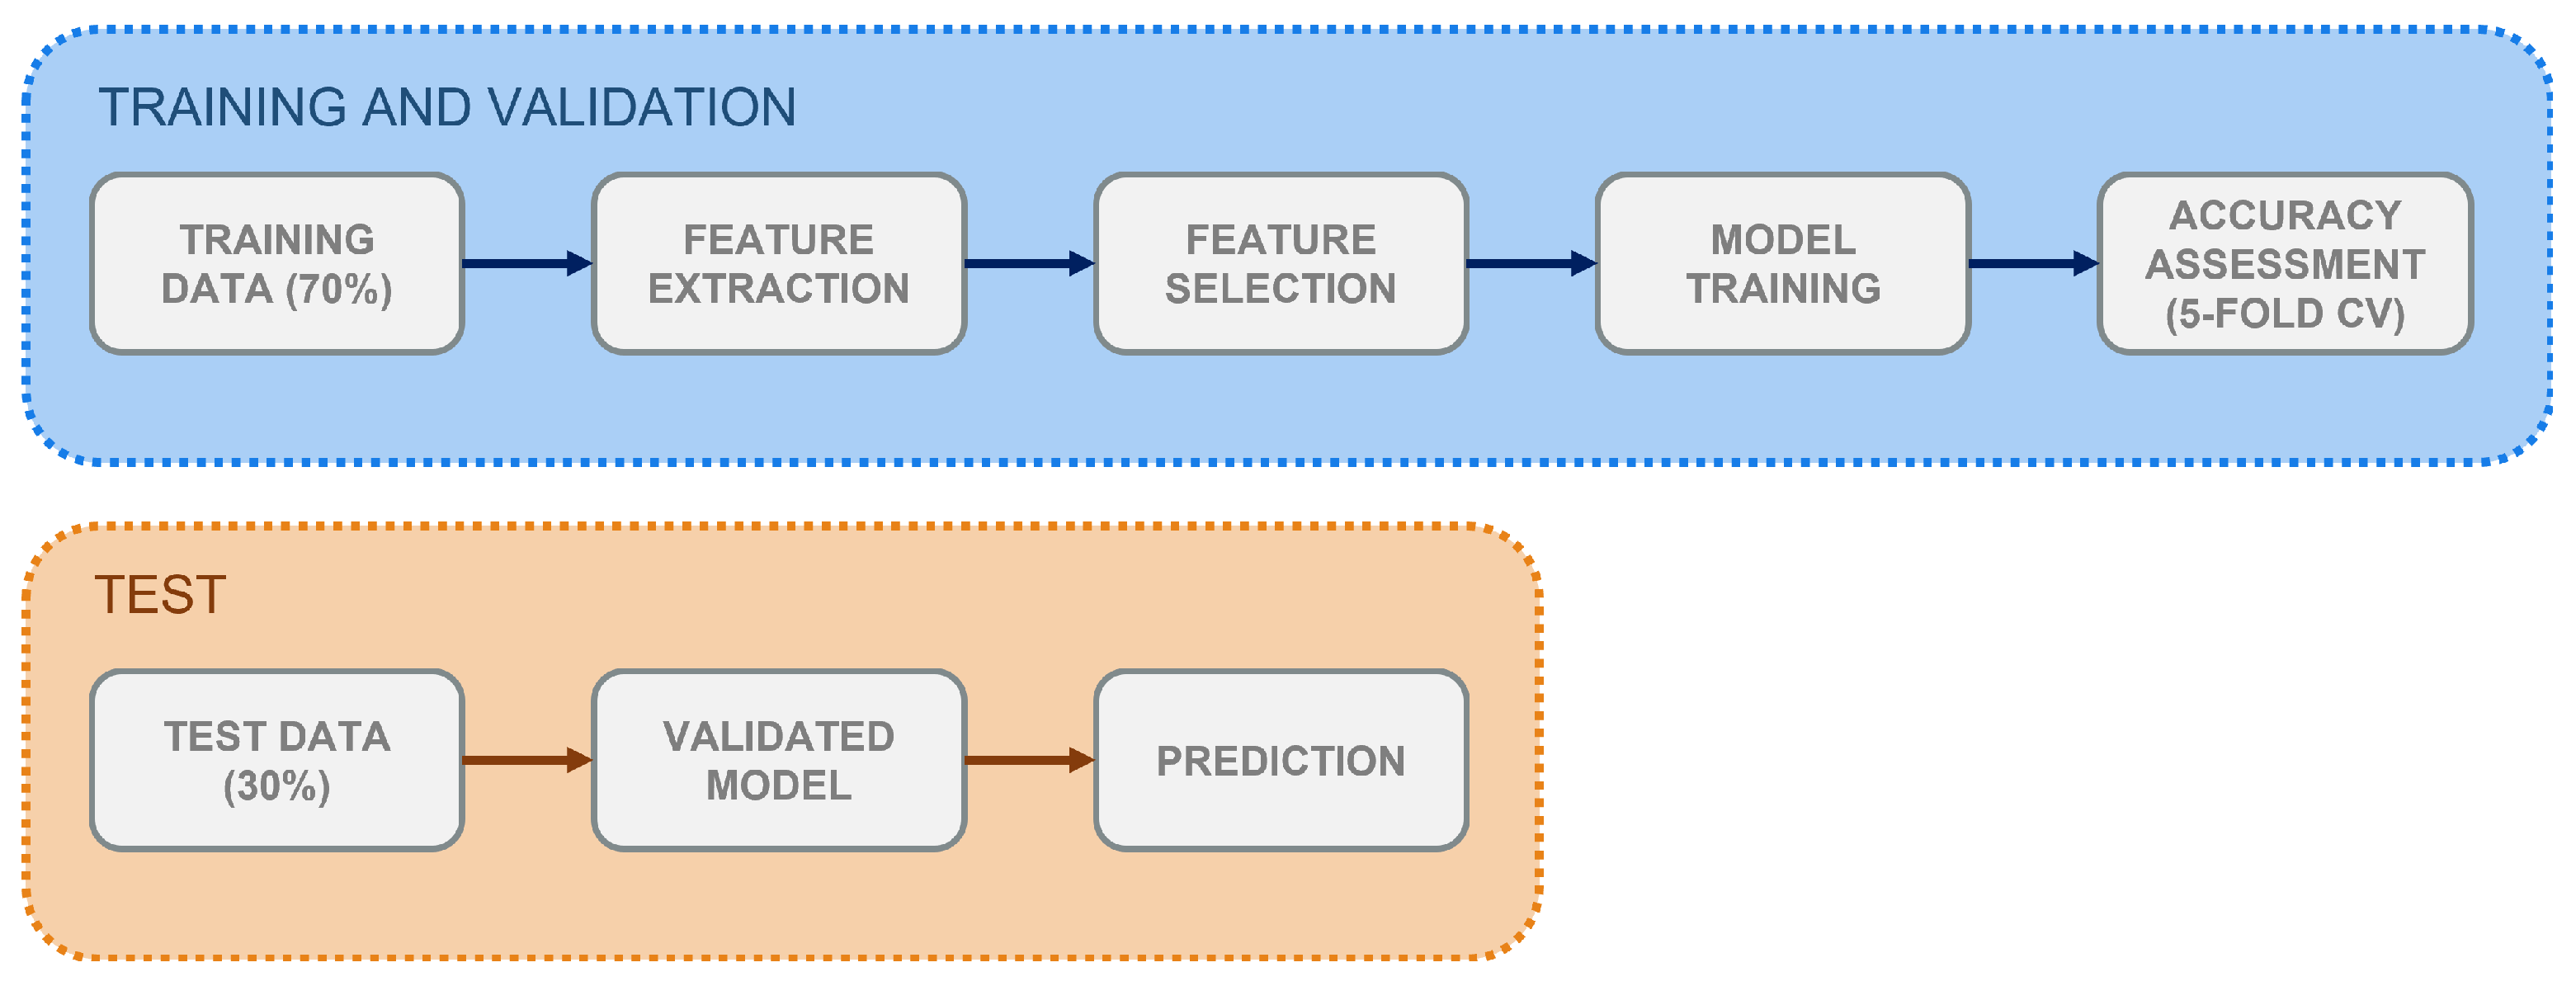
Figure 1.
Workflow for the supervised classification process implemented in the study. Training and validation, test-set classification.
Figure 1.
Workflow for the supervised classification process implemented in the study. Training and validation, test-set classification.
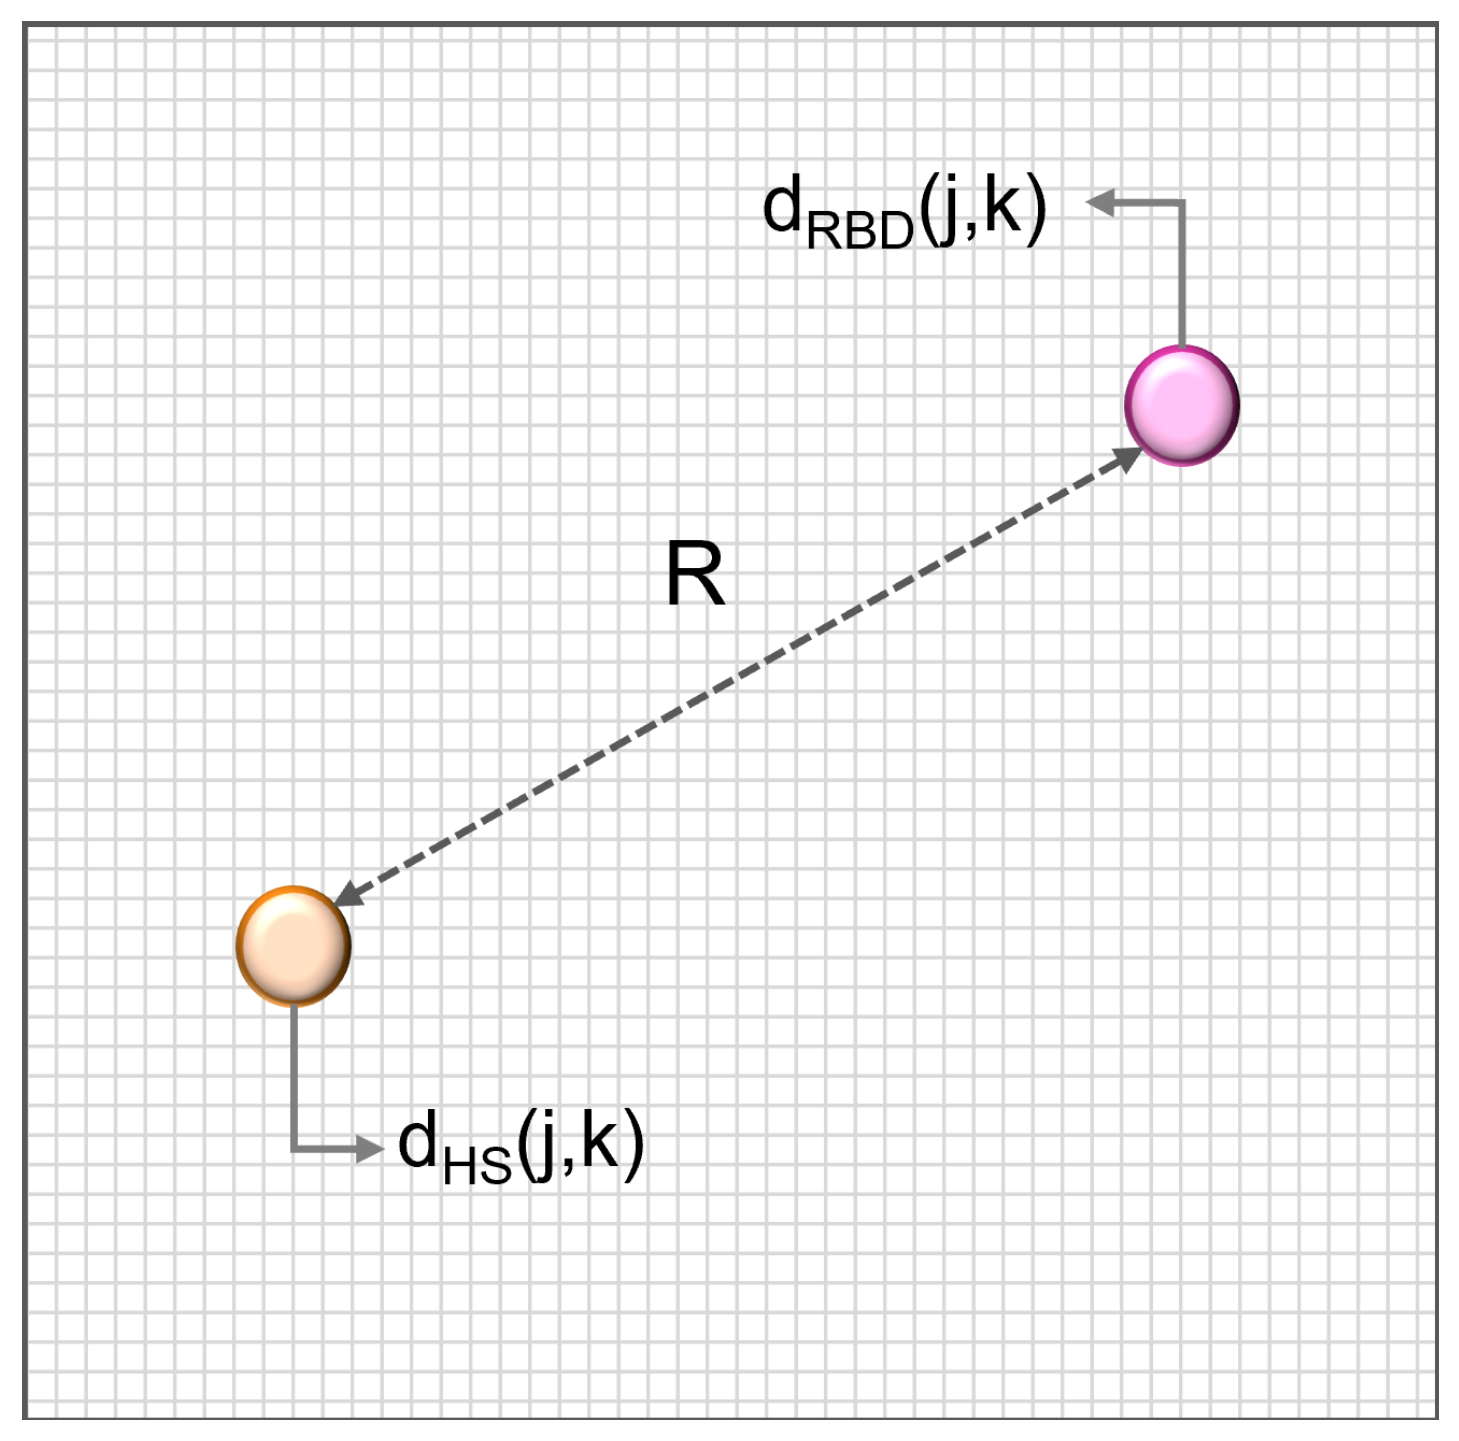
Figure 2.
Neighbourhood R computation. It is the Euclidean Distance between two points in space, representative of the healthy subject (HS, orange) and RBD groups (purple) respectively.
Figure 2.
Neighbourhood R computation. It is the Euclidean Distance between two points in space, representative of the healthy subject (HS, orange) and RBD groups (purple) respectively.
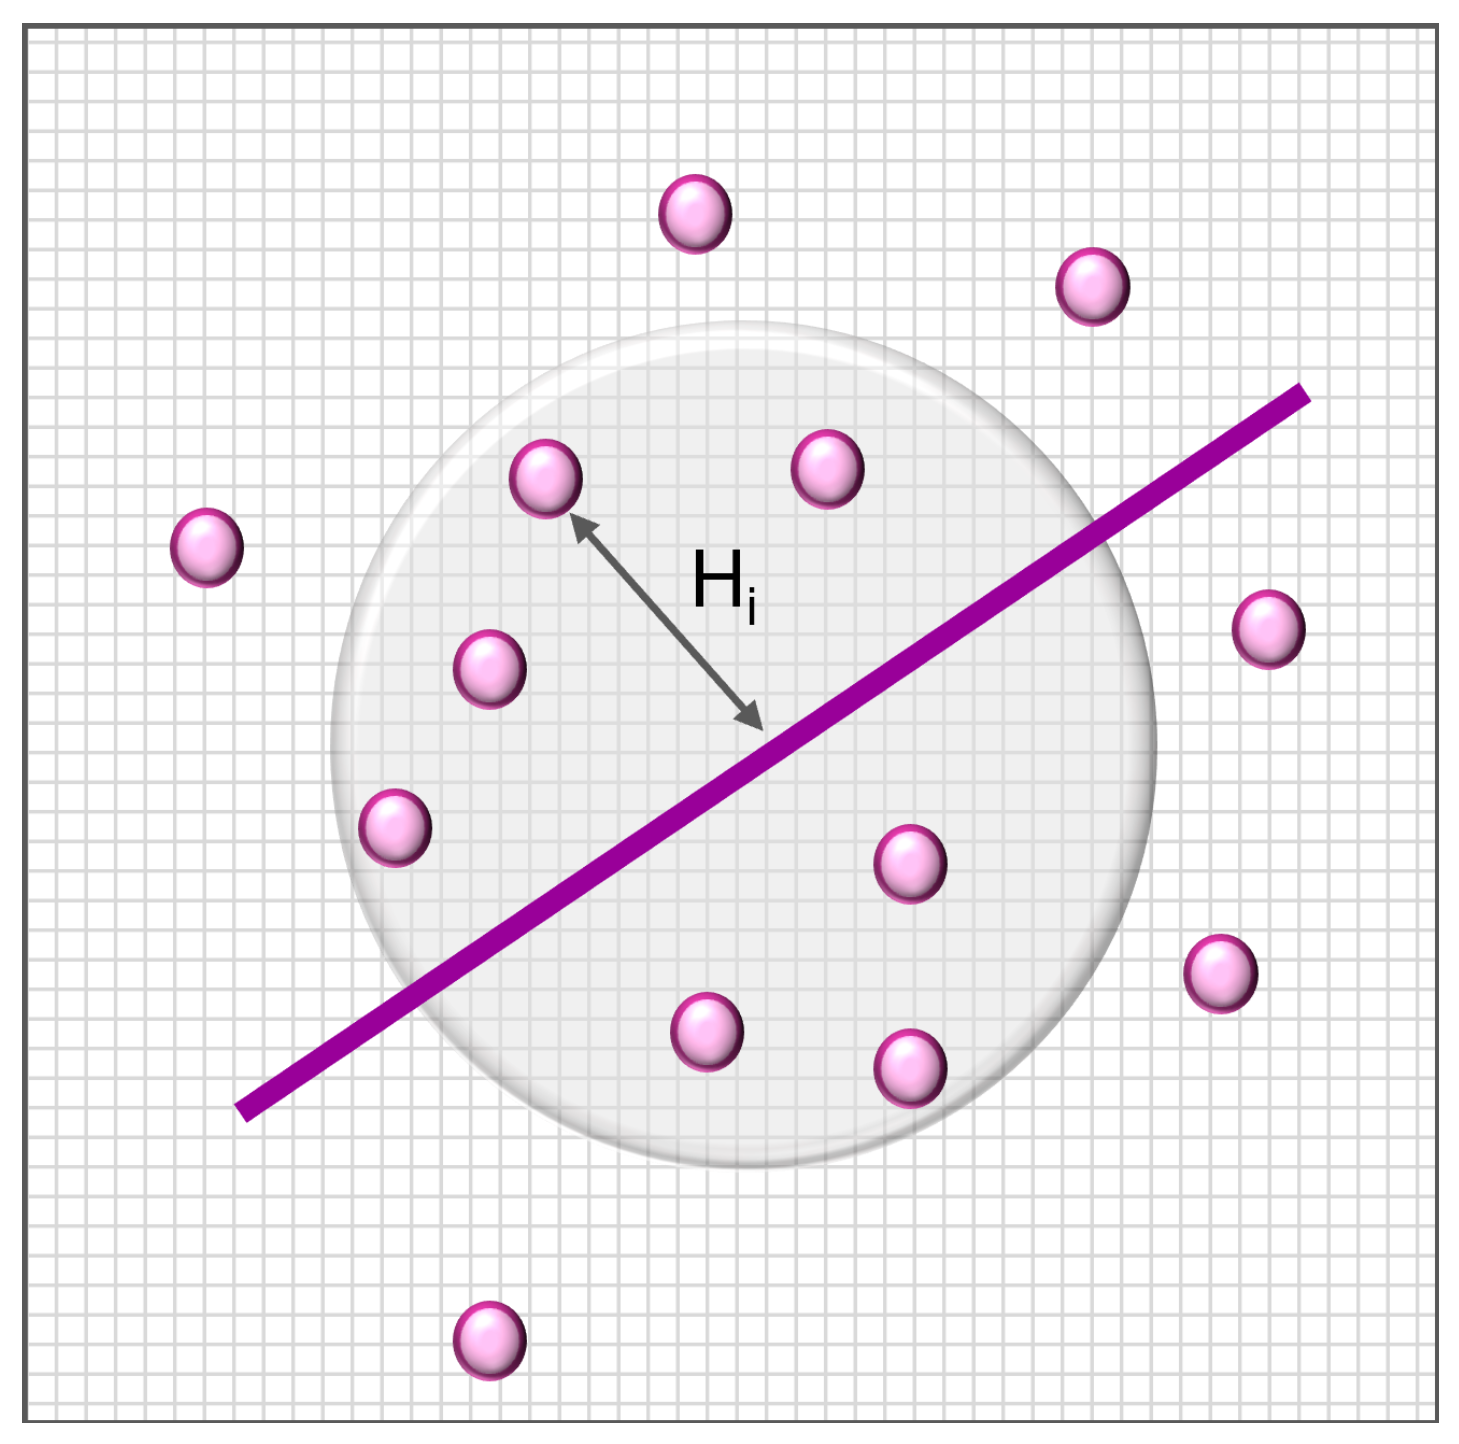
Figure 3.
Proposed framework for assessing similarity. H is the euclidean distance between the i-th subject and the chosen reference.
Figure 3.
Proposed framework for assessing similarity. H is the euclidean distance between the i-th subject and the chosen reference.
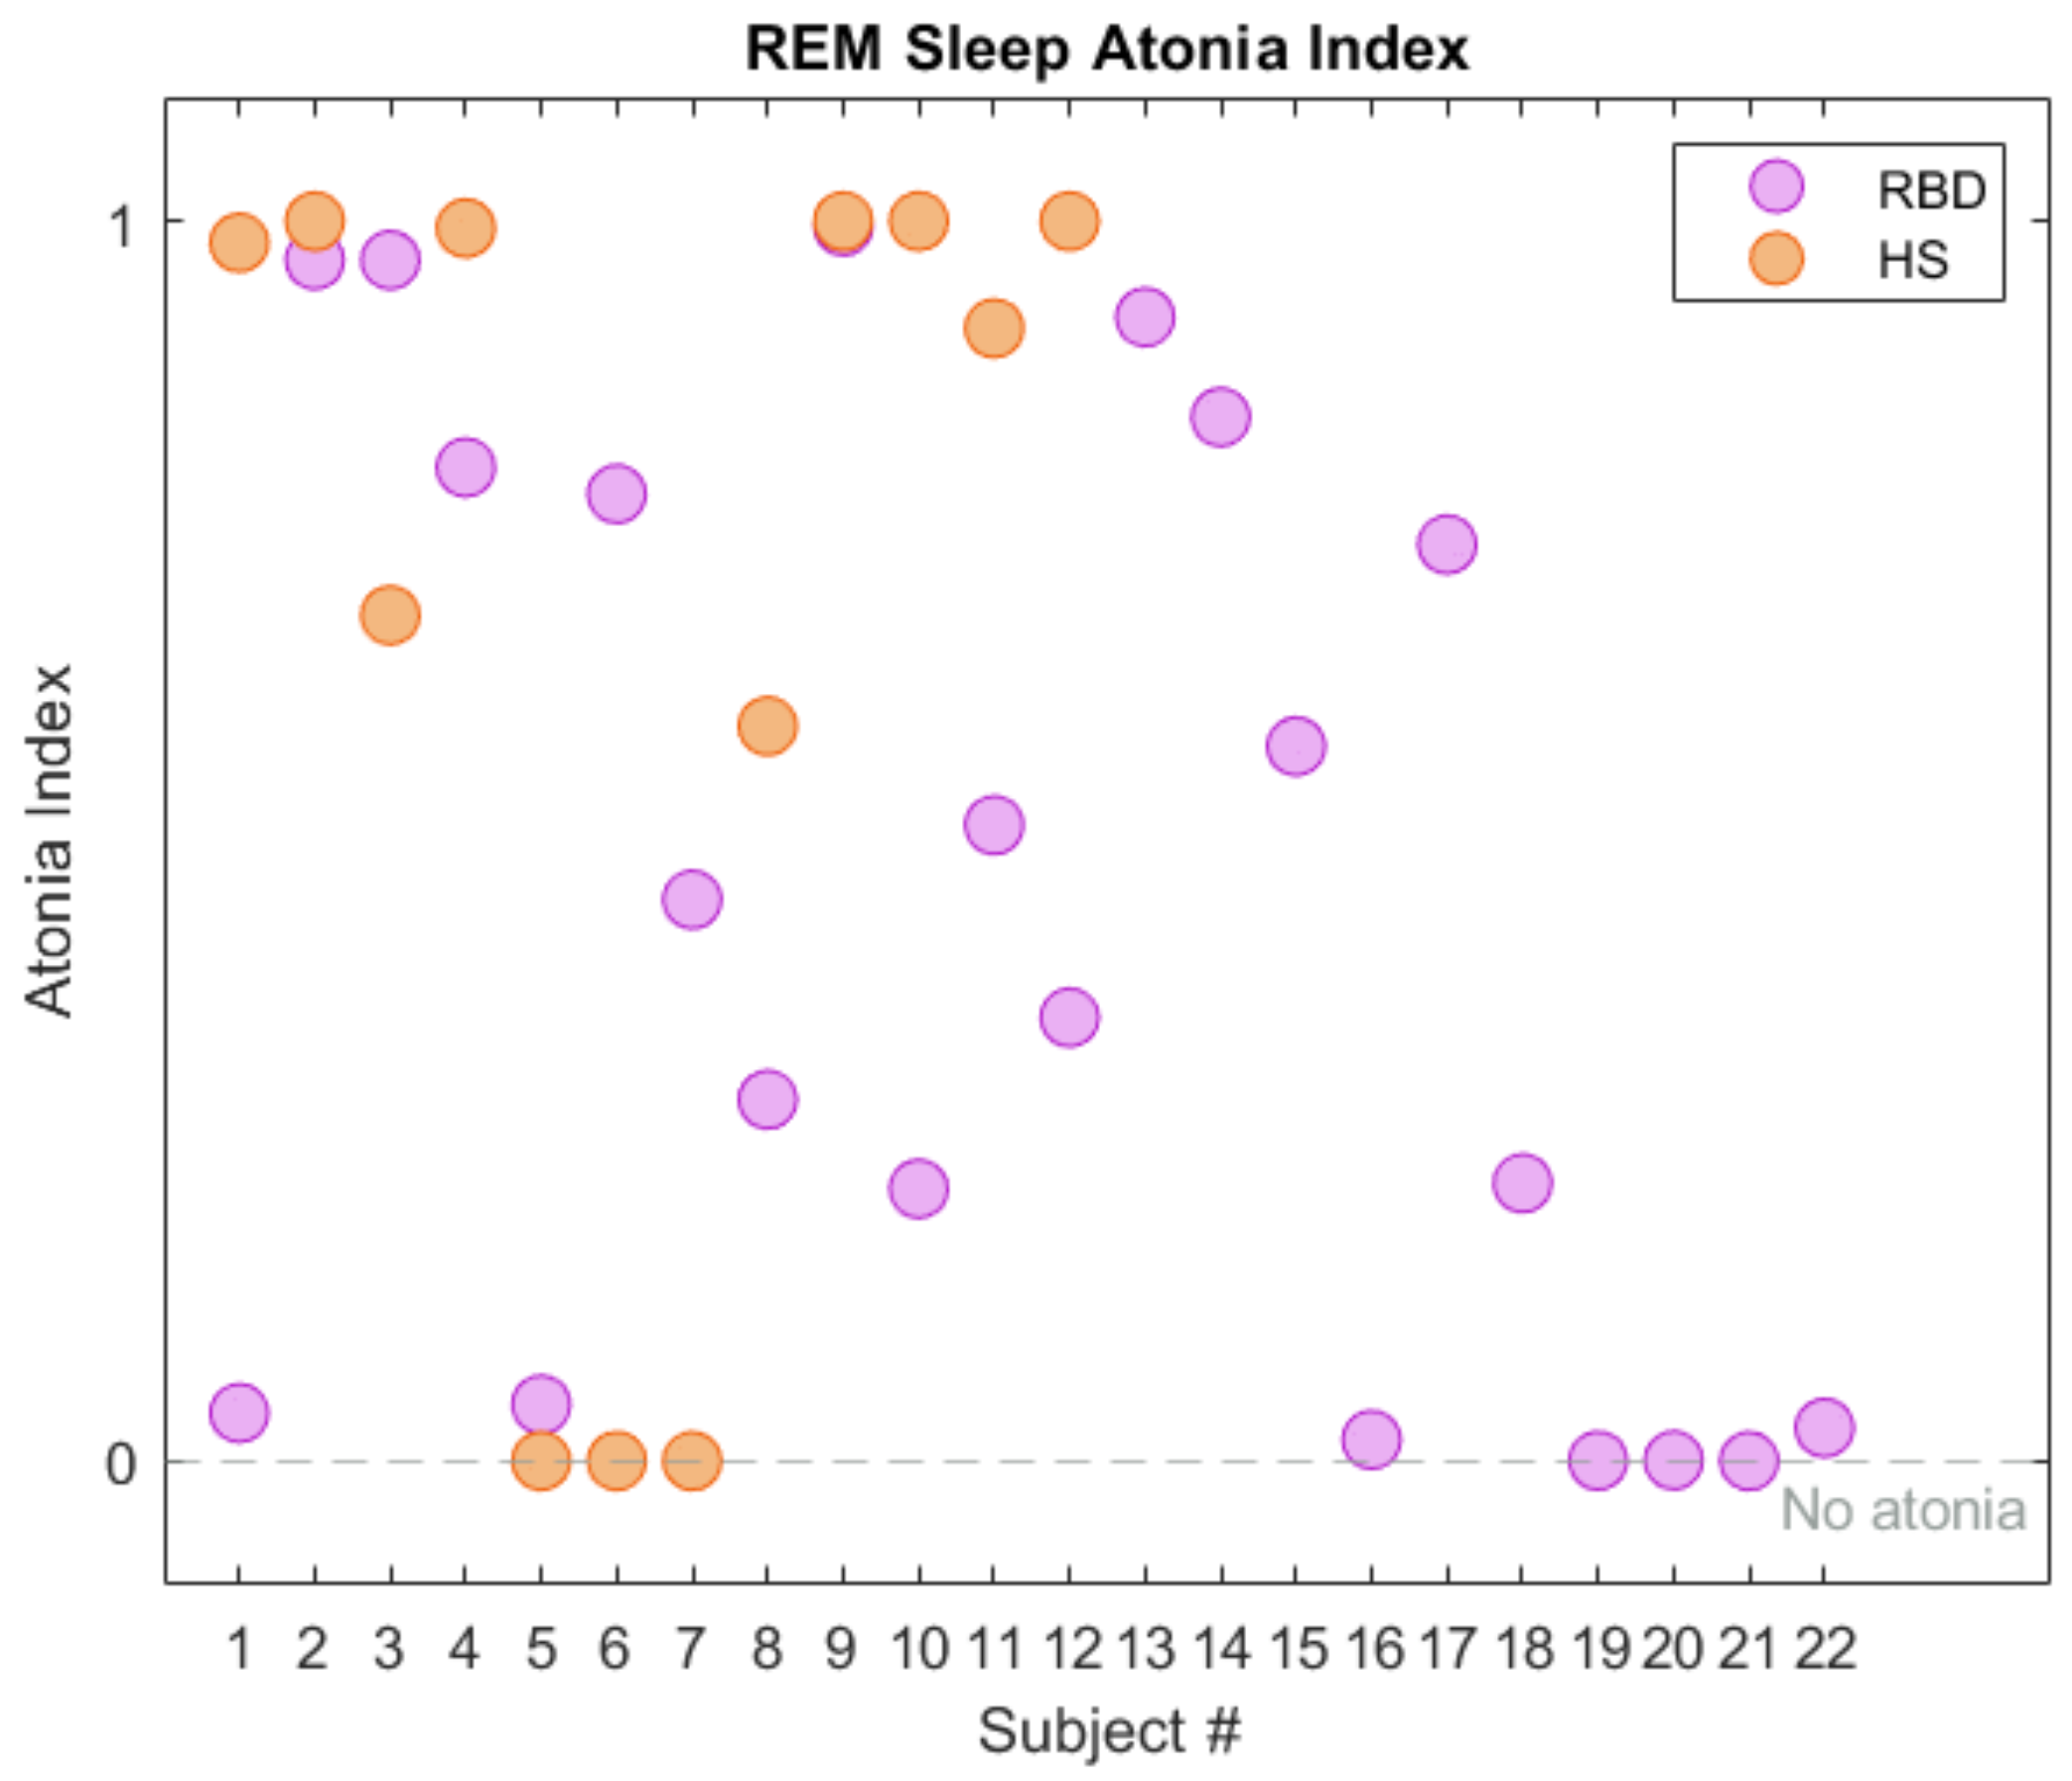
Figure 4.
REM Sleep Atonia Index (RAI) in healthy subjects (HS, orange) and RBD (purple), in the CAP Sleep Database. The gray dashed line represents lack of REM atonia.
Figure 4.
REM Sleep Atonia Index (RAI) in healthy subjects (HS, orange) and RBD (purple), in the CAP Sleep Database. The gray dashed line represents lack of REM atonia.
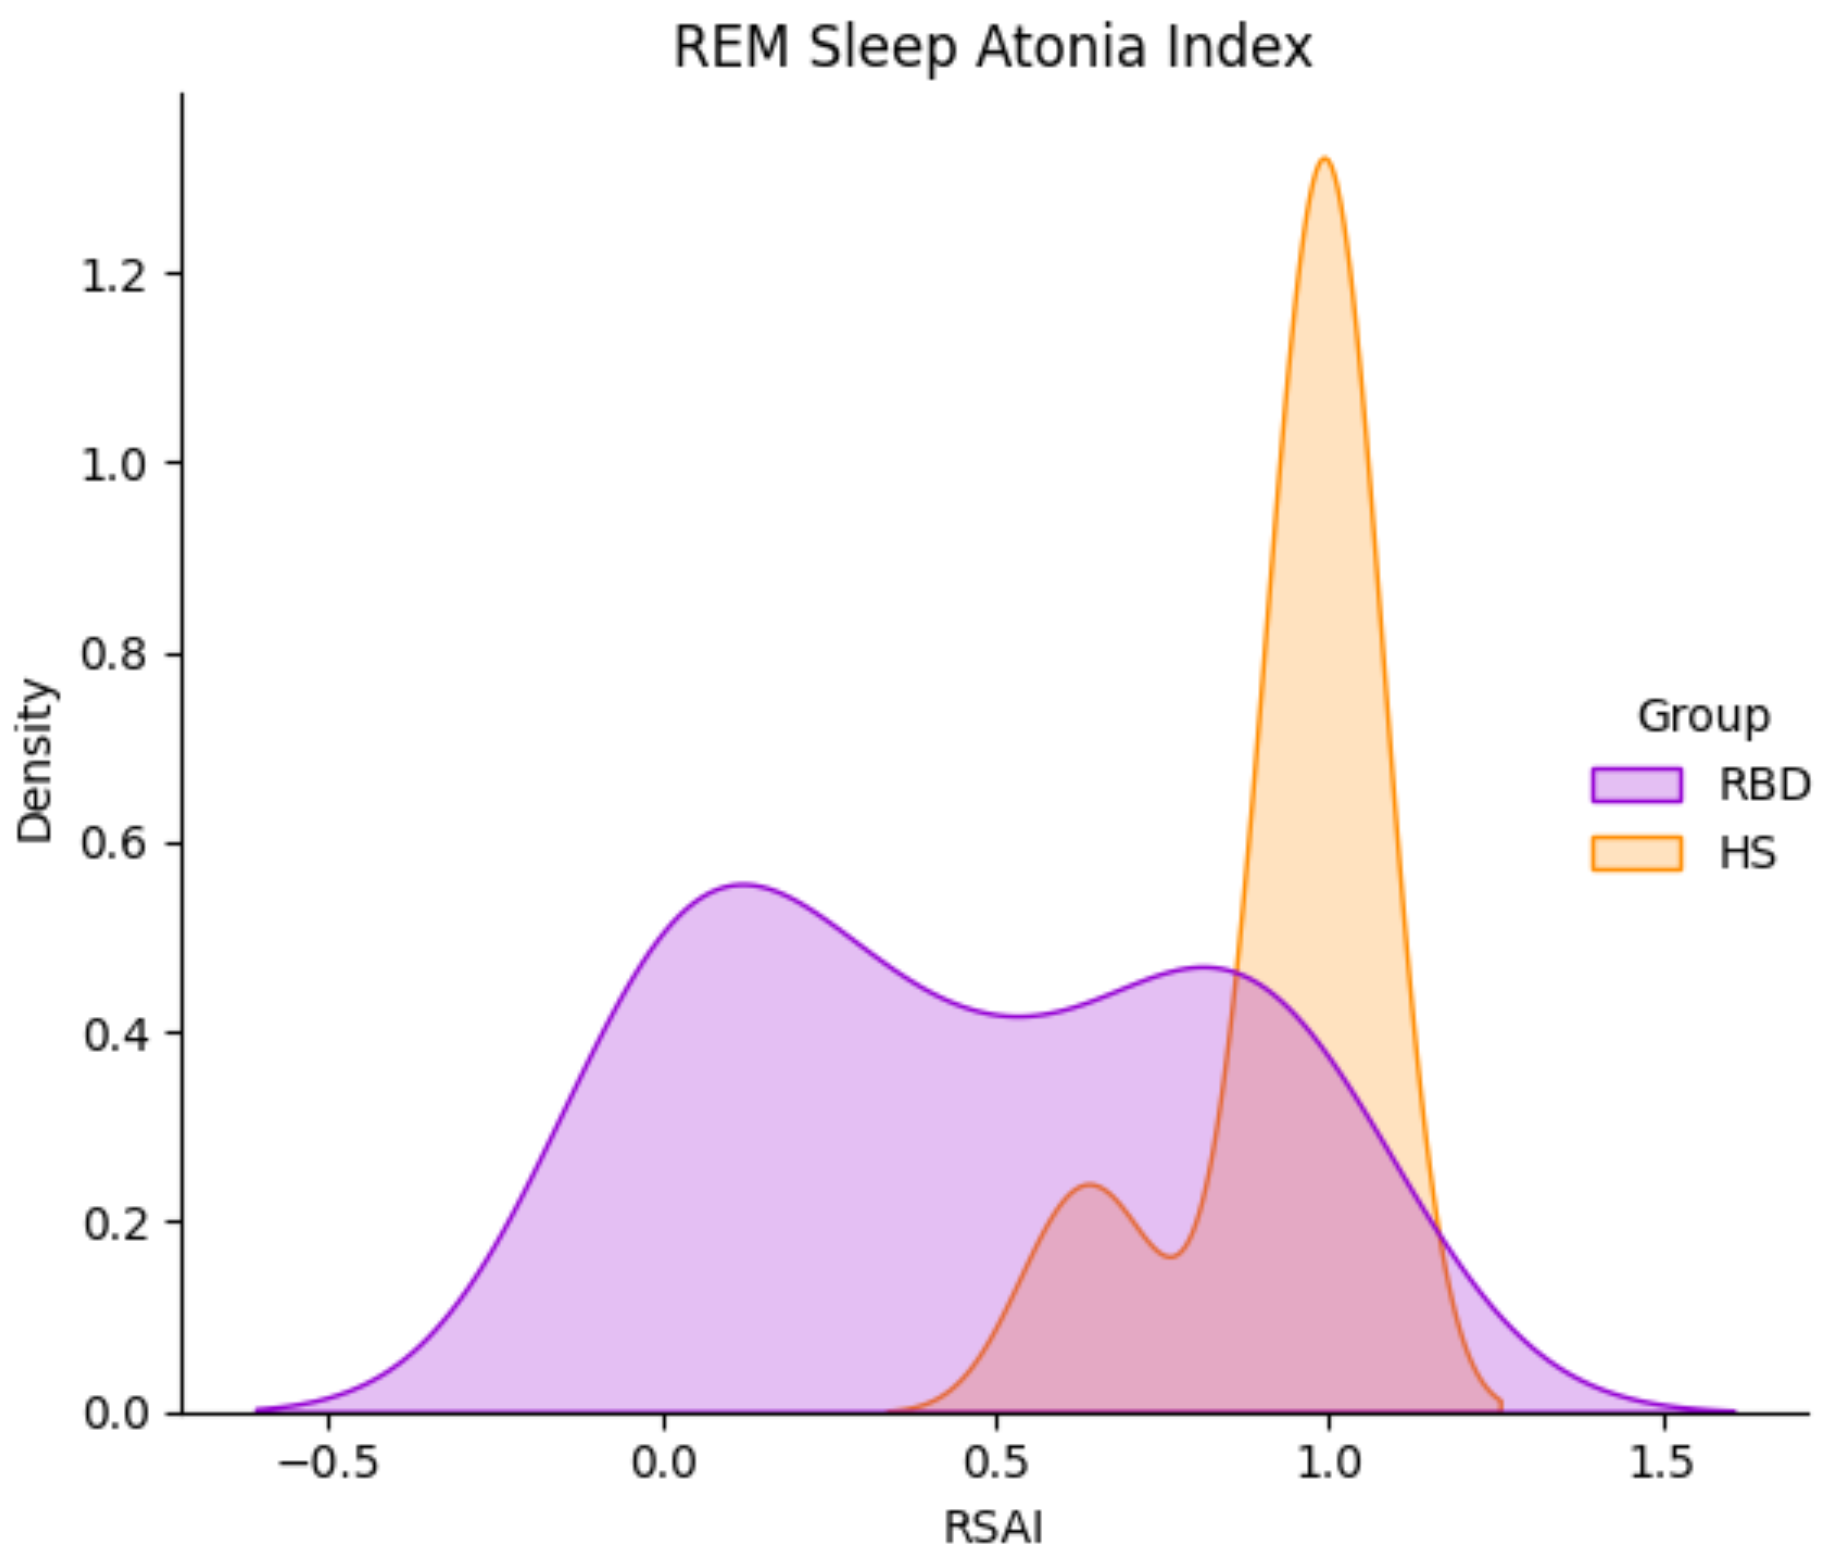
Figure 5.
REM Sleep Atonia Index (RAI) Kernel Density Distribution in HS (orange) and RBD subjects (purple), in the CAP Sleep Database. RBD subjects present with a wider RAI distribution.
Figure 5.
REM Sleep Atonia Index (RAI) Kernel Density Distribution in HS (orange) and RBD subjects (purple), in the CAP Sleep Database. RBD subjects present with a wider RAI distribution.
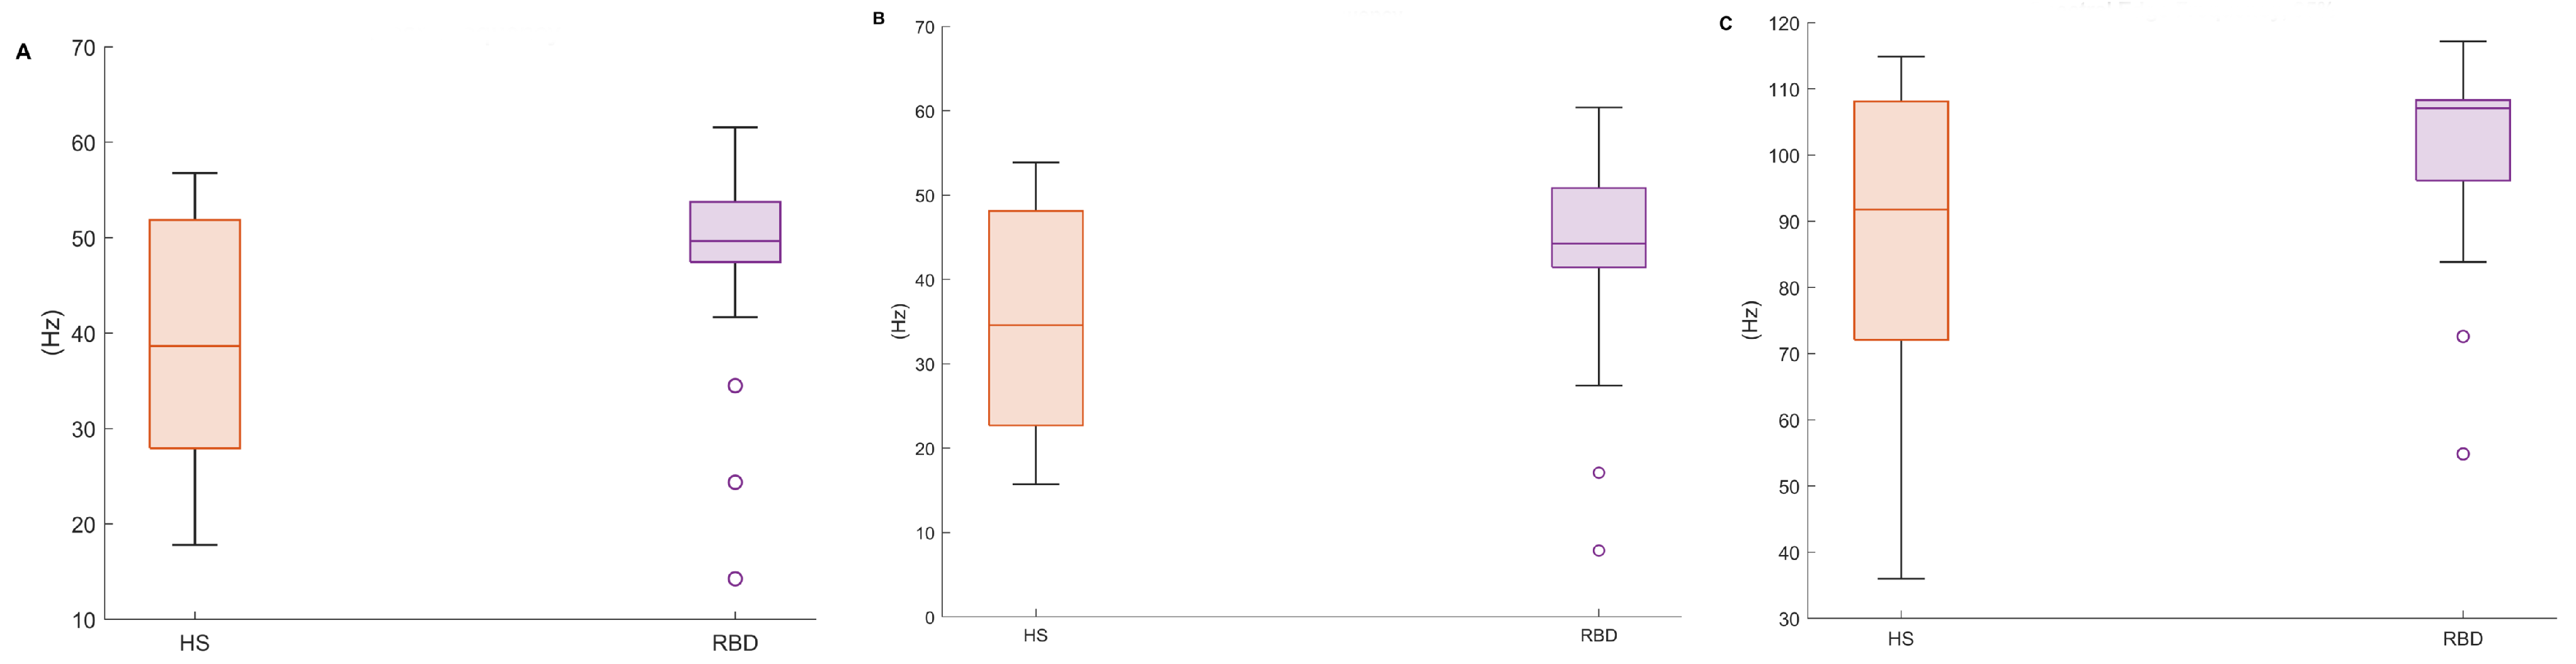
Figure 6.
Boxplots of the proposed EMG spectral features, in both healthy (HS) and RBD subjects (RBD). (A) Mean Frequency, (B) Median Frequency, (C) SEF95. CAP database.
Figure 6.
Boxplots of the proposed EMG spectral features, in both healthy (HS) and RBD subjects (RBD). (A) Mean Frequency, (B) Median Frequency, (C) SEF95. CAP database.
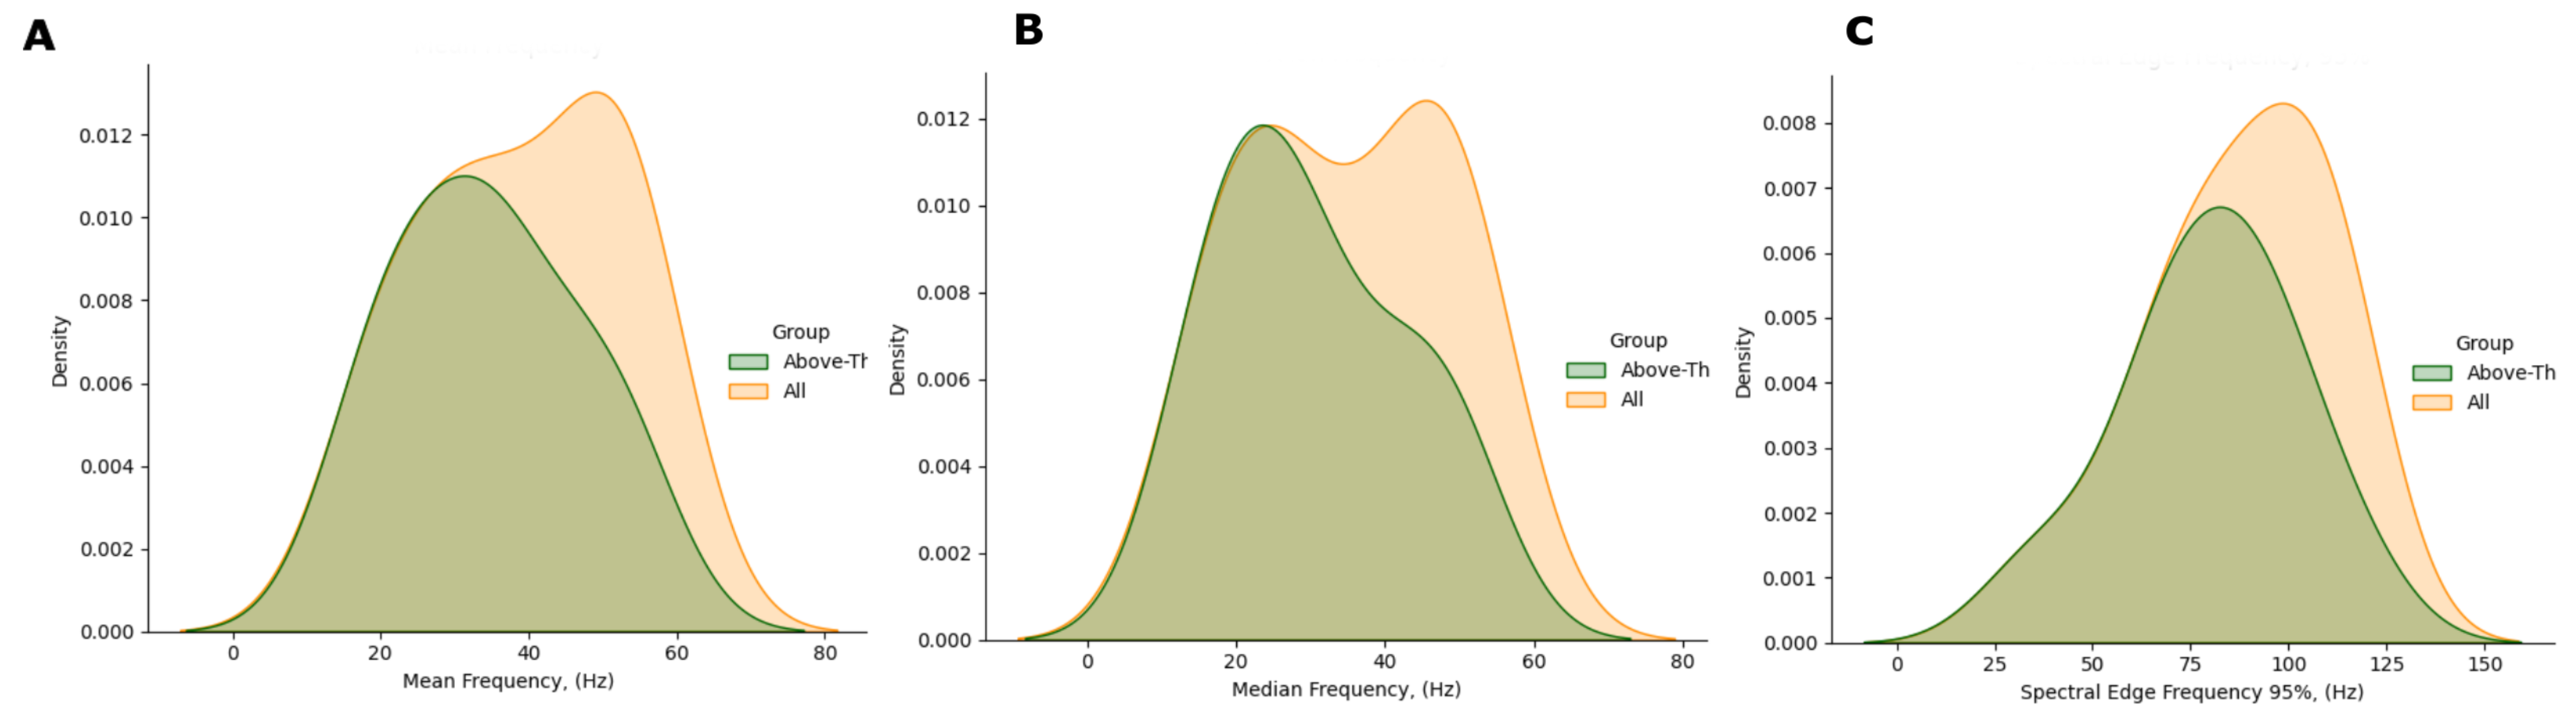
Figure 7.
Comparison of the spectral features distribution plots, as regards all HS (yellow) and HS with RAI above threshold (green). (A) Mean Frequency, (B) Median Frequency, (C) SEF95.
Figure 7.
Comparison of the spectral features distribution plots, as regards all HS (yellow) and HS with RAI above threshold (green). (A) Mean Frequency, (B) Median Frequency, (C) SEF95.
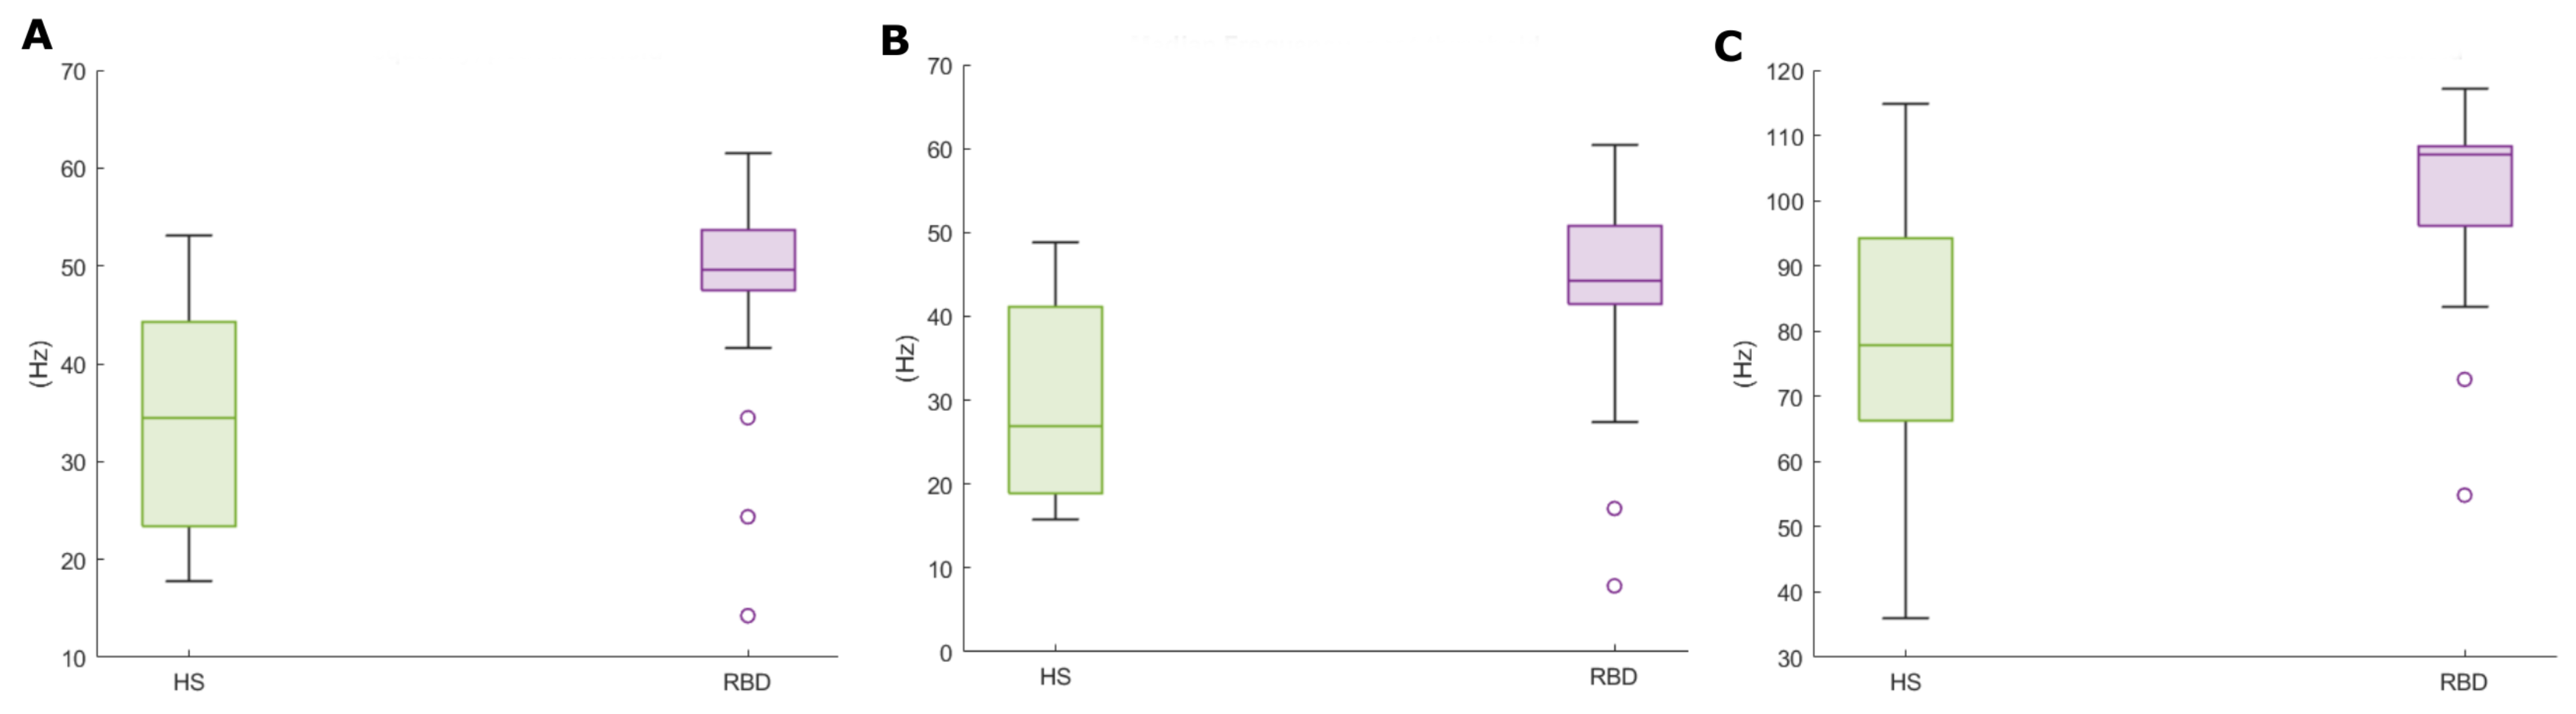
Figure 8.
Spectral features boxplots, for above-threshold HS (green) and RBD subjects (purple). (A) Mean Frequency, (B) Median Frequency, (C) SEF95.
Figure 8.
Spectral features boxplots, for above-threshold HS (green) and RBD subjects (purple). (A) Mean Frequency, (B) Median Frequency, (C) SEF95.
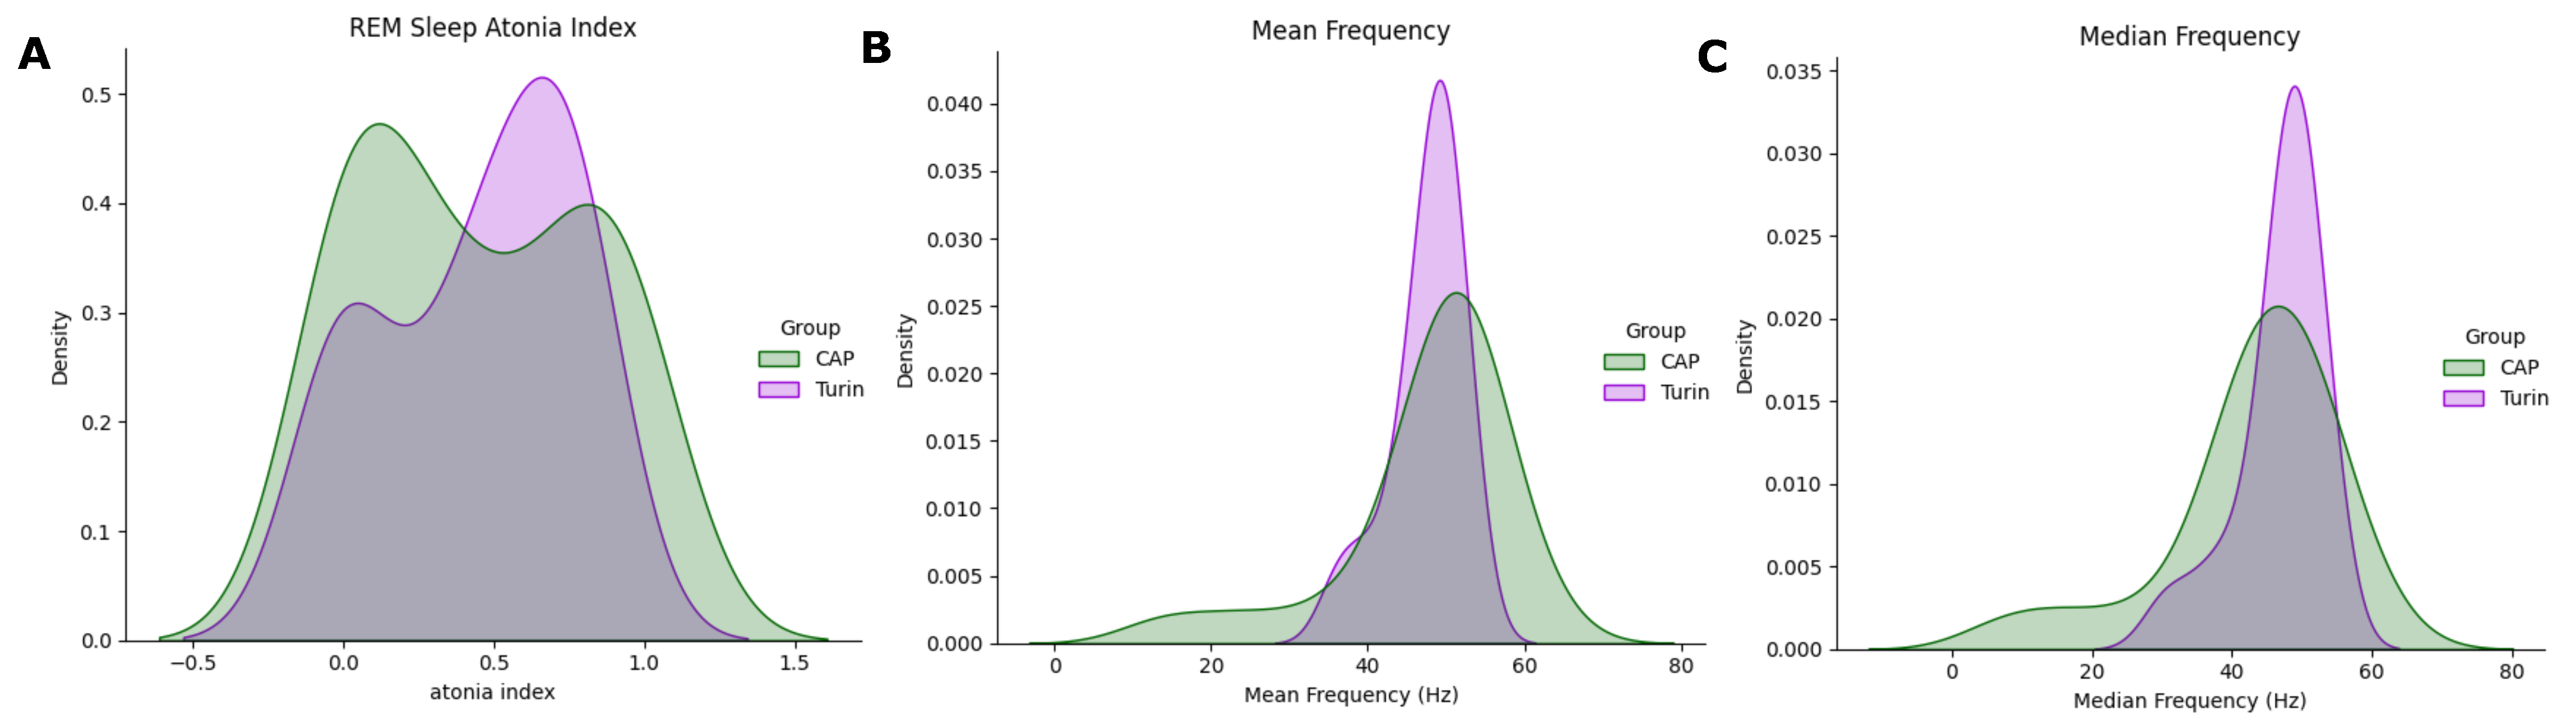
Figure 9.
Distribution plots of three variables, computed in the CAP Sleep Database (green) and TURIN Database (purple). (A) RAI, (B) Mean Frequency, (C) Median Frequency.
Figure 9.
Distribution plots of three variables, computed in the CAP Sleep Database (green) and TURIN Database (purple). (A) RAI, (B) Mean Frequency, (C) Median Frequency.
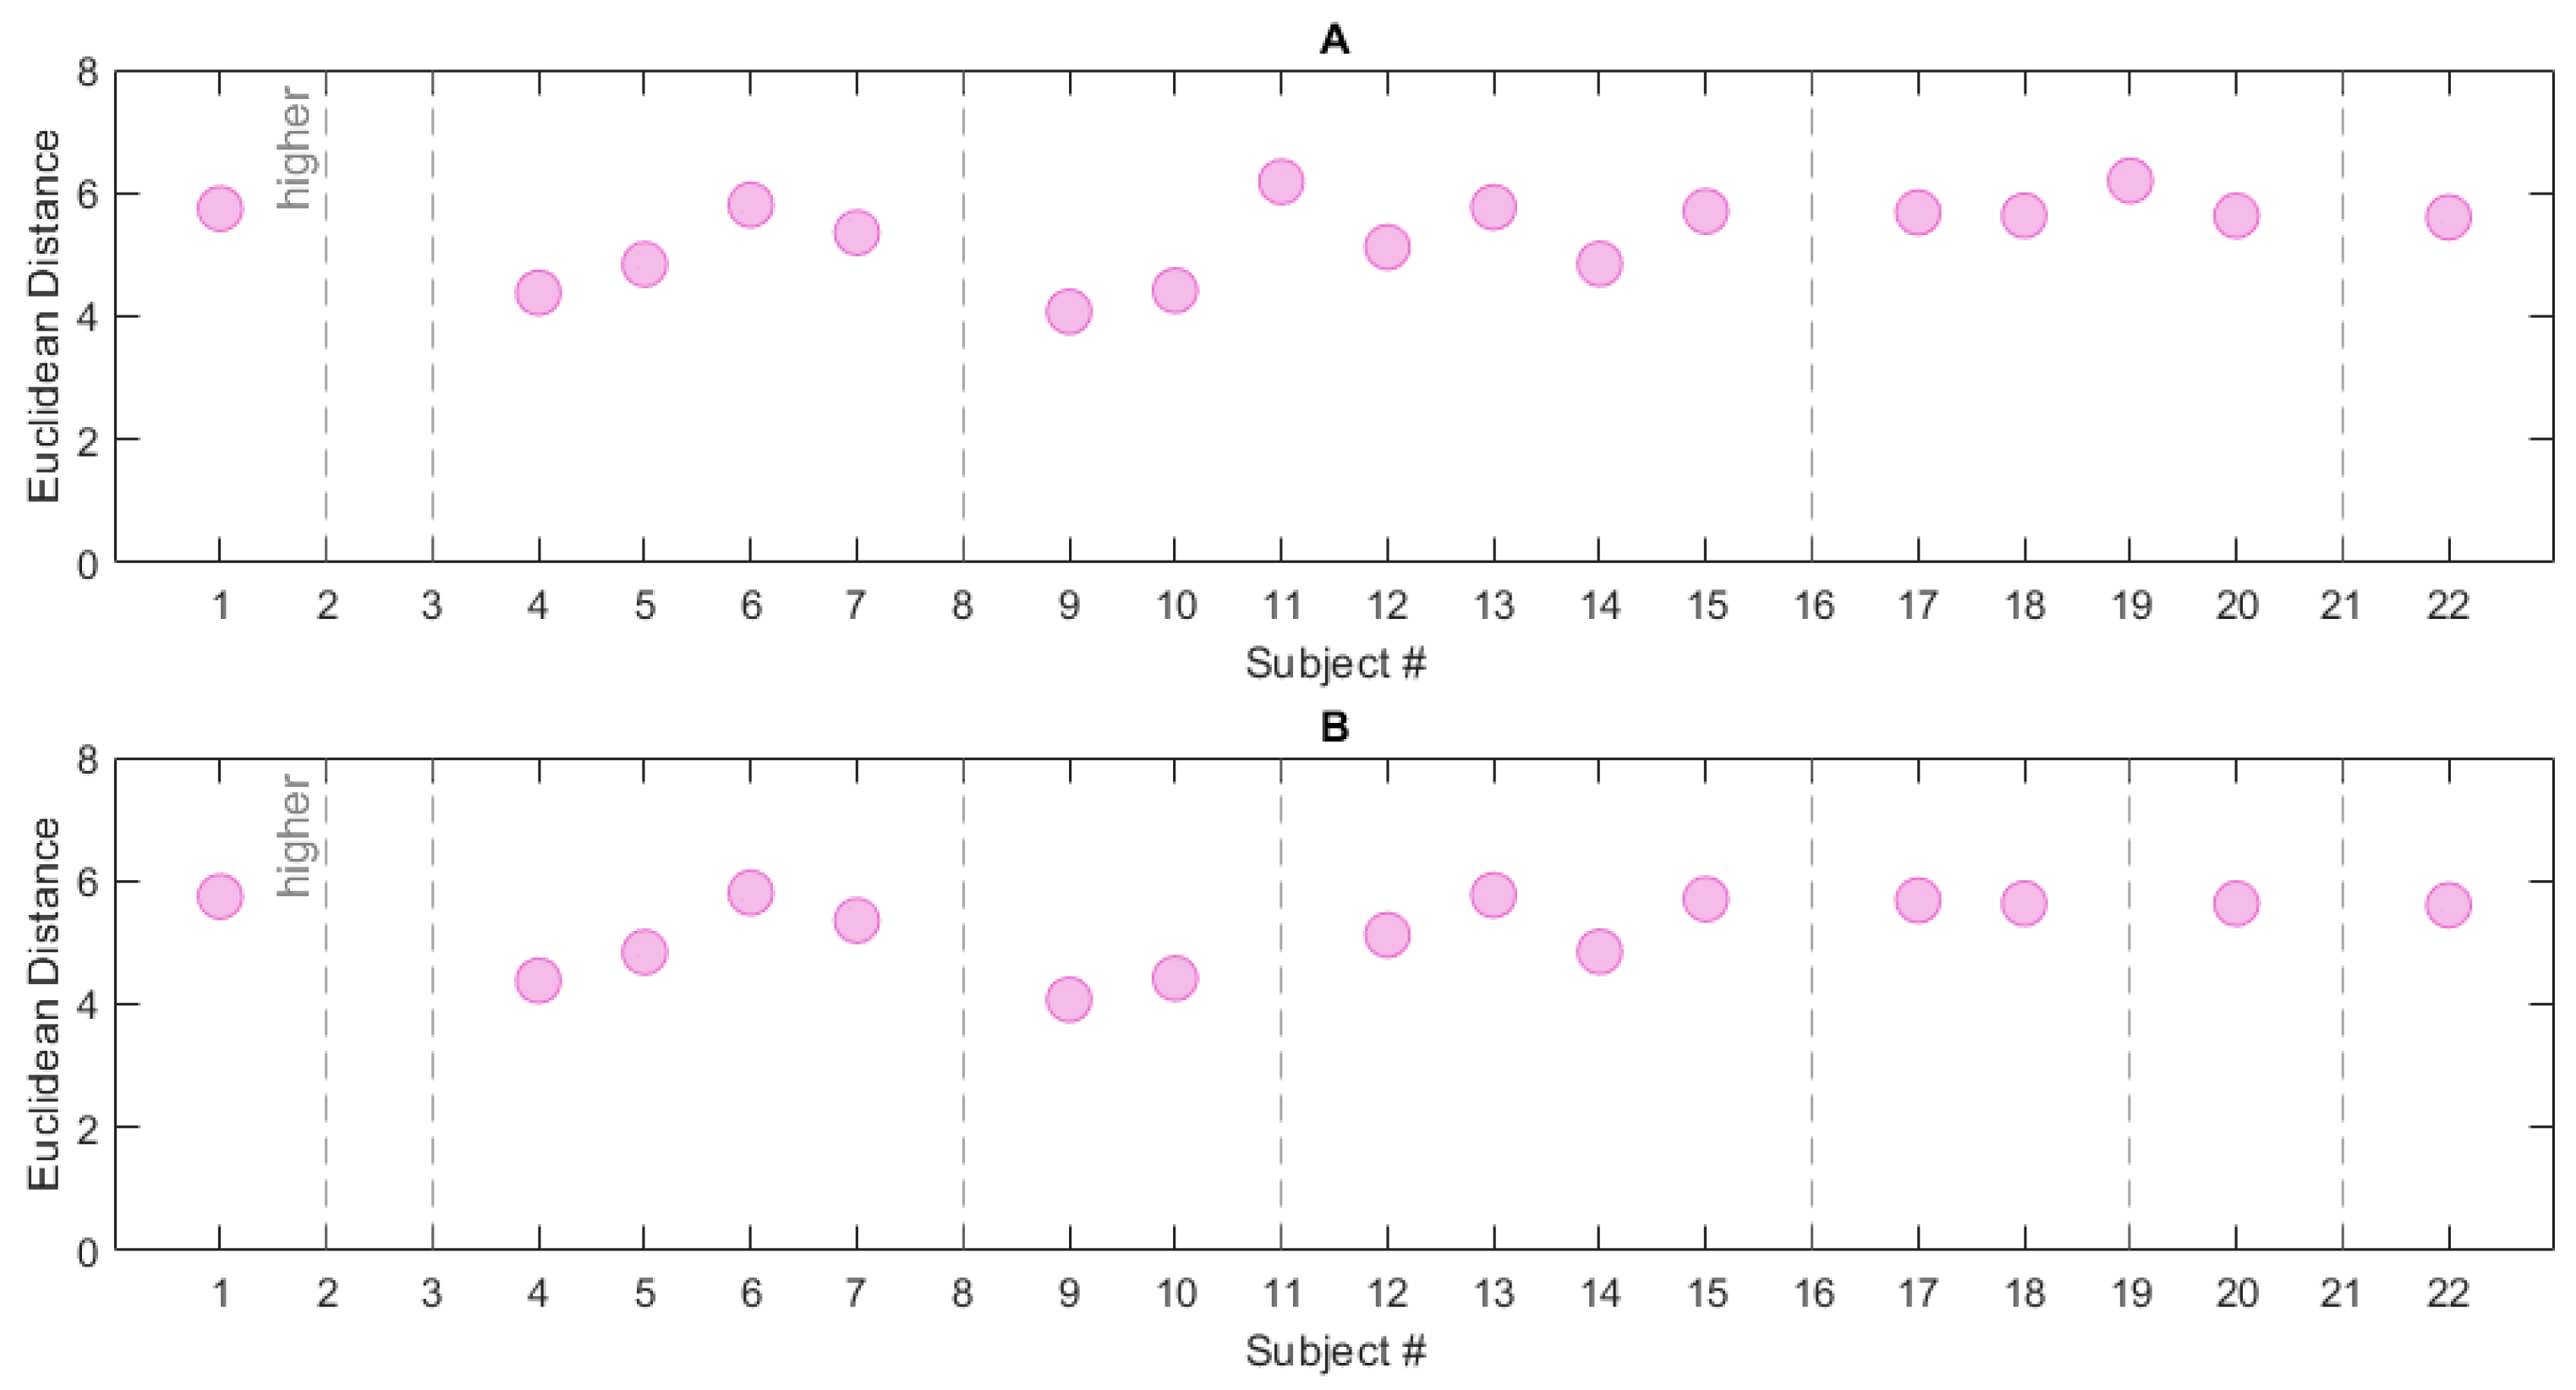
Figure 10.
Euclidean Distance computed for the RBD subjects in the CAP Sleep Database. Two neighbourhood/reference combinations are reported: (A) R/S, (B) R/S. The grey dashed lines represent subjects located outside the neighbourhoods (i.e., subjects whose Euclidean Distance from the chosen reference is higher than the neighbourhood radius).
Figure 11.
Dissociation Index computed on the RBD subjects (CAP Sleep Database), within neighbourhood R of reference S.
Figure 11.
Dissociation Index computed on the RBD subjects (CAP Sleep Database), within neighbourhood R of reference S.
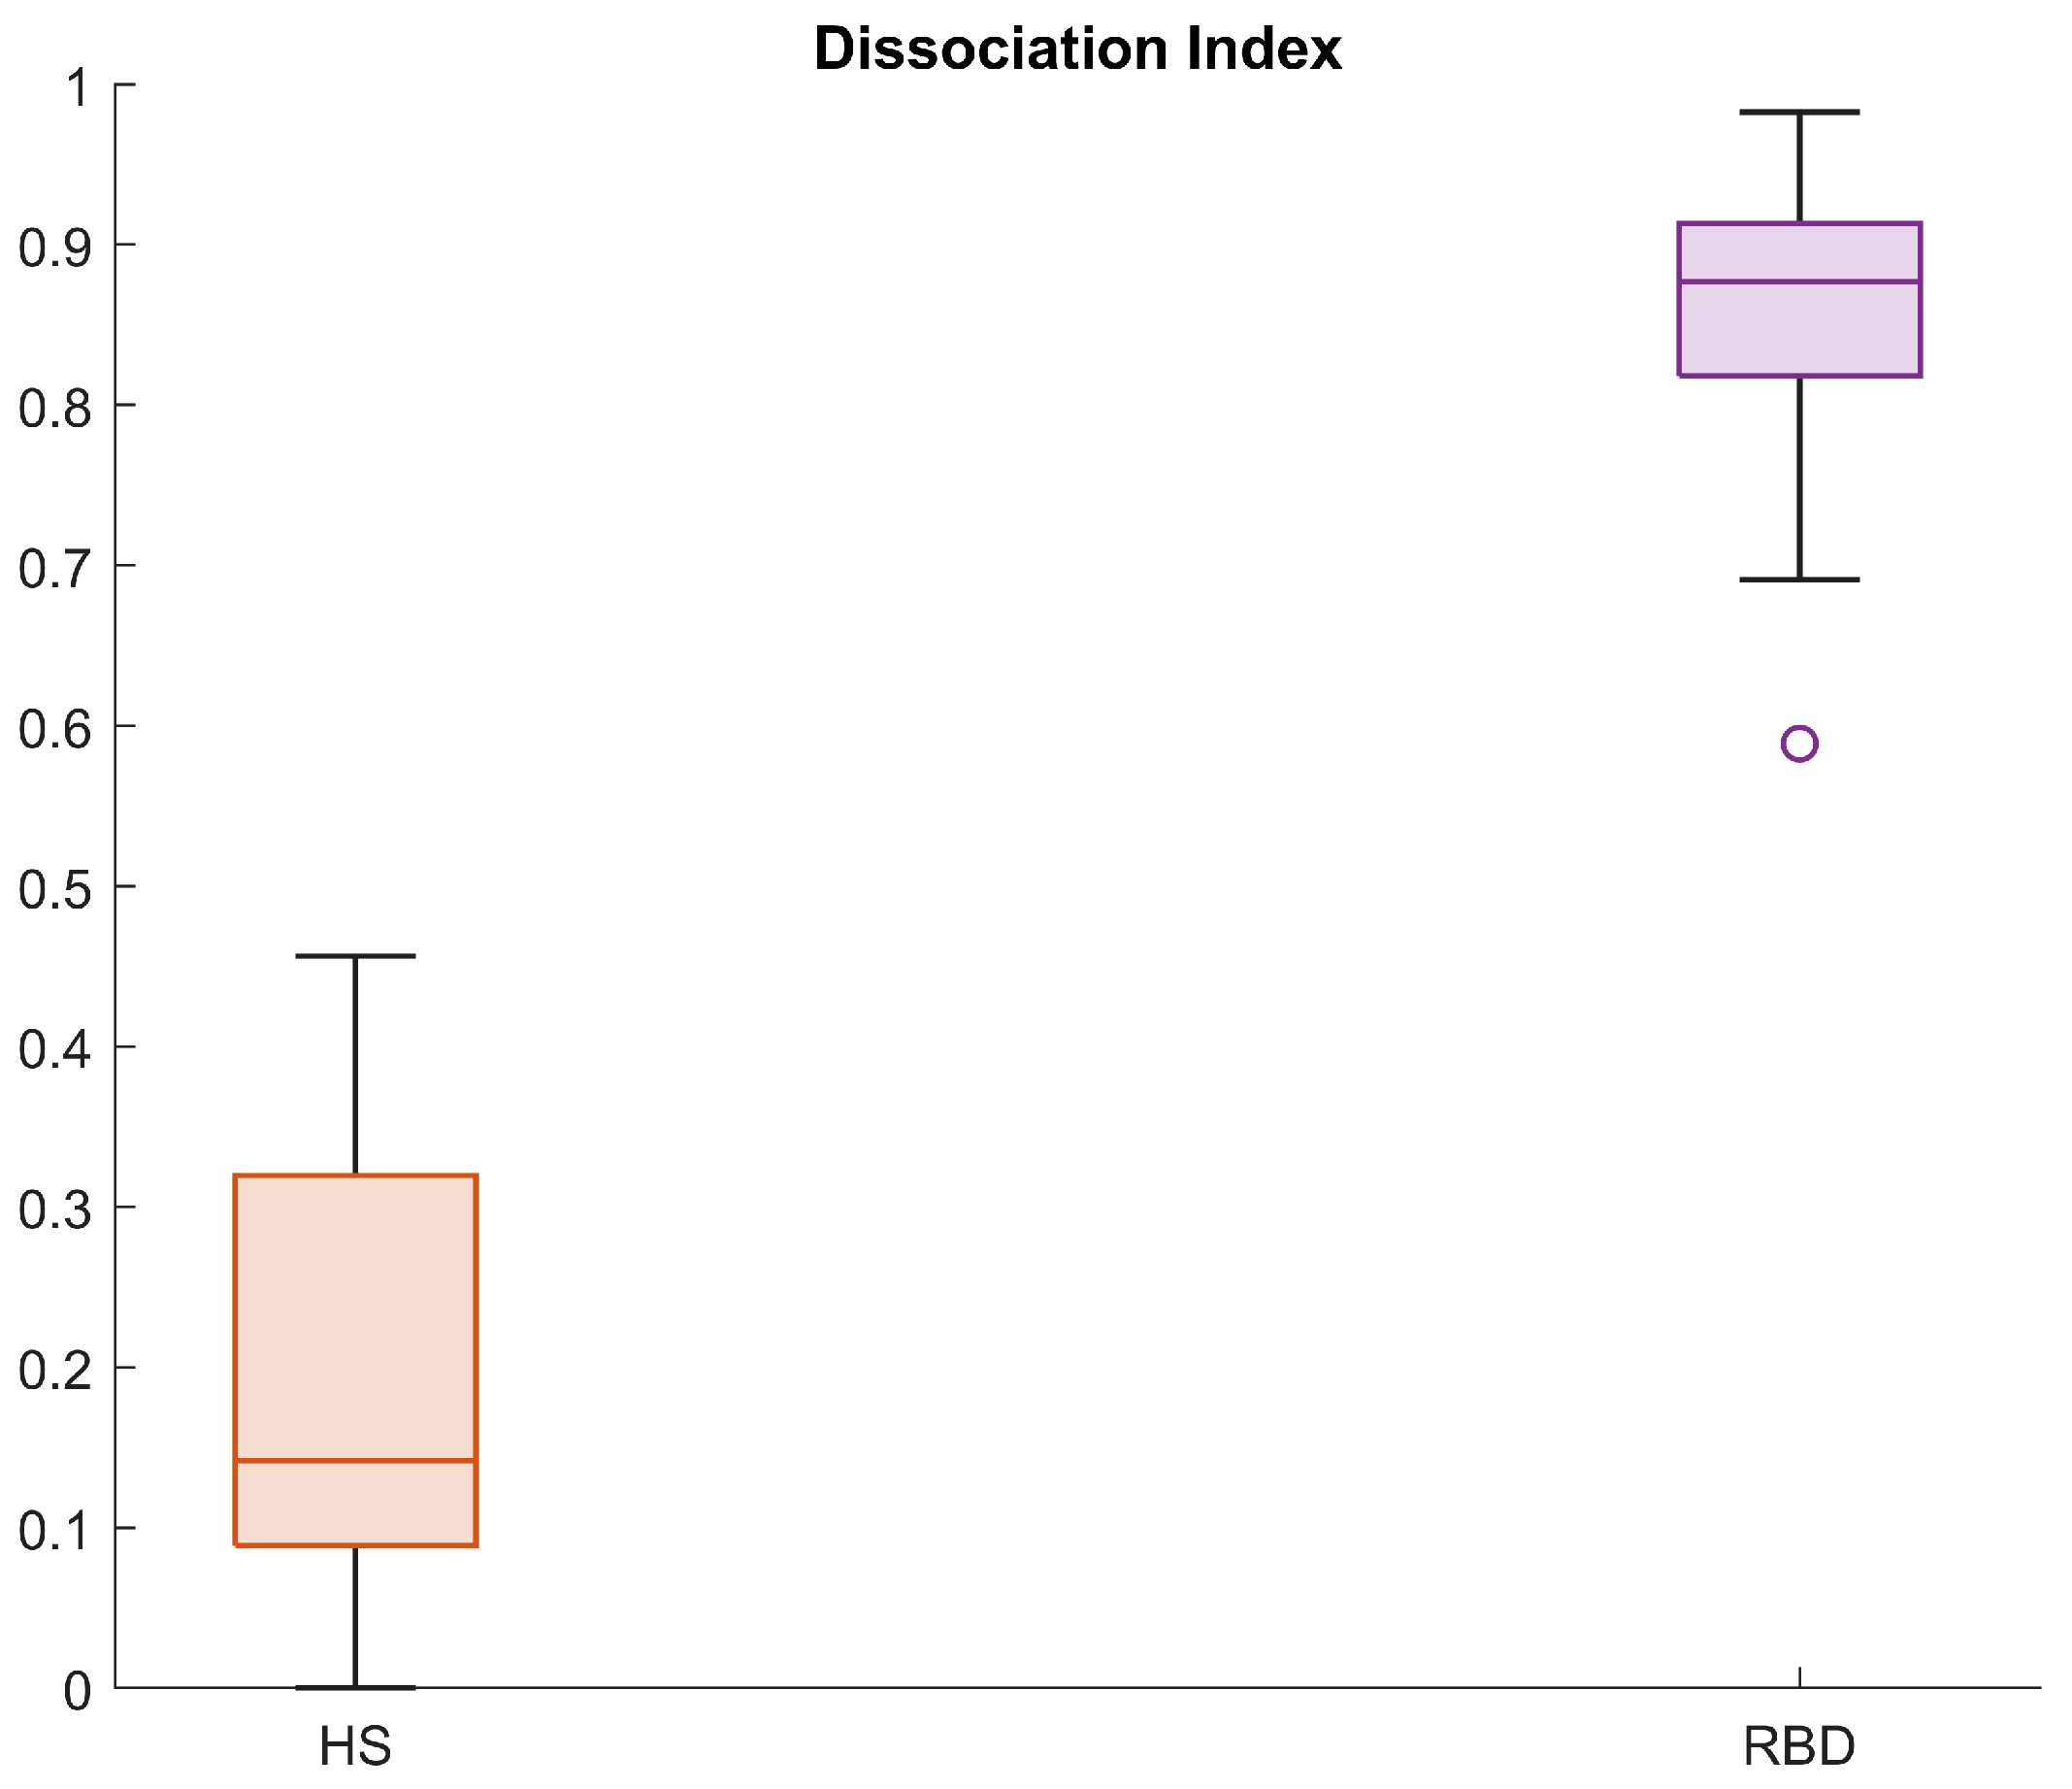
Figure 12.
Boxplots for the Dissociation Index computed in the HS and RBD groups (CAP Sleep Database).
Figure 12.
Boxplots for the Dissociation Index computed in the HS and RBD groups (CAP Sleep Database).
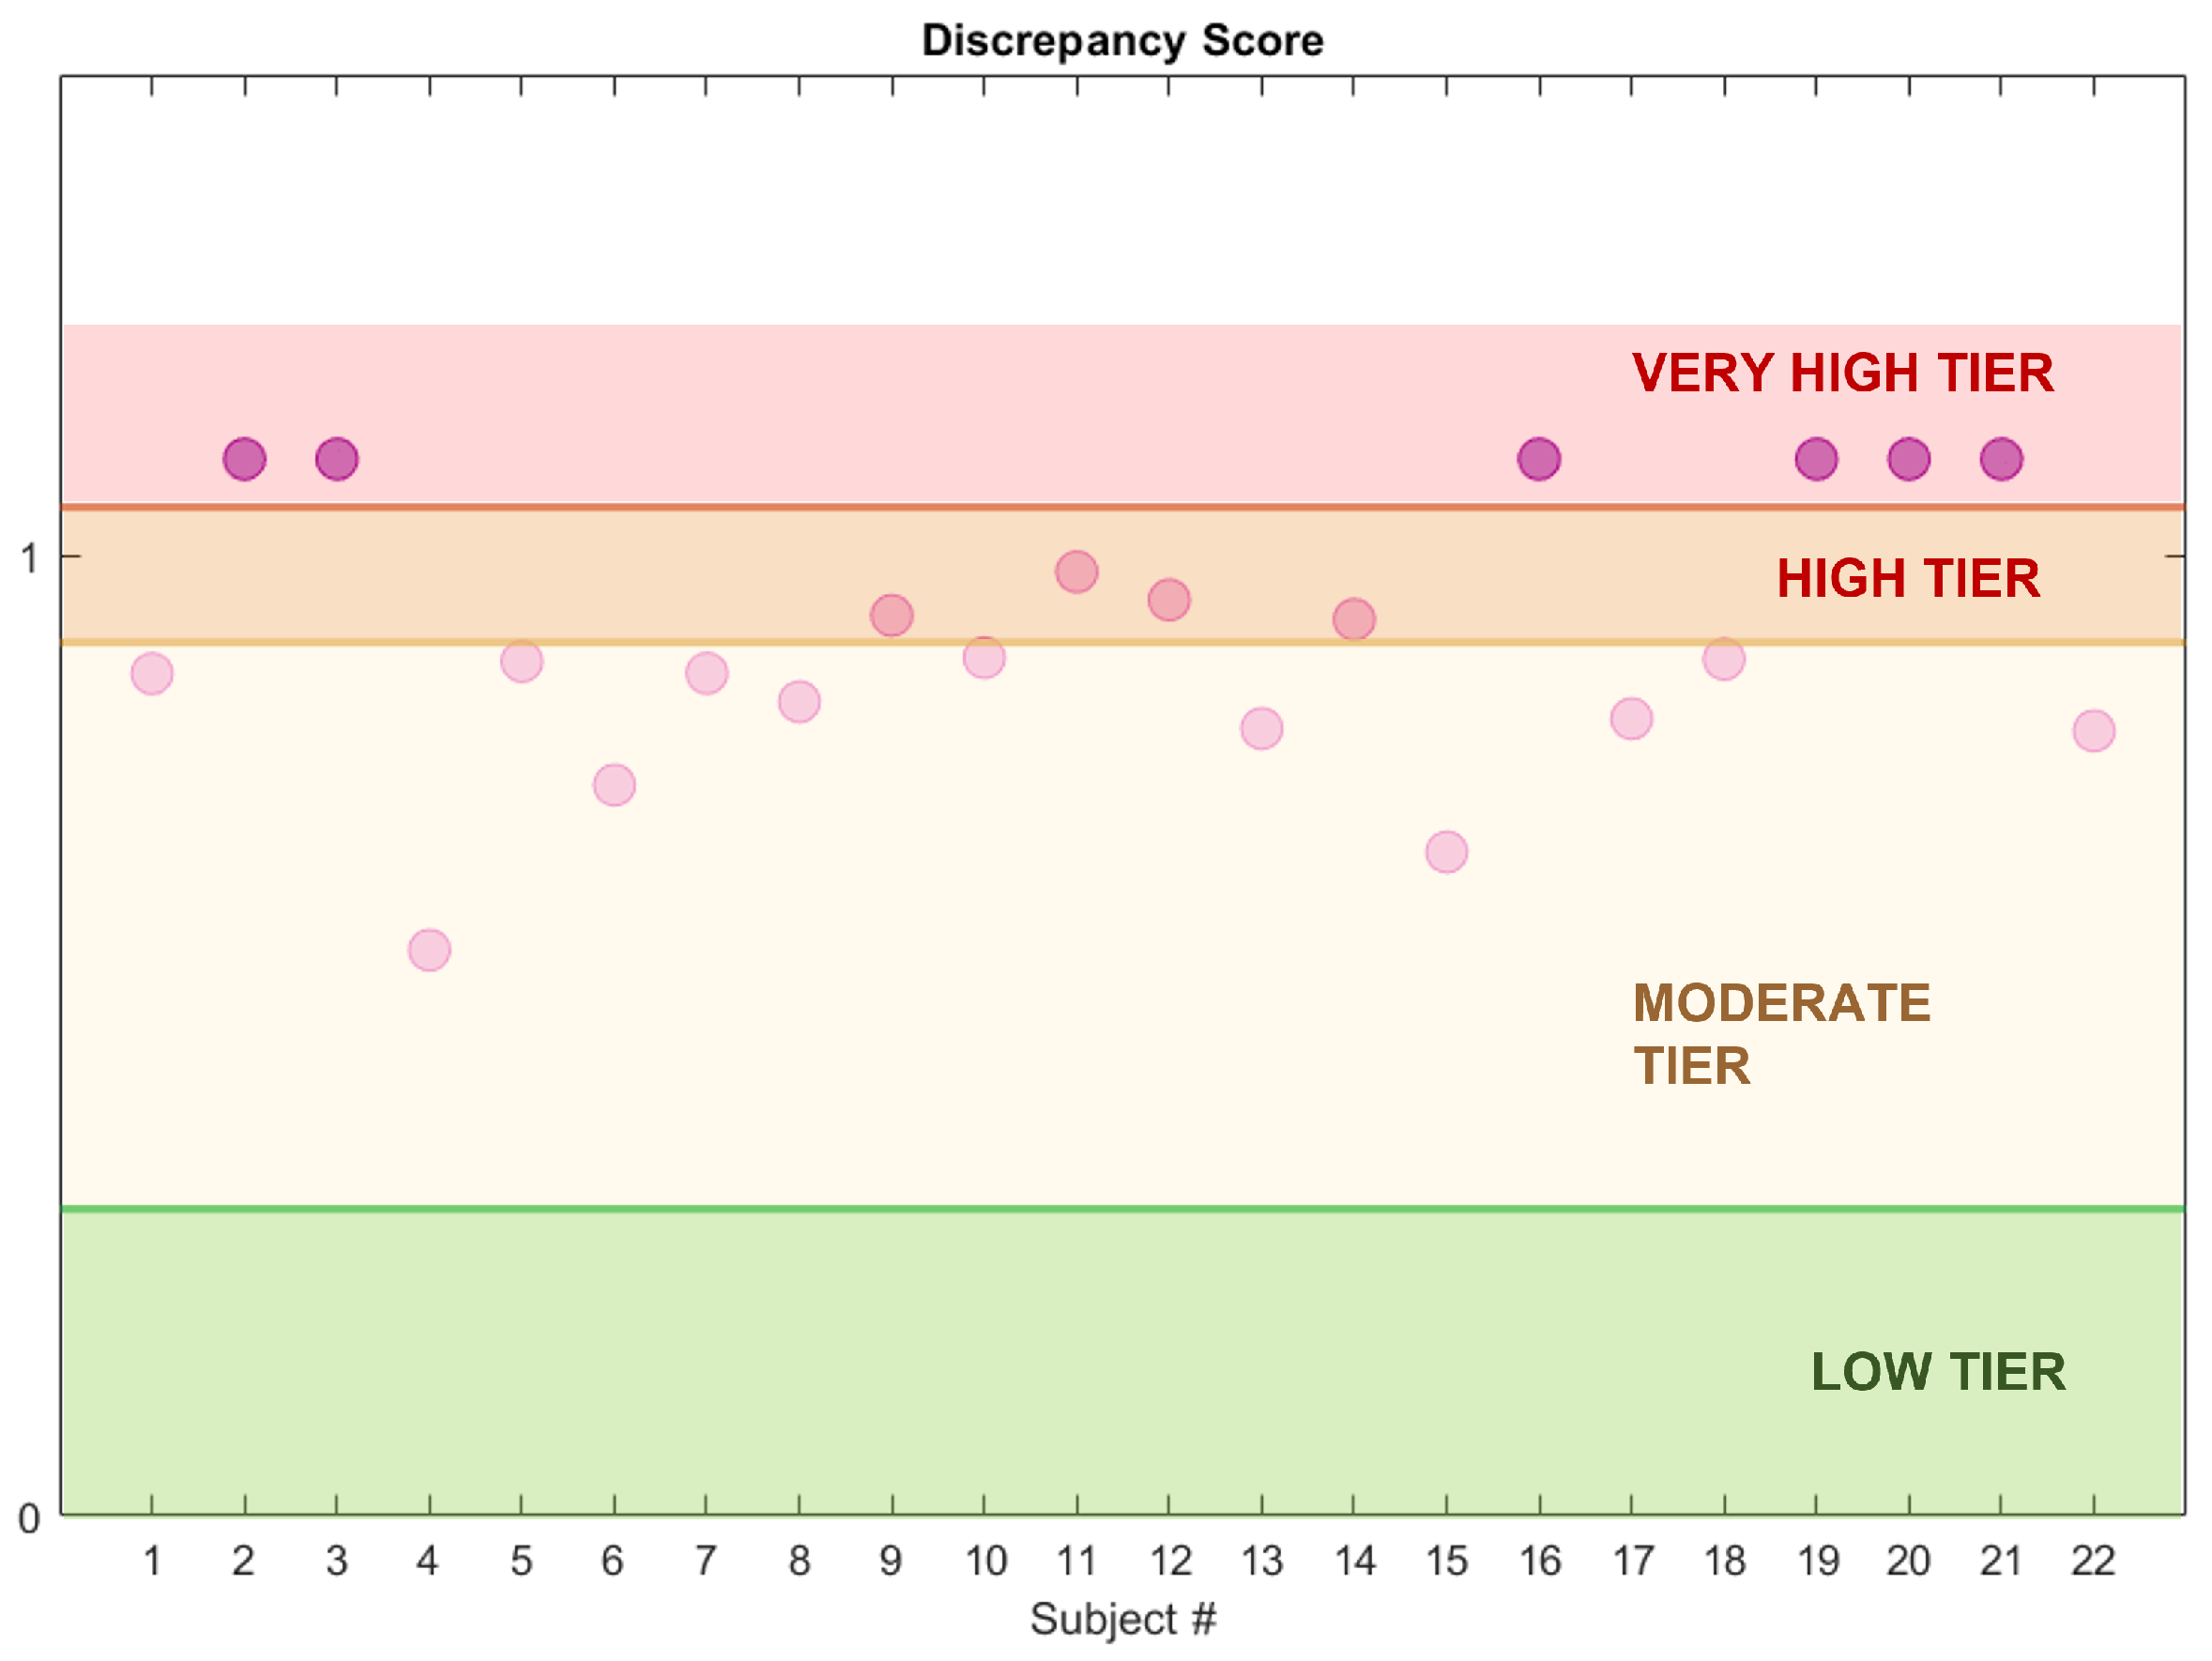
Figure 13.
Dissociation Index and estimated impairment areas. The dots represent the subjects’ DI value (RBD cohort, CAP Sleep Database).
Figure 13.
Dissociation Index and estimated impairment areas. The dots represent the subjects’ DI value (RBD cohort, CAP Sleep Database).
Table 1.
Features employed in the study, along with their acronym and description. The extracted features are of three different kinds: polysomnographic (i.e., clinical), muscular (EMG) in the time domain, muscular (EMG) in the frequency domain. As for polysomnographic features referring to sleep stages, the following definition of sleep stage holds (according to the international guidelines): 1 (N1), 2 (N2), 3 (slow wave sleep or deep sleep, SWS) and REM sleep.
| Type (or Channel) | Feature | Description |
|---|
| Polysomnographic features | Sleep Onset Latency (SOL) | The amount of time required to fall asleep (minutes) |
| Wake After Sleep Onset (WASO) | The amount of time the subject is awake during the recording (minutes) |
| Total Sleep Time (TST) | Total hours of sleep |
| Time in Bed (TIB) | Lights-off to lights-on interval (hours) |
| Sleep Efficiency (SE) | The ratio between TST and TIB (%) |
| Arousal Index (ARI) | Frequency of occurrence of arousals |
| Minutes of REM Sleep (MREM) | Total duration of REM Sleep (minutes) |
| Proportion of N1 Sleep (PN1) | N1 sleep per TST (%) |
| Proportion of N2 Sleep (PN2) | N2 sleep per TST (%) |
| Proportion of SWS Sleep (PN3) | SWS sleep per TST (%) |
| Proportion of REM Sleep (PNR) | Proportion of REM sleep per TST (%) |
| NREM Fragmentation Index (NFI) | A measure of the number of transitions from NREM to any other NREM stage per hour of NREM sleep |
| REM Fragmentation Index (RFI) | A measure of the number of transitions from REM to any other sleep stage per hour of REM |
| Wake Proportion (WP) | Awake time during the night (%) |
| Sleep Transition Index (STI) | A measure of the number of transitions from REM to NREM (and vice versa) per hours of sleep |
| Average Length N1 (ALN1) | Average length of N1 segments (minutes) |
| Average Length N2 (ALN2) | Average length of N2 segments (minutes) |
| Average Length SWS (ALSWS) | Average length of SWS segments (minutes) |
| Average Length REM (ALREM) | Average length of REM segments (minutes) |
| EMG, time domain | REM Sleep Atonia Index (RAI) | A measure of the amount of atonia during REM Sleep, evaluated on 1-s mini-epochs |
| EMG, frequency domain | Mean Frequency of REM mini-epochs (MF) | Mean Frequency of EMG signal during REM Sleep, 1-s mini-epochs (Hz) |
| Mean Frequency of REM mini-epochs (SEF50) | Median Frequency of EMG signal during REM Sleep, 1-s mini-epochs (Hz) |
| Spectral Edge Frequency at 95% of REM mini-epochs (SEF95) | Frequency below which 95% of the total spectral power is found on the EMG signal during REM Sleep, computed on 1-s mini-epochs (Hz) |
Table 2.
Summary of the two employed Machine Learning models: K-Nearest Neighbour (K-NN) and Support Vector Machine (SVM). For each classifier, the chosen feature selection and cross-validation methods, the searched hyper-parameters and the optimised model parameters are presented.
Table 2.
Summary of the two employed Machine Learning models: K-Nearest Neighbour (K-NN) and Support Vector Machine (SVM). For each classifier, the chosen feature selection and cross-validation methods, the searched hyper-parameters and the optimised model parameters are presented.
| | K-NN | SVM |
|---|
| Normalization | z-score normalization | z-score normalization |
| Feature Selection | Variance Threshold (25th percentile) | Variance Threshold (25th percentile) |
| Hyperparameters Search Range | K: range [1:1:12] | Kernel Function: Linear, Quadratic, |
| Distance Metric: City Block, Chebyschev, | Gaussian, Cubic |
| Euclidean, Hamming, Mahalanobis, | Maximum Penalty: range [0.001, 1000] |
| Minkowski, Spearman | |
| Optimisation | Bayesian | Bayesian |
| Optimised Parameters | K: 10 | Kernel: Linear |
| Distance Metric: Spearman | Max Penalty: 2.09 |
| Iterations: 30 | Iterations: 30 |
| Cross-validation | 5-fold | 5-fold |
Table 3.
REM Sleep Atonia Index (RAI) statistical parameters computed for healthy subjects (HS) and RBD. Subjects 5–7 (HS) are not included.
Table 3.
REM Sleep Atonia Index (RAI) statistical parameters computed for healthy subjects (HS) and RBD. Subjects 5–7 (HS) are not included.
| | HS | RBD |
|---|
| Mean ± STD | 0.93 ± 0.14 | 0.44 ± 0.37 |
| Median | 0.945 | 0.40 |
| 75th percentile | 1 | 0.8 |
| 25th percentile | 0.3 | 0.04 |
Table 4.
EMG spectral features (mean ± STD), computed for the healthy (HS) and RBD subjects (RBD) in the CAP Sleep Database. Mean Frequency (MF), Median Frequency (SEF50) and Spectral Edge Frequency at 95% (SEF95).
Table 4.
EMG spectral features (mean ± STD), computed for the healthy (HS) and RBD subjects (RBD) in the CAP Sleep Database. Mean Frequency (MF), Median Frequency (SEF50) and Spectral Edge Frequency at 95% (SEF95).
| | HS | RBD |
|---|
| MF (Hz) | 39.07 ± 13.62 | 47.53 ± 10.82 |
| SEF50 (Hz) | 34.73 ± 13.70 | 42.94 ± 12.24 |
| SEF95 (Hz) | 87.08 ± 23.90 | 101.42 ± 14.53 |
Table 5.
5-fold cross–validation performance of the two classifiers.
Table 5.
5-fold cross–validation performance of the two classifiers.
| | Accuracy | Sensitivity | Specificity | PPV | FDR |
|---|
| K-NN | 86.96% | 93.33% | 75% | 87.50% | 12.50% |
| SVM | 82.61% | 86.67% | 75% | 86.67% | 13.33% |
Table 6.
Classification performance on the test set (30% of the total dataset).
Table 6.
Classification performance on the test set (30% of the total dataset).
| | Accuracy | Sensitivity | Specificity | PPV | FDR | MAE |
|---|
| K-NN | 81.82% | 85.71% | 75% | 85.72% | 14.28% | 13.63% |
Table 7.
Detection performance of the two classification models, in terms of Mean Absolute Error (MAE) and Average Model Accuracy.
Table 7.
Detection performance of the two classification models, in terms of Mean Absolute Error (MAE) and Average Model Accuracy.
| | MAE (%) | Model Accuracy (%) |
|---|
| K–NN | 0 | 100% |
| SVM | 5.55% | 94.45% |
Table 8.
Euclidean Distance of RBD subjects in the CAP Database. Summary of the tested neighbourhood/reference combinations.
Table 8.
Euclidean Distance of RBD subjects in the CAP Database. Summary of the tested neighbourhood/reference combinations.
| Neighbourhood/Reference | Euclidean Distance (Mean ± STD) | Max Distance | No. Subjects Outside Radius |
|---|
| R/S | 5.35 ± 0.63 | 6.19 | 5 |
| R/S | 5.24 ± 0.59 | 5.80 | 7 |
| R/S | 5.02 ± 0.6 | 5.81 | 6 |


 ,
, 


