1. Introduction
The container-breeding mosquitos,
Aedes aegypti and
Aedes albopictus, are important pathogen-carrying vectors that thrive in urban environments. Although these mosquitos may share habitat suitability broadly, at fine spatial scales they have different levels of tolerance to urban driven environmental changes and differing competitive advantages [
1,
2].
Aedes albopictus is thought to be a superior competitor due to its ability to better exploit food resources, such as leaf litter within container habitats at the larval stage [
1,
2,
3]. This competitive advantage has been linked to a displacement of
Ae. aegypti, from urban areas across the United States, where
Ae. albopictus has been introduced [
2].
Aedes aegypti’s competitive inferiority may be alleviated by its higher ability to tolerate heat and egg desiccation [
1,
2], which may be especially common within cities due to urban heat island (UHI) effects. This interplay between competitive ability to exploit resources and the ability to disperse across urban-heat island patches may allow for the coexistence of these two species in certain places, rather than complete competitive exclusion [
2,
4].
The ability of container mosquitoes to segregate spatially across a city’s landscape is also influenced by the actual availability of container habitats where mosquito larvae can develop. Container mosquitos often exploit human made items such as automobile tires, flowerpots, and other discarded water holding vessels. Container habitat availability is in turn influenced by a variety of socioeconomic factors. In the USA, studies have shown that container mosquitos and their habitats increase proportionally with abandoned properties, urban disinvestment, and waste mismanagement, all of which are factors that disproportionally affect low-income neighborhoods [
5,
6,
7,
8]. This highlights the importance of considering heterogeneity in the social dimension of the urban landscape when evaluating mosquito vector community assemblages.
An underlying factor jointly associated with socioeconomic disparities and urban heat islands is that of urban vegetation cover. Within a city, vegetation provides a cooling effect by means of shading and evapotranspiration, and this effect has been shown consistently to mitigate UHI [
9]. However, the distribution of vegetation can be affected by factors such as “the luxury effect”, wherein higher income neighborhoods may be better able to afford green space management, historical urban legacies, which may vary by context, and education level, which links to knowledge and perceptions about ecosystem services [
10]. Important ecosystem services provided by urban vegetation, such as shading, air purification, and improved neighborhood aesthetics, have been linked to health factors such as higher physical activity, lower cardiovascular disease, and improved mental health [
11,
12]. However, few studies have linked vegetation cover to ecosystem services that affect the dynamics of mosquito-borne diseases [
13].
In the context of the coexistence of
Ae. albopictus and
Ae. aegypti, vegetation driven differences in habitat selection due to food sources or microhabitat qualities may be relevant for human health.
Aedes albopictus, which is often associated with more vegetated and cooler habitats [
2] and which is better able to exploit leaf litter as a food source [
1,
2,
3], is also a less effective vector for one of the most prevalent mosquito borne disease, dengue fever. This is due partly to its lower infectivity rates to certain dengue virus serotypes [
14], and partly due to its higher frequency of feeding on non-human hosts [
15]. Therefore, vegetation cover in a city could be thought of as providing an indirect ecosystem service that limits the presence of the most competent mosquito vector,
Ae. aegypti. Conversely, UHI, and climate change may have the opposite effect.
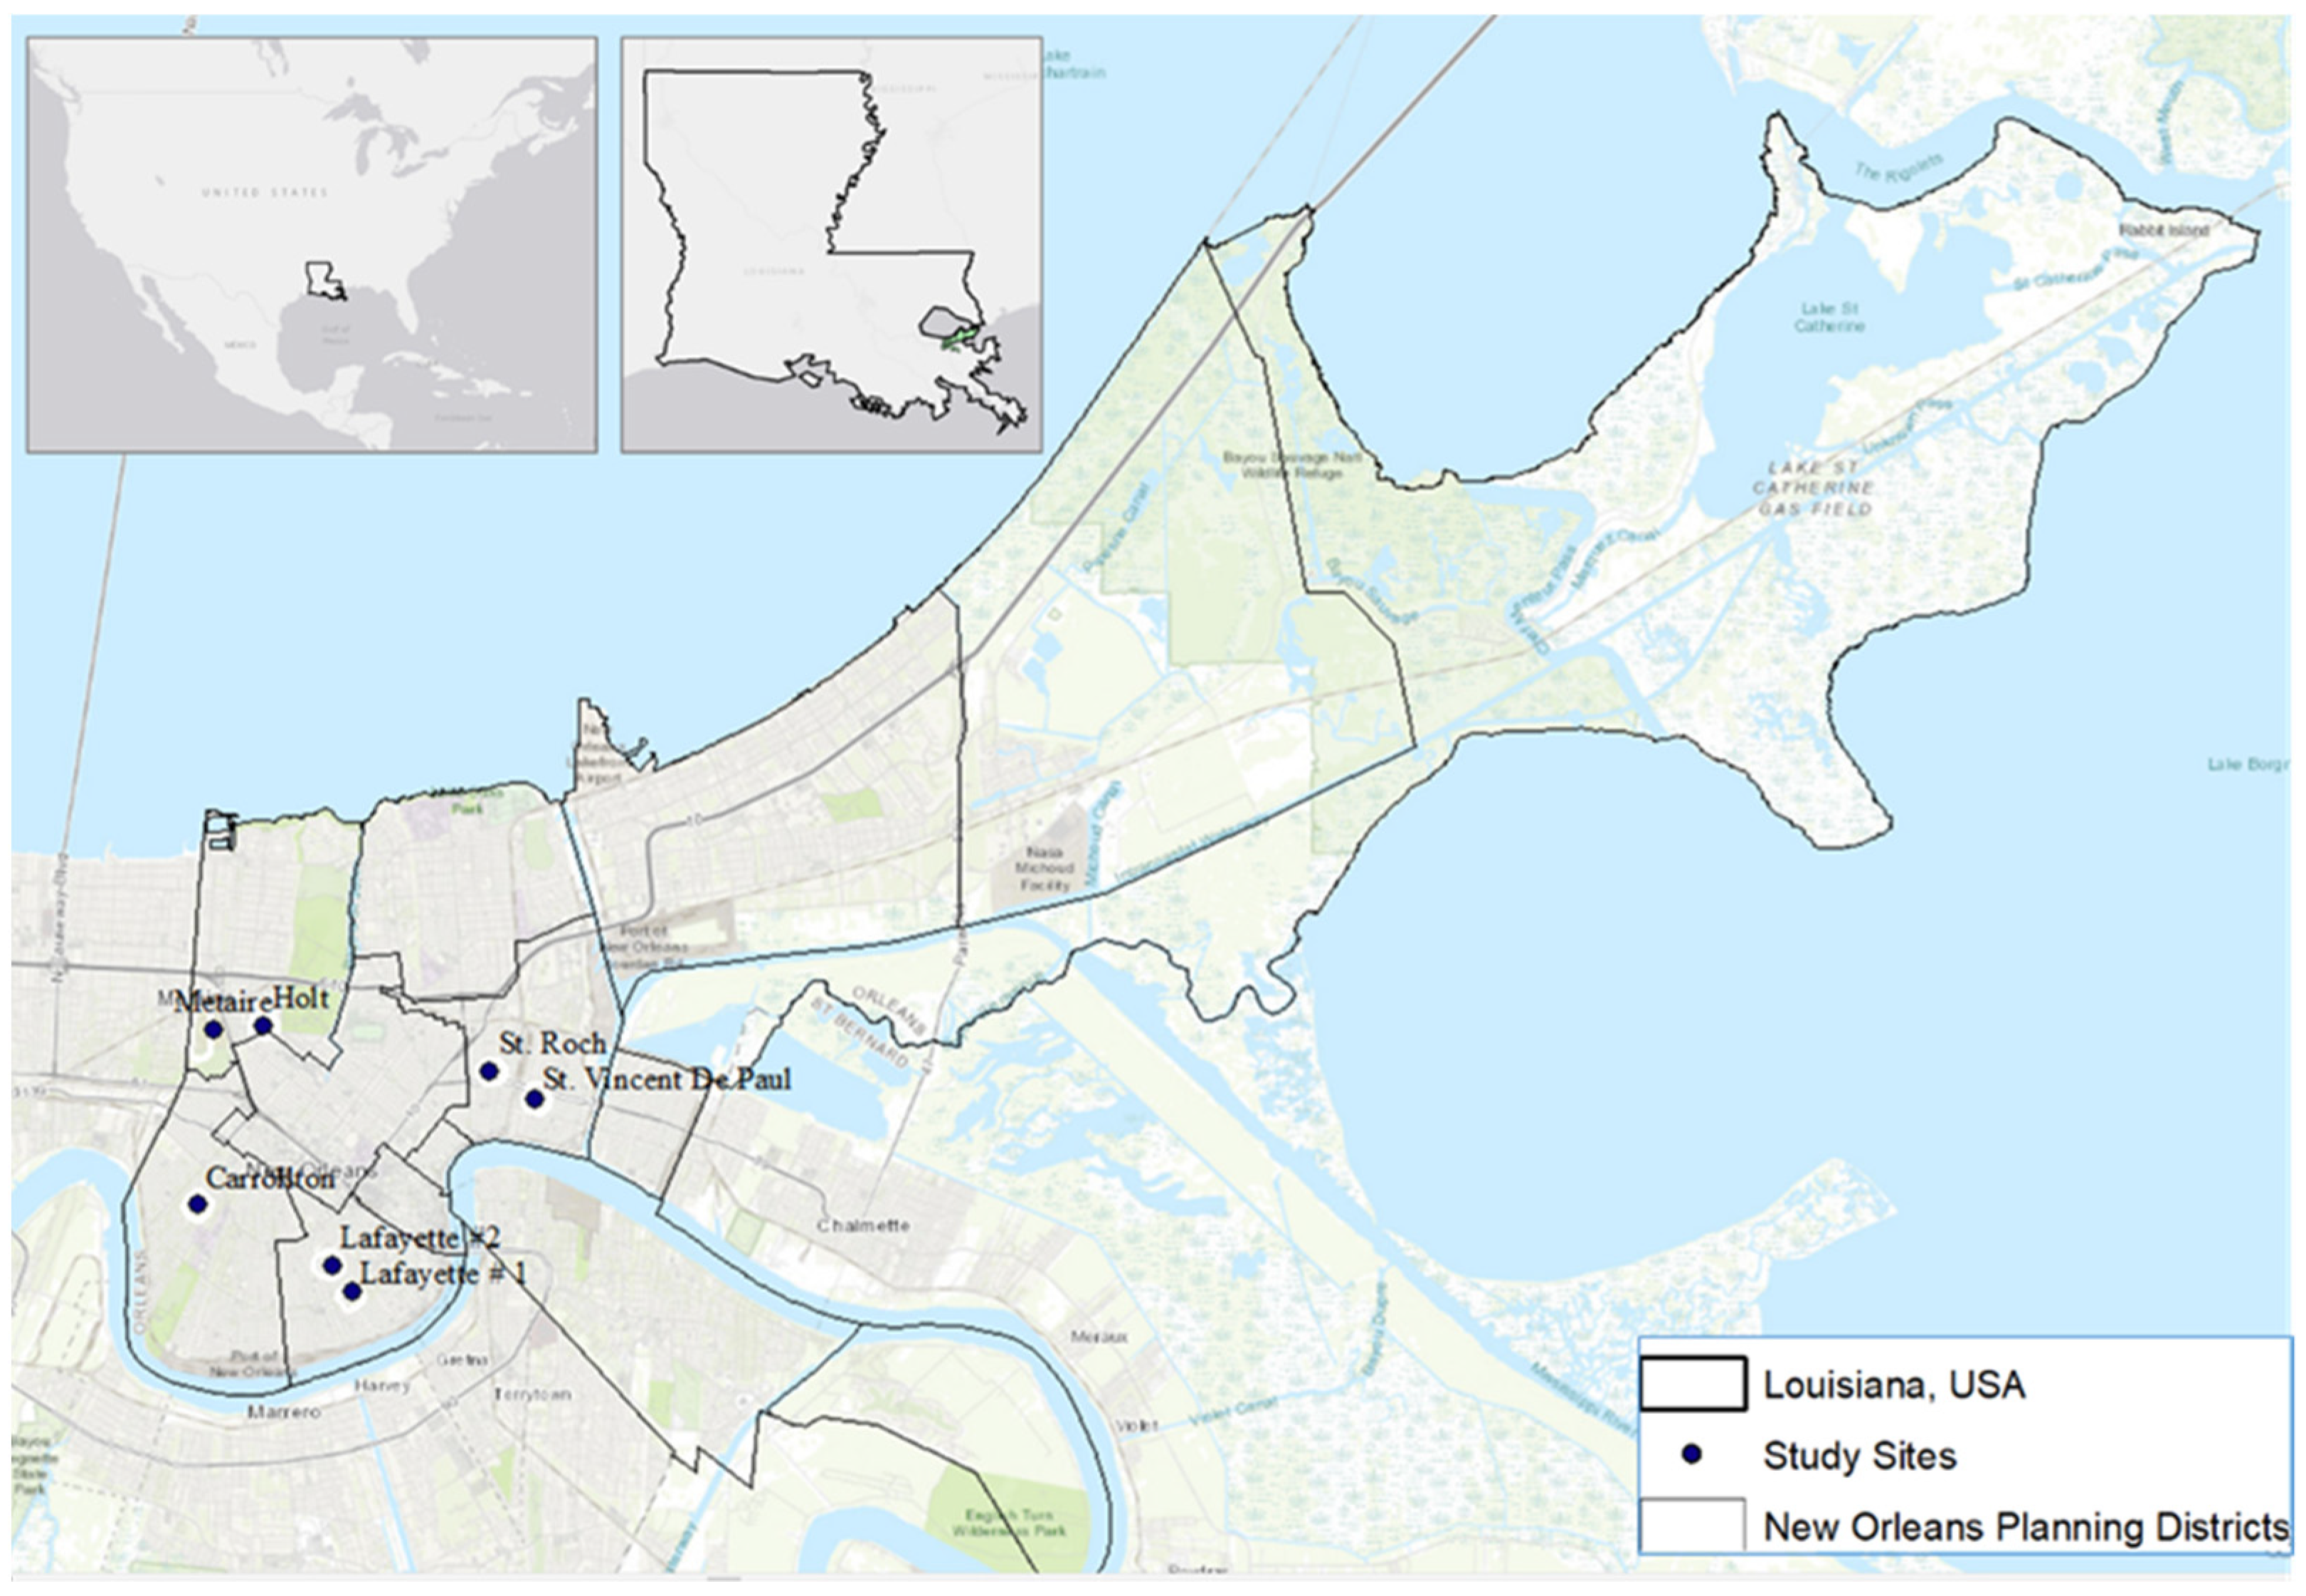
In this study, we evaluate linkages between temporal abiotic factors (rainfall, temperature), landscape level factors (UHI, vegetation cover, and income disparities), and microhabitat level factors (canopy cover) to the abundance patterns of Ae. aegypti and Ae. albopictus larvae in cemeteries of New Orleans, Louisiana. Our study approach used a multi-scale habitat evaluation (see graphical abstract), where abiotic drivers are contextualized with aspects of importance to spatial segregation at the cemetery scale, the container scale and temporally. We hypothesize that the two species coincide temporally in relation to rainfall and temperature suggesting overlap in their abiotic requirements in New Orleans. We hypothesize that Ae. albopictus’ sensitivity to heat limits its presence in un-vegetated heat islands within the city. At the micro-scale (cemetery vases), where larval competition is likely to occur, we hypothesize that canopy cover from trees would favor Ae. albopictus and exclude Ae. aegypti, due to the latter’s competitive inferiority in exploiting resources, particularly leaf litter.
4. Discussion
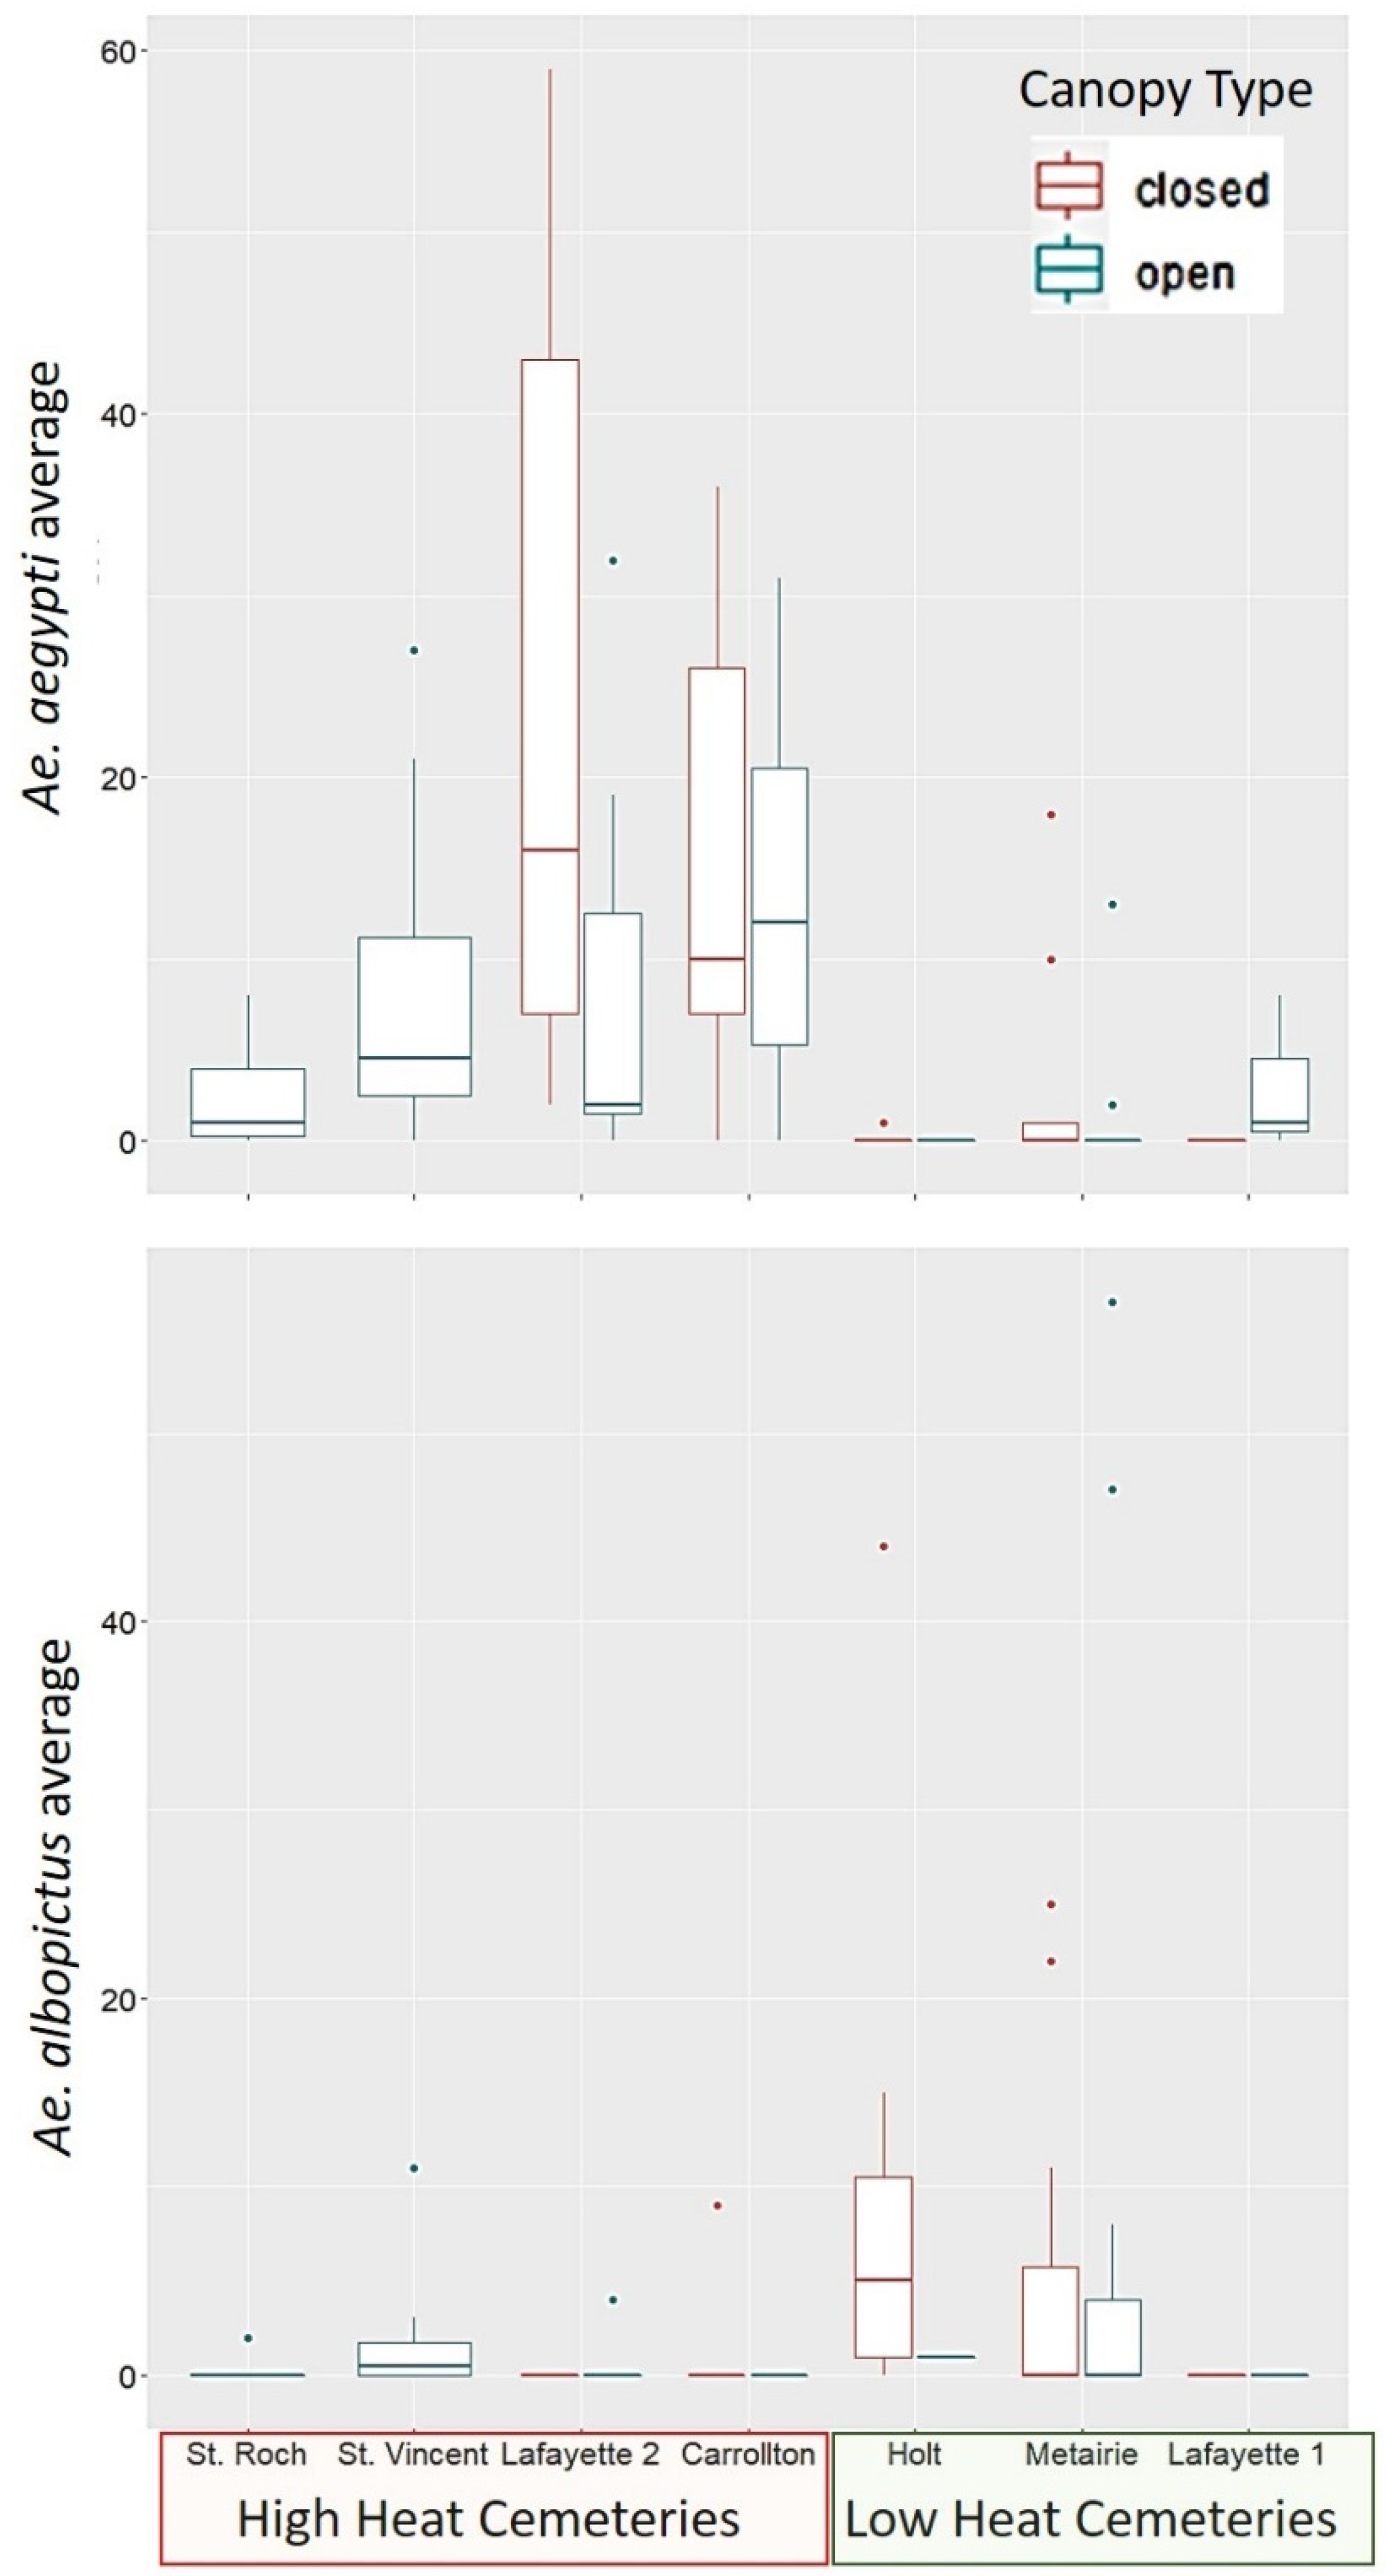
Our study found that
Ae. aegypti is a more abundant species than
Ae. albopictus in the area sampled within the city of New Orleans (
Figure 1). Within the cemeteries sampled,
Ae. aegypti was most closely associated to locations with a high heat index at the cemetery scale (UHI). While the results were not statistically significant for
Ae. albopictus, its distribution pattern shows the opposite trend, as the species was most often found in low heat cemeteries. These results suggest a spatial segregation pattern driven by heat tolerance of
Ae. aegypti, as proposed in our hypotheses. These findings also support previous studies that classify
Ae. aegypti as the more urban species, and
Ae. albopictus as more associated to vegetated suburban/rural areas in Florida, USA [
2,
32,
33], as well as several tropical cities [
2,
32,
34,
35,
36].
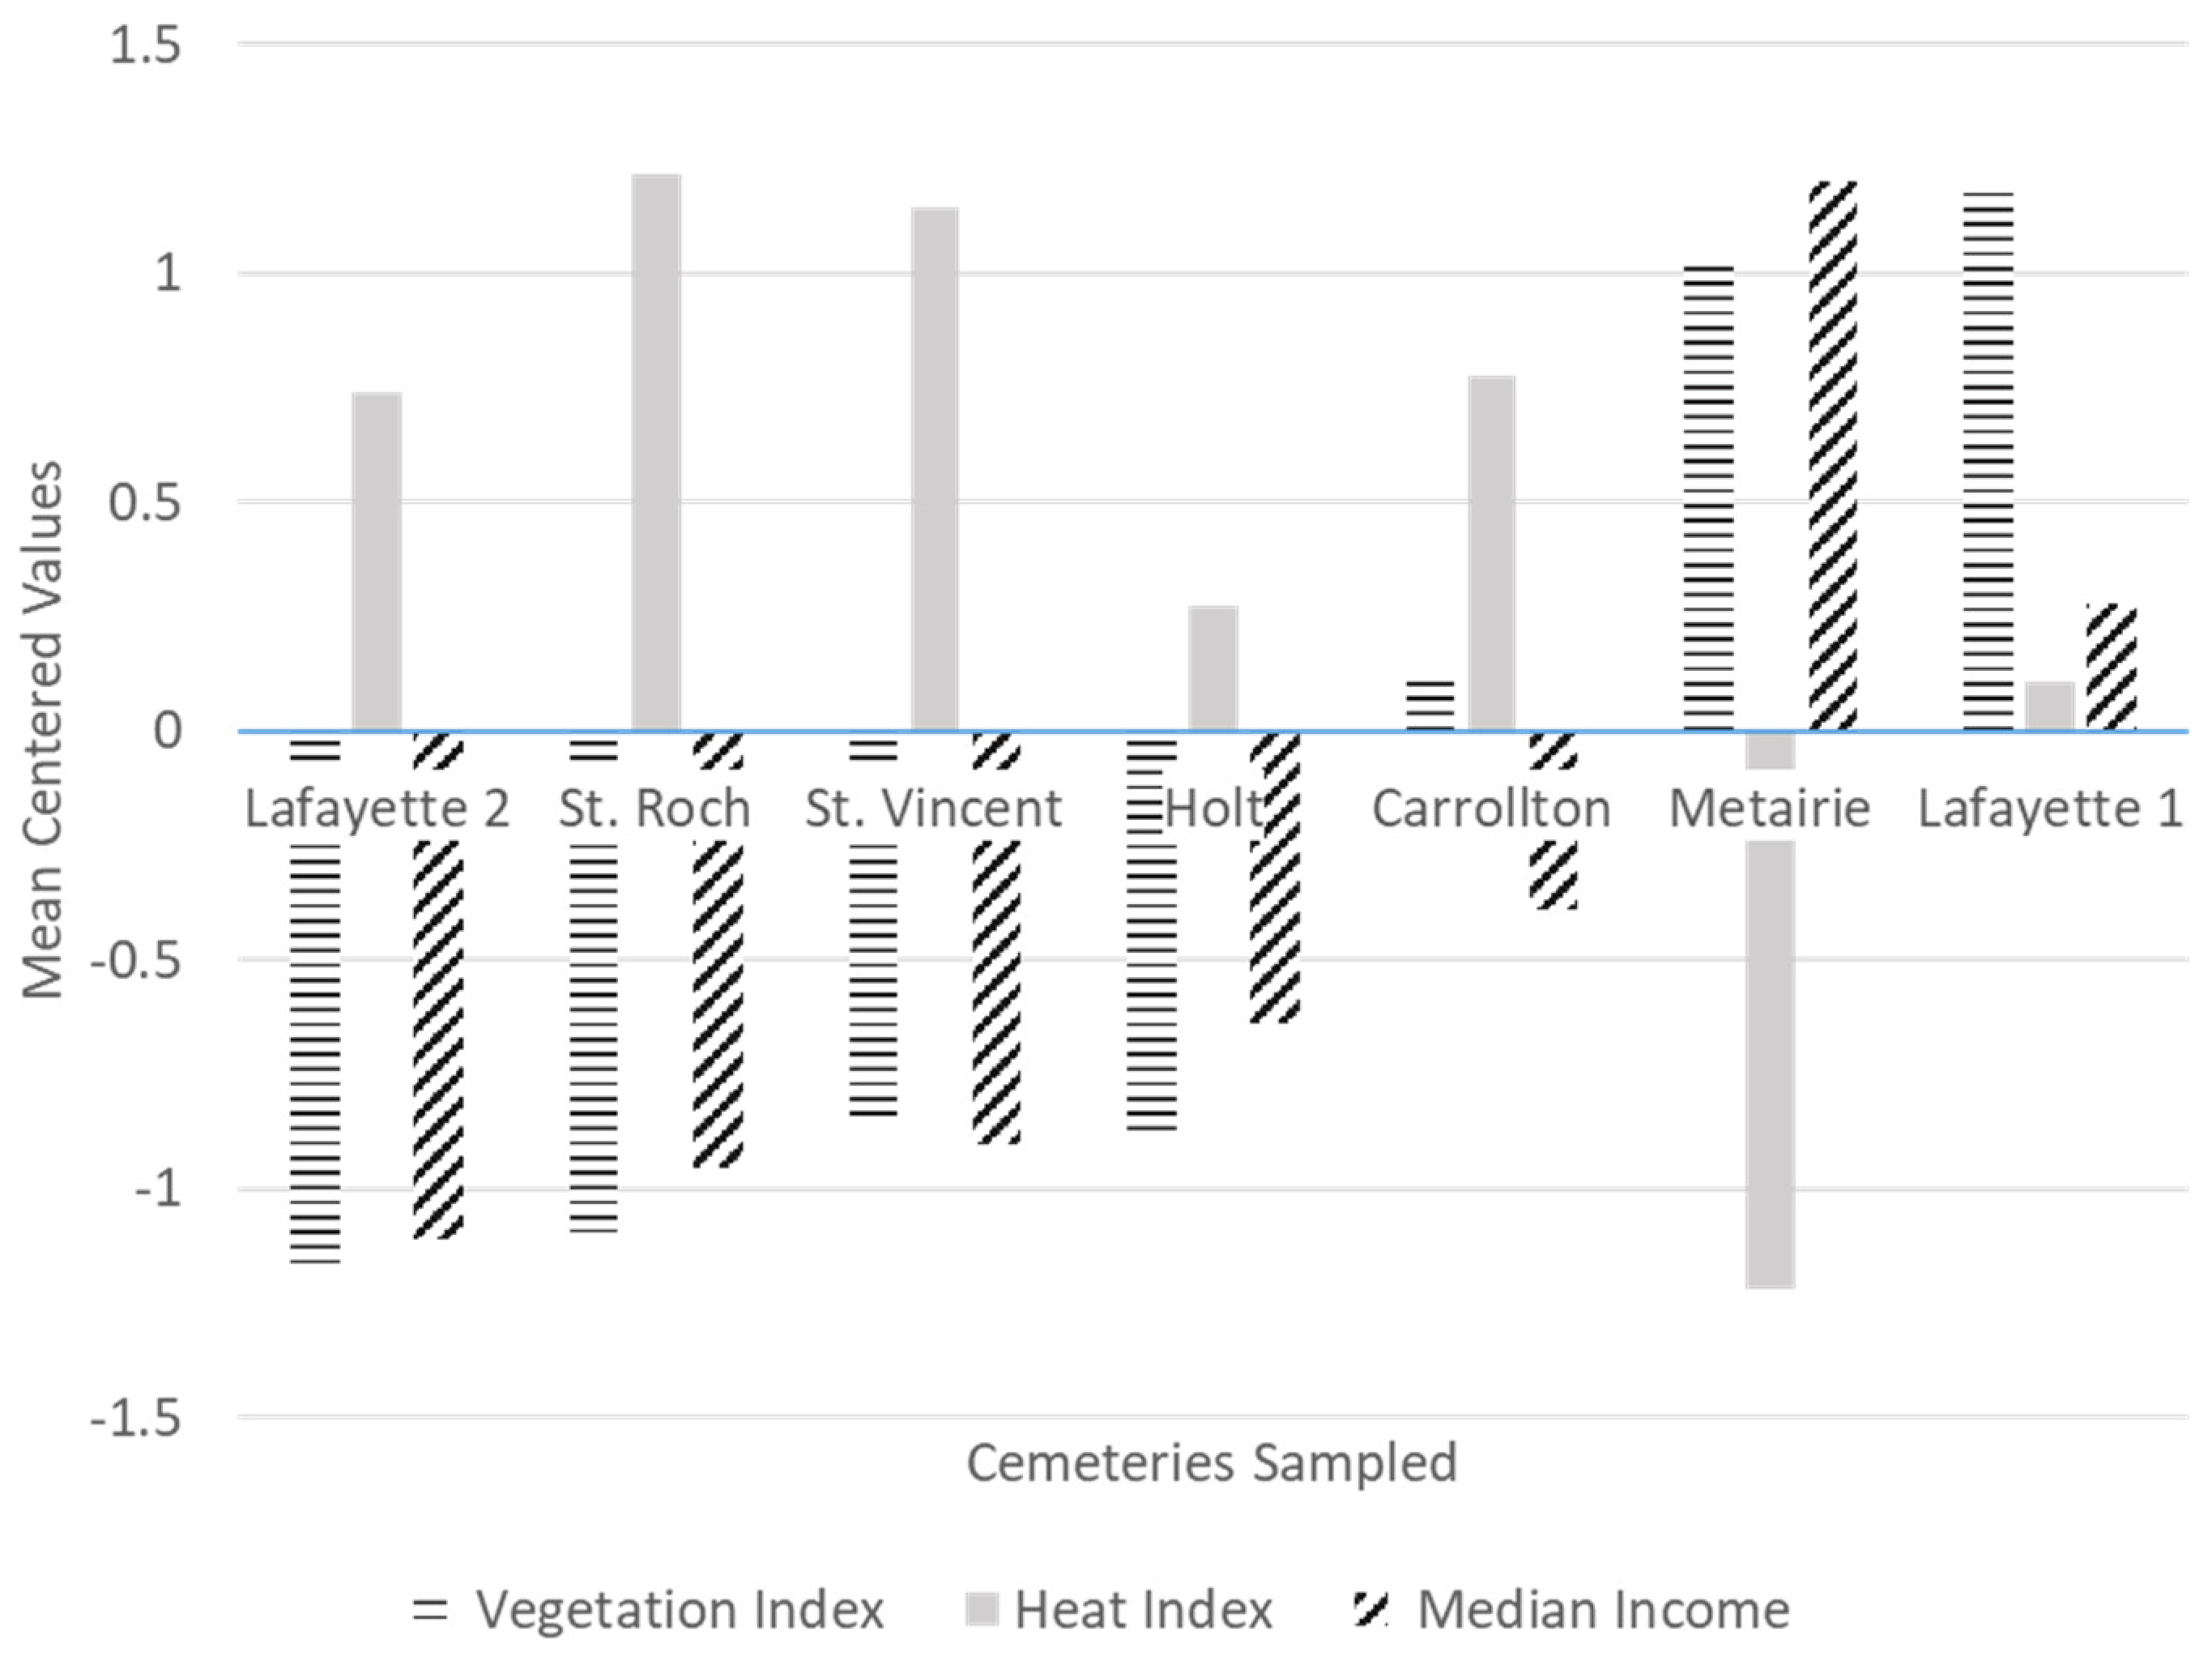
We observed in our study that heat was negatively correlated to vegetation cover, and negatively correlated to median income (
Appendix A). This suggests a disparity in terms of vegetation cover and heat exposure between low and high-income neighborhoods in New Orleans. More studies are needed to test this trend as we only sampled seven locations across the city. However, these findings are not surprising, as previous studies have reported unequal exposure to heat in low-income neighborhoods consistently across many cities of the USA [
37,
38]. Higher UHI exposure has been consistently shown to be linked to mortality and morbidity in humans [
11], while access to green spaces may promote a variety of physical and mental health benefits [
12]. Therefore, it would be important to further evaluate these apparent disparities to heat exposure and vegetation cover across socioeconomic divides in New Orleans.
Our findings show that high heat in particular exacerbates exposure to
Ae. aegypti, which, according to previous studies, is a more effective disease vector than
Ae. albopictus [
14,
15]. If we layer this finding with that of other studies suggesting how urban disrepair and abandonment create habitat for mosquitos and disproportionally affect low-income neighborhoods [
5,
6,
7,
8], we can see how there are multiple complex pathways by which poverty can be potentially linked to higher mosquito borne disease risk in our cities. Future studies should determine the role of mosquito habitat segregation in driving differences in relative disease risk within a city, accounting for differences in abundance and vector competence of the mosquito species present. Because of the tight correlation, we found that with UHI and income level in this study, we were not able to disentangle temperature related drivers, to container habitat availability drivers. The interaction between container habitat availability and UHI could present interesting dynamics for mosquito dispersal and therefore could be the basis for future research.
Contrary to our prediction, canopy cover at the container scale was not predictive of the presence of
Ae. albopictus. Moreover, contrary to our prediction, canopy cover was positively associated with
Ae. aegypti, in the locations were this species resided, which were high heat cemeteries, with low vegetation cover at the cemetery scale. Although
Ae. aegypti tolerates higher temperatures, it makes sense that it would prefer to be under shaded conditions in these high heat localities, to experience less desiccation risk, and less extreme heat. Due to the lack of significant association found between
Ae. albopictus to vegetation cover at any scale, our study does not support the hypothesis of habitat selection by this species is driven by the presence of trees and its competitive superiority at exploiting leaf litter. In laboratory studies,
Ae. albopictus shows a superior ability to exploit leaf litter [
39,
40], and a preference to lay eggs in water infused with leaf detritus over water only containers [
41]. However, there is no evidence in the literature that under natural conditions the species would preferentially select this food source, as it may be able to use other food sources available such as grass clippings and animal carcasses, which may offer more nutrient availability [
39,
40], and are not contingent on the presence of vegetation, or direct canopy cover.
The fact that
Ae. albopictus was lower in abundance than
Ae. aegypti in the sampled locations (which were all highly urbanized), and that the species was most often found in low heat cemeteries, suggests that temperature may be an important determinant of this species presence/absence across different parts of the city of New Orleans. Forecasting models have used the optimal temperature ranges for
Ae. aegypti (21.3–34.0 °C) and
Ae. albopictus (19.9–29.4 °C) to predict a decline in
Ae. albopictus in the tropics in response to projected temperature increases due climate change [
42]. It is possible that similar to climate driven temperature shifts, microscale variation in temperature ranges due UHI may also lead to temperature limits across a city’s landscape, shaping the segregation patterns of these two competing species.
Previous studies support the role of heat at limiting habitat suitability for
Ae. albopictus within cities. A study conducted across urban to rural gradient in Athens, GA found that adult abundance of the species increased with temperature until a threshold of about 30 °C, after which adult abundance declined [
43]. A similar study in Athens GA found that temperature was higher and relative humidity lower in urban vs. rural/suburban areas of the city, and that these microclimate differences resulted in lower
Ae. albopictus larvae survival in the urban sites [
44]. In Sao Paulo, where both species coexist, temperature increases have favored a greater expansion of
Ae. aegypti across the city, relative to
Ae. albopictus [
45]. Accordingly, dengue infections have been positively correlated to UHI in Sao Paulo [
46], while modelling studies using thermal optima for disease transmission suggest a higher thermal optimum for transmission of dengue by
Ae. aegypti (29.1 (28.4–29.8)) than
Ae. albopictus (26.4 (25.4–27.6); [
47]). Together, these studies support the role of microscale variation in temperature as shaping the species segregation patterns in urban landscapes, and point towards a potential link of these segregation patterns to arboviral infection risk, which should be explored further.
We found few instances of coexistence between the species at the container scale (~9% of samples,
Appendix B). The most frequent location for coexistence was in St. Vincent de Paul cemetery, which was a high heat cemetery dominated by
Ae. aegypti. This cemetery is located near multiple water bodies that may promote a temperature mitigation effect in its surroundings that was not assessed by this study. More studies are needed to determine the factors that allow
Ae. albopictus to inhabit this locality in spite of the high heat, and the potential role of proximity to water bodies as a mediating factor. Other instances where coexistence was detected at the vase level, shared the commonality of being closed canopy vases, and having
Ae. albopictus at a higher relative abundance (
Appendix B). These localities may be the focus of future studies to better assess the factors at the container scale that allow for coexistence, such as nutrient availability, and source and sink habitats.
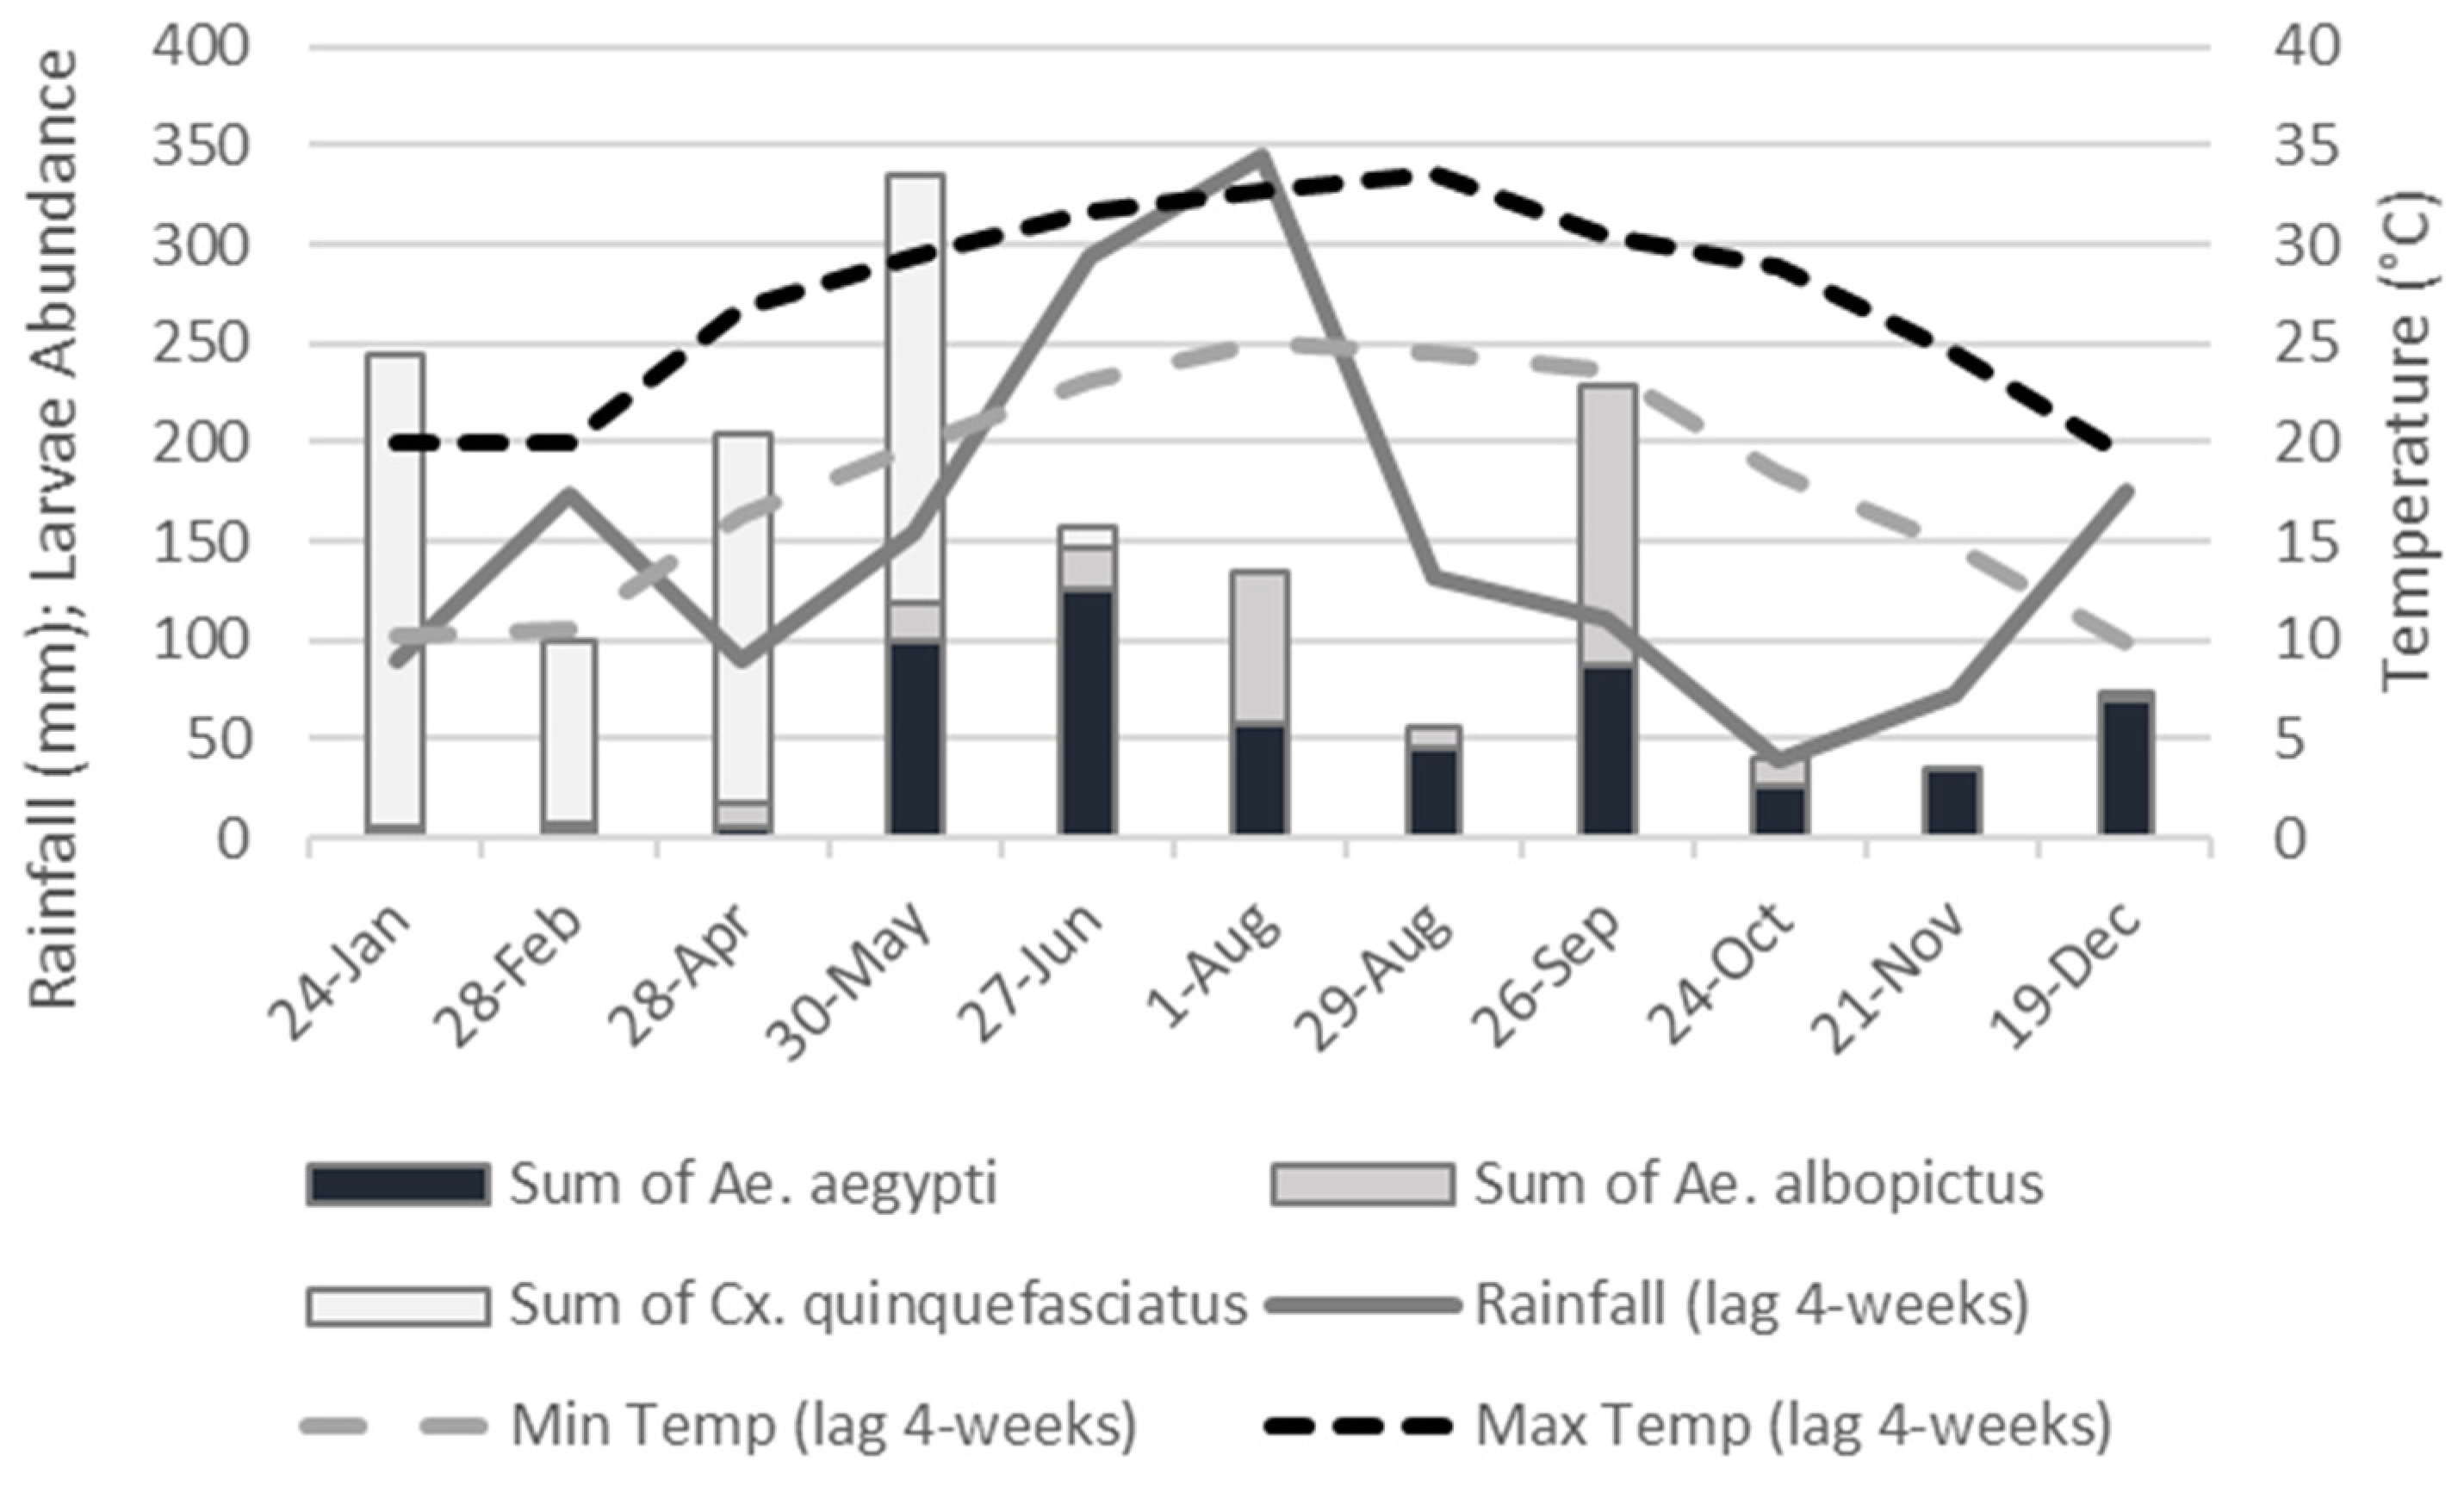
The most abundant species collected in this study was
Cx. quinquefasciatus, which was segregated temporally from the two
Aedes species in cemeteries. A previous study in Tampa, Florida found a similar pattern, where
Cx. quinquefasciatus switched habitat preference from cemeteries in the non-peak season, into other developed areas in the peak season, when the two
Aedes species became more dominant [
48]. The authors of the study suggest that coexistence among these competitors is enabled by spatial and seasonal segregation, and we provide further support for this finding in our study. We know from previous studies [
49,
50] and mosquito adult sampling in the city during 2020 (de Jesus, unpublished data) that
Cx. quinquefasciatus is still abundant during the peak mosquito season in New Orleans. Therefore, the observed trend potentially reflects habitat switching to avoid competition with
Ae. albopictus, which has been shown to be competitively superior to
Cx. quinquefasciatus and other similar species such as
Culex coronator, by laboratory studies testing interspecific competition under various resource levels [
51,
52].
Our study had several limitations. First, our monthly sampling was limited to seven cemeteries and one year of data. Longer-term studies at a larger scale would be necessary to fully understand spatiotemporal patterns of the mosquito species under study. Second, the temporal patterns reported on this study may have been affected by our sampling technique, which consisted of destructively sampling cemetery vases. This sampling strategy may have had an interference with the community assemblages in subsequent sampling events. However, since we limited our sampling to two cemetery vases per sampling occasion, while more were vases detected with water and larvae during our sampling, we think that our sampling interference was minimal. However, future studies may use non-destructive sampling strategies, such as oviposition traps to confirm our findings. Lastly, our sampling was limited to mosquito larvae, and we did not limit our collection to fourth instar larvae. Therefore, our survey does not fully reflect the outcomes of container scale competition or adult mosquito emergence, and more studies are needed to fully characterize the adult mosquito community assemblages across the city.


