
Expected Labor Market Affiliation: A New Method Illustrated by Estimating the Impact of Perceived Stress on Time in Work, Sickness Absence and Unemployment of 37,605 Danish Employees


Abstract
1. Introduction
2. Material and Methods
2.1. Study Design
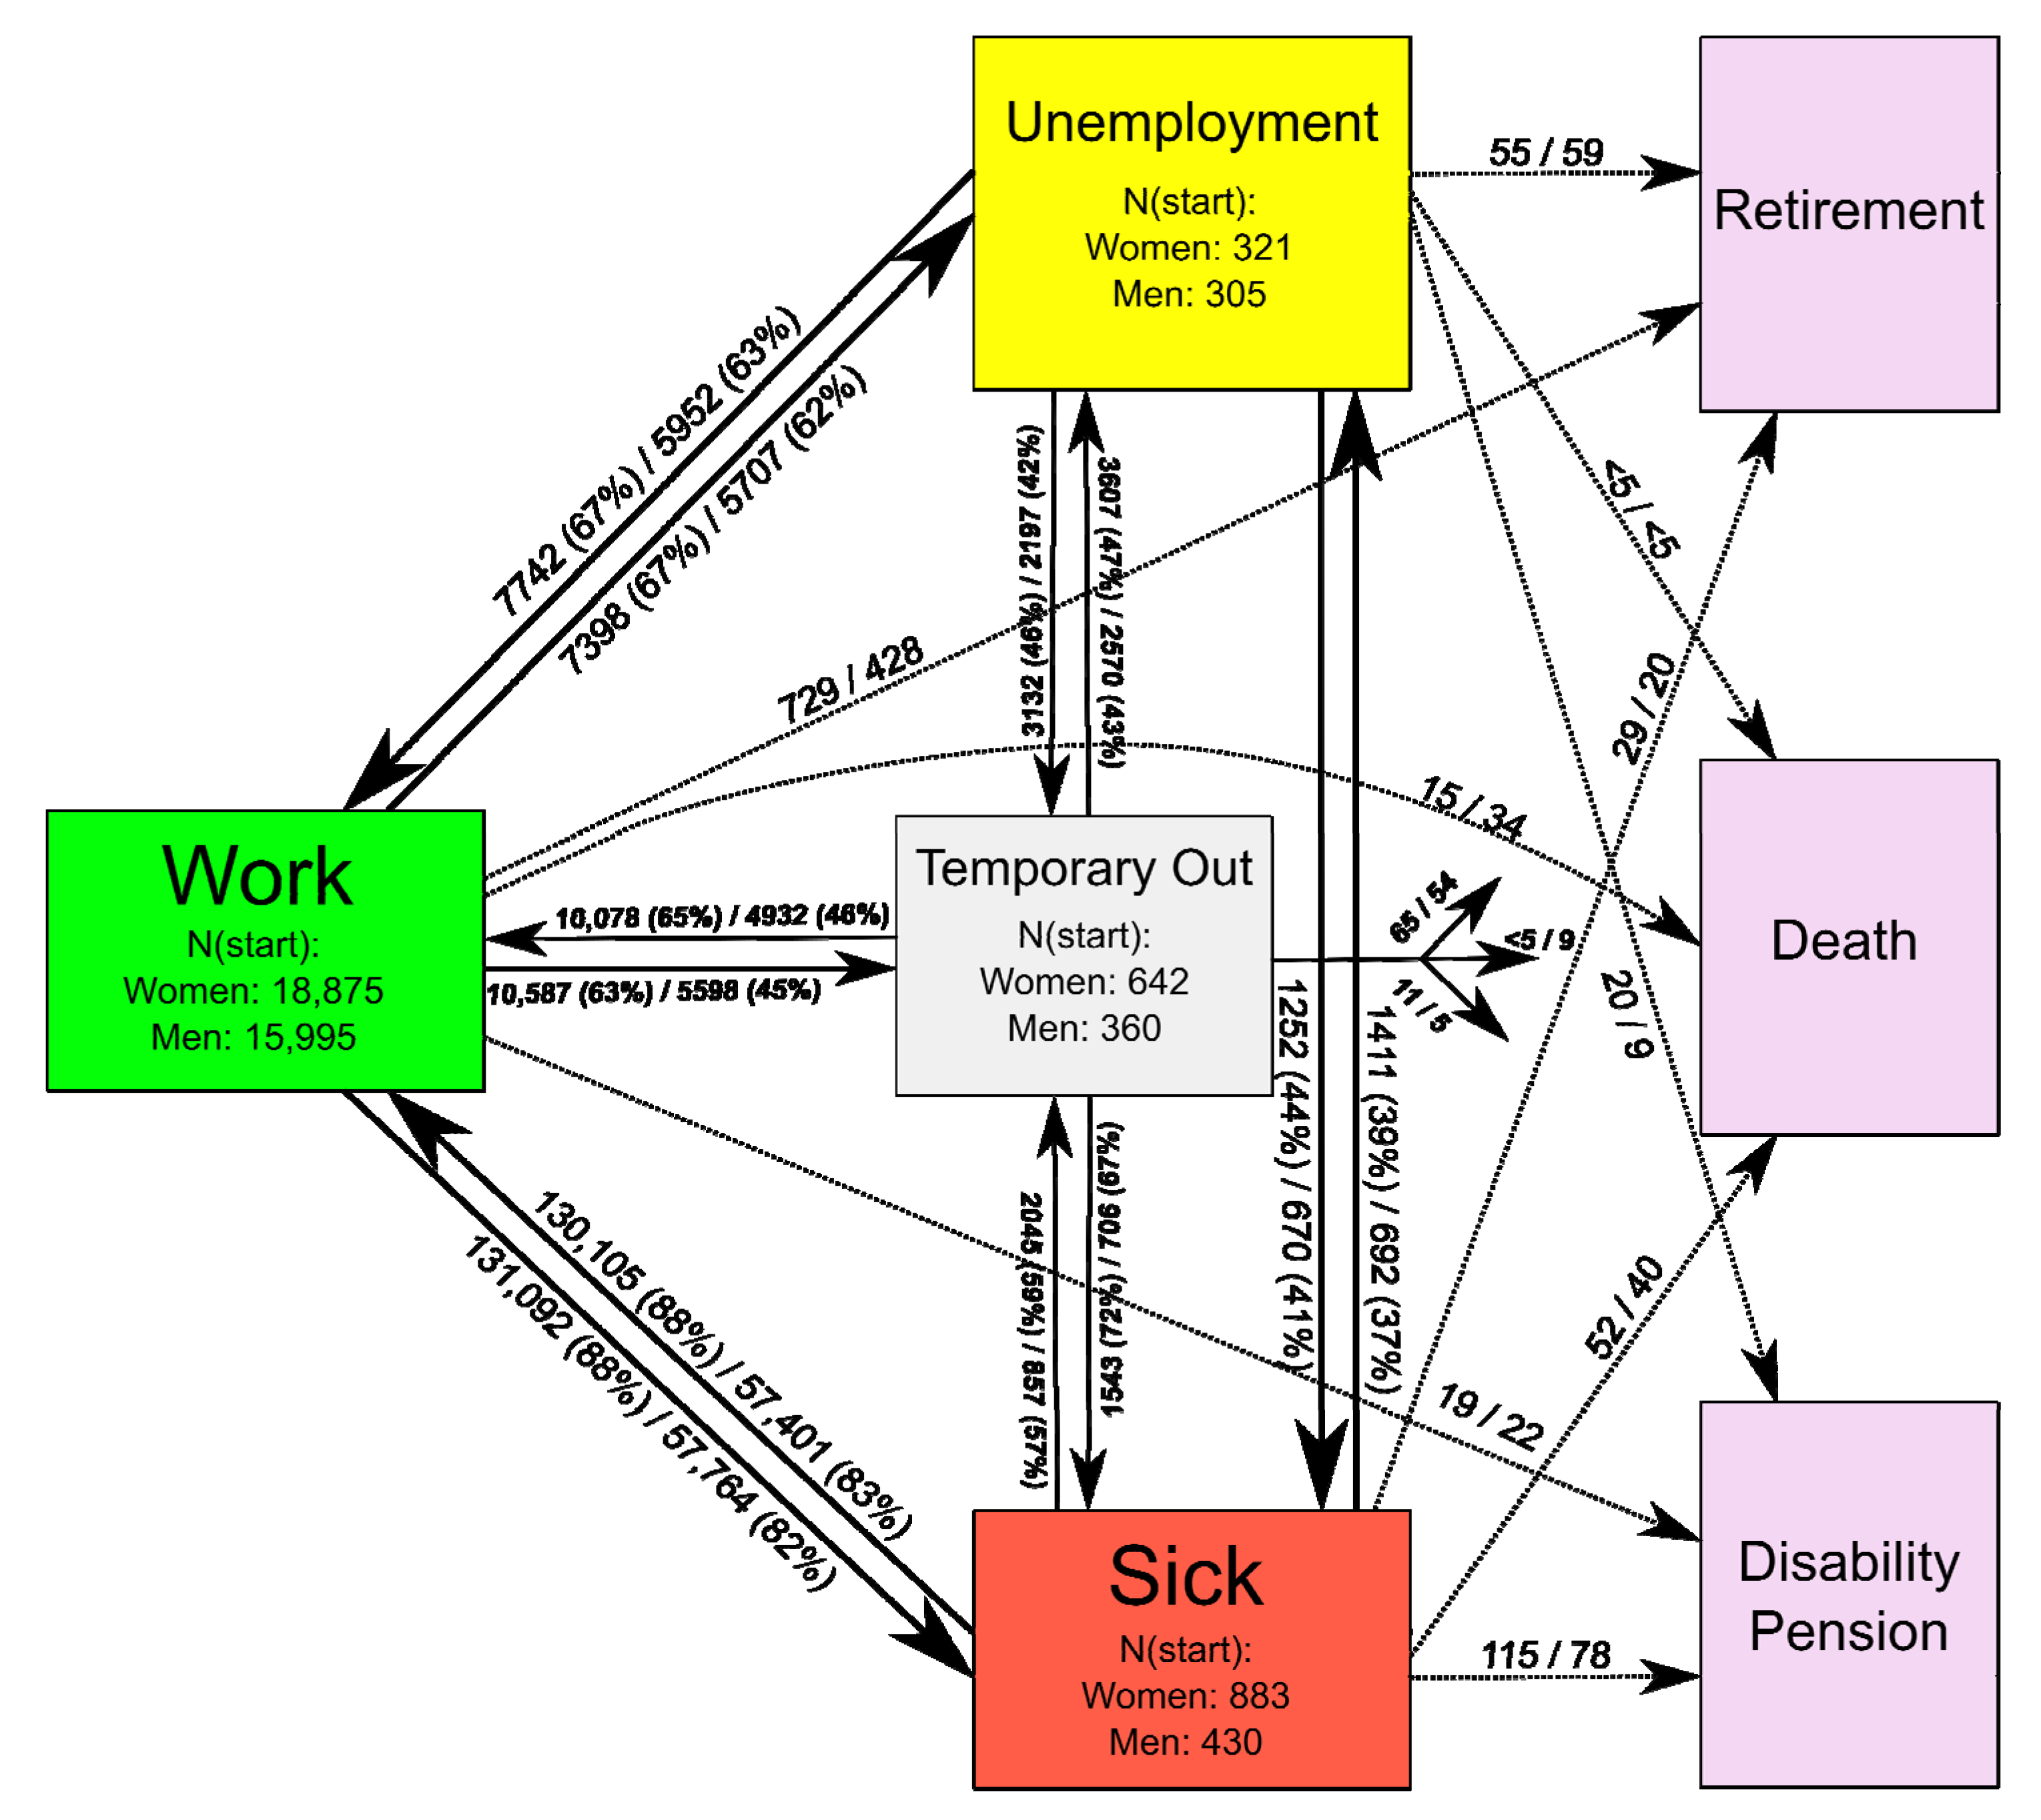
2.2. Labor Market Affiliation States
2.3. Perceived Stress
2.4. Covariates
2.5. Statistical Analyses
3. Results
Sample Characteristics
4. Discussion
4.1. Advantages and Disadvantages of the ELMA Method
4.2. Comparison with Previous Studies
4.3. Strengths and Limitations
5. Conclusions
Supplementary Materials
Author Contributions
Funding
Institutional Review Board Statement
Informed Consent Statement
Data Availability Statement
Conflicts of Interest
References
- Ilmarinen, J. The Ageing Workforce—Challenges for Occupational Health. Occup. Med. 2006, 56, 362–364. [Google Scholar] [CrossRef]
- Nurminen, M.; Nurminen, T. Multistate Worklife Expectancies. Scand. J. Work. Environ. Health 2005, 31, 169–178. [Google Scholar] [CrossRef]
- Pedersen, J.; Bjorner, J.B. Worklife Expectancy in a Cohort of Danish Employees Aged 55-65 Years-Comparing a Multi-State Cox Proportional Hazard Approach with Conventional Multi-State Life Tables. BMC Public Health 2017, 17, 879. [Google Scholar] [CrossRef] [PubMed]
- Jagger, C.; Cox, B.; Le Roy, S. Health Expectancy Calculation by the Sullivan Method, 3rd ed.; EHEMU Technical Report September; Available online: https://webgate.ec.europa.eu/chafea_pdb/assets/files/pdb/2006109/2006109_d5sullivan_guide_final_jun2007.pdf (accessed on 25 March 2021).
- Pedersen, J.; Thorsen, S.V.; Andersen, M.F.; Hanvold, T.N.; Schlünssen, V.; Bültmann, U. Impact of Depressive Symptoms on Worklife Expectancy: A Longitudinal Study on Danish Employees. Occup. Environ. Med. 2019, 76, 838–844. [Google Scholar] [CrossRef]
- Robroek, S.J.; Nieboer, D.; Järvholm, B.; Burdorf, A. Educational Differences in Duration of Working Life and Loss of Paid Employment: Working Life Expectancy in The Netherlands. Scand. J. Work. Environ. Health 2019, 46, 77–84. [Google Scholar] [CrossRef] [PubMed]
- Pedersen, J.; Schultz, B.B.; Madsen, I.E.H.; Solovieva, S.; Andersen, L.L. High Physical Work Demands and Working Life Expectancy in Denmark. Occup. Environ. Med. 2020, 77, 576–582. [Google Scholar] [CrossRef]
- Schram, J.L.; Solovieva, S.; Leinonen, T.; Viikari-Juntura, E.; Burdorf, A.; Robroek, S.J. The Influence of Occupational Class and Physical Workload on Working Life Expectancy among Older Employees. Scand. J. Work. Environ. Health 2021, 47, 5–14. [Google Scholar] [CrossRef]
- Scheike, T.H.; Zhang, M.-J. Direct Modelling of Regression Effects for Transition Probabilities in Multistate Models. Scand. J. Stat. 2007, 34, 17–32. [Google Scholar] [CrossRef]
- Mansourvar, Z.; Martinussen, T.; Scheike, T.H. An Additive–Multiplicative Restricted Mean Residual Life Model. Scand. J. Stat. 2016, 43, 487–504. [Google Scholar] [CrossRef]
- Lie, S.A.; Tveito, T.H.; Reme, S.E.; Eriksen, H.R. IQ and Mental Health are Vital Predictors of Work Drop Out and Early Mortality. Multi-State Analyses of Norwegian Male Conscripts. PLoS ONE 2017, 12, e0180737. [Google Scholar] [CrossRef] [PubMed]
- Cohen, S.; Kamarck, T.; Mermelstein, R. A Global Measure of Perceived Stress. J. Health Soc. Behav. 1983, 24, 385–396. [Google Scholar] [CrossRef]
- Nieuwenhuijsen, K.; Bruinvels, D.; Frings-Dresen, M. Psychosocial Work Environment and Stress-Related Disorders, a Systematic Review. Occup. Med. 2010, 60, 277–286. [Google Scholar] [CrossRef] [PubMed]
- Holmgren, K.; Fjällström-Lundgren, M.; Hensing, G. Early Identification of Work-Related Stress Predicted Sickness Absence in Employed Women with Musculoskeletal or Mental Disorders: A Prospective, Longitudinal Study in a Primary Health Care Setting. Disabil. Rehabil. 2012, 35, 418–426. [Google Scholar] [CrossRef] [PubMed]
- Theorell, T.; Hammarström, A.; Gustafsson, P.E.; Hanson, L.M.; Janlert, U.; Westerlund, H. Job Strain and Depressive Symptoms in Men and Women: A Prospective Study of the Working Population in Sweden. J. Epidemiol. Community Health 2013, 68, 78–82. [Google Scholar] [CrossRef]
- Mather, L.; Bergström, G.; Blom, V.; Svedberg, P. High Job Demands, Job Strain, and Iso-Strain Are Risk Factors for Sick Leave due to Mental Disorders. J. Occup. Environ. Med. 2015, 57, 858–865. [Google Scholar] [CrossRef]
- Thorsen, S.V.; Pedersen, J.; Flyvholm, M.-A.; Kristiansen, J.; Rugulies, R.; Bültmann, U. Perceived Stress and Sickness Absence: A Prospective Study of 17,795 Employees in Denmark. Int. Arch. Occup. Environ. Health 2019, 92, 821–828. [Google Scholar] [CrossRef]
- The Danish Survey the National Health Profile from 2010. 2013; ISBN 978-87-7104-956. Available online: https://www.sst.dk/da/udgivelser/2018/~/media/73EADC242CDB46BD8ABF9DE895A6132C.ashx (accessed on 25 March 2021).
- Christensen, K.B.; Andersen, P.K.; Smith-Hansen, L.; Nielsen, M.L.; Kristensen, T.S. Analyzing Sickness Absence with Statistical Models for Survival Data. Scand. J. Work. Environ. Health 2007, 33, 233–239. [Google Scholar] [CrossRef]
- Gran, J.M.; Lie, S.A.; Øyeflaten, I.; Borgan, Ø.; Aalen, O.O. Causal Inference in Multi-State Models-Sickness Absence and Work for 1145 Participants after Work Rehabilitation. BMC Public Health 2015, 15, 1082. [Google Scholar] [CrossRef]
- Cpr.dk. Available online: https://cpr.dk/english/moving-to-denmark/ (accessed on 18 March 2021).
- Hernán, M.Á.; Brumback, B.; Robins, J.M. Marginal Structural Models to Estimate the Causal Effect of Zidovudine on the Survival of HIV-Positive Men. Epidemiology 2000, 11, 561–570. [Google Scholar] [CrossRef] [PubMed]
- Heinze, G. The Application of Firth’s Procedure to Cox and Logistic Regression. Available online: https://www.academia.edu/2658217/The_application_of_Firth_s_procedure_to_Cox_and_logistic_regression (accessed on 25 March 2021).
- Lie, S.A.; Eriksen, H.R.; Ursin, H.; Hagen, E.M. A Multi-State Model for Sick-Leave Data Applied to a Randomized Control Trial Study of Low Back Pain. Scand. J. Public Health 2008, 36, 279–283. [Google Scholar] [CrossRef] [PubMed]
- Andersen, P.K.; Keiding, N. Multi-State Models for Event History Analysis. Stat. Methods Med. Res. 2002, 11, 91–115. [Google Scholar] [CrossRef]
- Beyersmann, J.; Putter, H. A Brief Note on Computing Average State Occupation Times. Demogr. Res. 2014, 30, 1681–1696. [Google Scholar] [CrossRef]
- Pedersen, J.; Bjorner, J.B.; Burr, H.; Christensen, K.B. Transitions between Sickness Absence, Work, Unemployment, and Disability in Denmark 2004. Scand. J. Work. Environ. Health 2012, 38, 516–526. [Google Scholar] [CrossRef]
- Allebeck, P.; Mastekaasa, A. Chapter 5. Risk Factors for Sick Leave-General Studies. Scand. J. Public Health 2004, 32, 49–108. [Google Scholar] [CrossRef]
- Barmby, T.A.; Ercolani, M.G.; Treble, J.G. Sickness Absence: An International Comparison. Econ. J. 2002, 112, F315–F331. [Google Scholar] [CrossRef]
- Sørensen, J.K.; Framke, E.; Clausen, T.; Garde, A.H.; Johnsen, N.F.; Kristiansen, J.; Madsen, I.E.; Nordentoft, M.; Rugulies, R. Leadership Quality and Risk of Long-Term Sickness Absence Among 53,157 Employees of the Danish Workforce. J. Occup. Environ. Med. 2020, 62, 557–565. [Google Scholar] [CrossRef] [PubMed]
- Trolle, N.; Lund, T.; Winding, T.N.; Labriola, M. Perceived Stress among 20-21 Year-Olds and Their Future Labour Market Participation—an Eight-Year Follow-Up Study. BMC Public Health 2017, 17, 287. [Google Scholar] [CrossRef]
- Arbejdsmiljodata.nfa.dk. Available online: https://arbejdsmiljodata.nfa.dk/metode.html (accessed on 18 March 2021).
- Egan, M.; Bambra, C.; Thomas, S.; Petticrew, M.; Whitehead, M.; Thomson, H. The Psychosocial and Health Effects of Workplace Reorganisation 1. A Systematic Review of Organisational-Level Interventions that Aim to Increase Employee Control. J. Epidemiol. Community Health 2007, 61, 945–954. [Google Scholar] [CrossRef]


| Group | Level | Women | Men | ||||
|---|---|---|---|---|---|---|---|
| Young Employees n (%) | Middle-Aged Employees n (%) | Older Employees n (%) | Young Employees n (%) | Middle-Aged Employees n (%) | Older Employees n (%) | ||
| Total: | 6782 | 6691 | 7110 | 5530 | 5428 | 6064 | |
| Perceived stress | No | 5638 (83.1) | 5649 (84.4) | 5974 (84.0) | 4888 (88.4) | 4776 (88.0) | 5416 (89.3) |
| Work-related | 550 (8.1) | 539 (8.1) | 686 (9.6) | 310 (5.6) | 373 (6.9) | 431 (7.1) | |
| Work and personal life-related | 594 (8.8) | 503 (7.5) | 450 (6.3) | 332 (6.0) | 279 (5.1) | 217 (3.6) | |
| Smoking | Non-smoker | 4767 (70.3) | 5209 (77.9) | 5445 (76.6) | 3934 (71.1) | 4170 (76.8) | 4519 (74.5) |
| Smoker | 1155 (17.0) | 1220 (18.2) | 1422 (20.0) | 1225 (22.2) | 1096 (20.2) | 1319 (21.8) | |
| Not Available | 860 (12.7) | 262 (3.9) | 243 (3.4) | 371 (6.7) | 162 (3.0) | 226 (3.7) | |
| BMI | Underweight | 197 (2.9) | 78 (1.2) | 107 (1.5) | 42 (0.8) | 7 (0.1) | 12 (0.2) |
| Normal weight | 3849 (56.8) | 3656 (54.6) | 3731 (52.5) | 2755 (49.8) | 2031 (37.4) | 2050 (33.8) | |
| Overweight | 1204 (17.8) | 1721 (25.7) | 2048 (28.8) | 1788 (32.3) | 2423 (44.6) | 2816 (46.4) | |
| Obese | 632 (9.3) | 932 (13.9) | 932 (13.1) | 562 (10.2) | 795 (14.6) | 940 (15.5) | |
| Not Available | 900 (13.3) | 304 (4.5) | 292 (4.1) | 383 (6.9) | 172 (3.2) | 246 (4.1) | |
| Education | Low | 577 (8.5) | 535 (8.0) | 1207 (17.0) | 821 (14.8) | 704 (13.0) | 1068 (17.6) |
| Middle | 2609 (38.5) | 2884 (43.1) | 2844 (40.0) | 2509 (45.4) | 2596 (47.8) | 3002 (49.5) | |
| High | 3572 (52.7) | 3257 (48.7) | 3033 (42.7) | 2158 (39.0) | 2089 (38.5) | 1941 (32.0) | |
| Not Available | 24 (0.4) | 15 (0.2) | 26 (0.4) | 42 (0.8) | 39 (0.7) | 53 (0.9) | |
| Employment sector | Private | 2113 (31.2) | 1973 (29.5) | 1652 (23.2) | 2806 (50.7) | 2946 (54.3) | 2909 (48.0) |
| Public | 3938 (58.1) | 3805 (56.9) | 4571 (64.3) | 1379 (24.9) | 1174 (21.6) | 1695 (28.0) | |
| Not Available | 731 (10.8) | 913 (13.6) | 887 (12.5) | 1345 (24.3) | 1308 (24.1) | 1460 (24.1) | |
| Work-time arrangement | Full-time | 3711 (54.7) | 4311 (64.4) | 4326 (60.8) | 4492 (81.2) | 4939 (91.0) | 5414 (89.3) |
| Part-time | 2175 (32.1) | 2071 (31.0) | 2432 (34.2) | 646 (11.7) | 269 (5.0) | 312 (5.1) | |
| Not Available | 896 (13.2) | 309 (4.6) | 352 (5.0) | 392 (7.1) | 220 (4.1) | 338 (5.6) | |
| Survey year | 2012 | 2552 (37.6) | 2082 (31.1) | 2054 (28.9) | 2025 (36.6) | 1760 (32.4) | 1791 (29.5) |
| 2014 | 1620 (23.9) | 1902 (28.4) | 2171 (30.5) | 2230 (40.3) | 2181 (40.2) | 2411 (39.8) | |
| 2012 + 2014 | 2610 (38.5) | 2707 (40.5) | 2885 (40.6) | 1275 (23.1) | 1487 (27.4) | 1862 (30.7) | |
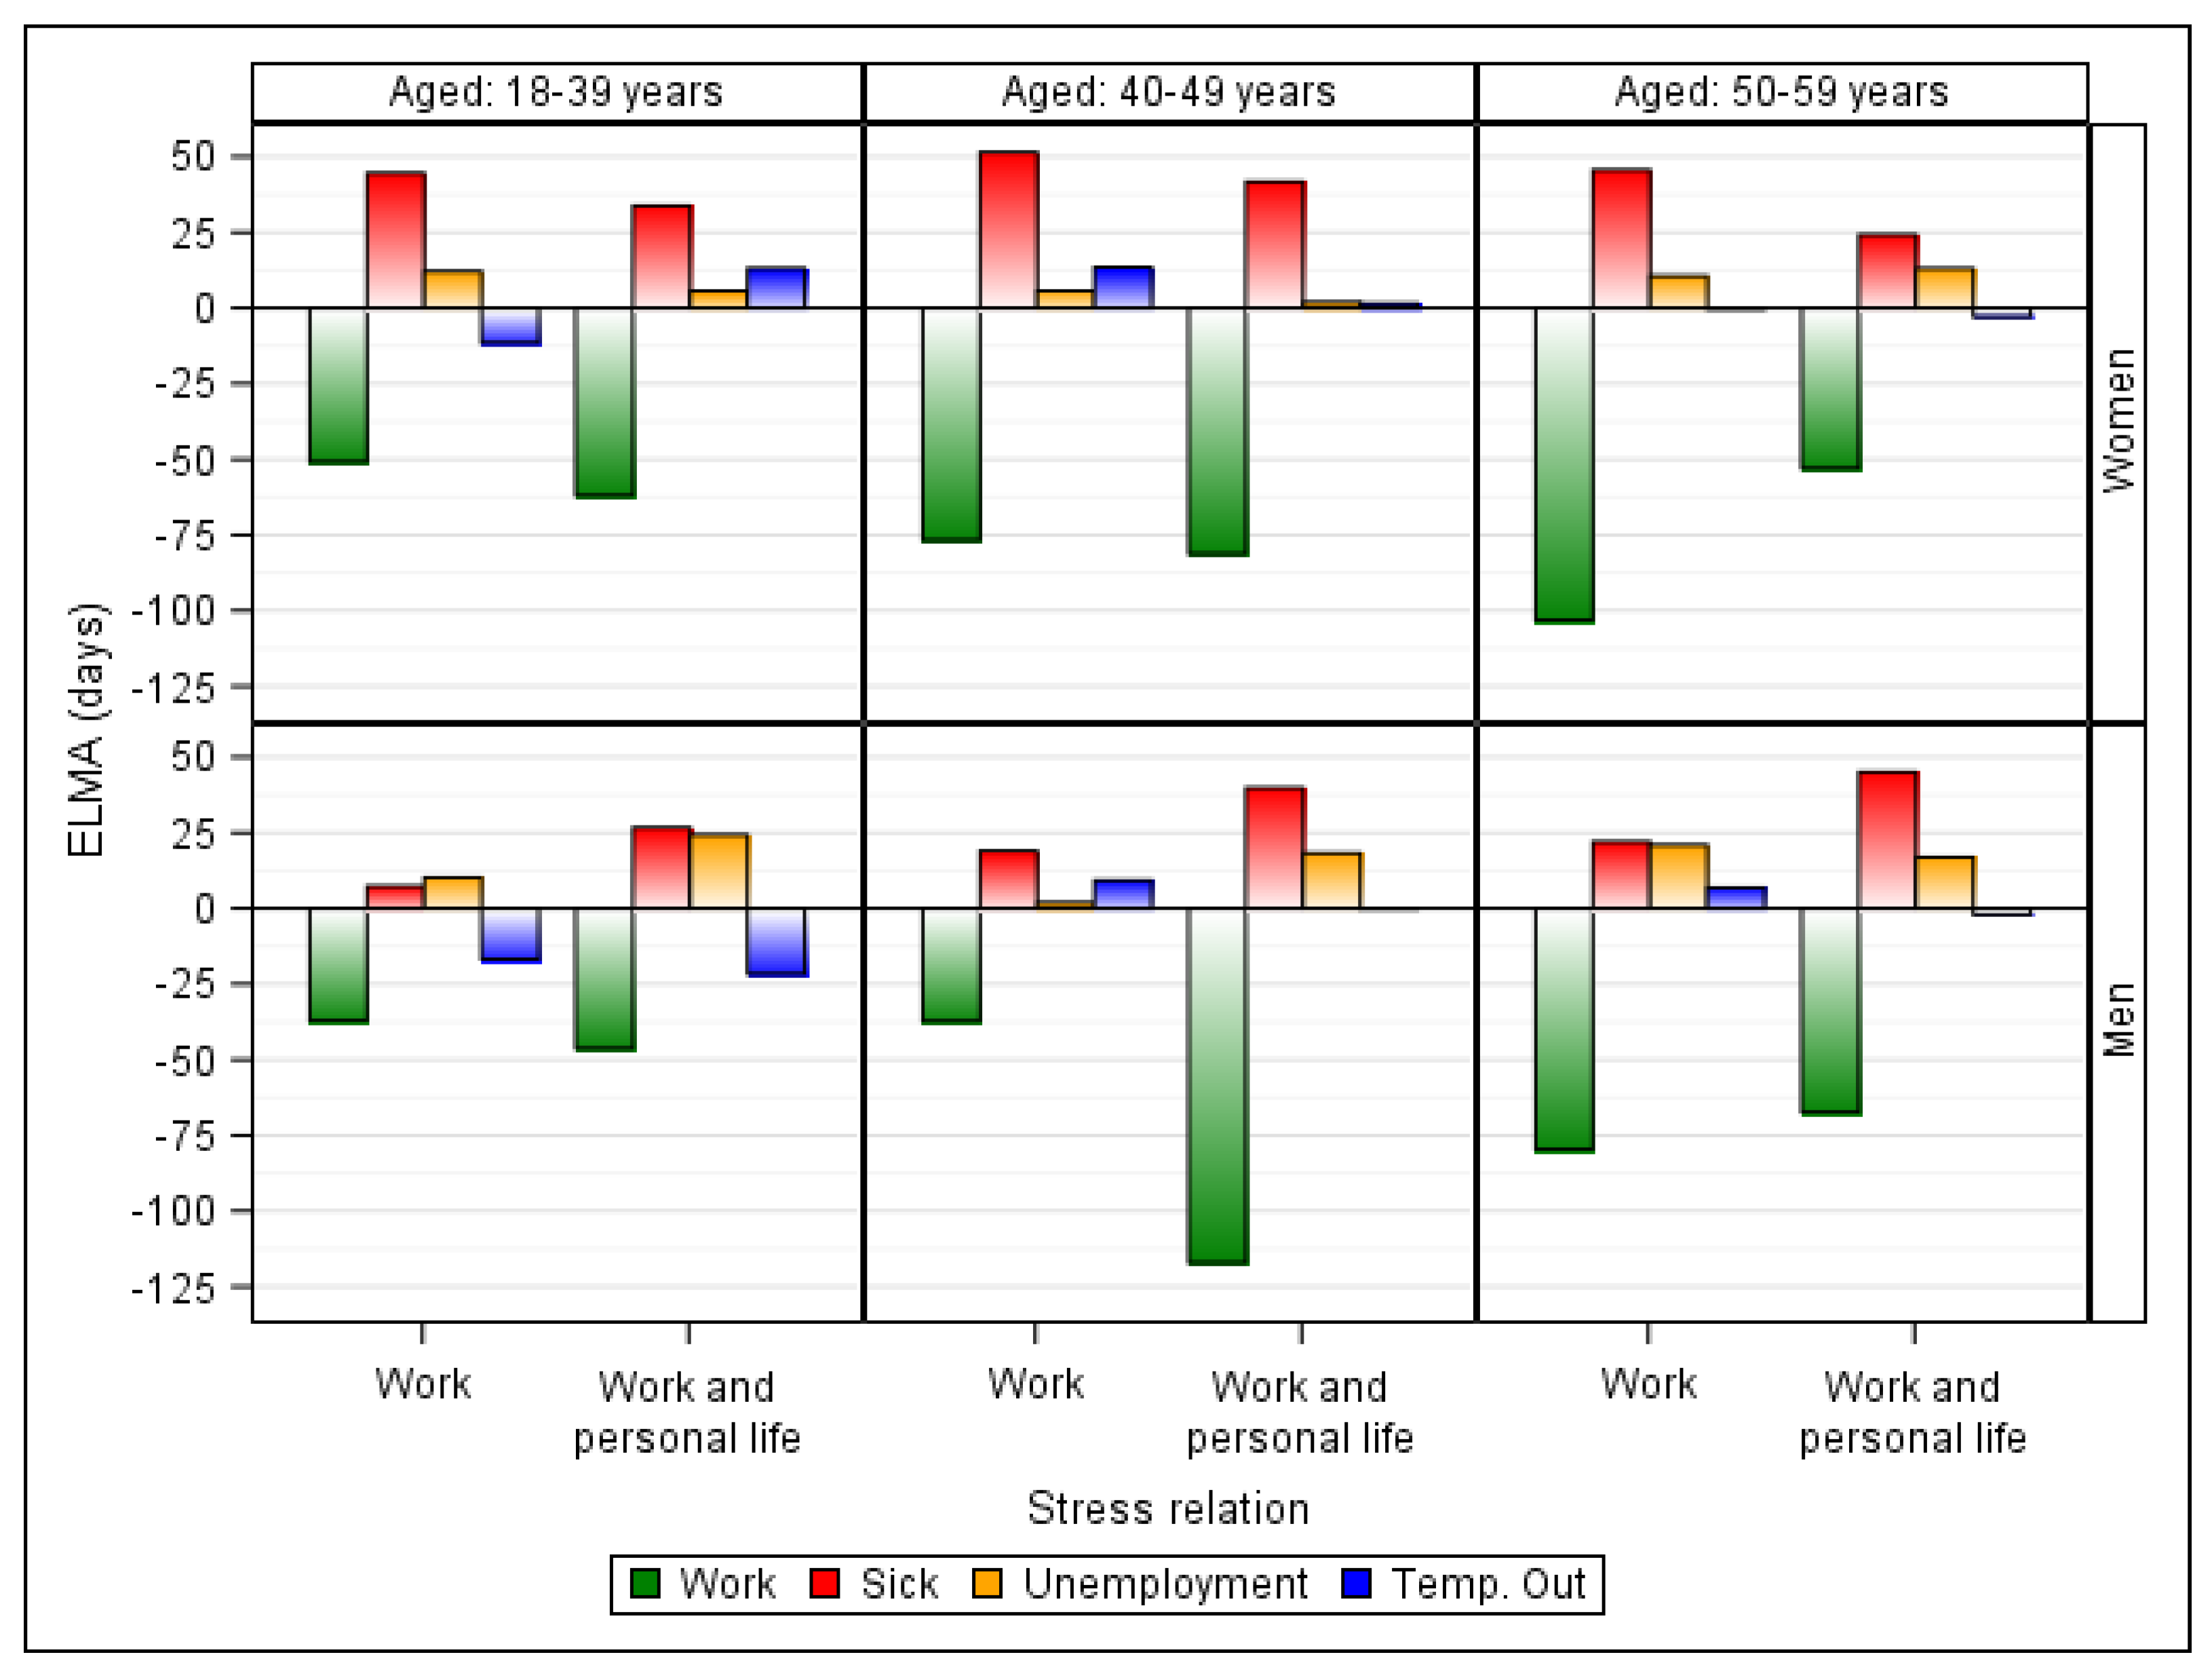
| Gender/Age | Perceived Stress | Work | Sickness Absence | Unemployment | Temp. Out |
|---|---|---|---|---|---|
| Women | |||||
| 18–39 | No | . (-) | . (-) | . (-) | . (-) |
| Work-related | −50.8 (−52.8:−48.8) | 44.6 (43.6:45.6) | 12.1 (11.7:12.6) | −11.5 (−12.2:−10.9) | |
| Work and personal life-related | −61.9 (−64.0:−59.9) | 33.8 (32.8:34.7) | 5.6 (5.4:5.9) | 13.1 (12.6:13.6) | |
| 40–49 | No | . (-) | . (-) | . (-) | . (-) |
| Work-related | −76.7 (−79.8:−73.6) | 51.5 (50.2:52.8) | 5.7 (5.1:6.3) | 13.5 (12.9:14.1) | |
| Work and personal life-related | −81.3 (−85.2:−77.3) | 41.7 (40.6:42.9) | 1.9 (1.5:2.4) | 1.5 (0.8:2.1) | |
| 50–59 | No | . (-) | . (-) | . (-) | . (-) |
| Work-related | −103.1 (−105.7:−100.6) | 45.6 (44.8:46.5) | 10.6 (10.3:10.8) | −0.4 (−0.7:−0.2) | |
| Work and personal life-related | −53.0 (−55.8:−50.1) | 24.2 (23.6:24.8) | 13.1 (12.7:13.4) | −2.9 (−3.1:−2.7) | |
| Men | |||||
| 18–39 | No | . (-) | . (-) | . (-) | . (-) |
| Work-related | −37.1 (−40.4:−33.8) | 7.3 (7.0:7.6) | 10.2 (9.7:10.7) | −16.8 (−18.3:−15.2) | |
| Work and personal life-related | −46.3 (−49.4:−43.1) | 26.7 (25.6:27.8) | 24.3 (23.2:25.4) | −21.7 (−23.6:−19.7) | |
| 40–49 | No | . (-) | . (-) | . (-) | . (-) |
| Work-related | −37.2 (−39.7:−34.7) | 19.0 (18.0:20.0) | 1.9 (1.4:2.5) | 9.2 (8.2:10.3) | |
| Work and personal life-related | −117.1 (−122.5:−111.7) | 39.8 (38.2:41.4) | 18.2 (16.8:19.7) | −0.2 (−0.8:0.3) | |
| 50–59 | No | . (-) | . (-) | . (-) | . (-) |
| Work-related | −79.6 (−82.1:−77.1) | 22.0 (21.3:22.7) | 21.0 (19.9:22.0) | 6.8 (6.0:7.6) | |
| Work and personal life-related | −67.3 (−70.4:−64.2) | 45.1 (43.3:46.8) | 16.9 (15.5:18.3) | −2.1 (−2.6:−1.5) | |
Publisher’s Note: MDPI stays neutral with regard to jurisdictional claims in published maps and institutional affiliations. |
© 2021 by the authors. Licensee MDPI, Basel, Switzerland. This article is an open access article distributed under the terms and conditions of the Creative Commons Attribution (CC BY) license (https://creativecommons.org/licenses/by/4.0/).
Share and Cite
Pedersen, J.; Solovieva, S.; Thorsen, S.V.; Andersen, M.F.; Bültmann, U. Expected Labor Market Affiliation: A New Method Illustrated by Estimating the Impact of Perceived Stress on Time in Work, Sickness Absence and Unemployment of 37,605 Danish Employees. Int. J. Environ. Res. Public Health 2021, 18, 4980. https://doi.org/10.3390/ijerph18094980
Pedersen J, Solovieva S, Thorsen SV, Andersen MF, Bültmann U. Expected Labor Market Affiliation: A New Method Illustrated by Estimating the Impact of Perceived Stress on Time in Work, Sickness Absence and Unemployment of 37,605 Danish Employees. International Journal of Environmental Research and Public Health. 2021; 18(9):4980. https://doi.org/10.3390/ijerph18094980
Chicago/Turabian StylePedersen, Jacob, Svetlana Solovieva, Sannie Vester Thorsen, Malene Friis Andersen, and Ute Bültmann. 2021. "Expected Labor Market Affiliation: A New Method Illustrated by Estimating the Impact of Perceived Stress on Time in Work, Sickness Absence and Unemployment of 37,605 Danish Employees" International Journal of Environmental Research and Public Health 18, no. 9: 4980. https://doi.org/10.3390/ijerph18094980
APA StylePedersen, J., Solovieva, S., Thorsen, S. V., Andersen, M. F., & Bültmann, U. (2021). Expected Labor Market Affiliation: A New Method Illustrated by Estimating the Impact of Perceived Stress on Time in Work, Sickness Absence and Unemployment of 37,605 Danish Employees. International Journal of Environmental Research and Public Health, 18(9), 4980. https://doi.org/10.3390/ijerph18094980