
Dynamics of the Urban Water Footprint on the Tibetan Plateau: A Case Study of Xining, China


Abstract
1. Introduction
2. Materials and Methods
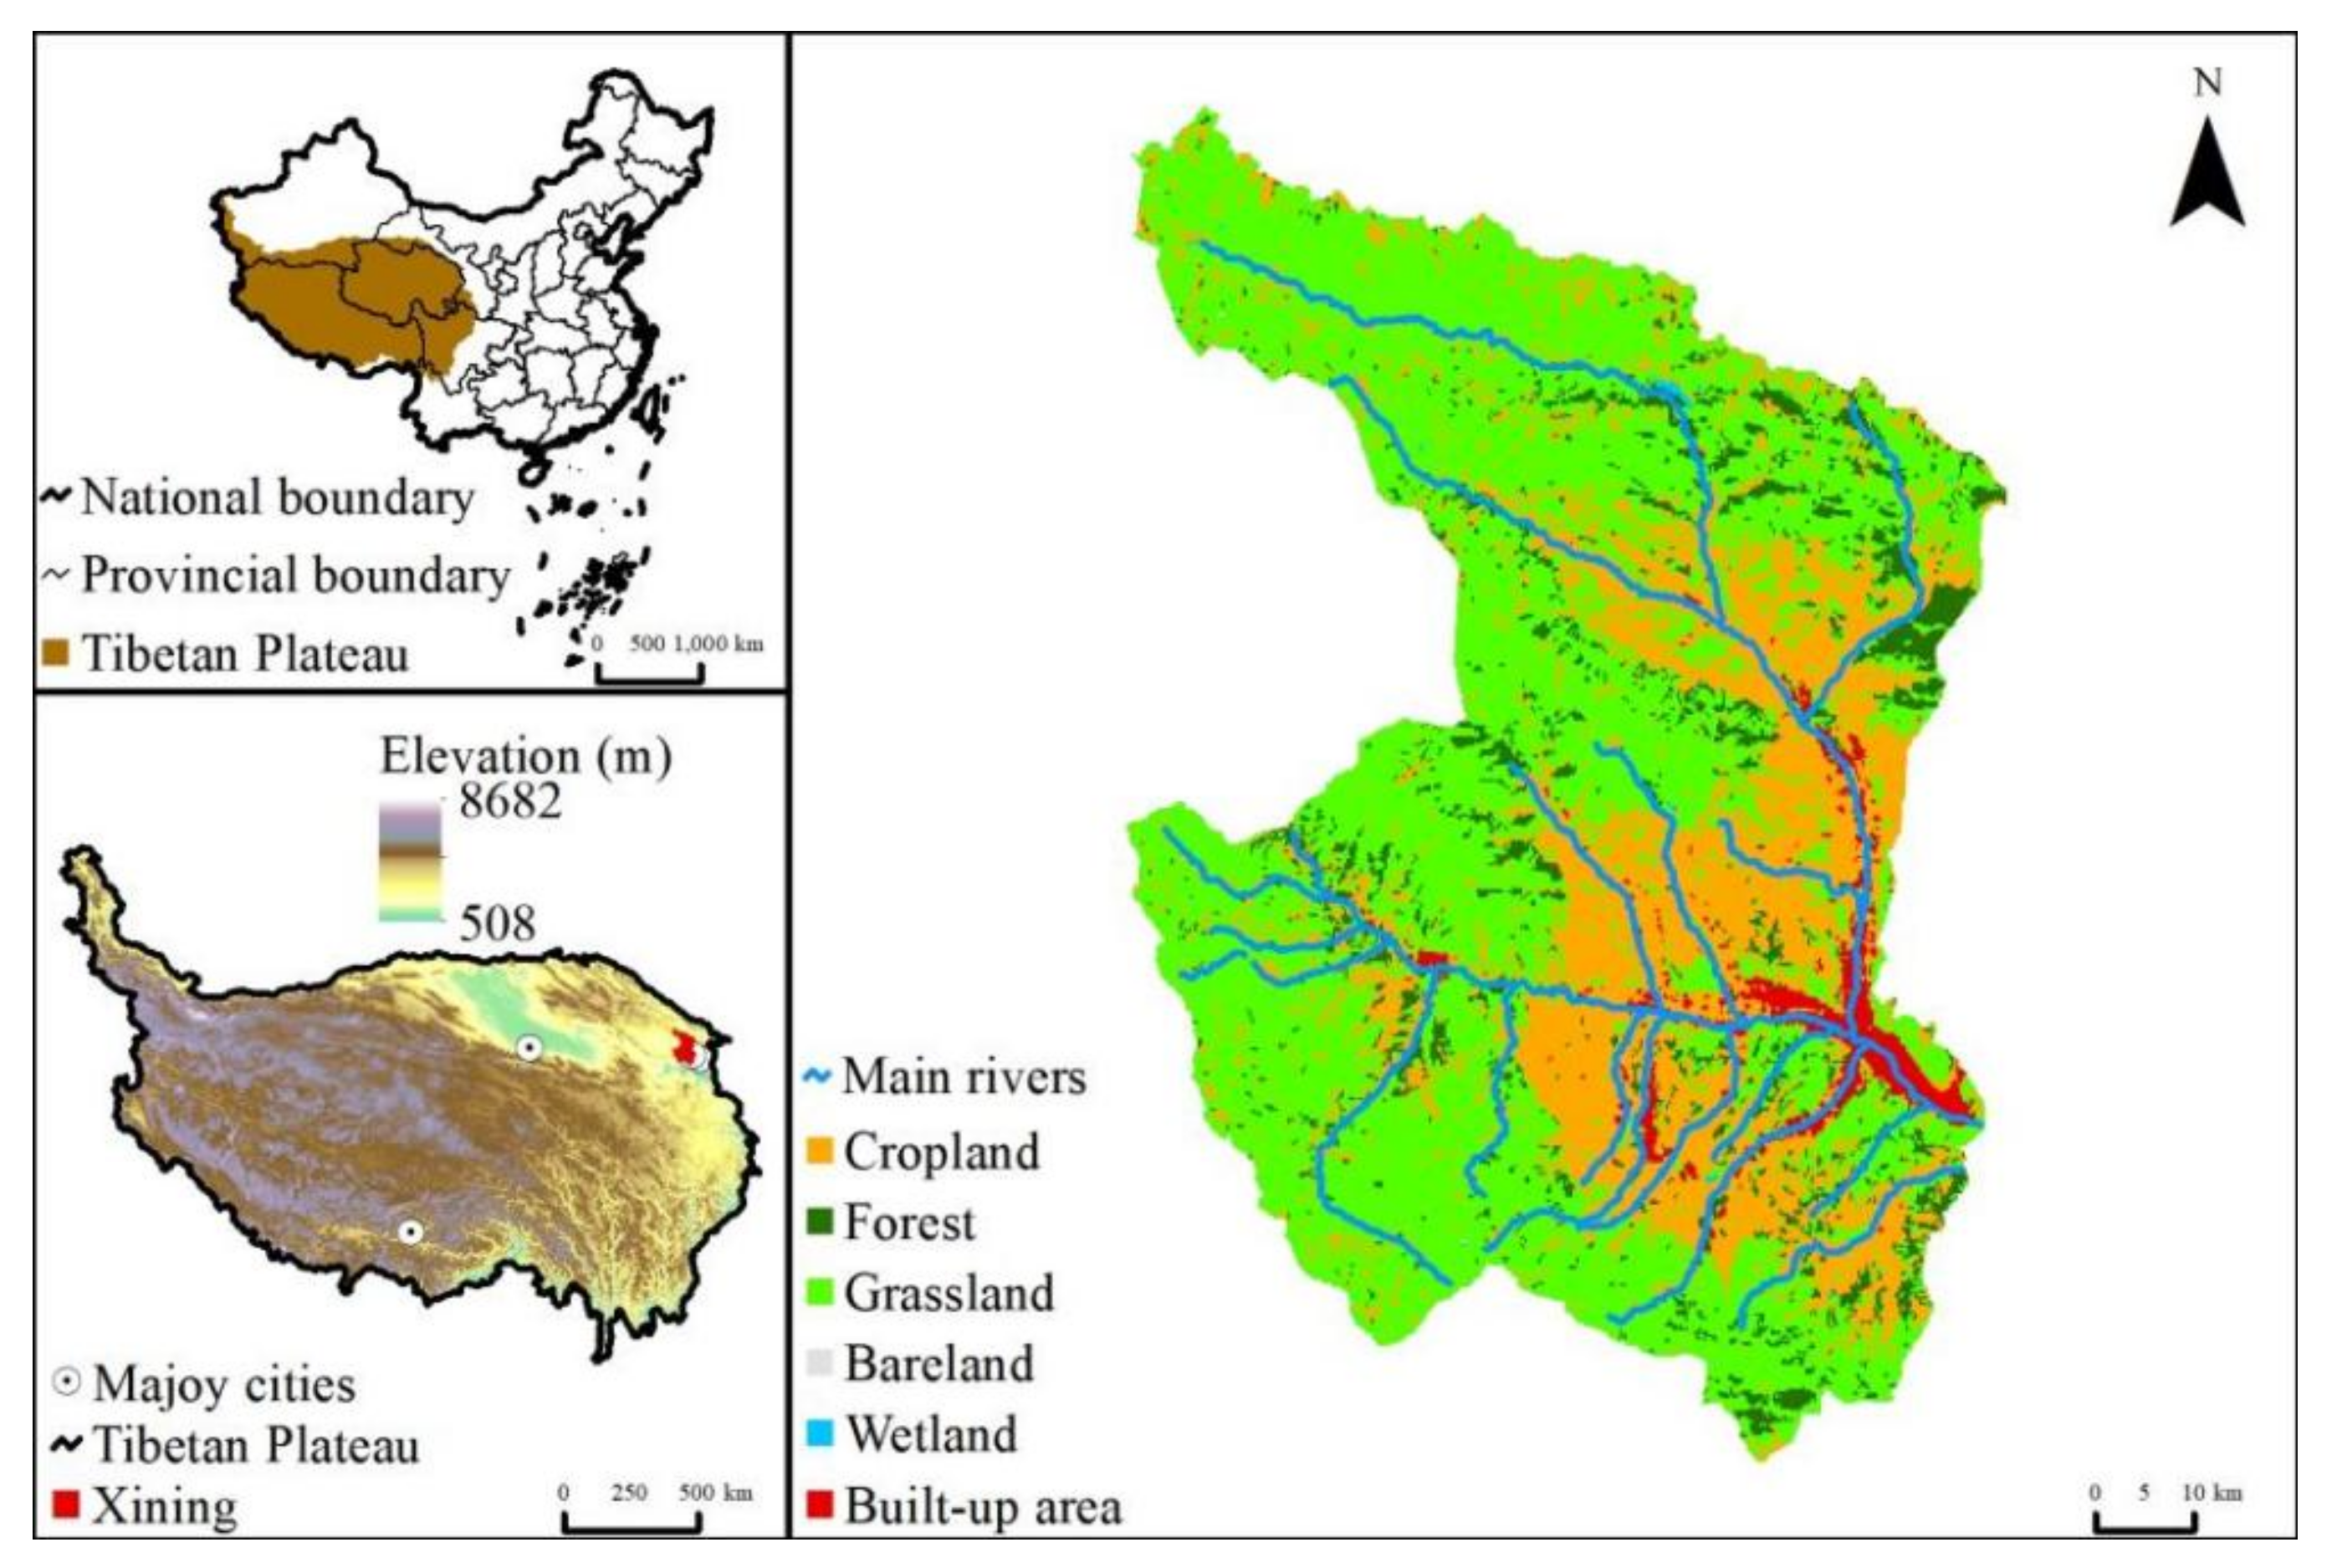
2.1. Study Area
2.2. Data Sources
2.3. Methods
2.3.1. Calculation of WFblue
2.3.2. Calculation of WFgreen
2.3.3. Calculation of WFgray
2.3.4. Calculation of WA and WD
3. Results
3.1. Xining’s WF in 2018
3.2. Dynamics of Xining’s WF in the 2005–2018 Period
4. Discussion
4.1. Comprehensive Assessment of Xining’s WF
4.2. Primary Causes of the Changes in Xining’s WF
4.3. Impact of the Rapid Increase in Xining’s WF on Sustainability within and outside the Region
4.4. Future Perspectives
5. Conclusions
Author Contributions
Funding
Institutional Review Board Statement
Informed Consent Statement
Data Availability Statement
Acknowledgments
Conflicts of Interest
References
- Walter, W.I.; Ludovicus, P.H.V.B.; Marc, F.P.B. Climate Change Will Affect the Asian Water Towers. Science 2010, 328, 1382–1385. [Google Scholar]
- Pritchard, H.D. Asia’s shrinking glaciers protect large populations from drought stress. Nature 2019, 569, 649–654. [Google Scholar] [CrossRef] [PubMed]
- Lu, C.X.; Xie, G.D.; Cheng, S.K.; Li, S.C. The Tibetan Plateau as Water Tower. Mt. Res. 2004, 22, 428–432. [Google Scholar]
- Sun, S.A.; Ren, Y.F.; Zhang, Q. A Multi-scale Perspective on Water Scarcity Assessment in the Tibetan Plateau. J. Geoinf. Sci. 2019, 21, 1308–1317. [Google Scholar]
- Bao, C.; Fang, C.L. Interaction Mechanism and Control Modes on Urbanization and Water Resources Exploitation and Utilization. Urban Stud. 2010, 17, 19–23. [Google Scholar]
- Yao, T.D.; Wu, G.J.; Xu, B.Q.; Wang, W.C.; Gao, J.; An, B.S. Asian Water Tower Change and Its Impacts. Bull. Chin. Acad. Sci. 2019, 34, 1203–1209. [Google Scholar]
- Zhou, C.C.; Jia, S.F.; Yan, H.Y.; Yang, G.L. Changing Trend of Water Resources in Qinghai Province from 1956 to 2000. J. Glaciol. Geocryol. 2005, 3, 432–437. [Google Scholar]
- Lu, A.X.; Yao, T.D.; Wang, L.H.; Liu, S.Y.; Guo, Z.L. Study on the Fluctuations of Typical Glaciers and Lakes in the Tibetan Plateau Using Remote Sensing. J. Glaciol. Geocryol. 2005, 6, 783–792. [Google Scholar]
- Luosang, L.Z.D.J. Utilization and Protection of Water Resources in the Qinghai-Tibet Plateau. Resour. Sci. 2005, 27, 23–27. [Google Scholar]
- Zhang, X. Study on Urban Water Security Evaluation System Based on WPI—A Case Study of Qinghai Province in 2013. China South. Agric. Mach. 2016, 47, 93–94. [Google Scholar]
- Ma, C.H.; Zhao, J. Quantitative evaluation of resource and environment pressure in Qinghai Province, China based on footprint family. Chin. J. Appl. Ecol. 2016, 27, 1248–1256. [Google Scholar]
- Fan, Y.P.; Fang, C.L. A comprehensive insight into water pollution and driving forces in Western China—Case study of Qinghai. J. Clean. Prod. 2020, 274, 123950. [Google Scholar] [CrossRef]
- Hoekstra, A.Y.; Chapagain, A.K.; Aldaaya, M.M.; Mekonnen, M.M. The Water Footprint Assessment Manual: Setting The Global Standard; Earthscan: London, UK, 2011. [Google Scholar]
- Feng, S.C.; Gao, X.H.; Kang, J.; Wu, G.L.; Zou, C.; Yang, J.J. Research on Land Use/cover Change and Urban Expansion in Xining City in Recent 30 Years. Arid Zone Res. 2012, 29, 129–136. [Google Scholar]
- Chang, Z.M.; Hu, W.B.; Zhang, L.J. Change Characteristics of Temperature and Precipitation from 1951 to 2015 in Xining City. Water Resour. Power 2017, 35, 7–11. [Google Scholar]
- Qinghai Provincial Water Resources Department. Water Resource Bulletin of Qinghai Province; Qinghai Provincial Water Resources Department: Xining, China, 2018. [Google Scholar]
- Qinghai Investigation Team, National Bureau of Statistics. Statistical Yearbook of Qinghai Province; China Statistics Press: Beijing, China, 2018. [Google Scholar]
- Aurélie, B.; Xu, Y.X. Global ESA CCI Land Cover Classification Map (1992–2015); National Tibetan Plateau Data Center: Beijing, China, 2018. [Google Scholar]
- Yang, J.J.; Gao, X.H.; Li, Q.J.; Chen, Q.; Feng, S.C. SWAT Model Construction and Uncertainty Analysis on Its Parameters for the Huangshui River Basin. Res. Soil Water Conser. 2013, 20, 82–88, 93. [Google Scholar]
- Xining Bureau of Statistics. Statistical Yearbook of Xining; Xining Bureau of Statistics: Xining, China, 2018. [Google Scholar]
- Ministry of Environmental Protection of the People’s Republic of China. GB 3838-2002 Environmental Quality Standard for Surface Water; China Standard Press: Beijing, China, 2002.
- Zeng, Z.; Li, J.G. Historical Trend of Grey Water Footprint of Beijing, China. J. Nat. Resour. 2013, 28, 1169–1178. [Google Scholar]
- Liu, J.G.; Zhao, D.D.; Mao, G.Q.; Cui, W.H.; Chen, H.; Yang, H. Environmental Sustainability of Water Footprint in Mainland China. Geogr. Sustain. 2020, 1, 8–17. [Google Scholar] [CrossRef]
- Hoekstra, A.Y.; Mekonnen, M.M.; Chapagain, A.K.; Mathews, R.E.; Richter, B.D. Global monthly water scarcity: Blue water footprints versus blue water availability. PLoS ONE 2012, 7, e32688. [Google Scholar] [CrossRef] [PubMed]
- Rockstrom, J. Balancing Water for Humans and Nature: The New Approach in Ecohydrology; Taylor and Francis: Abingdon, UK, 2013. [Google Scholar]
- Sharp, R.; Tallis, H.T.; Ricketts, T.; Guerry, A.D.; Wood, S.A.; Chaplin-Kramer, R.; Nelson, E.; Ennaanay, D.; Wolny, S.; Olwero, N.; et al. InVEST Version 3.2.0 User’s Guide; The Natural Capital Project: Palo Alto, CA, USA; Stanford University: Palo Alto, CA, USA; University of Minnesota: Minneapolis, MN, USA; The NatureConservancy: Arlington, VA, USA; World Wildlife Fund: Grant, Switzerland, 2015. [Google Scholar]
- Cui, S.B.; Dong, H.J.; Wilson, J. Grey water footprint evaluation and driving force analysis of eight economic regions in China. Environ. Sci. Pollut. Res. 2020, 27, 20380–20391. [Google Scholar] [CrossRef]
- Zhang, L.; Dong, H.; Geng, Y.; Francisco, M.J. China’s provincial grey water footprint characteristic and driving forces. Sci. Total Environ. 2019, 677, 427–435. [Google Scholar] [CrossRef]
- Sharps, K.; Masante, D.; Thomas, A.; Jackson, B.; Redhead, J.; May, L.; Prosser, H.; Cosby, B.; Emmett, B.; Jones, L. Comparing strengths and weaknesses of three ecosystem services modelling tools in a diverse UK river catchment. Sci. Total Environ. 2017, 584–585, 118–130. [Google Scholar] [CrossRef] [PubMed]
- Fang, K.; Duan, Z. An Integrated Assessment of National Environmental Sustainability by Synthesizing Carbon, Water and Land Footprints and Boundaries. J. Nat. Resour. 2015, 30, 539–548. [Google Scholar]
- Hu, X.F.; Fu, C.; Chen, F.S.; Yang, L. Study on the standard of regional ecological compensation and the spatial temporal pattern based on water footprint. Resour. Environ. Yangtze Basin 2016, 25, 1430–1437. [Google Scholar]
- Fu, Z.H.; Zhao, H.J.; Wang, H.; Lu, W.T.; Wang, J.; Guo, H.C. Integrated planning for regional development planning and water resources management under uncertainty: A case study of Xining, China. J. Hydrol. 2017, 554, 623–634. [Google Scholar] [CrossRef]
- Jing, X.E.; Zhang, S.H.; Zhang, J.J.; Wang, Y.J.; Wang, Y.Q. Assessing efficiency and economic viability of rainwater harvesting systems for meeting non-potable water demands in four climatic zones of China. Resour. Conserv. Recycl. 2017, 126, 74–85. [Google Scholar] [CrossRef]
- Shang, Q.K.; Yin, K.X.; Mi, W.B. Assessing water resources in Qinghai province based on theory of water footprint. J. Arid Land Resour. Environ. 2020, 34, 70–77. [Google Scholar]
- Zhang, J.Y.; Liu, J.F.; Jin, L.J.; Ma, T.; Wang, G.Q.; Liu, H.W.; Min, X.; Wang, H.; Lin, J.; Bao, Z.X.; et al. Evolution and Trend of Water Resources in Qinghai-Tibet Plateau. Bull. Chin. Acad. Sci. 2019, 34, 1264–1273. [Google Scholar]
- Liu, B.J.; Cui, C.Y.; Wang, L.W.; Cui, J.J. Development and utilization status of water resources in Huangshui River valley under the new environment. Ground Water 2020, 42, 174–178, 225. [Google Scholar]
- Feng, S.T.; Ma, H.M.; Yu, R.F. Analysis on the current situation of water pollution in Lanzhou section of the Yellow River. Yellow River 2006, 27, 28–29. [Google Scholar]
- Song, Q.G.; Zhou, Y.L.; Yang, X.L.; Zhang, N. Survey on organic pollution at head water region of key cities situated on the main Yellow River. Yellow River 2010, 32, 45–47. [Google Scholar]


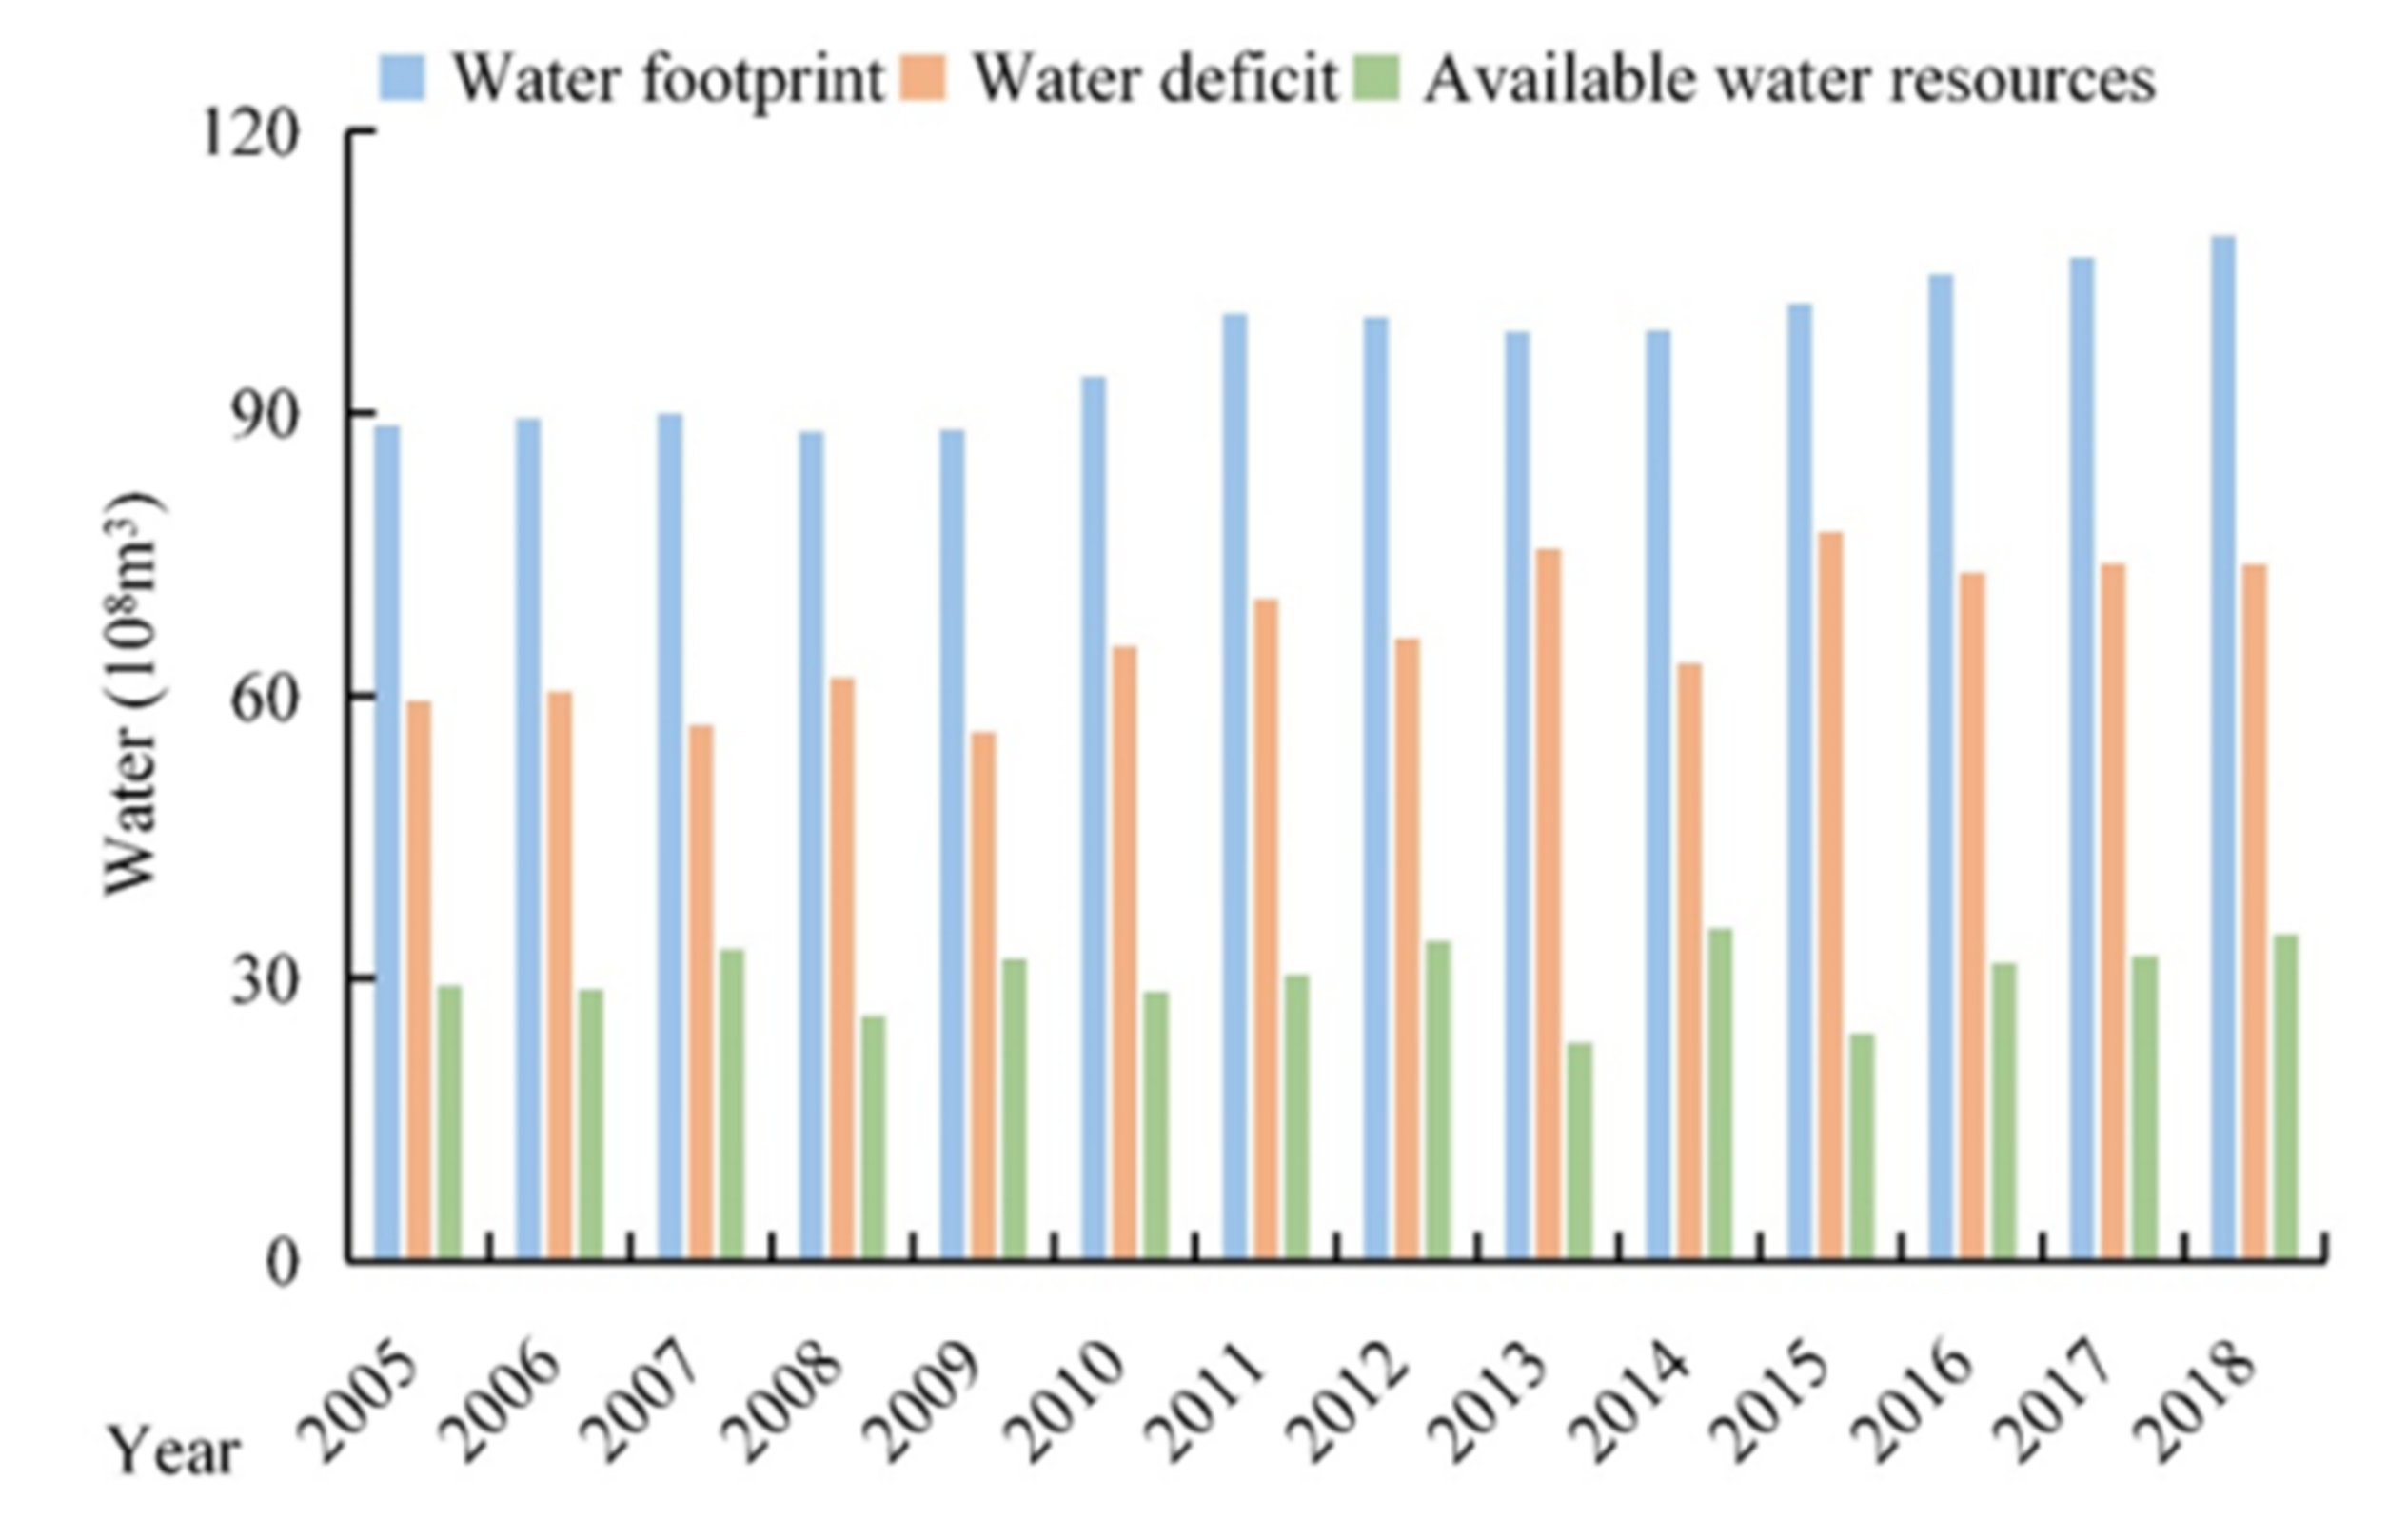
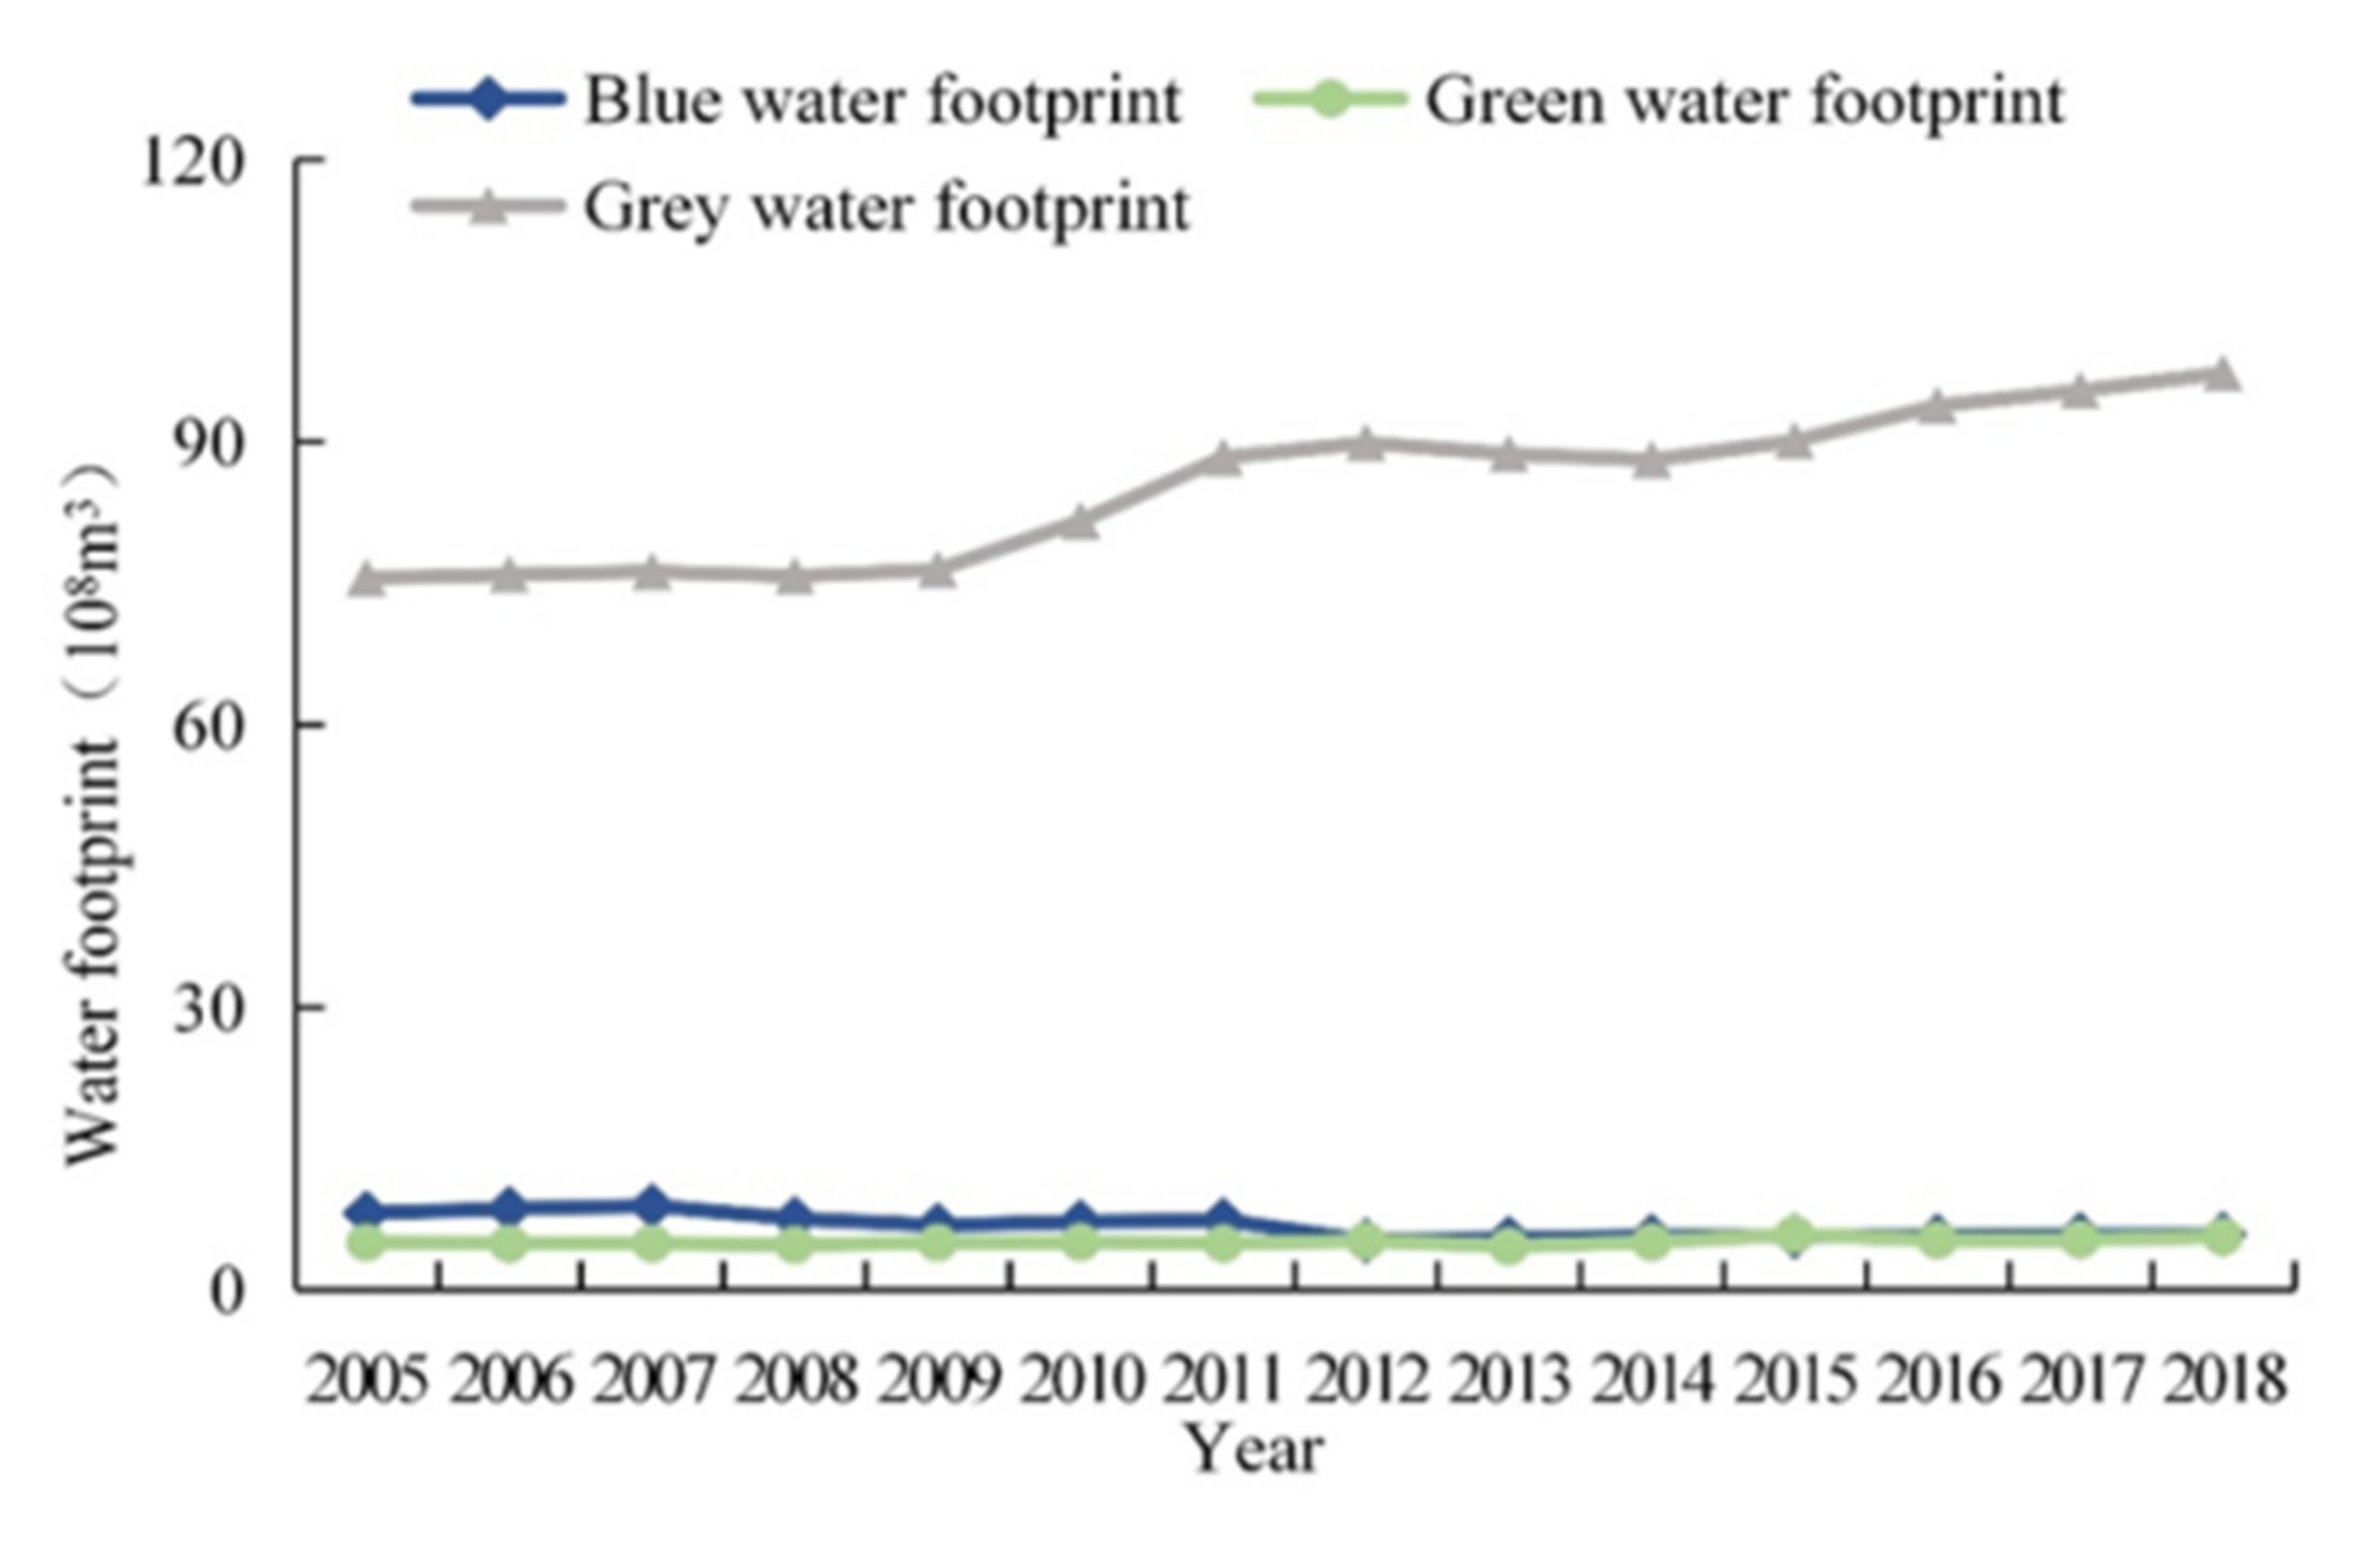
| Year | Blue Water Footprint | Green Water Footprint | Gray Water Footprint | Total Water Footprint | Available Water Resources | Water Deficit |
|---|---|---|---|---|---|---|
| 2005 | 8.12 | 5.02 | 75.55 | 88.69 | 29.24 | 59.45 |
| 2006 | 8.60 | 4.90 | 75.90 | 89.40 | 28.86 | 60.54 |
| 2007 | 8.90 | 4.92 | 76.21 | 90.03 | 33.16 | 56.86 |
| 2008 | 7.54 | 4.77 | 75.75 | 88.06 | 26.06 | 62.00 |
| 2009 | 6.84 | 5.00 | 76.41 | 88.25 | 32.08 | 56.18 |
| 2010 | 7.20 | 5.05 | 81.58 | 93.84 | 28.58 | 65.25 |
| 2011 | 7.39 | 4.91 | 88.33 | 100.62 | 30.38 | 70.24 |
| 2012 | 5.20 | 5.19 | 89.88 | 100.26 | 34.08 | 66.18 |
| 2013 | 5.43 | 4.62 | 88.70 | 98.74 | 23.13 | 75.61 |
| 2014 | 5.65 | 5.06 | 88.07 | 98.78 | 35.33 | 63.45 |
| 2015 | 5.67 | 5.85 | 90.10 | 101.62 | 24.24 | 77.39 |
| 2016 | 5.65 | 5.27 | 93.83 | 104.75 | 31.71 | 73.03 |
| 2017 | 5.82 | 5.34 | 95.43 | 106.59 | 32.45 | 74.14 |
| 2018 | 5.87 | 5.63 | 97.27 | 108.77 | 34.75 | 73.55 |
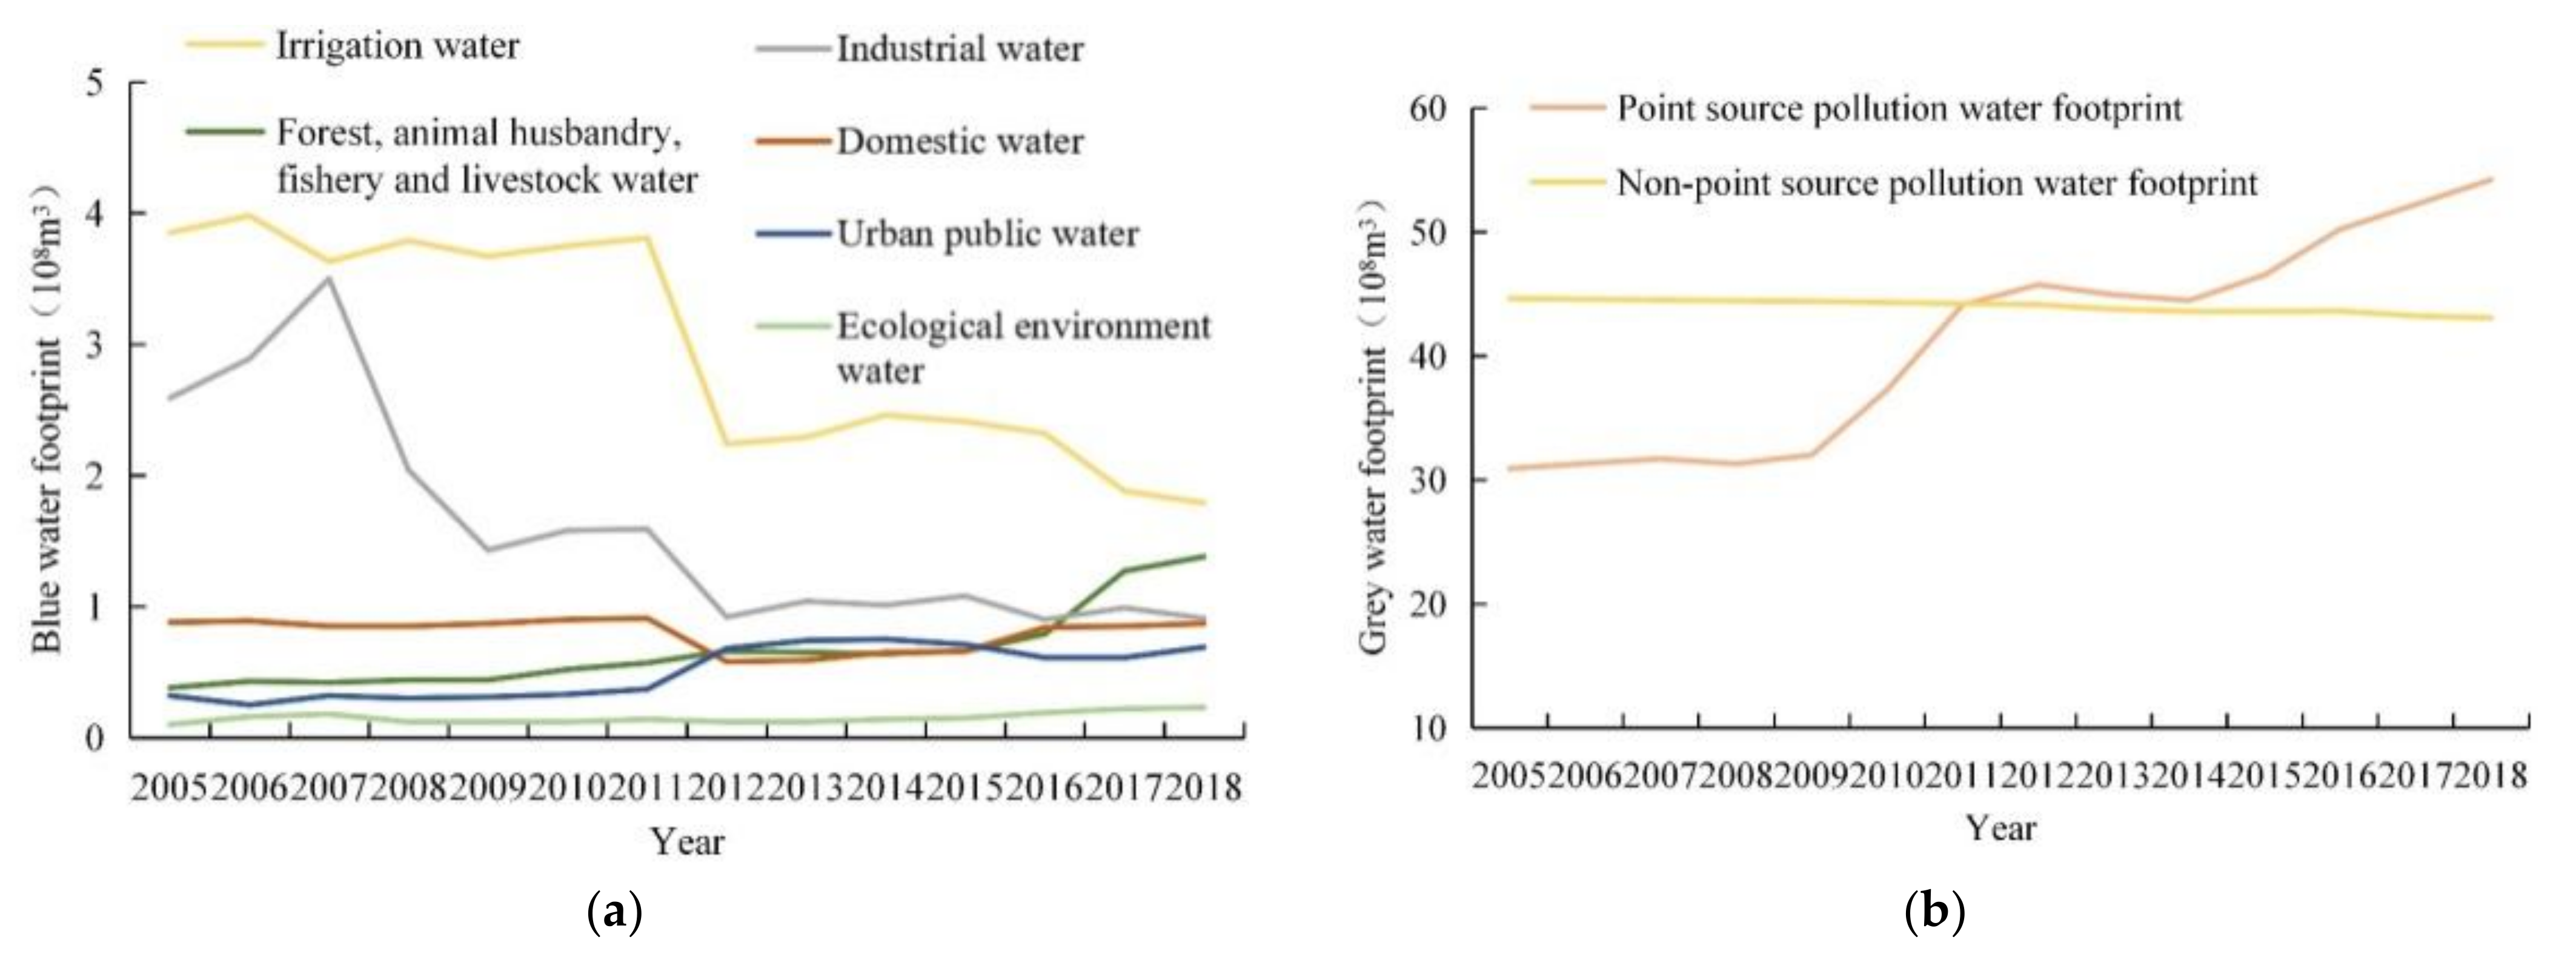
| Year | Irrigation Water | Forest, Animal Husbandry, Fishery, and Livestock Water | Industrial Water | Domestic Water | Urban Public Water | Ecological and Environmental Water |
|---|---|---|---|---|---|---|
| 2005 | 3.85 (47.4%) | 0.38 (4.7%) | 2.59 (31.9%) | 0.88 (10.8%) | 0.32 (3.9%) | 0.10 (1.2%) |
| 2006 | 3.98 (46.3%) | 0.43 (5.3%) | 2.89 (35.6%) | 0.89 (11.0%) | 0.25 (3.1%) | 0.16 (2.0%) |
| 2007 | 3.63 (40.8%) | 0.42 (5.2%) | 3.50 (43.1%) | 0.85 (10.5%) | 0.32 (3.9%) | 0.18 (2.2%) |
| 2008 | 3.79 (50.3%) | 0.44 (5.4%) | 2.04 (25.1%) | 0.85 (10.5%) | 0.30 (3.7%) | 0.12 (1.5%) |
| 2009 | 3.67 (53.7%) | 0.44 (5.4%) | 1.43 (17.6%) | 0.87 (10.7%) | 0.31 (3.8%) | 0.12 (1.5%) |
| 2010 | 3.75 (52.1%) | 0.52 (6.4%) | 1.58 (19.5%) | 0.90 (11.1%) | 0.33 (4.1%) | 0.12 (1.5%) |
| 2011 | 3.81 (51.6%) | 0.57 (7.0%) | 1.59 (19.6%) | 0.91 (11.2%) | 0.37 (4.6%) | 0.14 (1.7%) |
| 2012 | 2.24 (43.1%) | 0.66 (8.1%) | 0.92 (11.3%) | 0.58 (7.1%) | 0.68 (8.4%) | 0.12 (1.5%) |
| 2013 | 2.29 (42.2%) | 0.65 (8.0%) | 1.04 (12.8%) | 0.59 (7.3%) | 0.74 (9.1%) | 0.12 (1.5%) |
| 2014 | 2.46 (43.5%) | 0.64 (7.9%) | 1.01 (12.4%) | 0.65 (8.0%) | 0.75 (9.2%) | 0.14 (1.7%) |
| 2015 | 2.41 (42.5%) | 0.66 (8.1%) | 1.08 (13.3%) | 0.66 (8.1%) | 0.71 (8.7%) | 0.15 (1.8%) |
| 2016 | 2.32 (41.1%) | 0.79 (9.7%) | 0.90 (11.1%) | 0.84 (10.3%) | 0.61 (7.5%) | 0.19 (2.3%) |
| 2017 | 1.88 (32.3%) | 1.27 (15.6%) | 0.99 (12.2%) | 0.85 (10.5%) | 0.61 (7.5%) | 0.22 (2.7%) |
| 2018 | 1.79 (30.5%) | 1.38 (17.0%) | 0.91 (11.2%) | 0.87 (10.7%) | 0.69 (8.5%) | 0.23 (2.8%) |
| Year | Point Source Pollution Water Footprint | Non-Point Source Pollution Water Footprint |
|---|---|---|
| 2005 | 30.92 (40.9%) | 44.63 (59.1%) |
| 2006 | 31.32 (41.3%) | 44.57 (58.7%) |
| 2007 | 31.70 (41.6%) | 44.52 (58.4%) |
| 2008 | 31.30 (41.3%) | 44.45 (58.7%) |
| 2009 | 32.00 (41.9%) | 44.41 (58.1%) |
| 2010 | 37.27 (45.7%) | 44.31 (54.3%) |
| 2011 | 44.11 (49.9%) | 44.21 (50.1%) |
| 2012 | 45.74 (50.9%) | 44.13 (49.1%) |
| 2013 | 44.93 (50.7%) | 43.77 (49.3%) |
| 2014 | 44.47 (50.5%) | 43.60 (49.5%) |
| 2015 | 46.52 (51.6%) | 43.58 (48.4%) |
| 2016 | 50.21 (53.5%) | 43.62 (46.5%) |
| 2017 | 52.20 (54.7%) | 43.22 (45.3%) |
| 2018 | 54.20 (55.7%) | 43.07 (44.3%) |
Publisher’s Note: MDPI stays neutral with regard to jurisdictional claims in published maps and institutional affiliations. |
© 2021 by the authors. Licensee MDPI, Basel, Switzerland. This article is an open access article distributed under the terms and conditions of the Creative Commons Attribution (CC BY) license (https://creativecommons.org/licenses/by/4.0/).
Share and Cite
Chen, Z.; Gong, B.; Jiang, J.; Liu, Z.; Chen, K. Dynamics of the Urban Water Footprint on the Tibetan Plateau: A Case Study of Xining, China. Int. J. Environ. Res. Public Health 2021, 18, 4566. https://doi.org/10.3390/ijerph18094566
Chen Z, Gong B, Jiang J, Liu Z, Chen K. Dynamics of the Urban Water Footprint on the Tibetan Plateau: A Case Study of Xining, China. International Journal of Environmental Research and Public Health. 2021; 18(9):4566. https://doi.org/10.3390/ijerph18094566
Chicago/Turabian StyleChen, Zhirong, Binghua Gong, Jiayi Jiang, Zhifeng Liu, and Kelong Chen. 2021. "Dynamics of the Urban Water Footprint on the Tibetan Plateau: A Case Study of Xining, China" International Journal of Environmental Research and Public Health 18, no. 9: 4566. https://doi.org/10.3390/ijerph18094566
APA StyleChen, Z., Gong, B., Jiang, J., Liu, Z., & Chen, K. (2021). Dynamics of the Urban Water Footprint on the Tibetan Plateau: A Case Study of Xining, China. International Journal of Environmental Research and Public Health, 18(9), 4566. https://doi.org/10.3390/ijerph18094566