
Toxic Organic Contaminants in Airborne Particles: Levels, Potential Sources and Risk Assessment †

 , , , ,
  , and
, and 
Abstract
1. Introduction
2. Materials and Methods
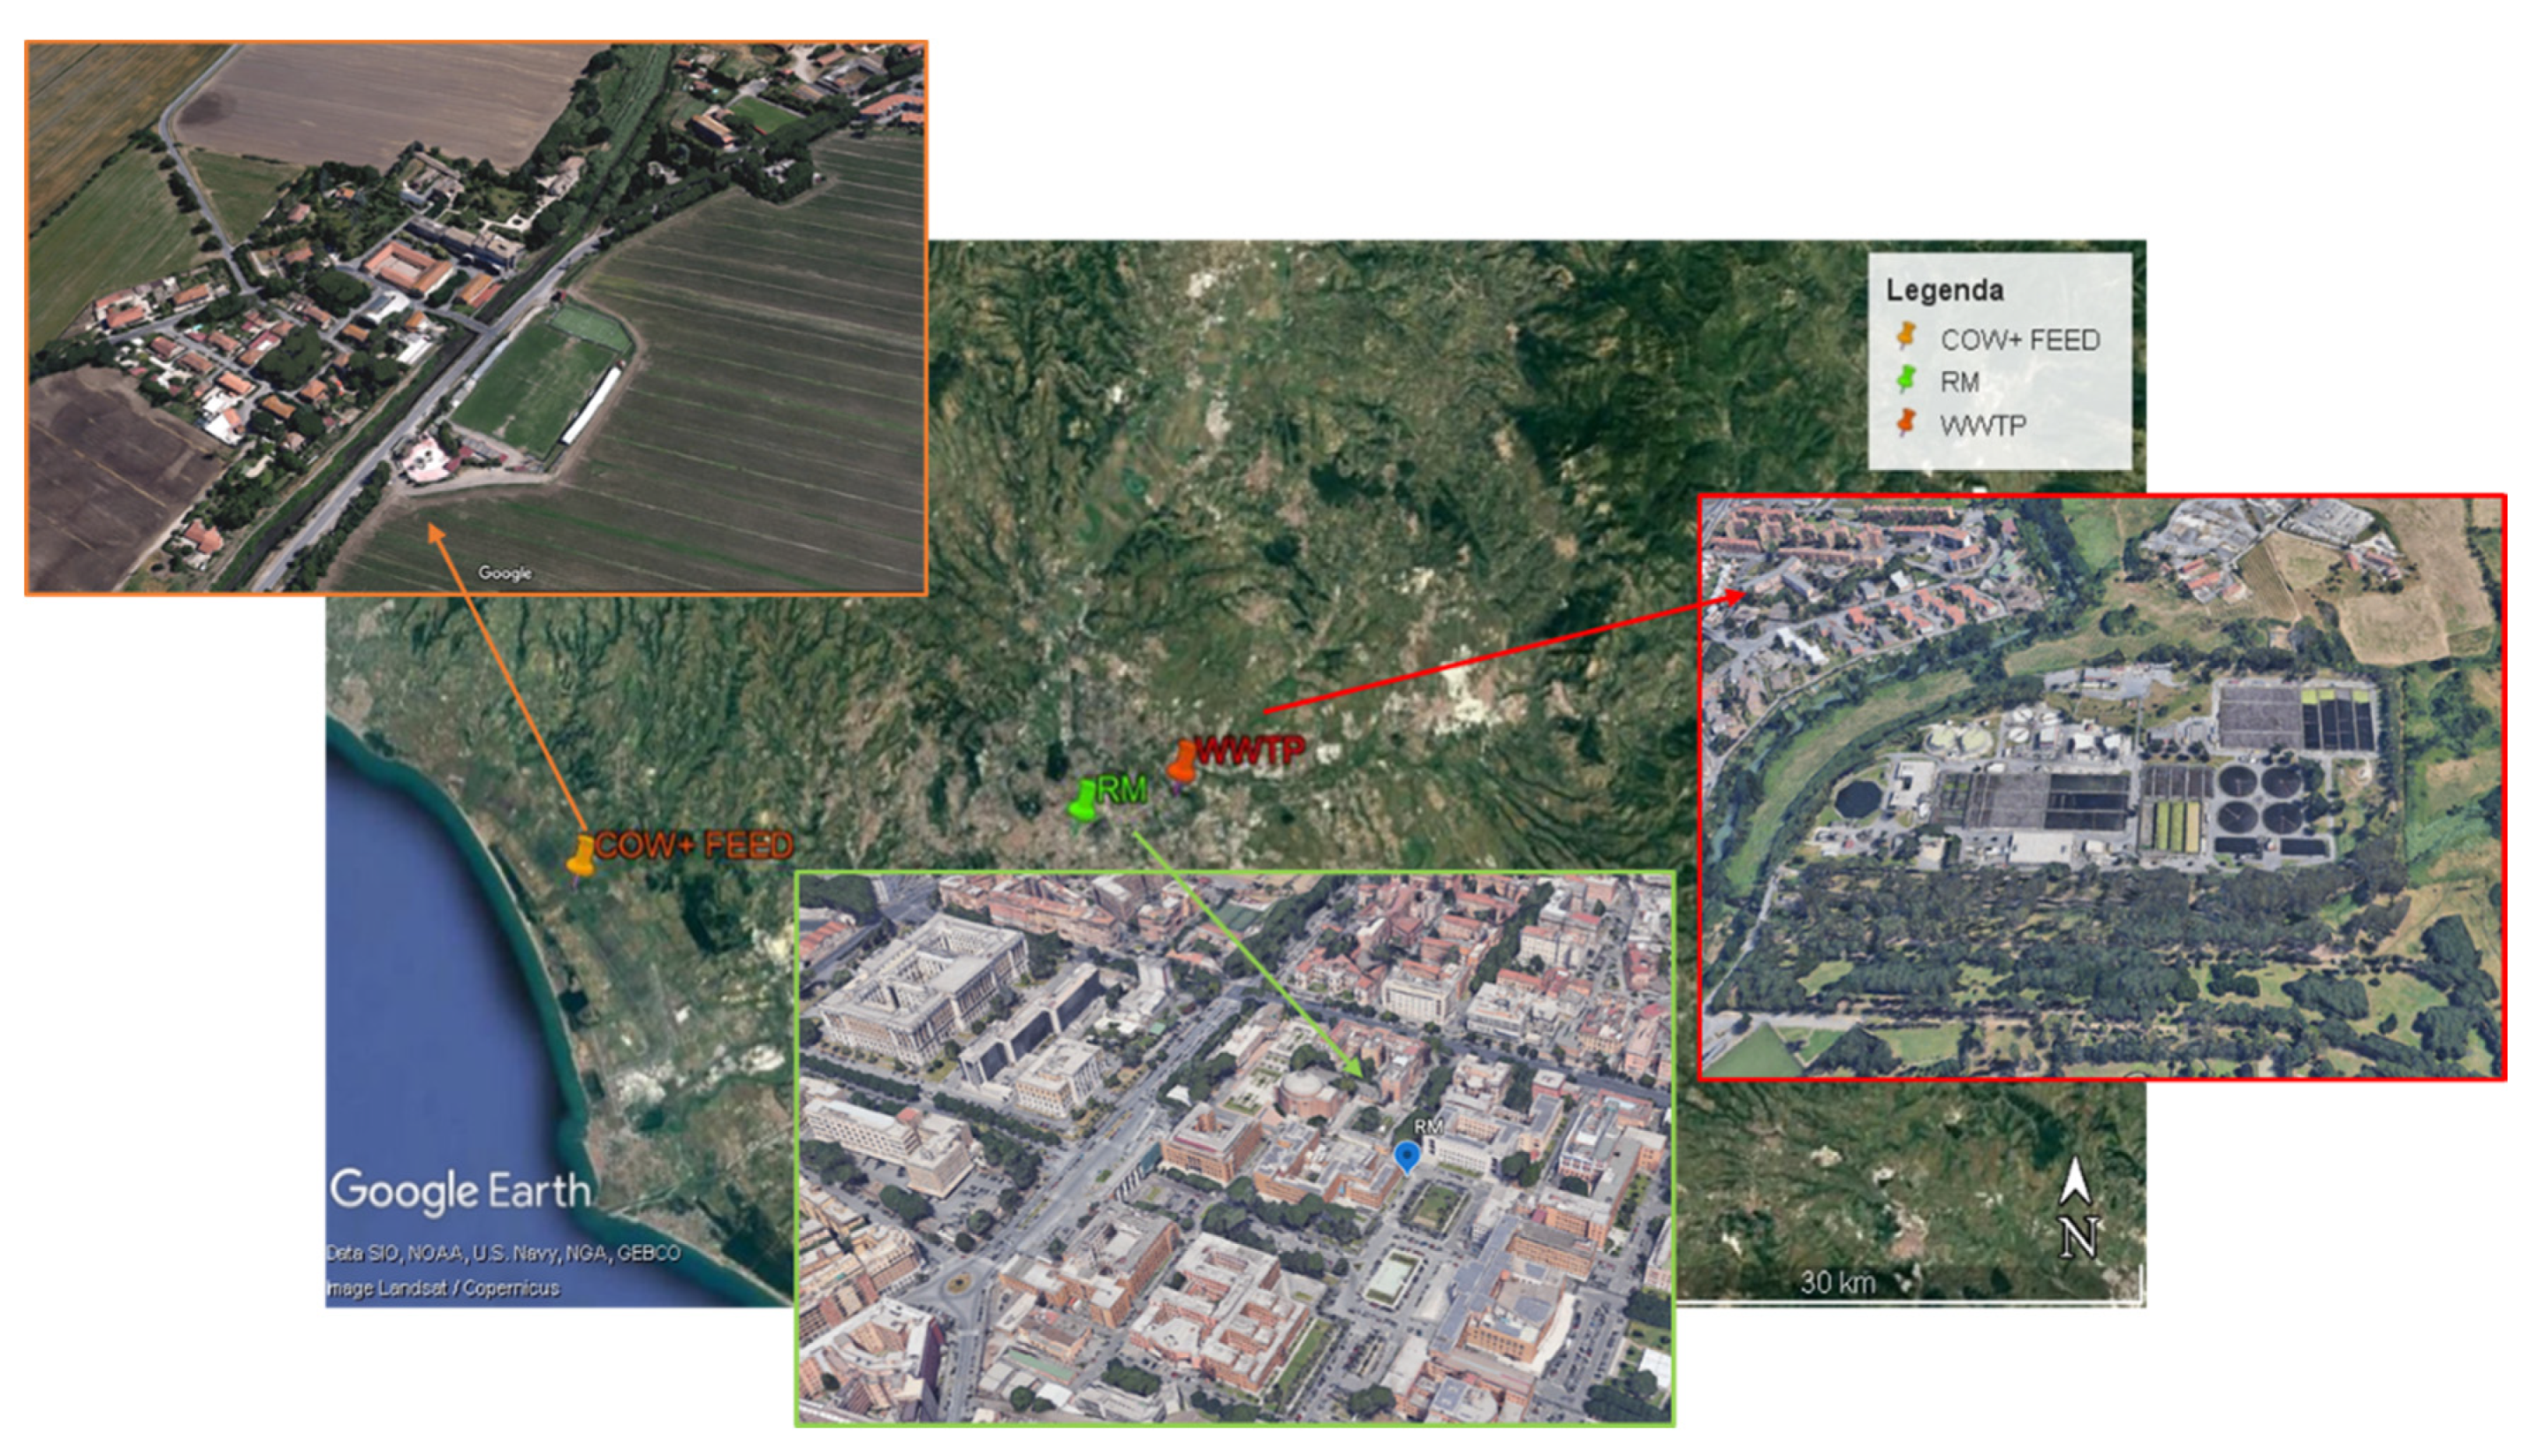
2.1. Sampling
2.2. Analytical Methods
2.3. Human Health Risk Assessment
3. Results and Discussion
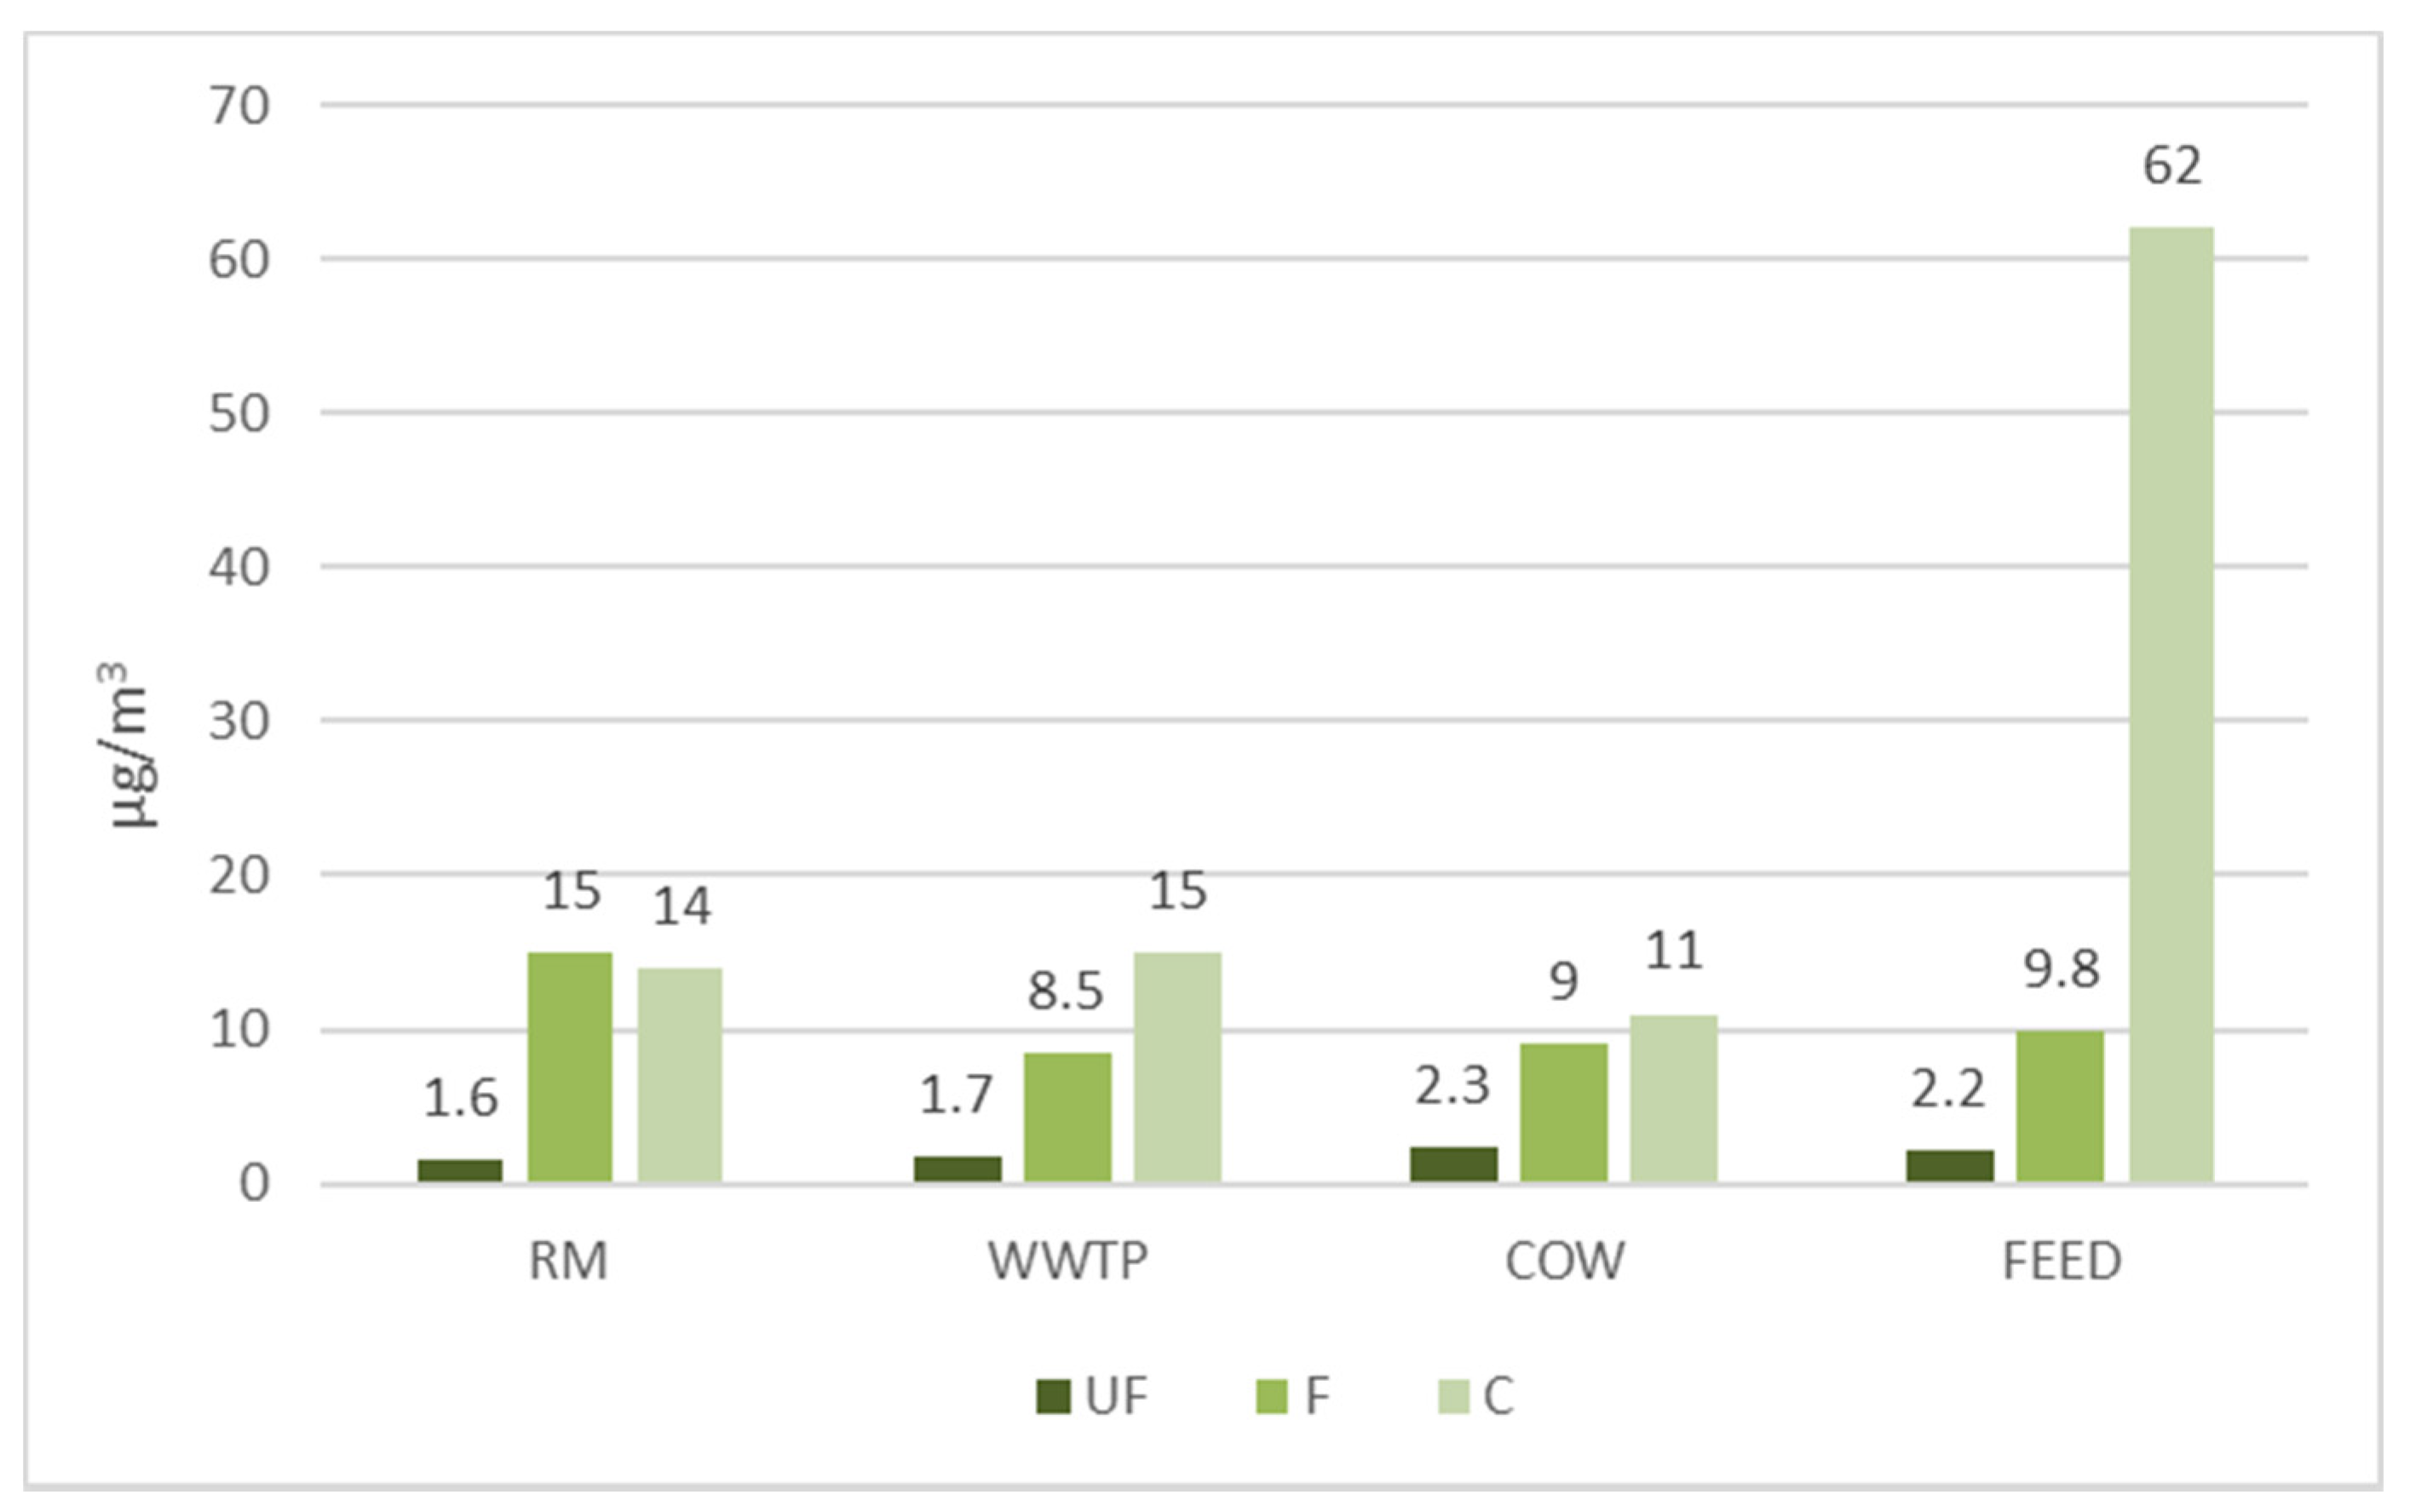
3.1. PM Mass Concentration
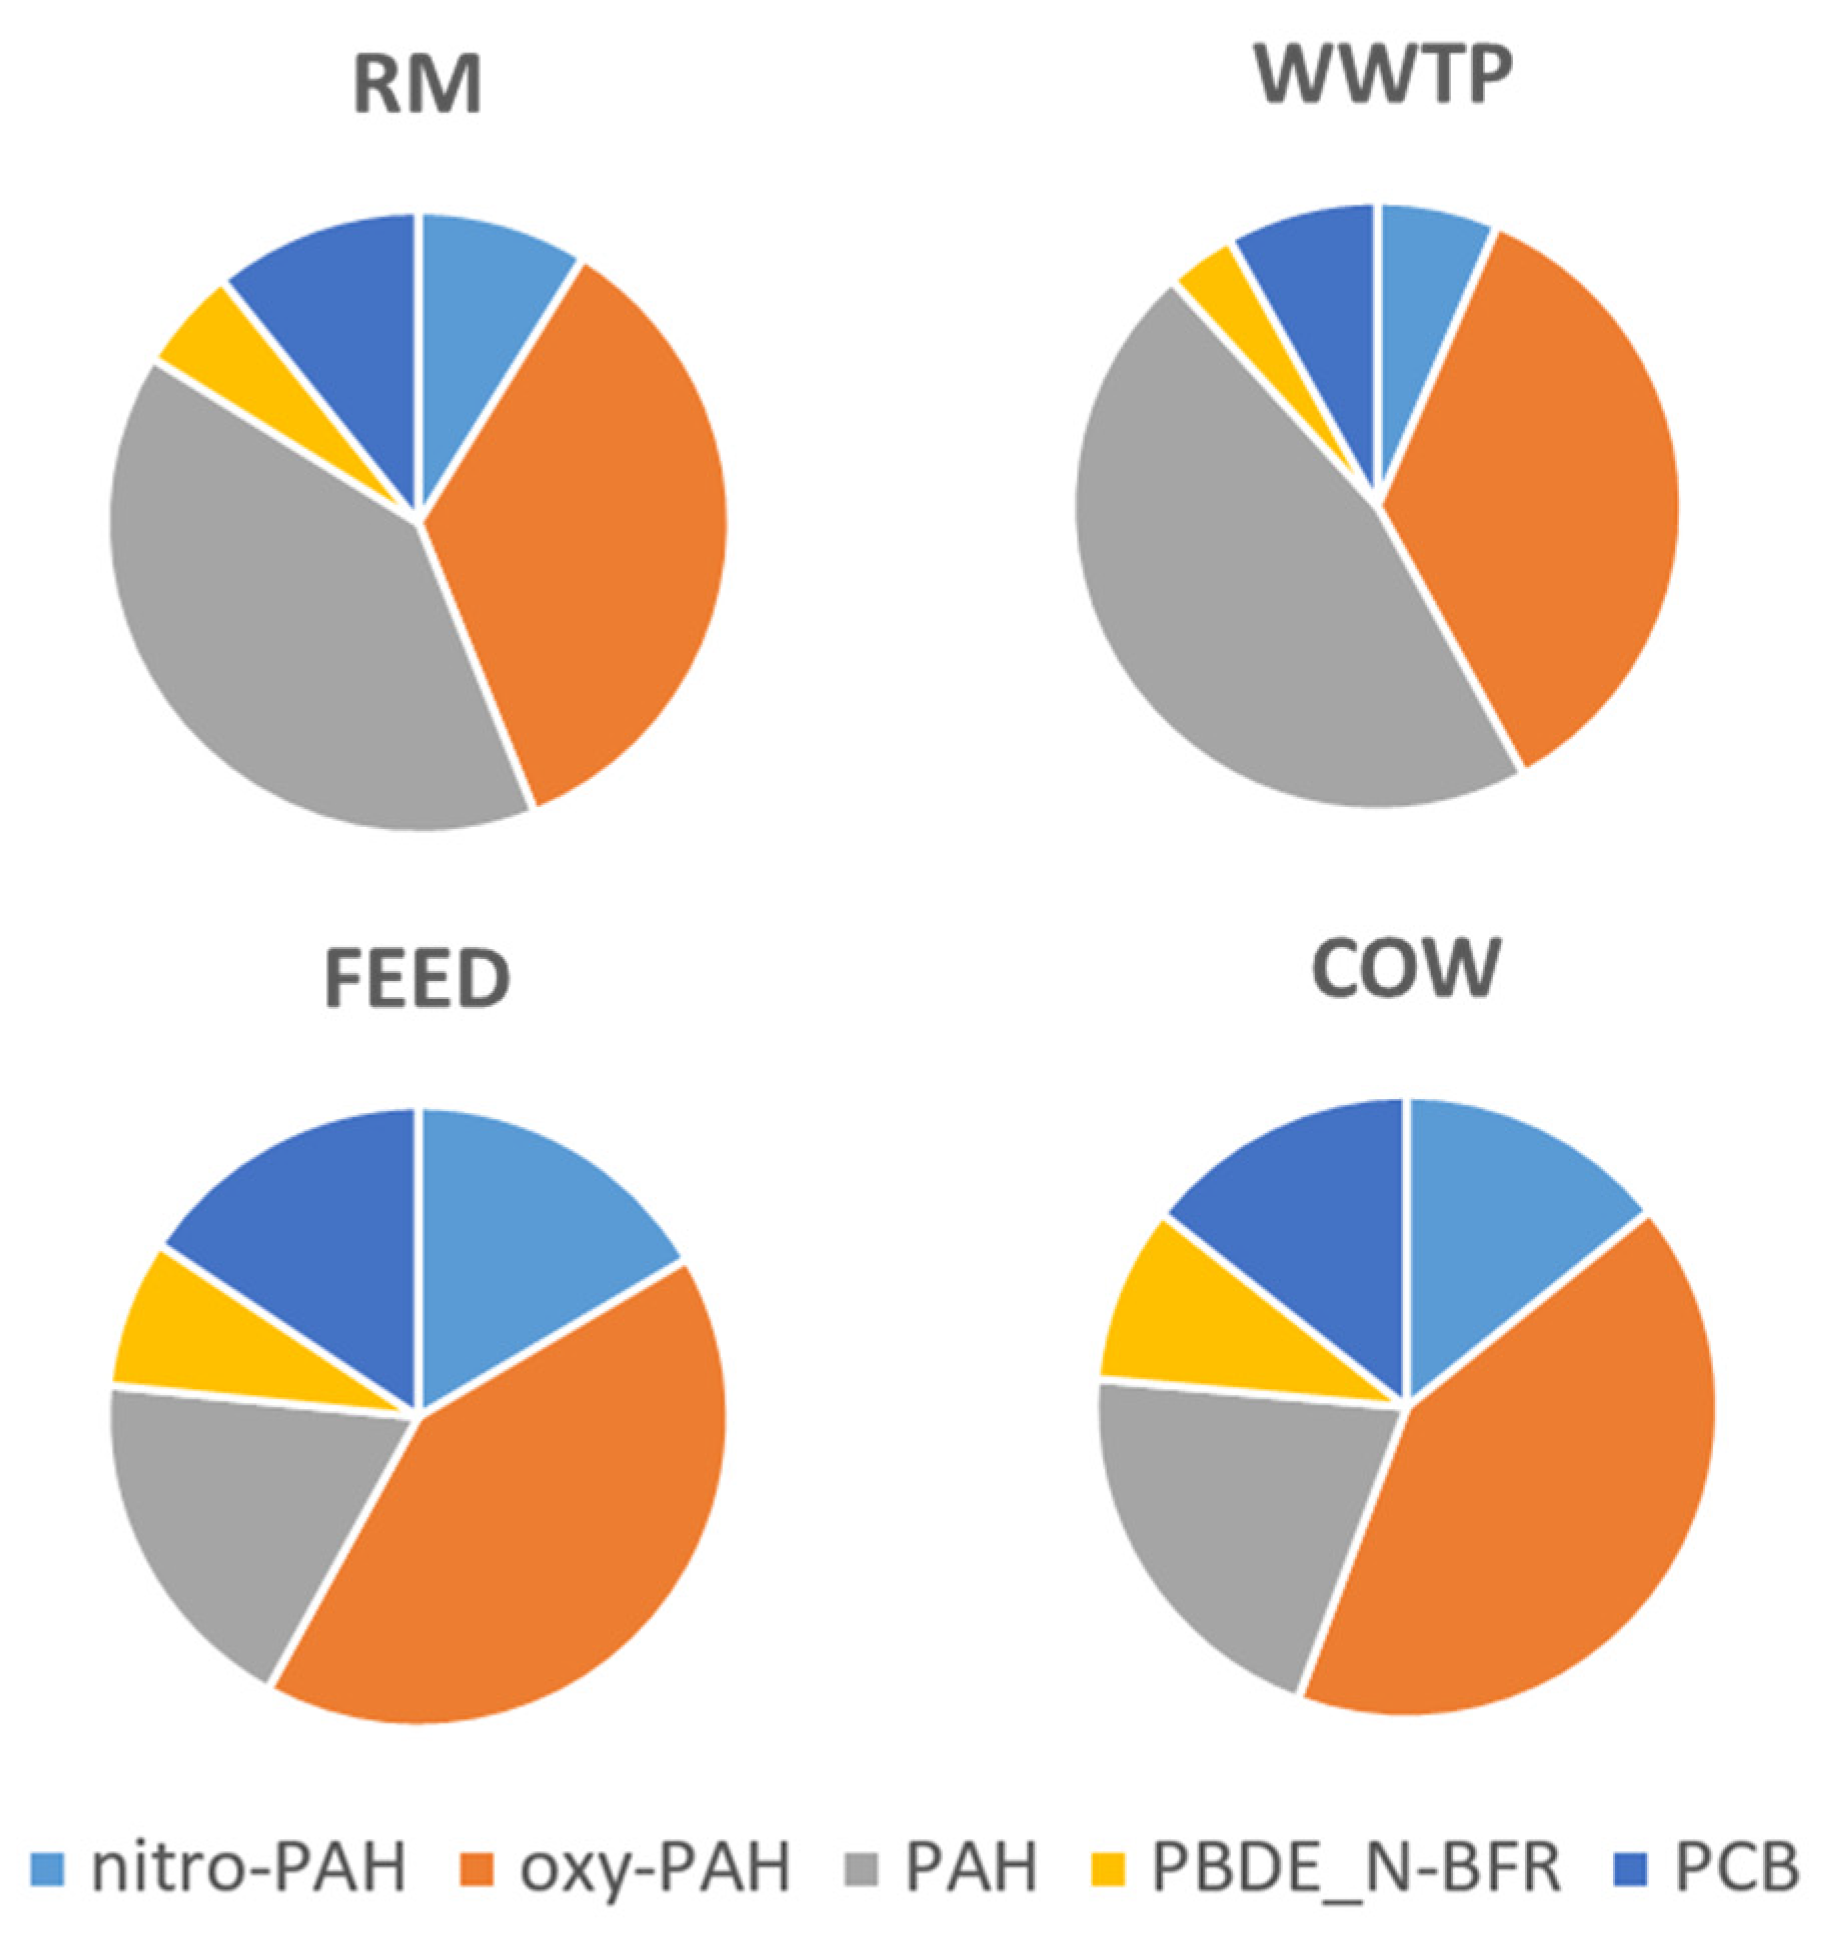
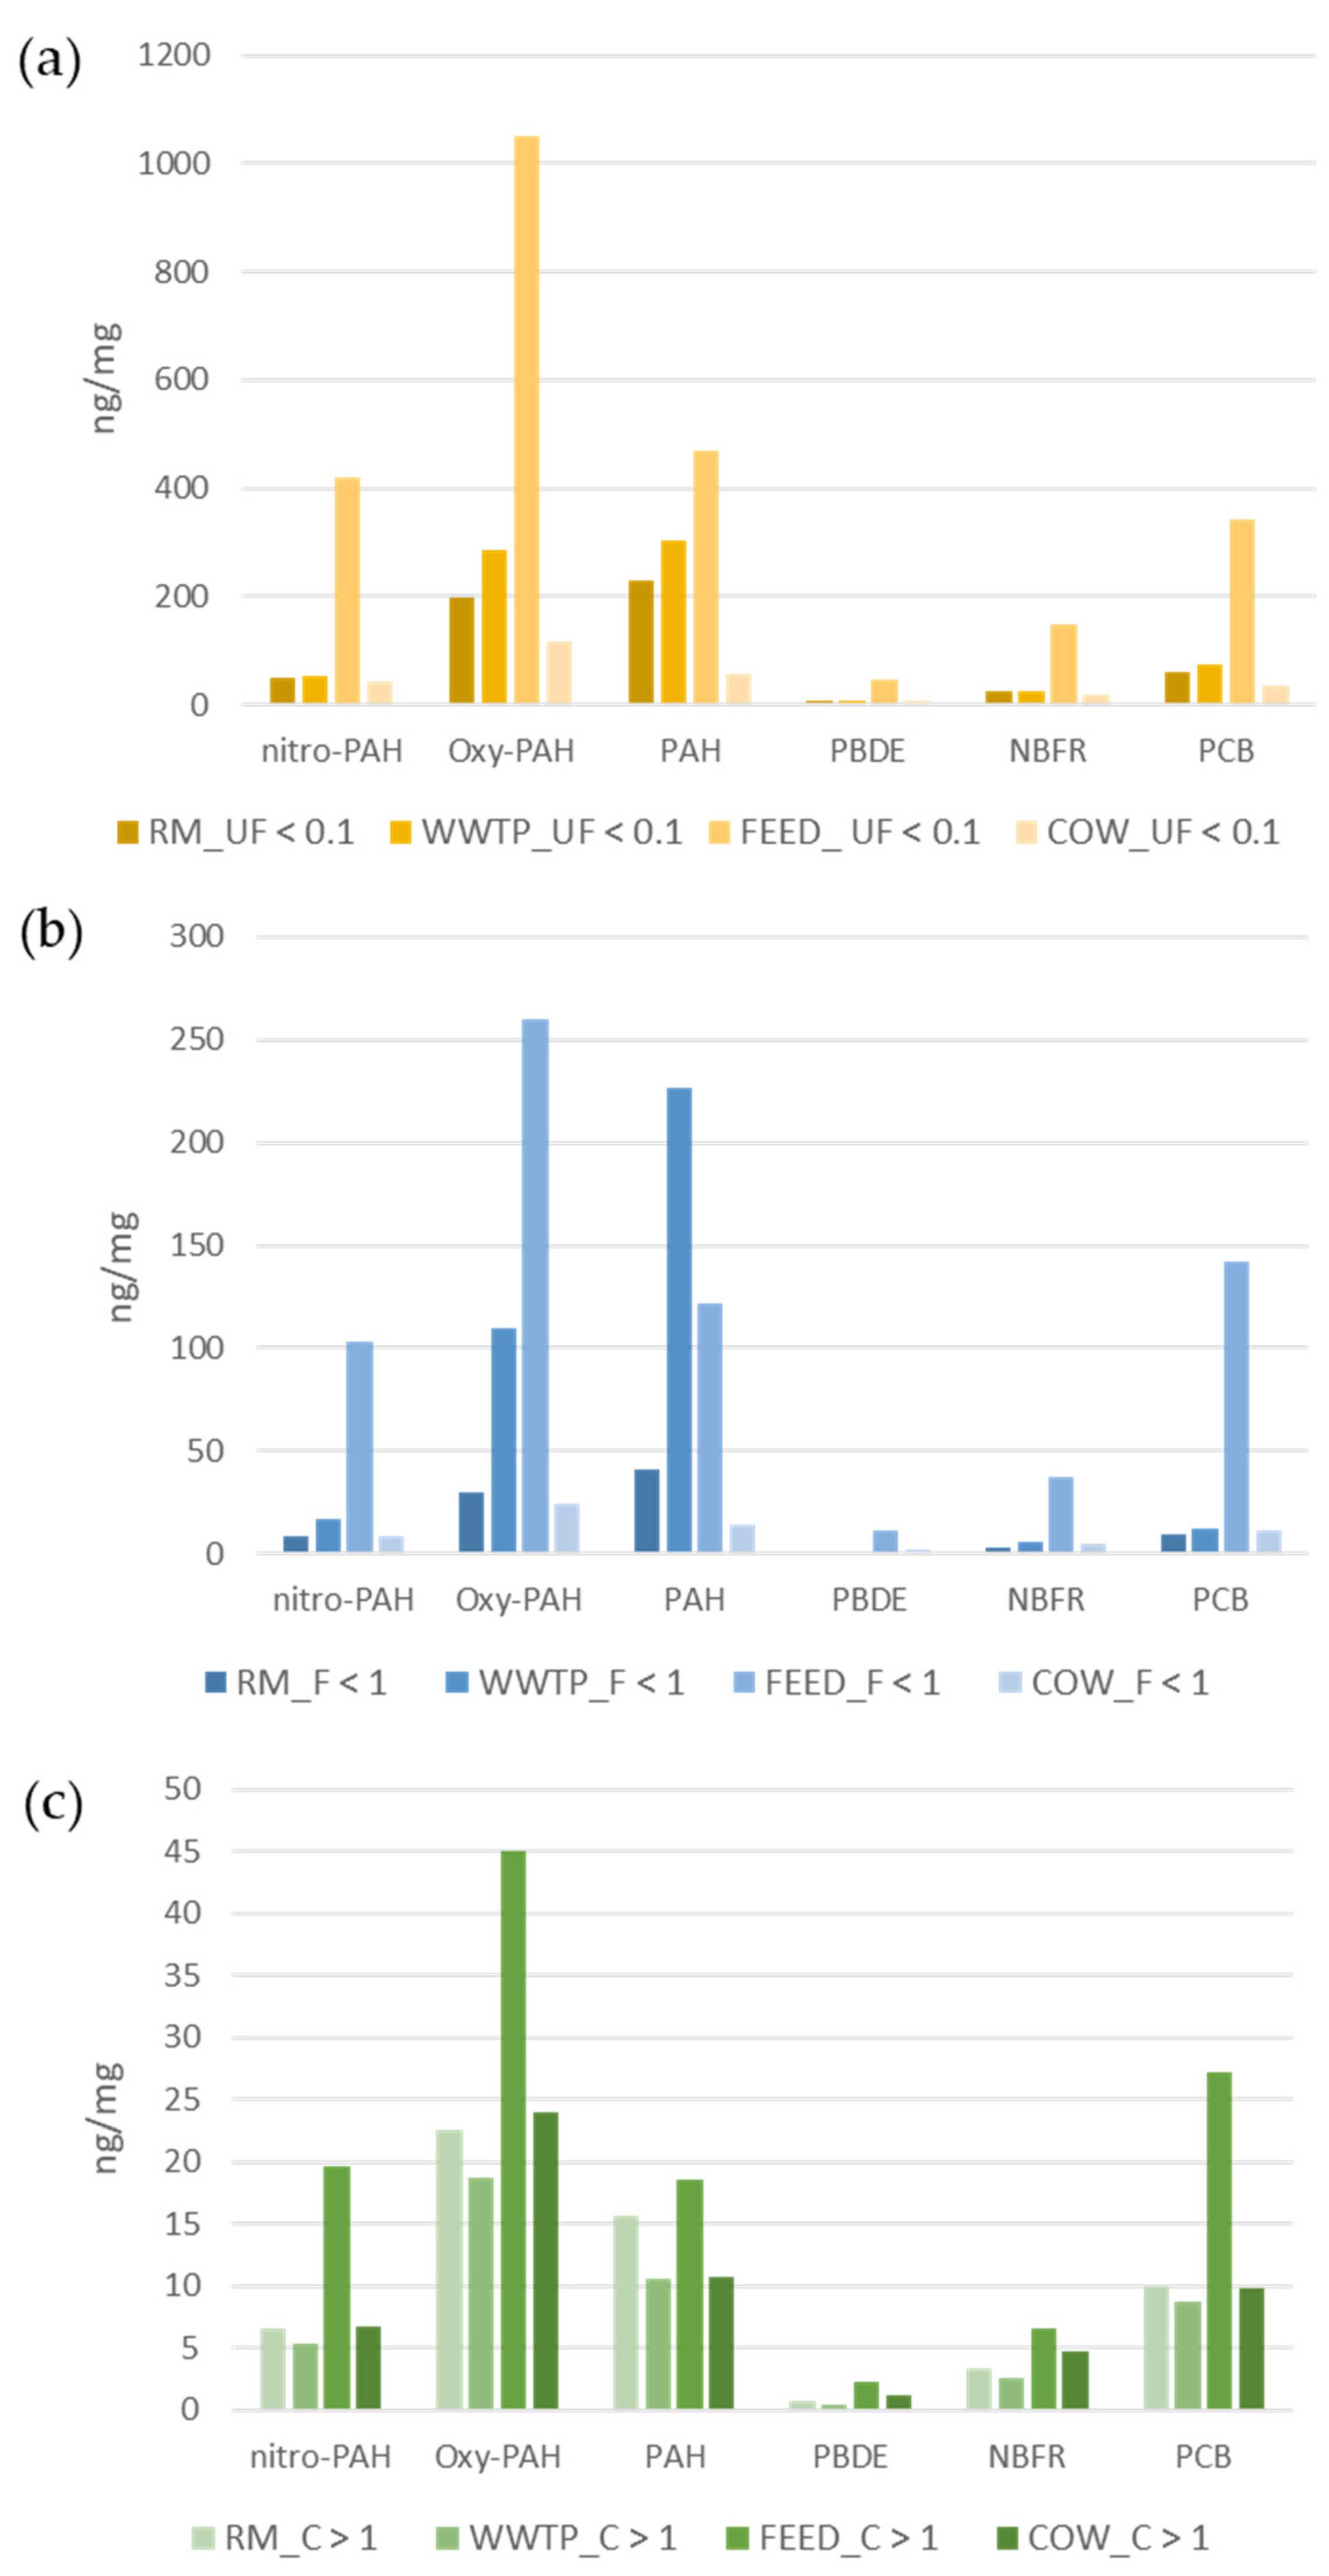
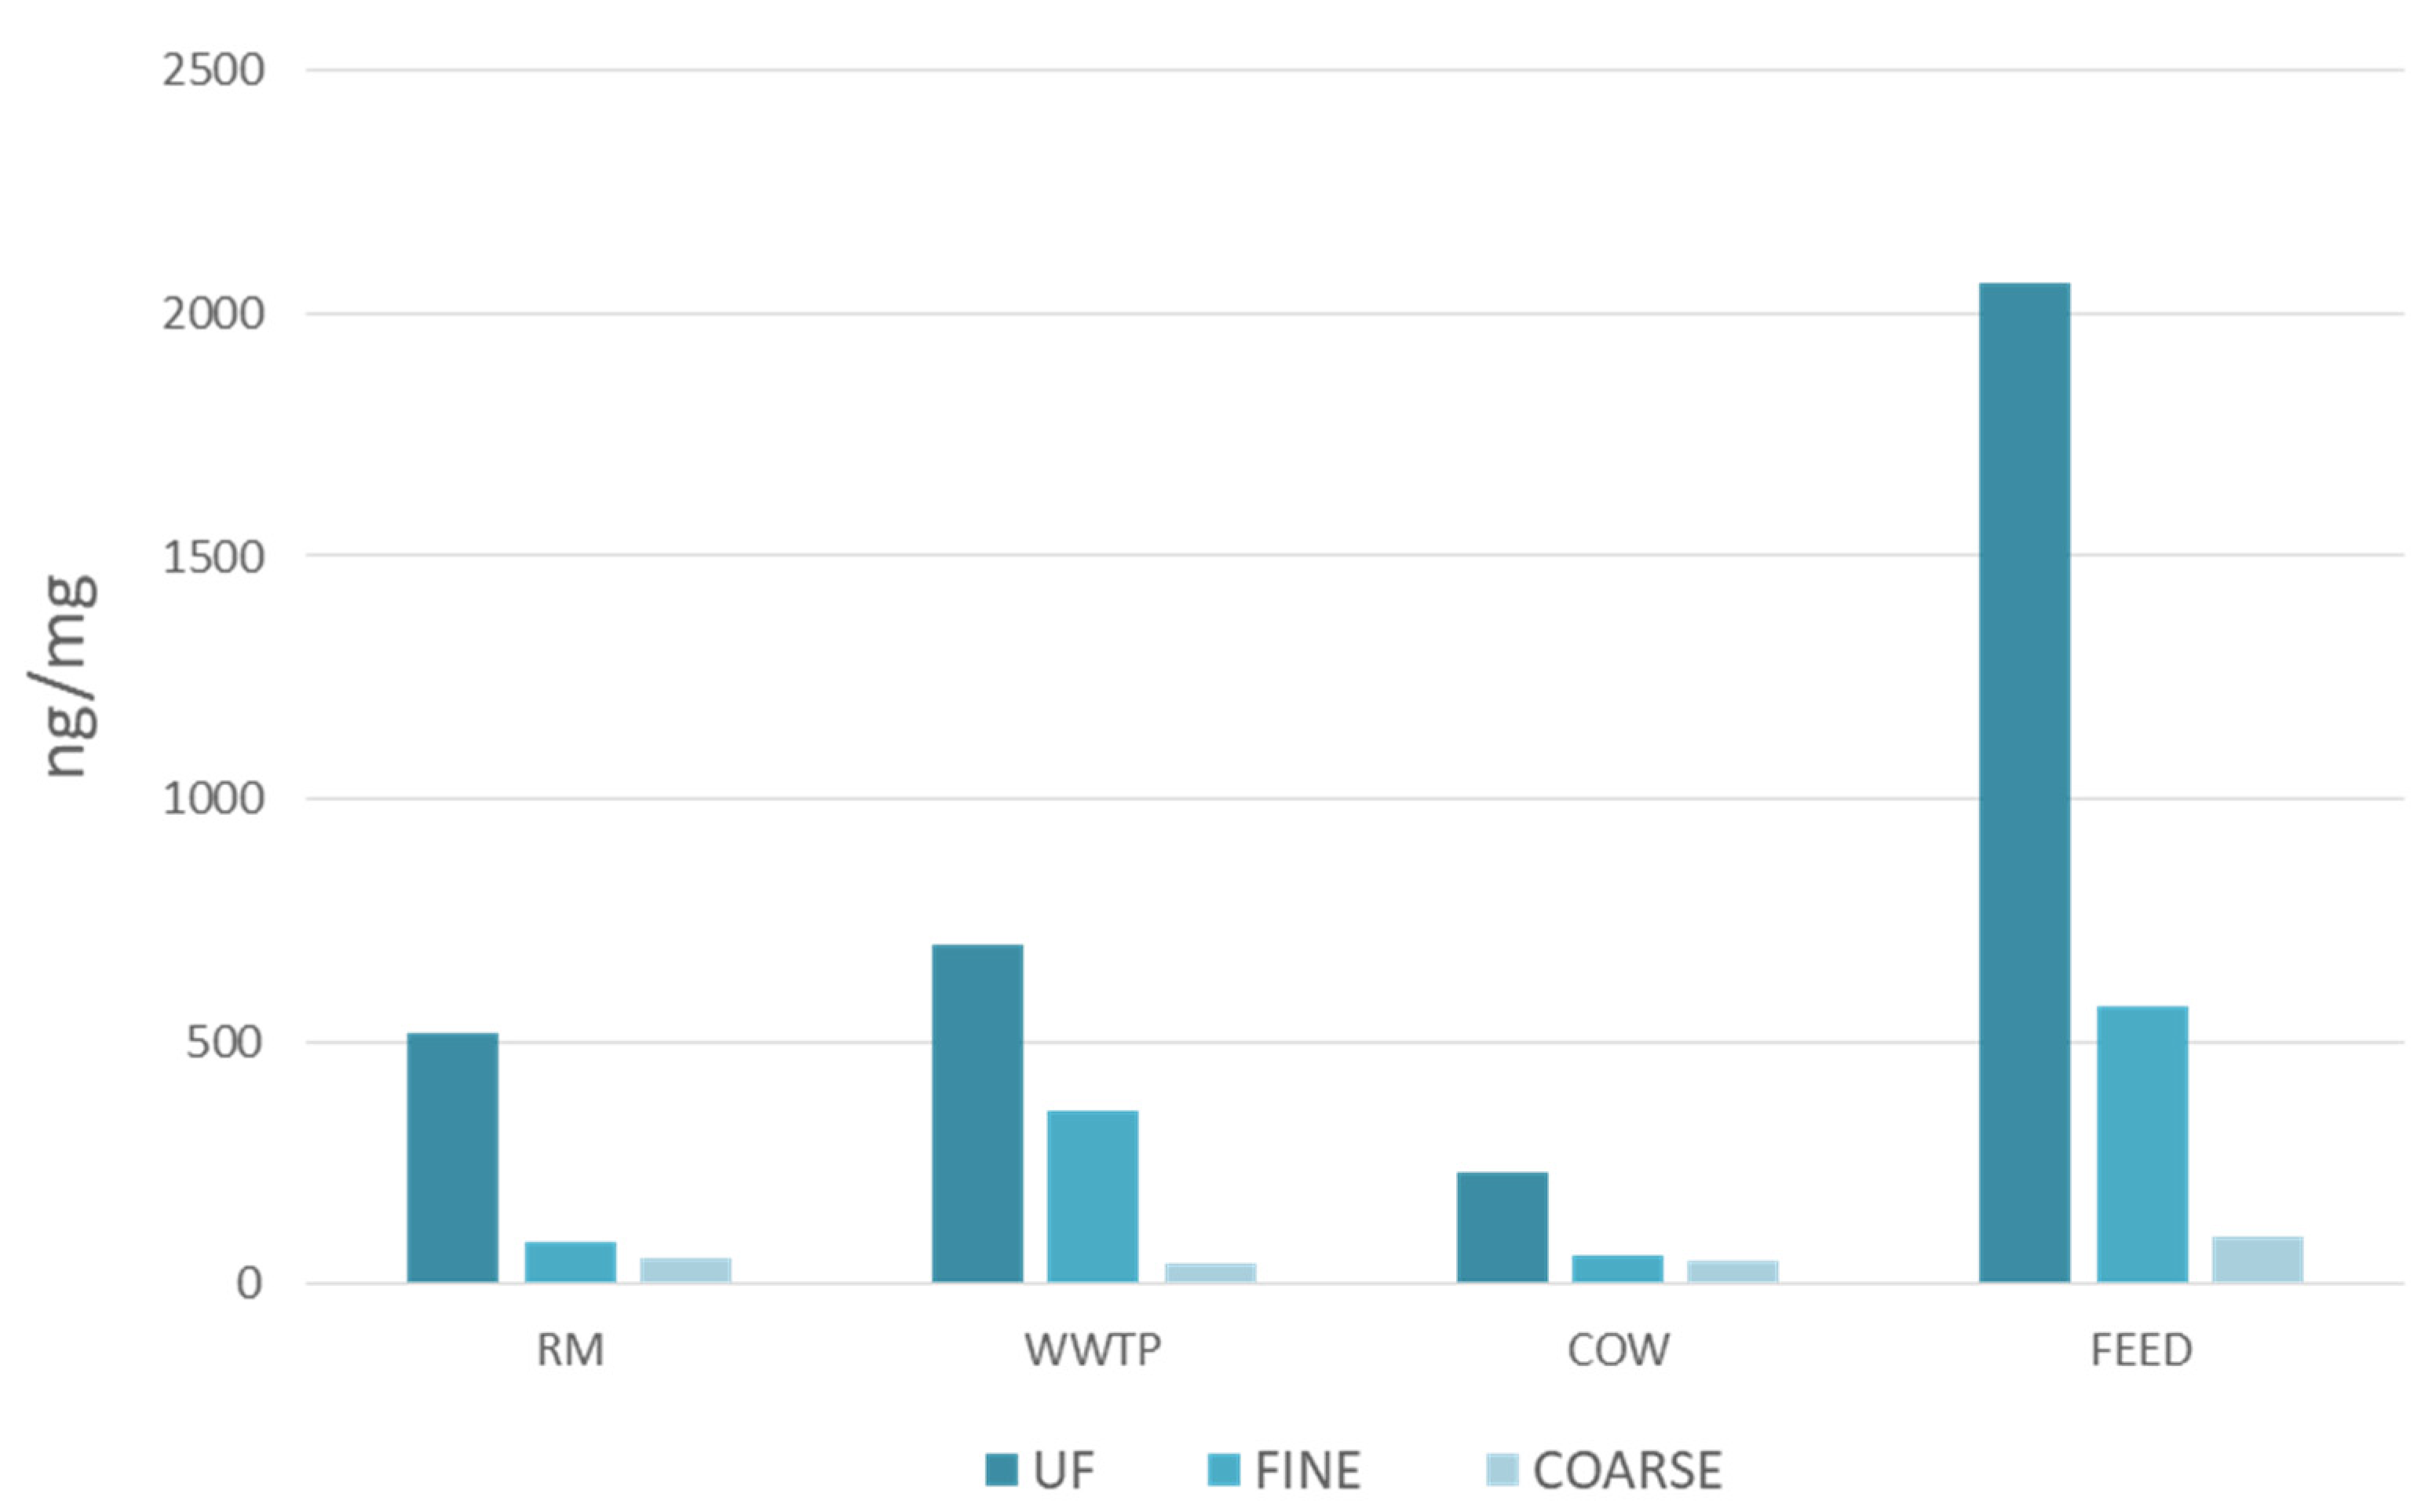
3.2. Organic Compound Concentrations
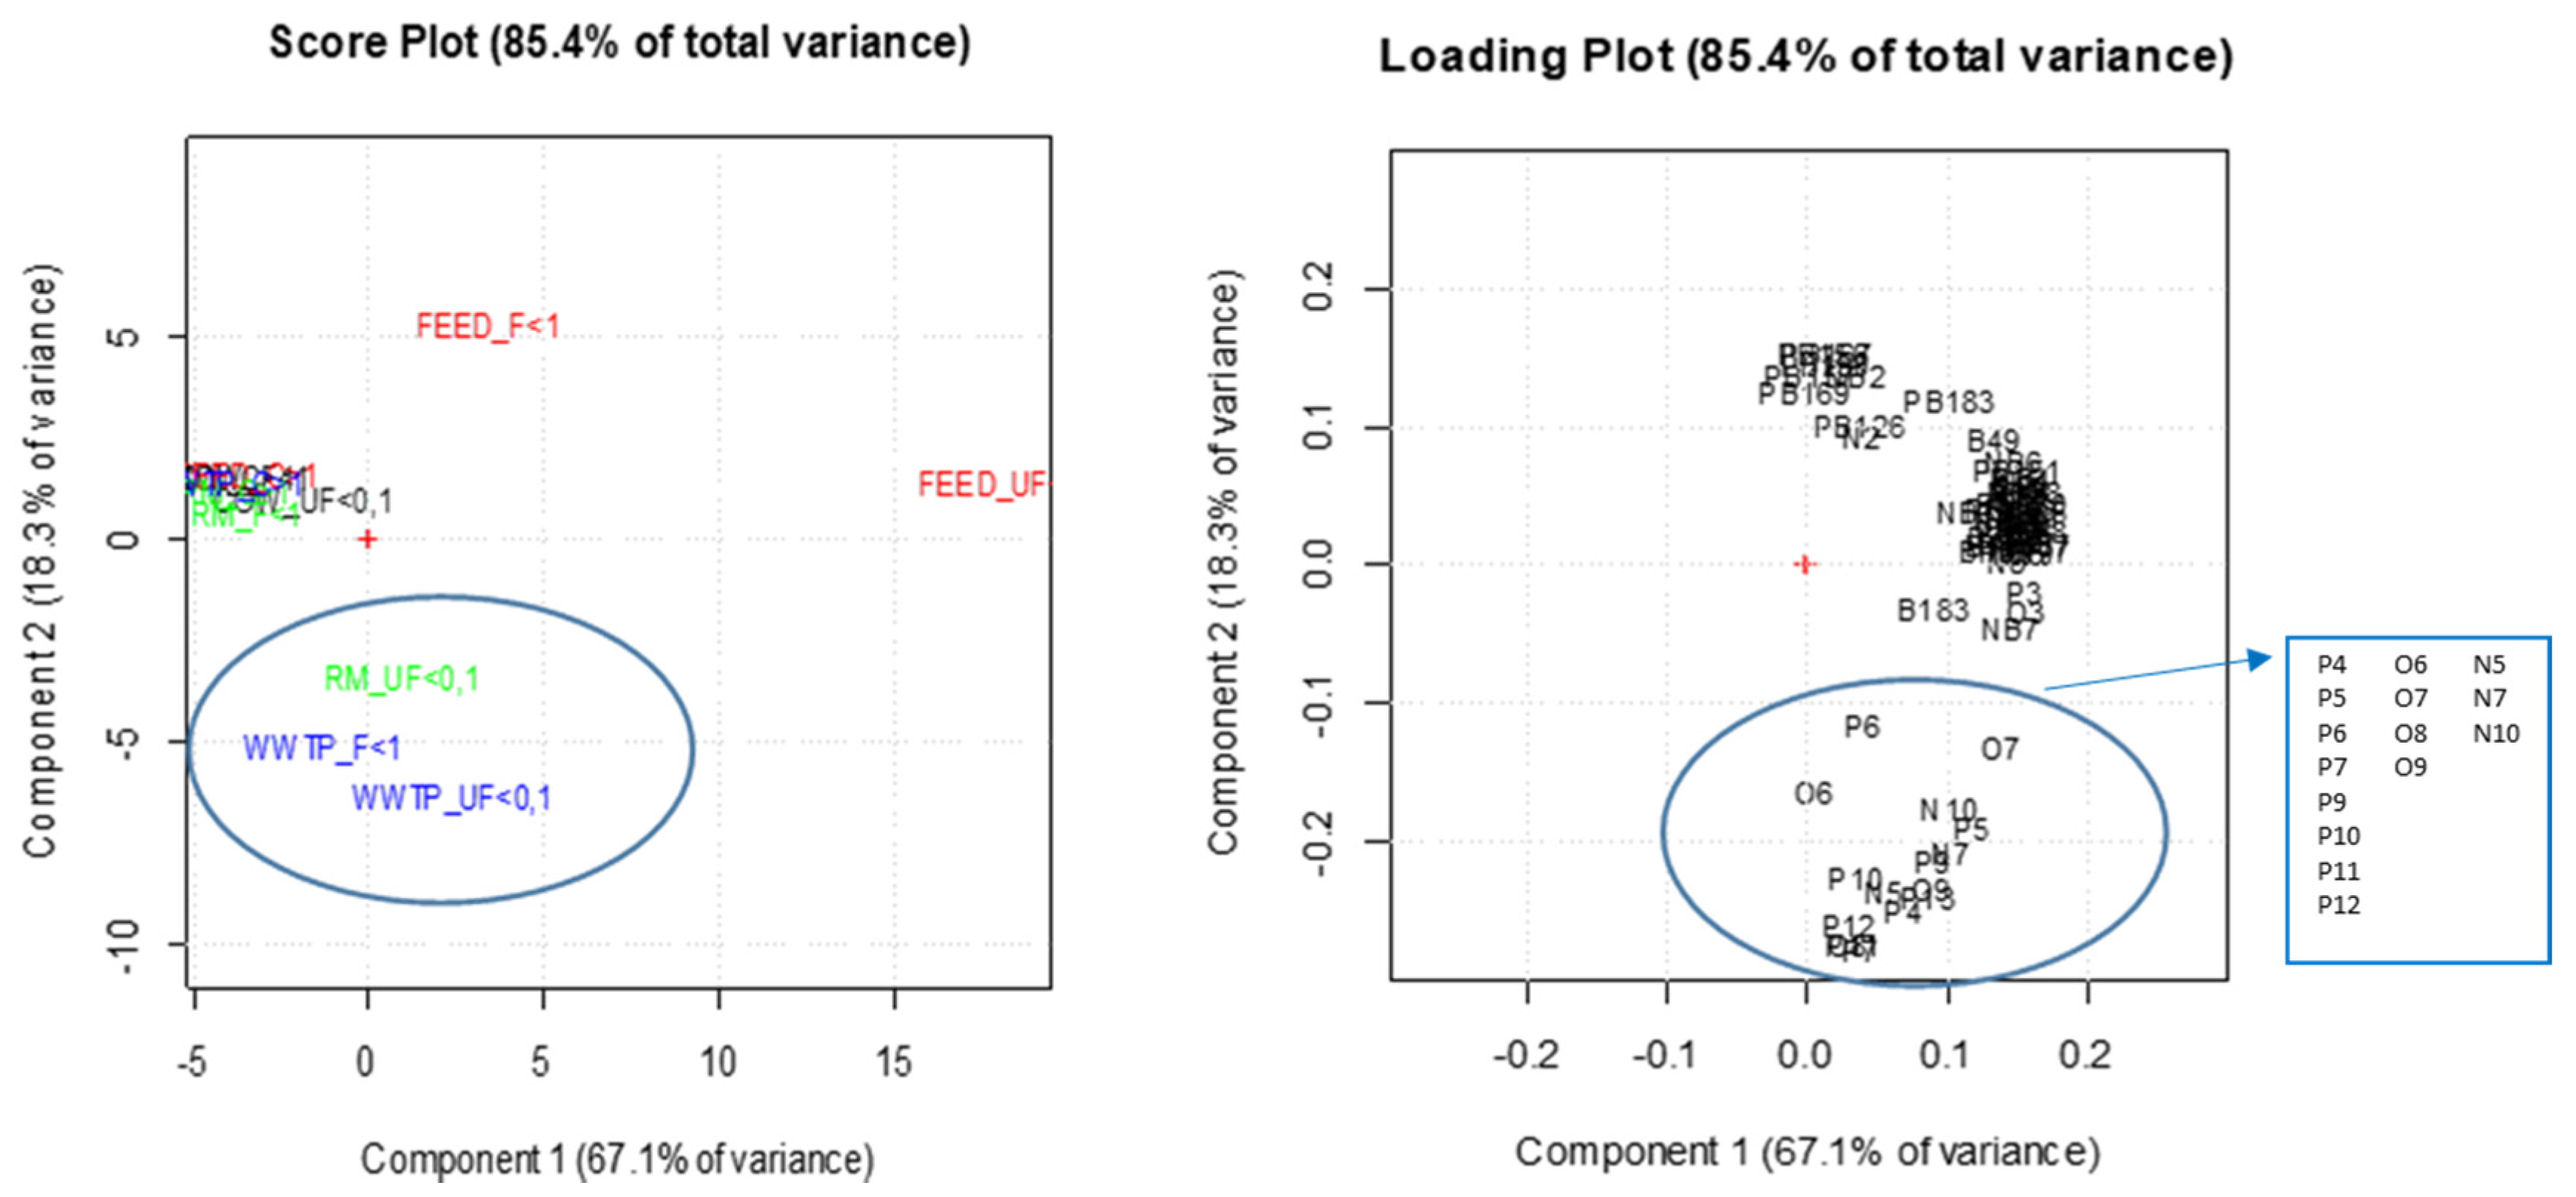
3.3. Principal Component Analysis (PCA)
3.3.1. All Organic Compounds
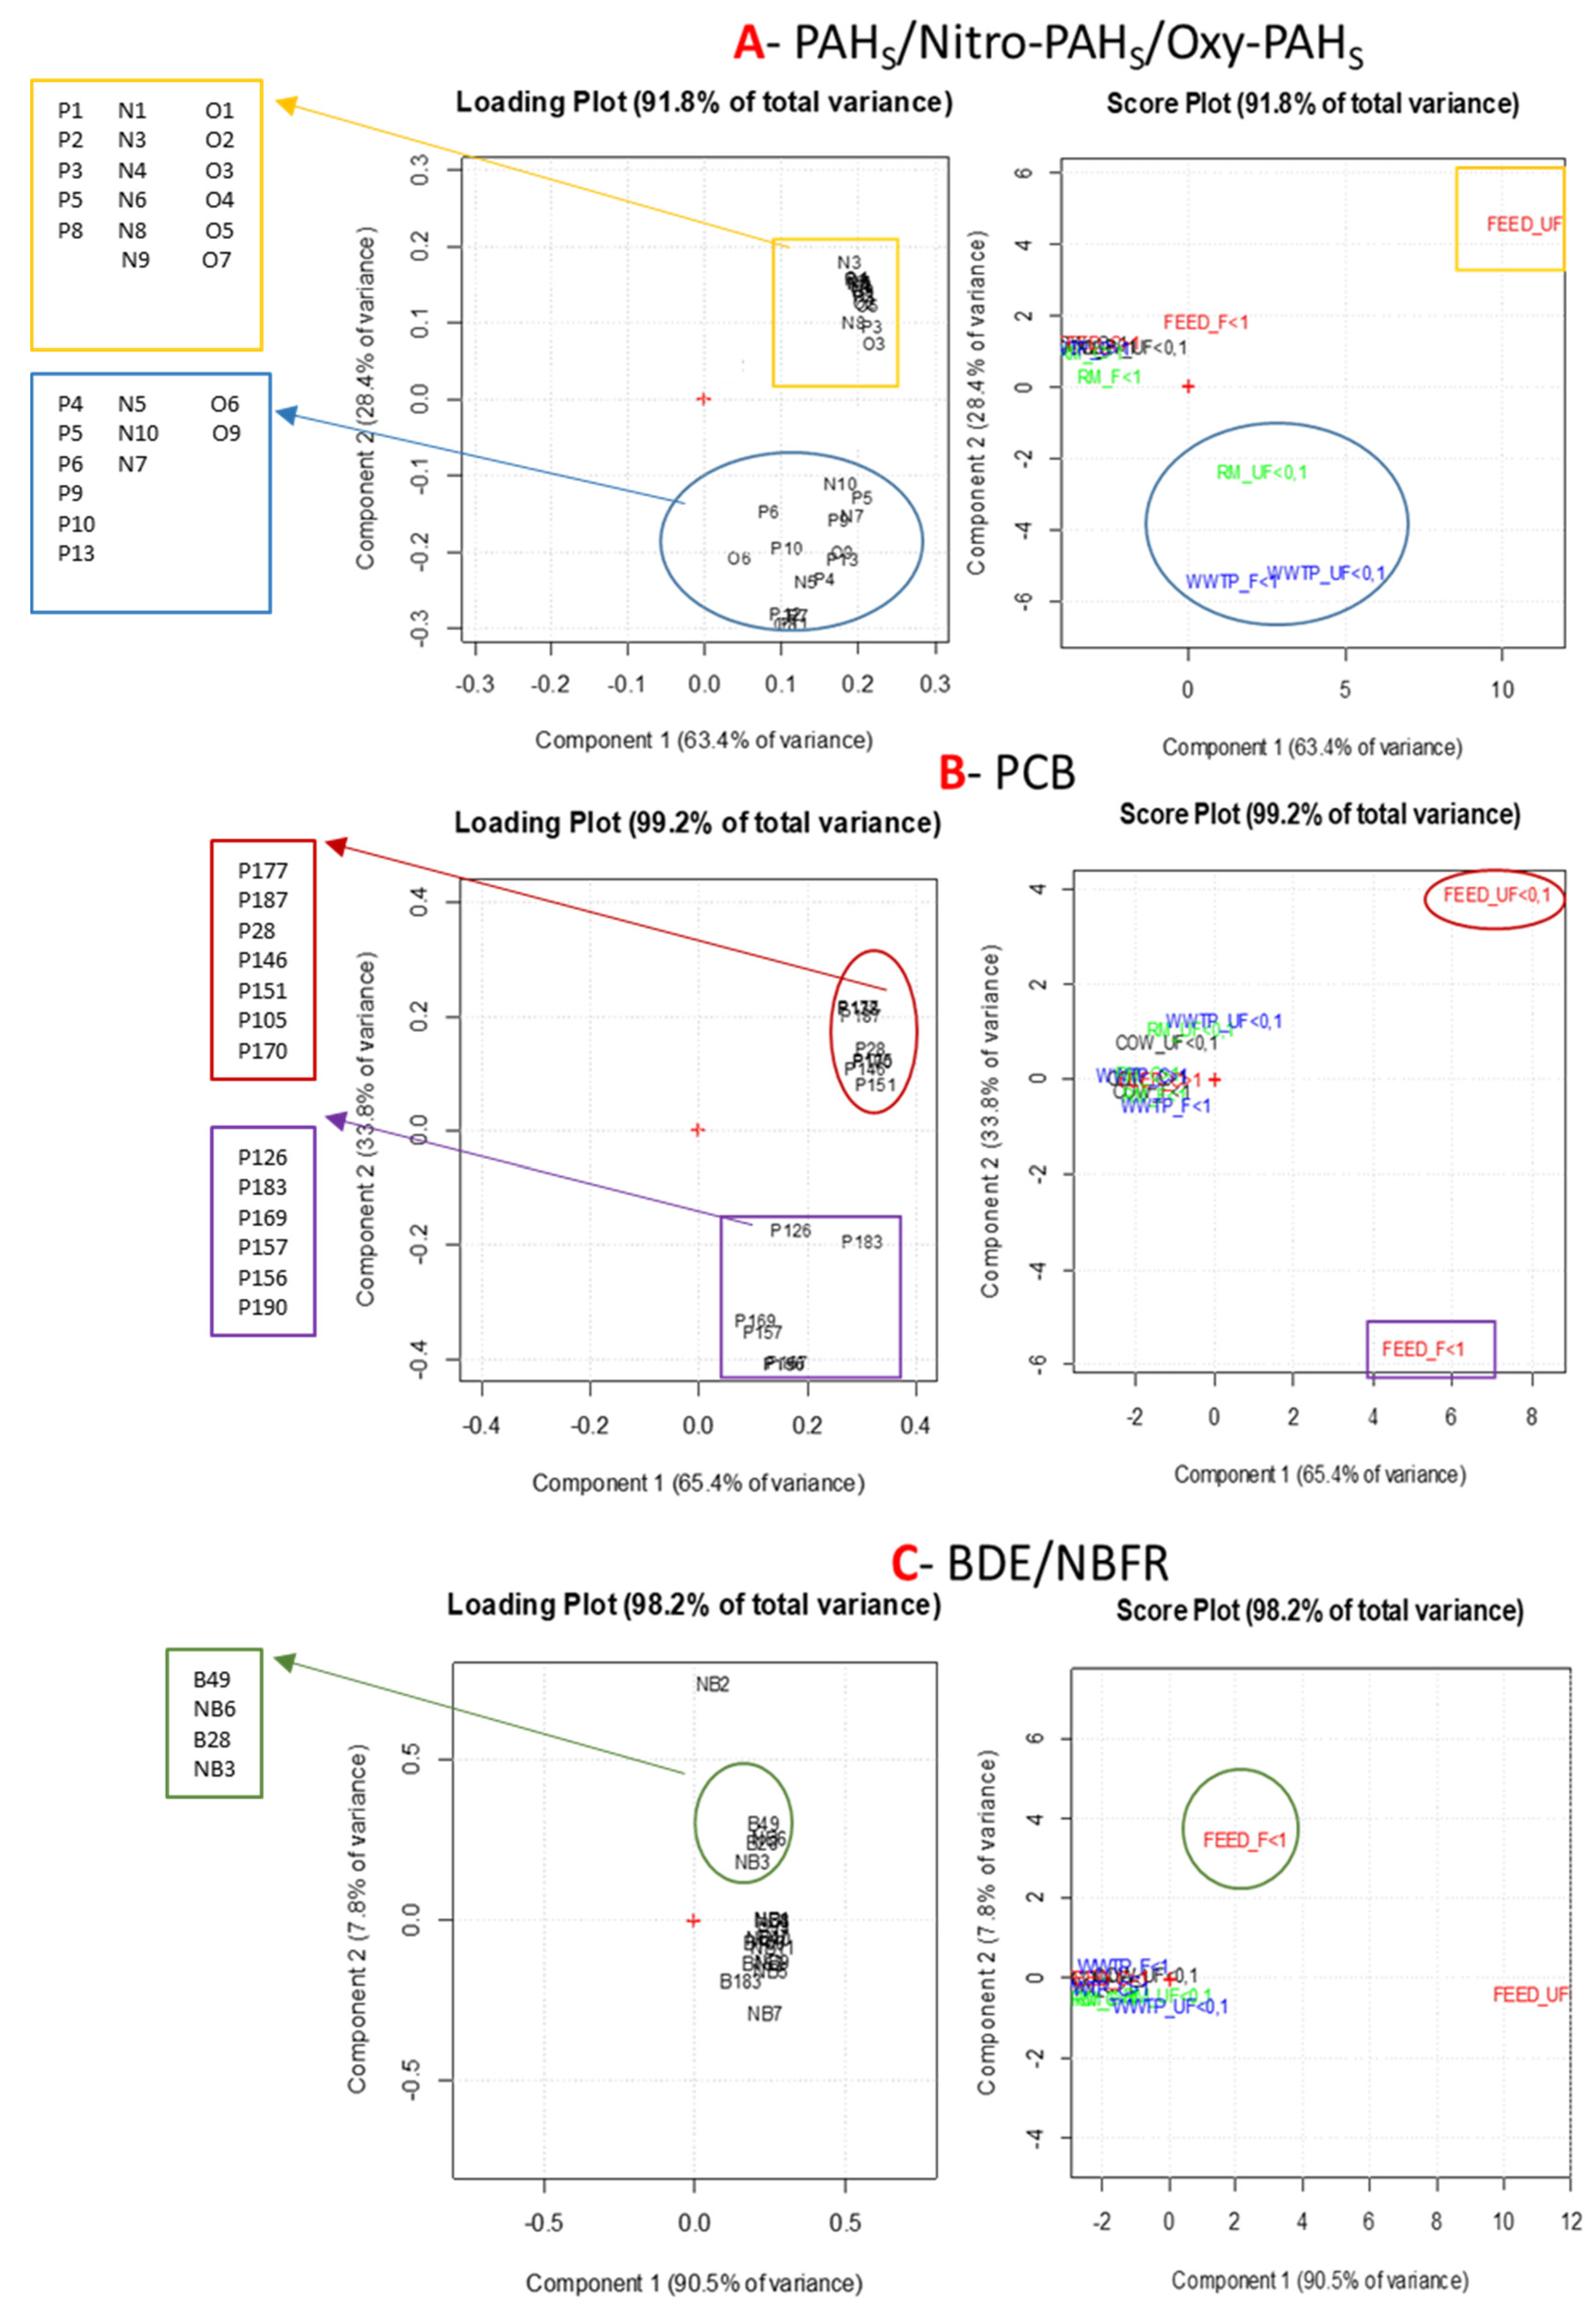
3.3.2. Individual Classes of Organic Compounds
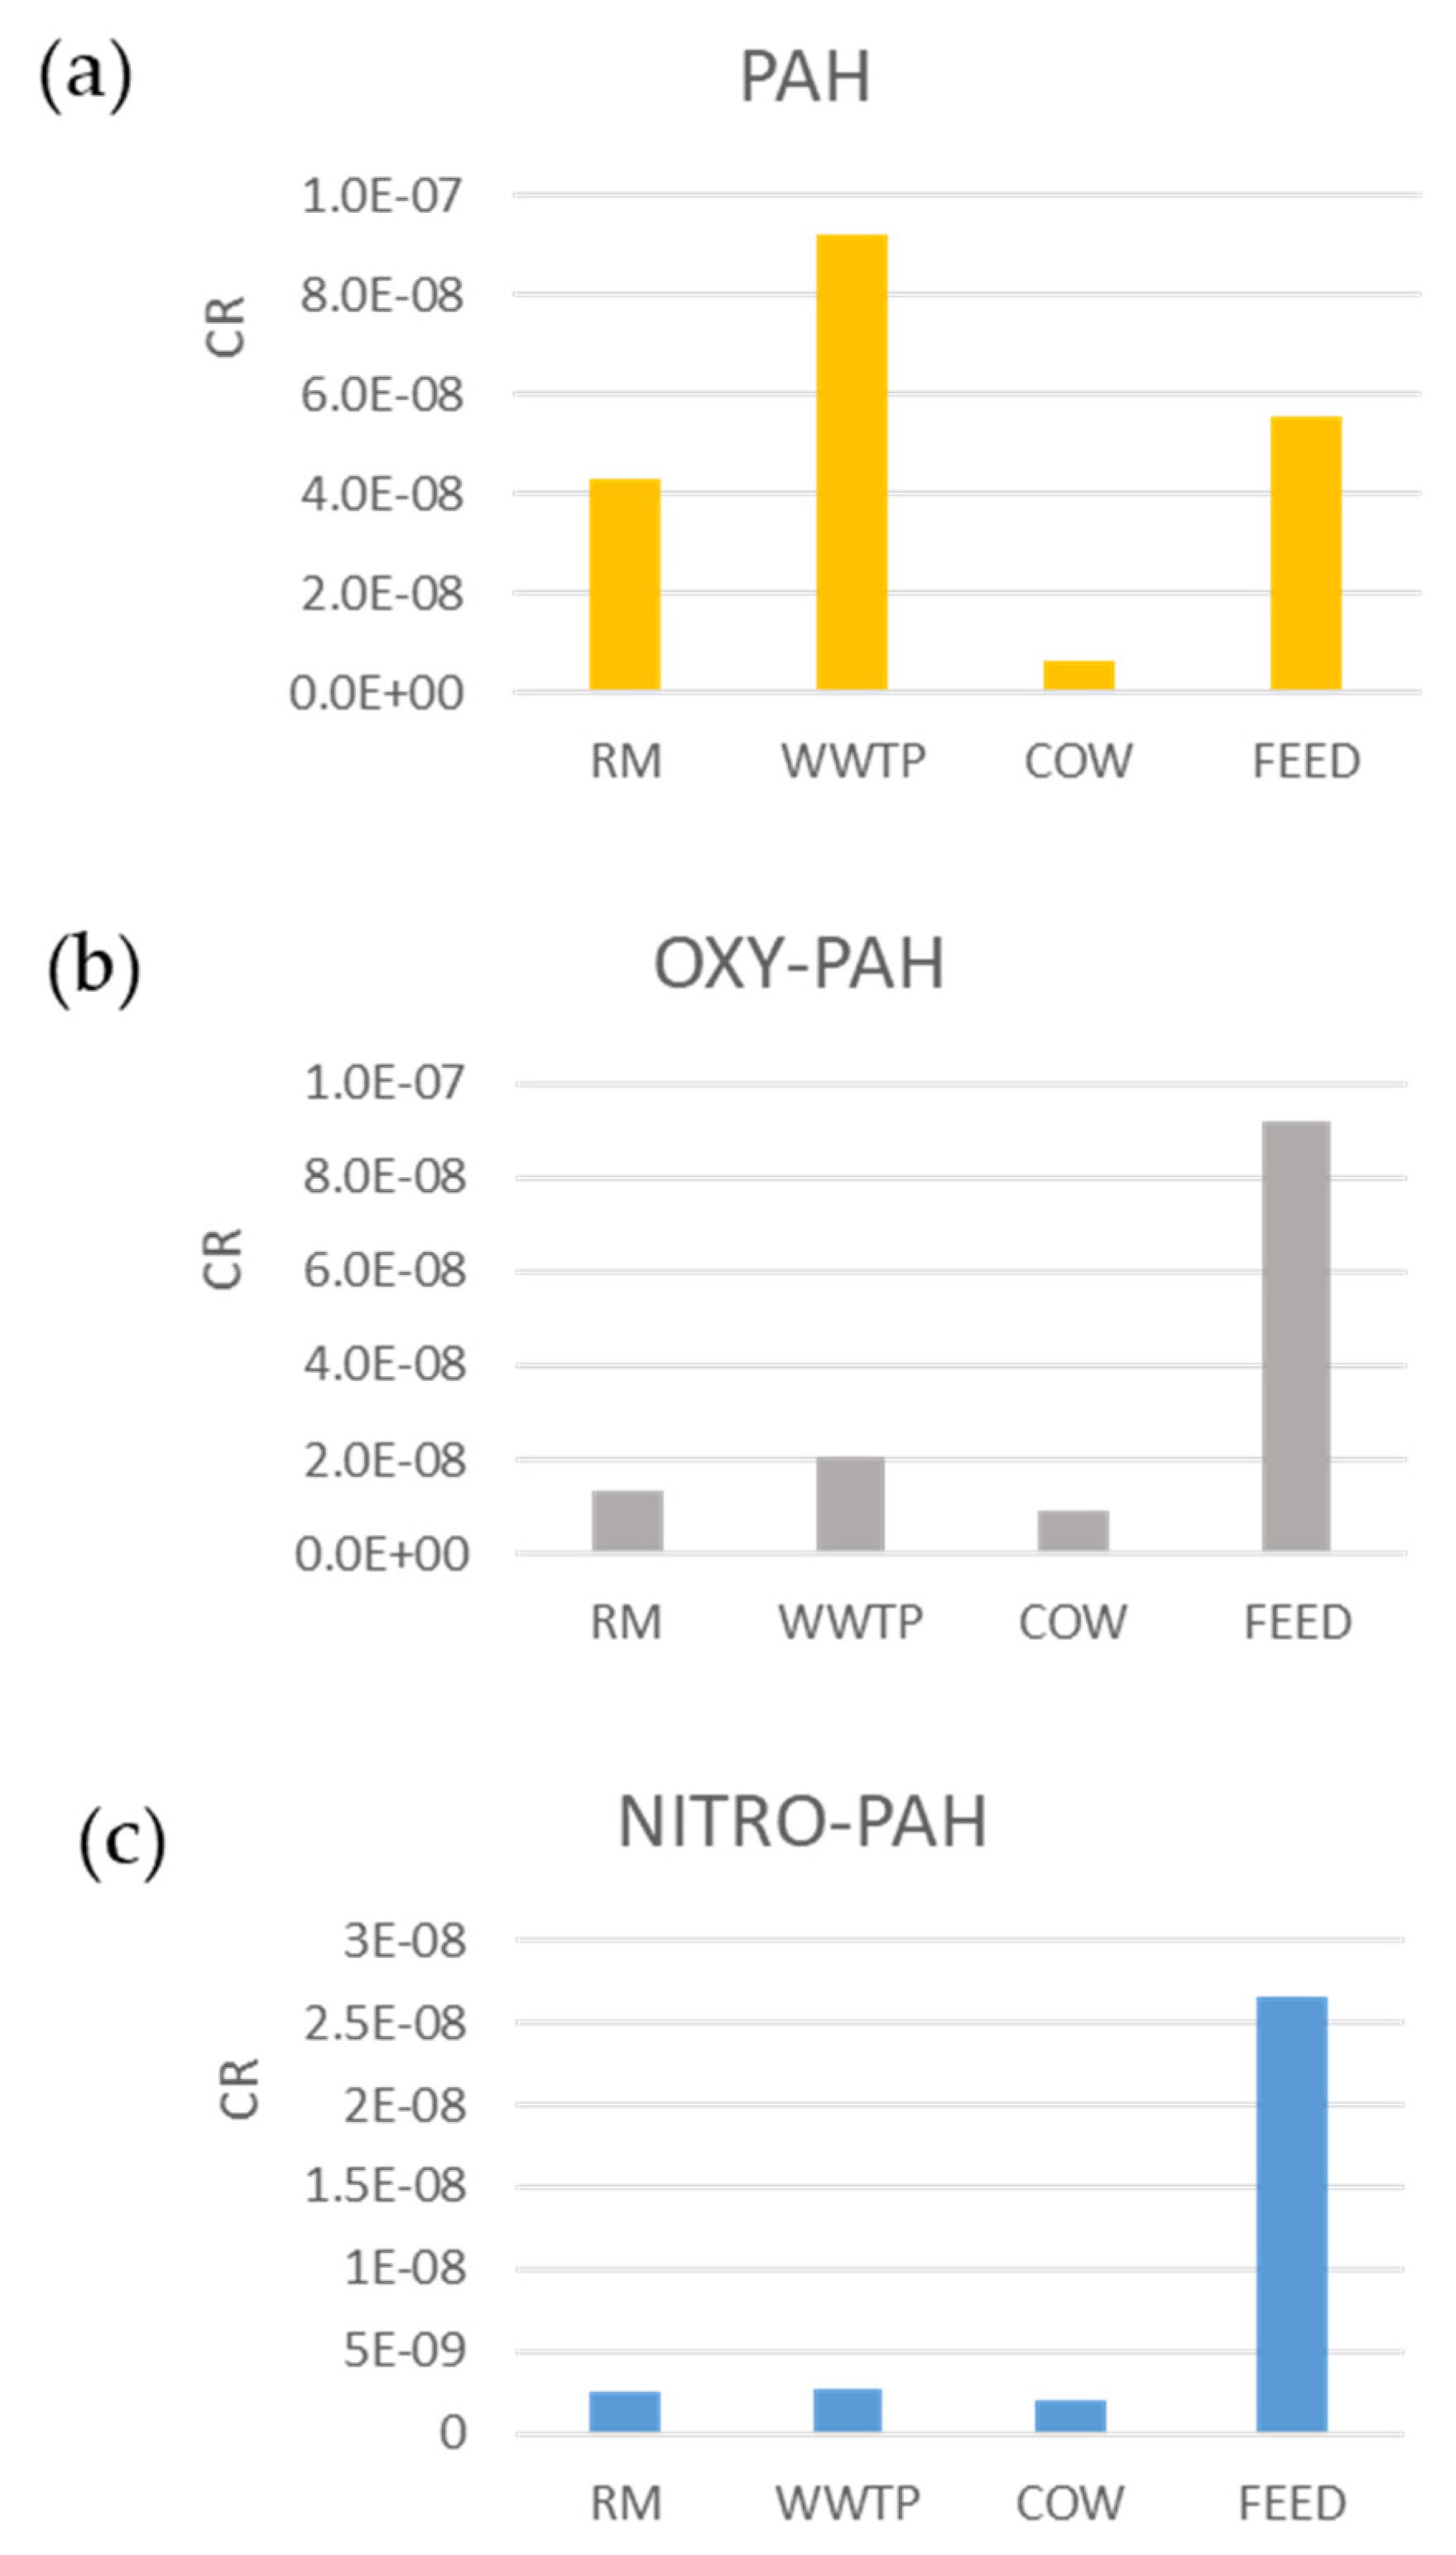
4. Risk Assessment
4.1. PAHs
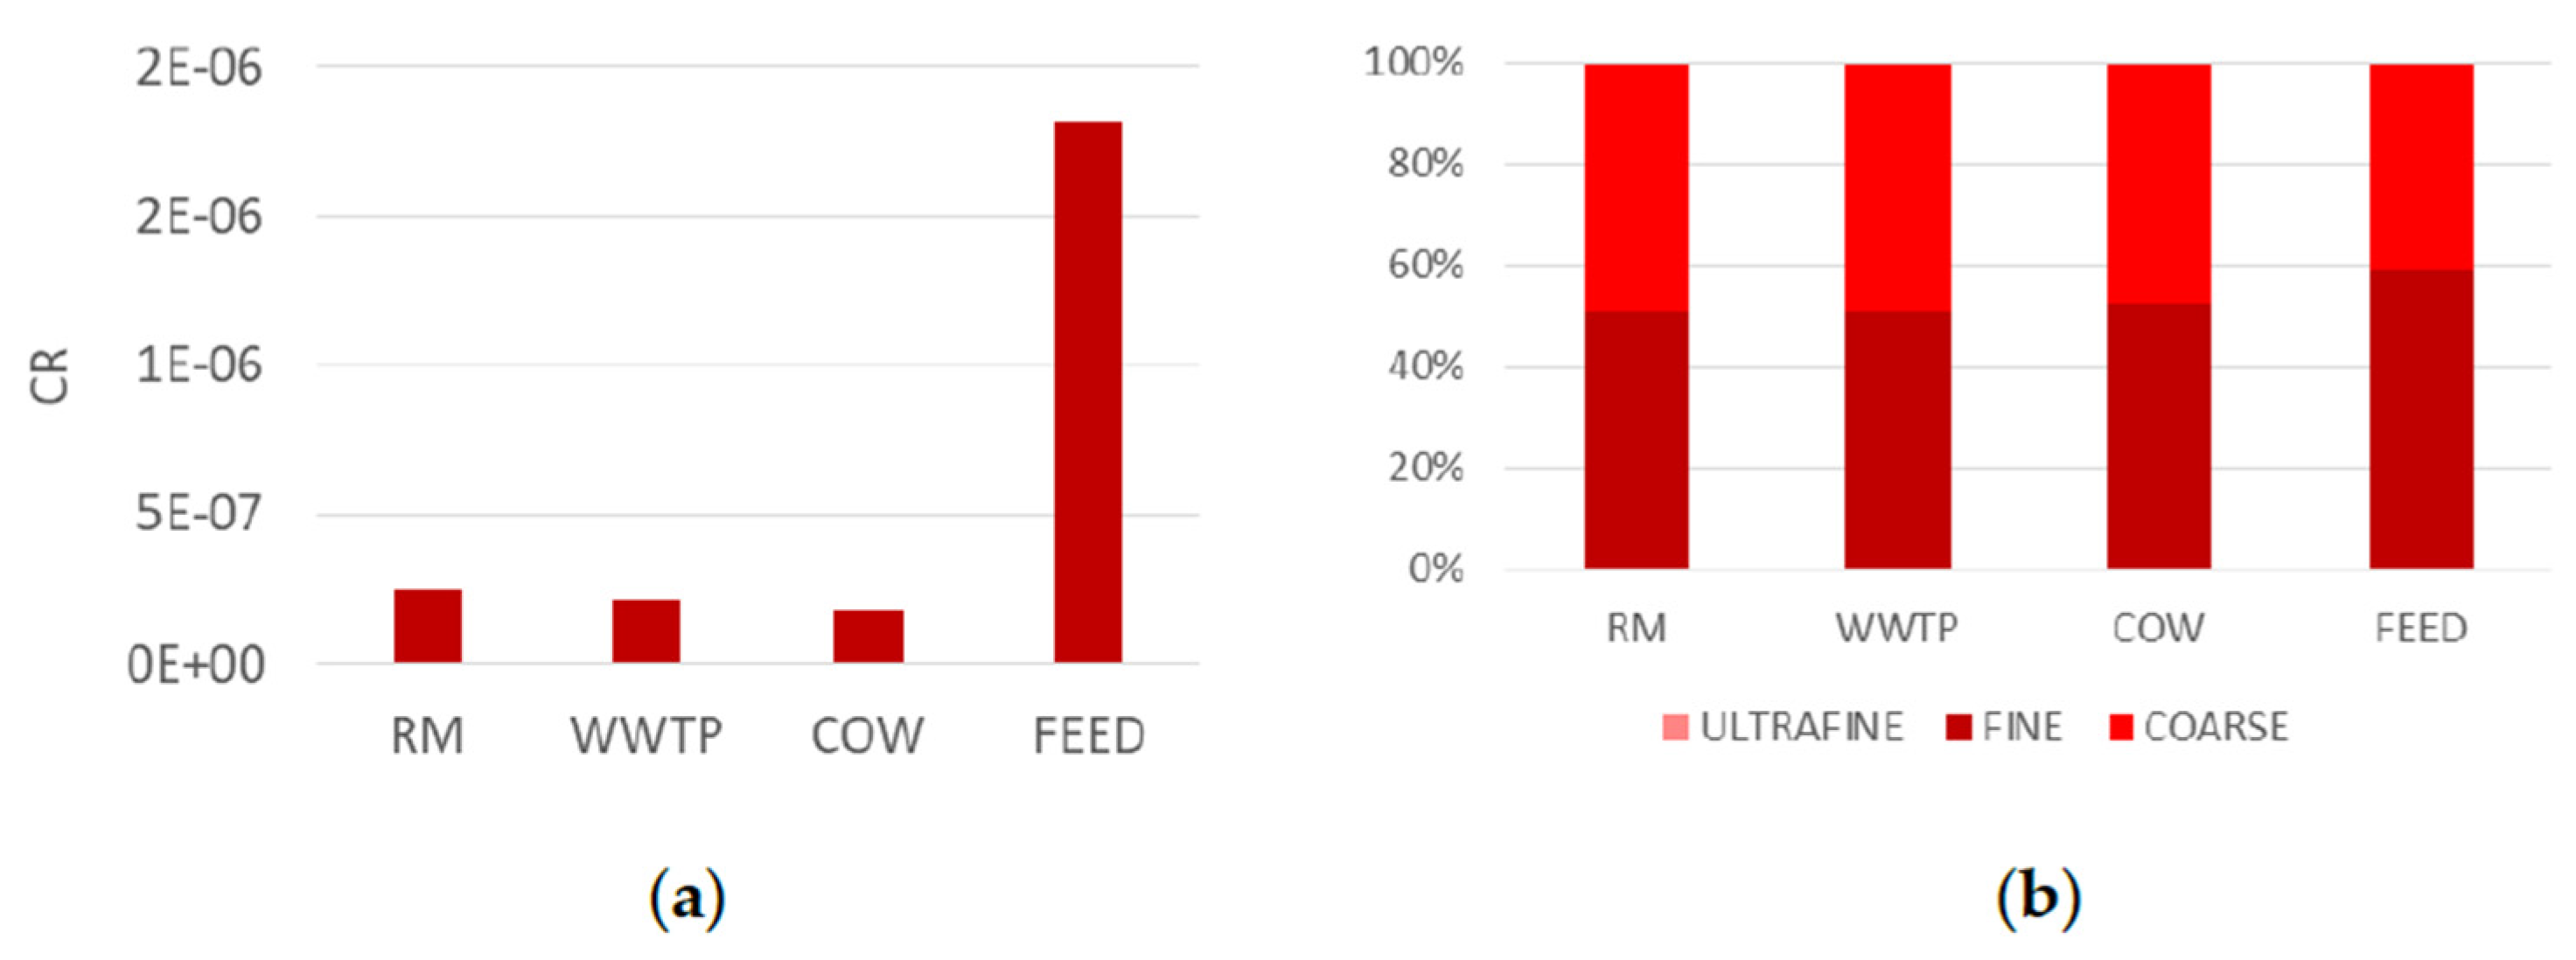
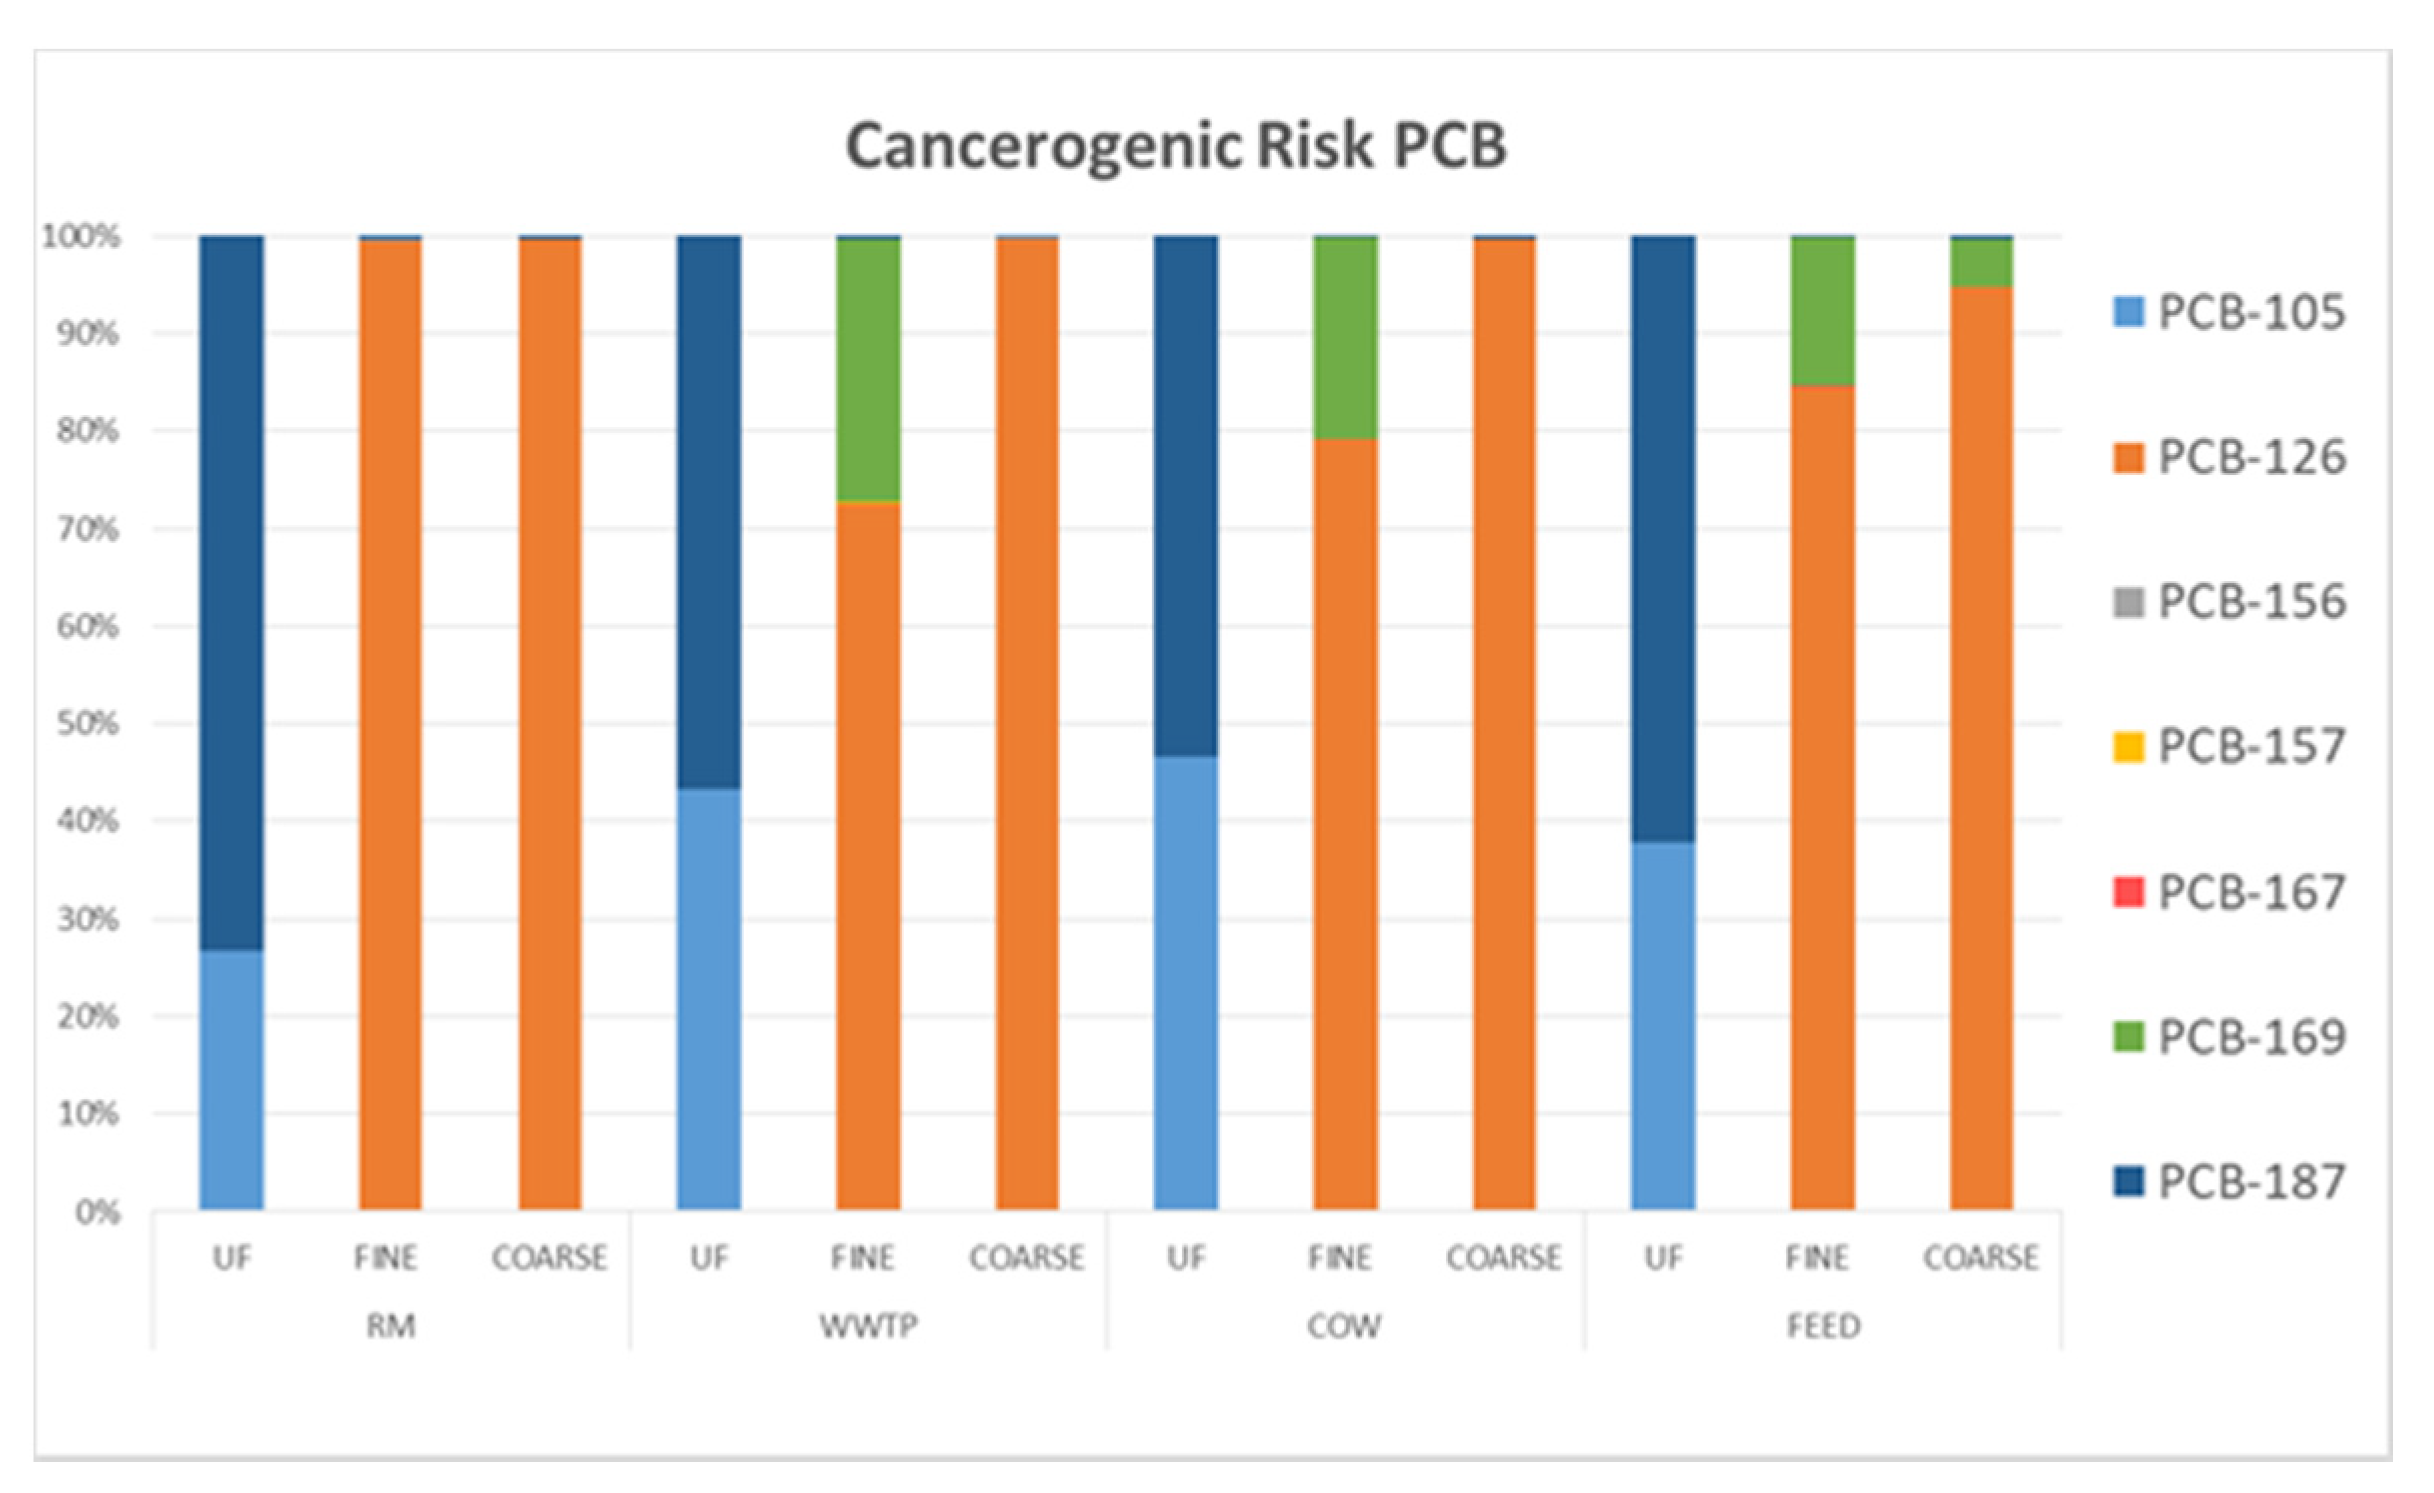
4.2. PCB
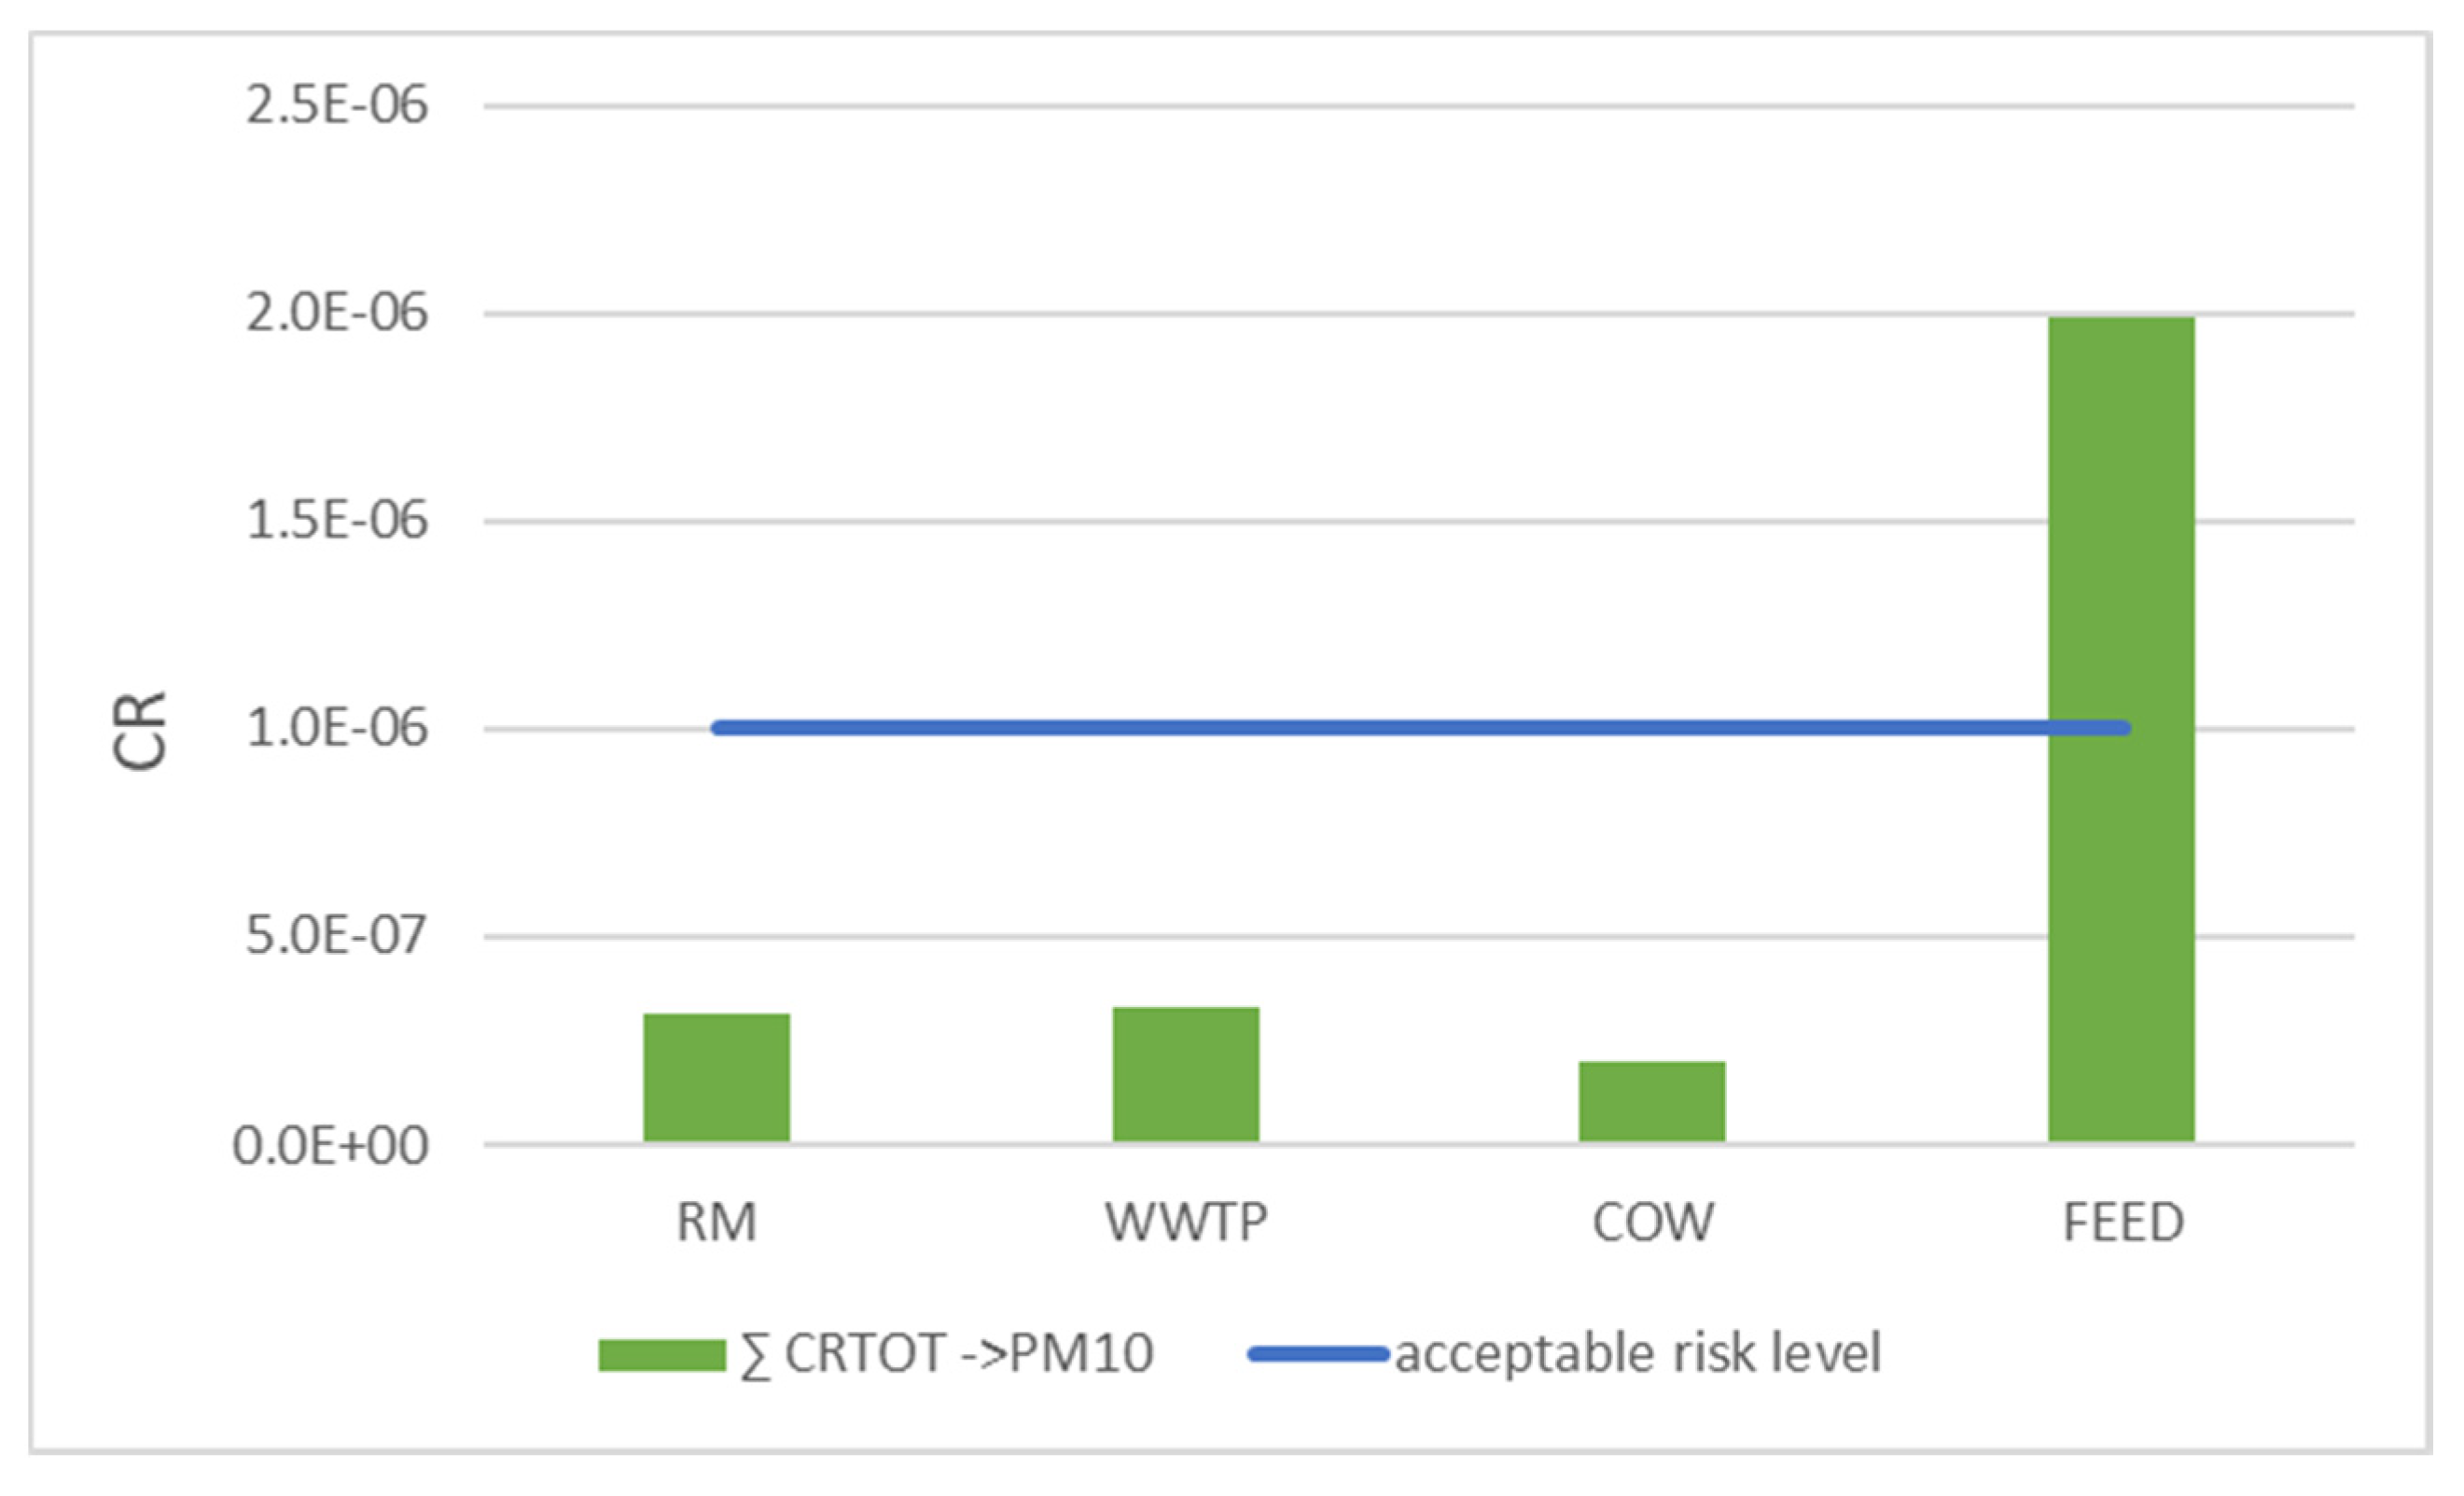
4.3. Total Carcinogenic Risk
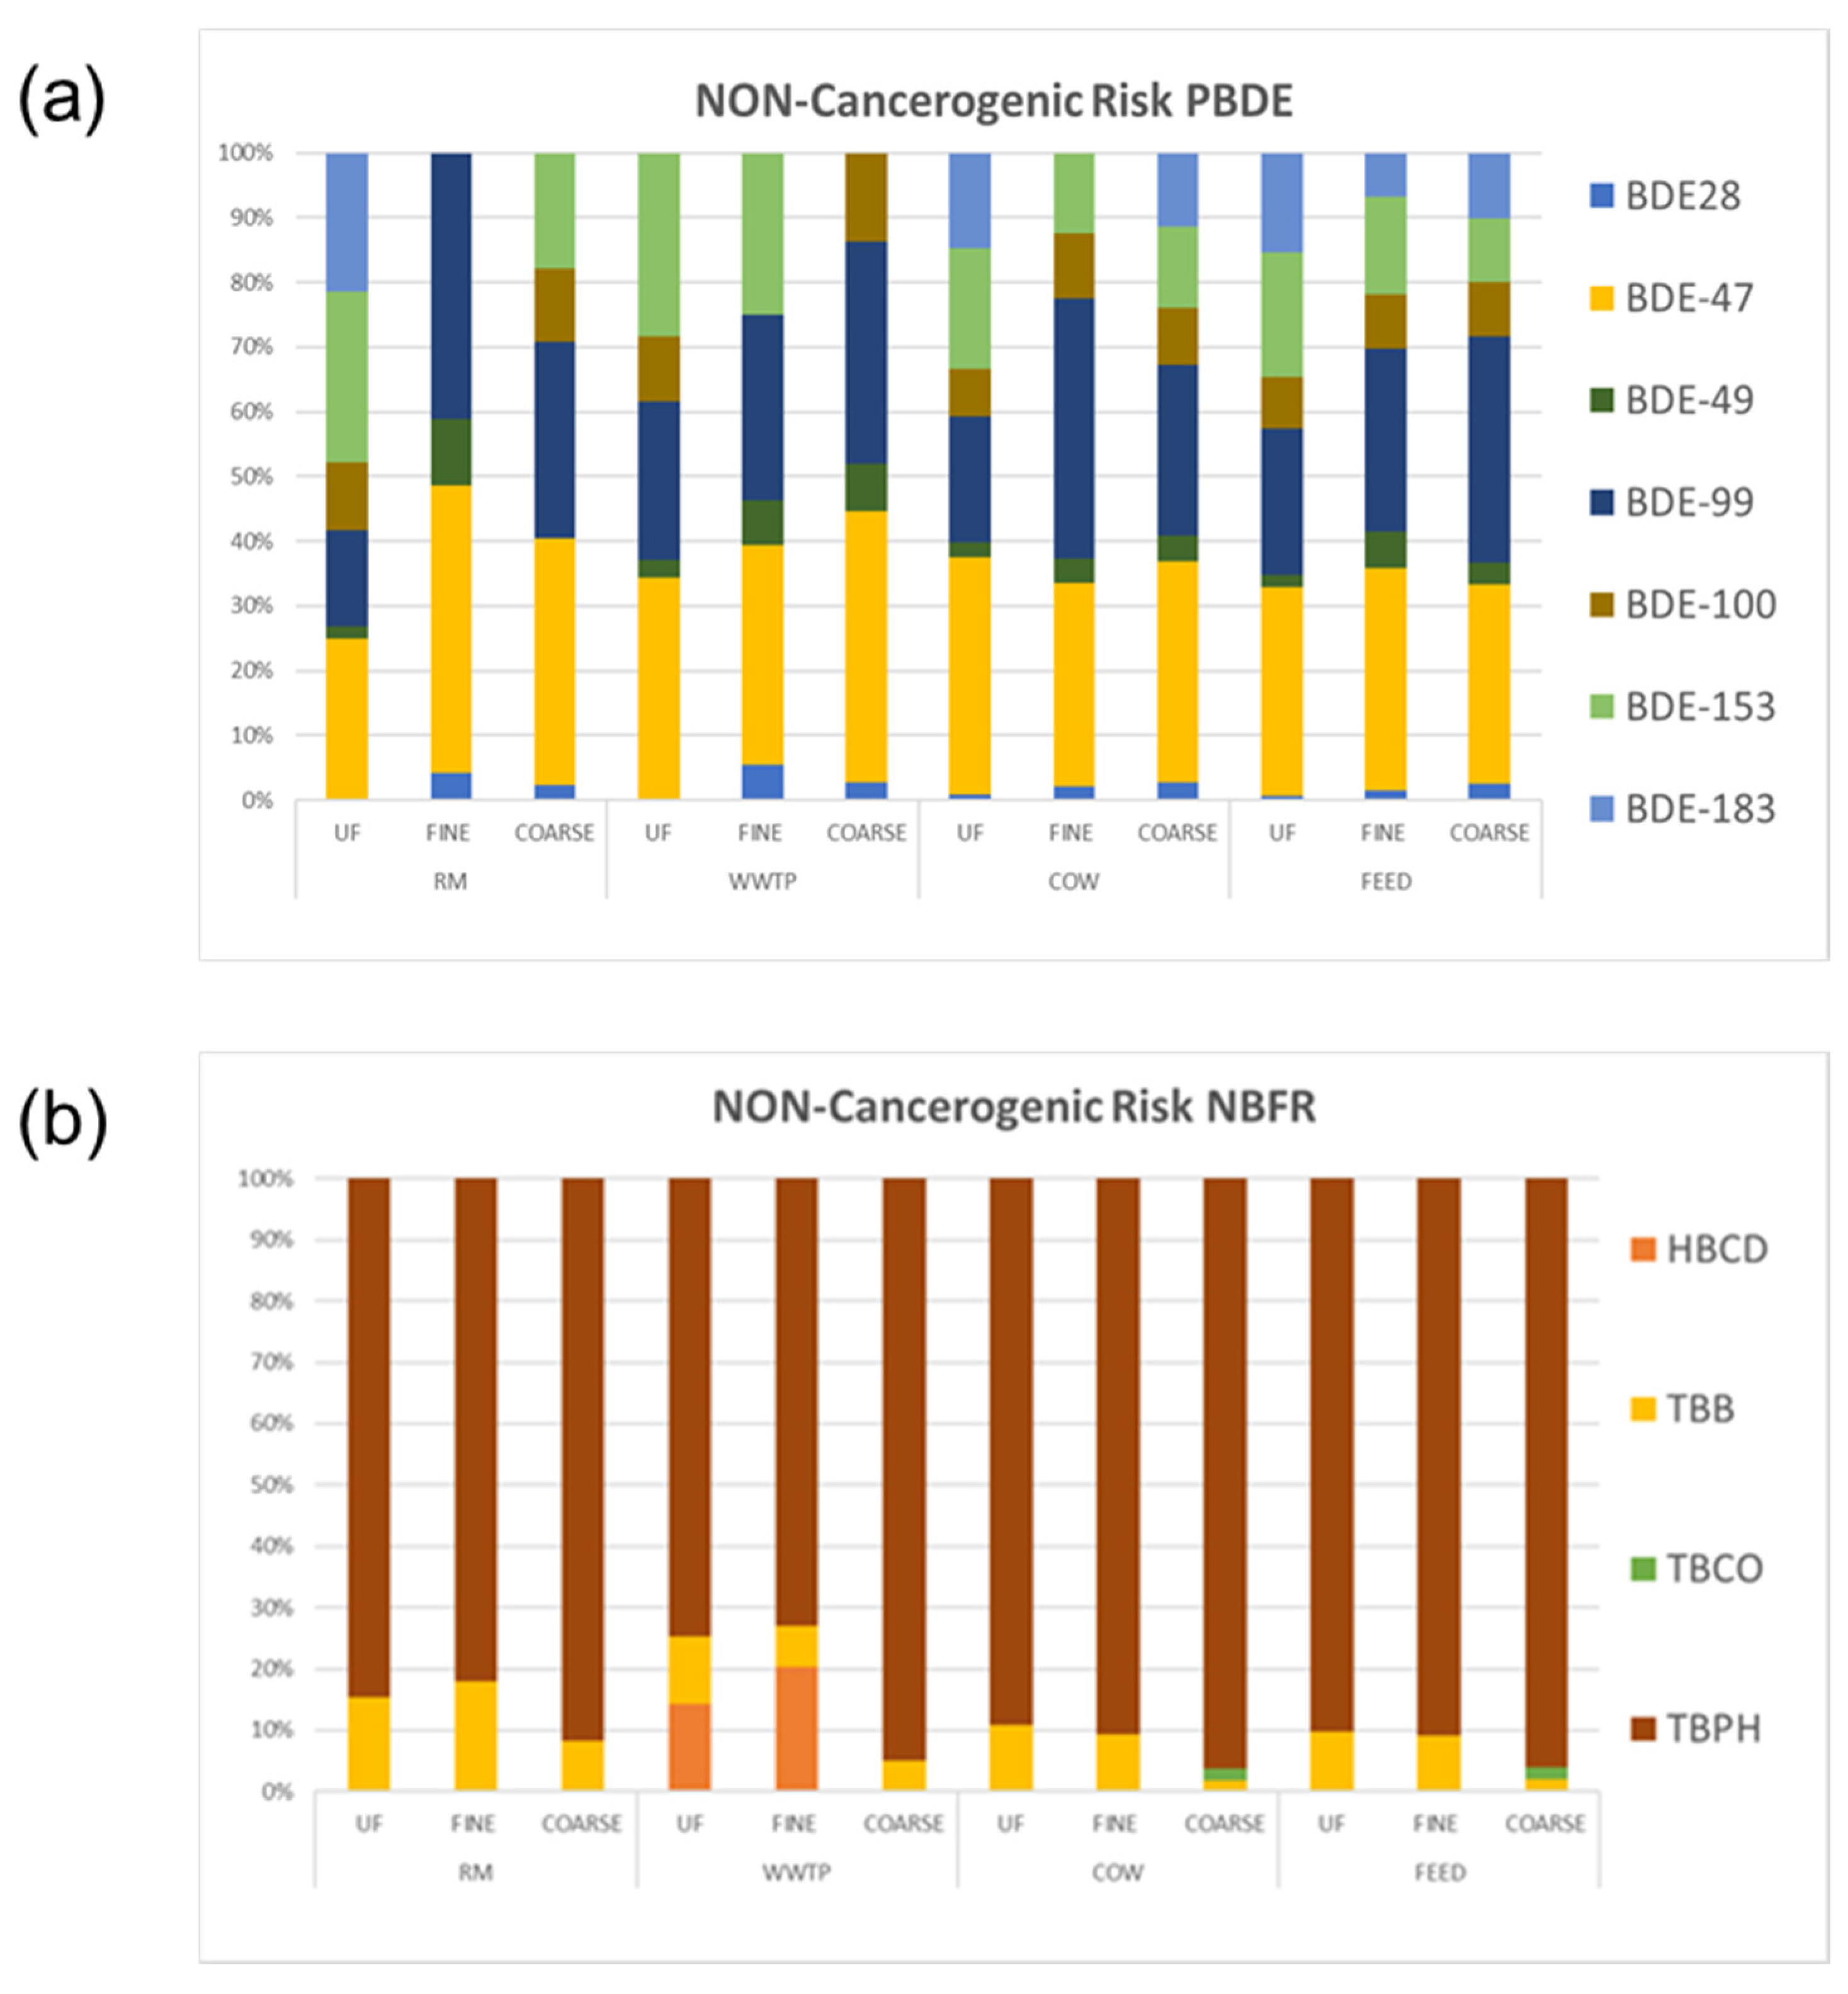
4.4. PBDE and NBFR
4.5. Total Non-Carcinogenic Risk
5. Conclusions
Supplementary Materials
Author Contributions
Funding
Institutional Review Board Statement
Informed Consent Statement
Conflicts of Interest
References
- Pope, C.A., III; Burnett, R.T.; Thun, M.J.; Calle, E.E.; Krewski, D.; Ito, K.; Thurston, G.D. Lung cancer, cardiopulmonary mortality, and long-term exposure to fine particulate air pollution. JAMA 2002, 287, 1132–1141. [Google Scholar] [CrossRef]
- Pope, C.A., III; Dockery, D.W. Health Effects of Fine Particulate Air Pollution: Lines that Connect. J. Air Waste Manag. Assoc. 2006, 56, 709–742. [Google Scholar] [CrossRef] [PubMed]
- Ashok, V.; Gupta, T.; Dubey, S.; Jat, R. Personal exposure measurement of students to various microenvironments inside and outside the college campus. Environ. Monit. Assess. 2014, 186, 735–750. [Google Scholar] [CrossRef]
- Manisalidis, I.; Stavropoulou, E.; Stavropoulos, A.; Bezirtzoglou, E. Environmental and Health Impacts of Air Pollution: A Review. Front. Public Health 2020, 8, 14. [Google Scholar] [CrossRef]
- Valavanidis, A.; Fiotakis, K.; Vlachogianni, T. Airborne Particulate Matter and Human Health: Toxicological Assessment and Importance of Size and Composition of Particles for Oxidative Damage and Carcinogenic Mechanisms. J. Environ. Sci. Health Part C 2008, 26, 339–362. [Google Scholar] [CrossRef]
- Knol, A.B.; de Hartog, J.J.; Boogaard, H.; Slottje, P.; van der Sluijs, J.P.; Lebret, E.; Cassee, F.R.; Wardekker, J.A.; Ayres, J.G.; Borm, P.J.; et al. Expert elicitation on ultrafine particles: Likelihood of health effects and causal pathways. Part. Fibre Toxicol. 2009, 6, 19. [Google Scholar] [CrossRef] [PubMed]
- Wichmann, H.E.; Peters, A. Epidemiological evidence of the effects of ultrafine particle exposure. Ultrafine Part. Atmos. 2000, 385, 243–267. [Google Scholar] [CrossRef]
- Oberdörster, G. Pulmonary effects of inhaled ultrafine particles. Int. Arch. Occup. Environ. Health 2000, 74, 1–8. [Google Scholar] [CrossRef]
- Zhang, W.; Lu, Z.; Xu, Y.; Wang, C.; Gu, Y.; Xu, H.; Streets, D.G. Black carbon emissions from biomass and coal in rural China. Atmos. Environ. 2018, 176, 158–170. [Google Scholar] [CrossRef]
- Zhang, W.; Li, A.; Xu, Y.; Liu, J. The theory-practice gap of black carbon mitigation technologies in rural China. Atmos. Environ. 2018, 174, 122–131. [Google Scholar] [CrossRef]
- Time to Breathe Campaign. 2019. Available online: https://www.britsafe.org/awards-and-events/events/past-events/2019/time-to-breathe-campaign (accessed on 10 March 2021).
- Risk Assessment Guidance for Superfund (RAGS), Volume I Human Health Evaluation Manual (Part. F, Supplemental Guidance for Inhalation Risk Assessment). EPA-540-R-070-002, OSWER 9285.7-82; USEPA (United State Environmental Protection Agency): Washington, DC, USA, 2009.
- Mousavian, N.A.; Mansouri, N.; Nezhadkurki, F. Estimation of heavy metal exposure in workplace and health risk ex-posure assessment in steel industries in Iran. Measurement 2017, 102, 286–290. [Google Scholar] [CrossRef]
- Singh, M.; Thind, P.S.; John, S. Health risk assessment of the workers exposed to the heavy metals in e-waste recycling sites of Chandigarh and Ludhiana, Punjab, India. Chemosphere 2018, 203, 426–433. [Google Scholar] [CrossRef] [PubMed]
- Diapouli, E.; Manousakas, M.; Vratolis, S.; Vasilatou, V.; Maggos, T.; Saraga, D.; Grigoratos, T.; Argyropoulos, G.; Voutsa, D.; Samara, C.; et al. Evolution of air pollution source contributions over one decade, derived by PM10 and PM2.5 source apportionment in two metropolitan urban areas in Greece. Atmos. Environ. 2017, 164, 416–430. [Google Scholar] [CrossRef]
- Belis, C.; Karagulian, F.; Larsen, B.; Hopke, P. Critical review and meta-analysis of ambient particulate matter source apportionment using receptor models in Europe. Atmos. Environ. 2013, 69, 94–108. [Google Scholar] [CrossRef]
- Shi, G.-L.; Zeng, F.; Li, X.; Feng, Y.-C.; Wang, Y.-Q.; Liu, G.-X.; Zhu, T. Estimated contributions and uncertainties of PCA/MLR–CMB results: Source apportionment for synthetic and ambient datasets. Atmos. Environ. 2011, 45, 2811–2819. [Google Scholar] [CrossRef]
- Manousakas, M.; Papaefthymiou, H.; Diapouli, E.; Migliori, A.; Karydas, A.; Bogdanovic-Radovic, I.; Eleftheriadis, K. Assessment of PM2.5 sources and their corresponding level of uncertainty in a coastal urban area using EPA PMF 5.0 enhanced diagnostics. Sci. Total Environ. 2017, 574, 155–164. [Google Scholar] [CrossRef] [PubMed]
- Pomata, D.; Di Filippo, P.; Riccardi, C.; Rossi, V.; Simonetti, G.; Sonego, E.; Buiarelli, F. Method optimisation for the simultaneous determination of legacy and emerging halogenated flame retardants in particulate matter collected in an electronic waste recycling facility. Int. J. Environ. Anal. Chem. 2020, 100, 1479–1496. [Google Scholar] [CrossRef]
- Di Filippo, P.; Pomata, D.; Riccardi, C.; Buiarelli, F.; Gallo, V. Oxygenated polycyclic aromatic hydrocarbons in size-segregated urban aerosol. J. Aerosol Sci. 2015, 87, 126–134. [Google Scholar] [CrossRef]
- Di Filippo, P.; Riccardi, C.; Pomata, D.; Buiarelli, F. Concentrations of PAHs, and nitro- and methyl- derivatives associated with a size-segregated urban aerosol. Atmos. Environ. 2010, 44, 2742–2749. [Google Scholar] [CrossRef]
- Mustafa, M.F.; Liu, Y.; Duan, Z.; Guo, H.; Xu, S.; Wang, H.; Lu, W. Volatile compounds emission and health risk assessment during composting of organic fraction of municipal solid waste. J. Hazard. Mater. 2017, 327, 35–43. [Google Scholar] [CrossRef]
- Bari, M.A.; Kindzierski, W.B. Fine particulate matter (PM2.5) in Edmonton, Canada: Source apportionment and potential risk for human health. Environ. Pollut. 2016, 218, 219–229. [Google Scholar] [CrossRef] [PubMed]
- Xing, W.; Zhang, L.; Yang, L.; Zhou, Q.; Zhang, X.; Toriba, A.; Hayakawa, K.; Tang, N. Characteristics of PM2.5-bound polycyclic aromatic hydrocarbons and nitro-polycyclic aromatic hydrocarbons at a roadside air pollution monitoring station in Kanazawa, Japan. Int. J. Environ. Res. Public Health 2020, 17, 805. [Google Scholar] [CrossRef]
- Saunders, D.M.; Higley, E.B.; Hecker, M.; Mankidy, R.; Giesy, J.P. In vitro endocrine disruption and TCDD-like effects of three novel brominated flame retardants: TBPH, TBB, & TBCO. Toxicol. Lett. 2013, 223, 252–259. [Google Scholar] [CrossRef]
- Rovelli, S.; Cattaneo, A.; Borghi, F.; Spinazzè, A.; Campagnolo, D.; Limbeck, A.; Cavallo, D.M. Mass concentration and size-distribution of atmospheric particulate matter in an urban environment. Aerosol Air Qual. Res. 2017, 217, 1142–1155. [Google Scholar] [CrossRef]
- Buiarelli, F.; Di Filippo, P.; Massimi, L.; Pomata, D.; Riccardi, C.; Simonetti, G.; Sonego, E. Ultrafine, fine and coarse airborne particle mass concentration in workplaces. Atmos. Pollut. Res. 2019, 10, 1685–1690. [Google Scholar] [CrossRef]
- Keyte, I.J.; Harrison, R.M.; Lammel, G. Chemical reactivity and long-range transport potential of polycyclic aromatic hydrocarbons—A review. Chem. Soc. Rev. 2013, 42, 9333–9391. [Google Scholar] [CrossRef]
- Malisch, R.; Kotz, A. Dioxins and PCBs in feed and food—Review from European perspective. Sci. Total Environ. 2014, 491, 2–10. [Google Scholar] [CrossRef]
- Di Filippo, P.; Riccardi, C.; Incoronato, F.; Sallusti, F.; Spicaglia, S.; Cecinato, A. Characterization of selected speciated organic compounds associated with particulate matter in ambient air of the outskirts of Rome. Polycycl. Aromat. Compd. 2005, 25, 393–406. [Google Scholar] [CrossRef]
- Bro, R.; Smilde, A.K. Centering and scaling in component analysis. J. Chemom. 2003, 17, 16–33. [Google Scholar] [CrossRef]
- Zhang, W.; Jiang, L.; Cui, Y.; Xu, Y.; Wang, C.; Yu, J.; Streets, D.G.; Lin, B. Effects of urbanization on airport CO2 emissions: A geographically weighted approach using nighttime light data in China. Resour. Conserv. Recycl. 2019, 150, 104454. [Google Scholar] [CrossRef]
- EC. Commission regulation (EU) no. 1259/2011 of 2 December 2011 amending regulation (EC) No 1881/2006 as regards maximum levels for dioxins, dioxin-like PCBs and non dioxin-like PCBs in foodstuffs. Off. J. Eur. Union 2011, L 320, 18–23. [Google Scholar]
- Fernandes, A.; Mortimer, D.; Rose, M.; Smith, F.; Panton, S.; Garcia-Lopez, M. Bromine content and brominated flame retardants in food and animal feed from the UK. Chemosphere 2016, 150, 472–478. [Google Scholar] [CrossRef] [PubMed]
- Belis, C.; Cancelinha, J.; Duane, M.; Forcina, V.; Pedroni, V.; Passarella, R.; Tanet, G.; Douglas, K.; Piazzalunga, A.; Bolzacchini, E.; et al. Sources for PM air pollution in the Po Plain, Italy: I. Critical comparison of methods for estimating biomass burning contributions to benzo(a)pyrene. Atmos. Environ. 2011, 45, 7266–7275. [Google Scholar] [CrossRef]
- Perrone, M.; Larsen, B.; Ferrero, L.; Sangiorgi, G.; De Gennaro, G.; Udisti, R.; Zangrando, R.; Gambaro, A.; Bolzacchini, E. Sources of high PM2.5 concentrations in Milan, Northern Italy: Molecular marker data and CMB modelling. Sci. Total Environ. 2012, 414, 343–355. [Google Scholar] [CrossRef]
- Manoli, E.; Kouras, A.; Karagkiozidou, O.; Argyropoulos, G.; Voutsa, D.; Samara, C. Polycyclic aromatic hydrocarbons (PAHs) at traffic and urban background sites of northern Greece: Source apportionment of ambient PAH levels and PAH-induced lung cancer risk. Environ. Sci. Pollut. Res. 2016, 23, 3556–3568. [Google Scholar] [CrossRef]
- Zhang, X.; Hecobian, A.; Zheng, M.; Frank, N.H.; Weber, R.J. Biomass burning impact on PM 2.5 over the southeastern US during 2007: Integrating chemically speciated FRM filter measurements, MODIS fire counts and PMF analysis. Atmos. Chem. Phys. 2010, 10, 6839–6853. [Google Scholar] [CrossRef]
- Čupr, P.; Flegrová, Z.; Franců, J.; Landlová, L.; Klánová, J. Mineralogical, chemical and toxicological characterization of urban air particles. Environ. Int. 2013, 54, 26–34. [Google Scholar] [CrossRef]
- Helmig, D.; Arey, J.; Harger, W.P.; Atkinson, R.; Lopez-Cancio, J. Formation of mutagenic nitrodibenzopyranones and their occurrence in ambient air. Environ. Sci. Technol. 1992, 26, 622–624. [Google Scholar] [CrossRef]
- Helmig, D.; Lopez-Cancio, J.; Arey, J.; Harger, W.P.; Atkinson, R. Quantification of ambient nitrodibenzopyranones: Further evidence for atmospheric mutagen formation. Environ. Sci. Technol. 1992, 26, 2207–2213. [Google Scholar] [CrossRef]
- Bamford, H.A.; Baker, J.E. Nitro-polycyclic aromatic hydrocarbon concentrations and sources in urban and suburban atmospheres of the Mid-Atlantic region. Atmos. Environ. 2003, 37, 2077–2091. [Google Scholar] [CrossRef]
- Di Filippo, P.; Riccardi, C.; Gariazzo, C.; Incoronato, F.; Pomata, D.; Spicaglia, S.; Cecinato, A. Air pollutants and the char-acterization of the organic content of aerosol particles in a mixed industrial/semi-rural area in central Italy. J. Environ. Monit. 2007, 9, 275–282. [Google Scholar] [CrossRef]
- Koukoulakis, K.G.; Kanellopoulos, P.G.; Chrysochou, E.; Costopoulou, D.; Vassiliadou, I.; Leondiadis, L.; Bakeas, E. Atmospheric Concentrations and Health Implications of PAHs, PCBs and PCDD/Fs in the Vicinity of a Heavily Industrialized Site in Greece. Appl. Sci. 2020, 10, 9023. [Google Scholar] [CrossRef]
- Petrovic, M.; Sremacki, M.; Radonic, J.; Mihajlovic, I.; Obrovski, B.; Miloradov, M.V. Health risk assessment of PAHs, PCBs and OCPs in atmospheric air of municipal solid waste landfill in Novi Sad, Serbia. Sci. Total Environ. 2018, 644, 1201–1206. [Google Scholar] [CrossRef] [PubMed]
- Hu, D.; Lehmler, H.J.; Martinez, A.; Wang, K.; Hornbuckle, K.C. Atmospheric PCB congeners across Chicago. Atmos. Environ. 2010, 44, 1550–1557. [Google Scholar] [CrossRef]
- Biterna, M.; Voutsa, D. Polychlorinated biphenyls in ambient air of NW Greece and in particulate emissions. Environ. Int. 2005, 31, 671–677. [Google Scholar] [CrossRef]
- Dziubanek, G.; Marchwińska-Wyrwał, E.; Ćwieląg-Drabek, M.; Spychała, A.; Rusin, M.; Piekut, A.; Hajok, I. Preliminary study of possible relationships between exposure to PCDD/Fs and dl-PCBs in ambient air and the length of life of people. Sci. Total Environ. 2017, 598, 129–134. [Google Scholar] [CrossRef]
- Sun, H.; Chen, H.; Yao, L.; Chen, J.; Zhu, Z.; Wei, Y.; Ding, X.; Chen, J. Sources and health risks of PM2.5-bound polychlo-rinated biphenyls (PCBs) and organochlorine pesticides (OCPs) in a North China rural area. J. Environ. Sci. 2020, 95, 240–247. [Google Scholar]
- Lohmann, R.; Ockenden, W.A.; Shears, J.; Jones, K.C. Atmospheric Distribution of Polychlorinated Dibenzo-p-dioxins, Dibenzofurans (PCDD/Fs), and Non-OrthoBiphenyls (PCBs) along a North−South Atlantic Transect. Environ. Sci. Technol. 2001, 35, 4046–4053. [Google Scholar] [CrossRef]
- Wang, J.X.; Bao, L.J.; Shi, L.; Liu, L.Y.; Zeng, E.Y. Characterizing PBDEs in fish, poultry, and pig feeds manufactured in China. Environ. Sci. Pollut. Res. 2019, 26, 6014–6022. [Google Scholar] [CrossRef] [PubMed]
- Simonetti, G.; Di Filippo, P.; Riccardi, C.; Pomata, D.; Sonego, E.; Buiarelli, F. Occurrence of Halogenated Pollutants in Domestic and Occupational Indoor Dust. Int. J. Environ. Res. Public Health 2020, 17, 3813. [Google Scholar] [CrossRef]
- Weinberg, I.; Dreyer, A.; Ebinghaus, R. Waste water treatment plants as sources of polyfluorinated compounds, polybrominated diphenyl ethers and musk fragrances to ambient air. Environ. Pollut. 2011, 159, 125–132. [Google Scholar] [CrossRef] [PubMed]
- Martellini, T.; Jones, K.C.; Sweetman, A.; Giannoni, M.; Pieri, F.; Cincinelli, A. The contribution of waste water treatment plants to PBDEs in ambient air. Environ. Pollut. 2012, 169, 242–247. [Google Scholar] [CrossRef] [PubMed]
- Xiang, N.; Chen, L.; Meng, X.-Z.; Dai, X. Occurrence of hexabromocyclododecane (HBCD) in sewage sludge from Shanghai: Implications for source and environmental burden. Chemosphere 2015, 118, 207–212. [Google Scholar] [CrossRef]
- Stapleton, H.M.; Allen, J.G.; Kelly, S.M.; Konstantinov, A.; Klosterhaus, S.; Watkins, D.; McClean, M.D.; Webster, T.F. Alternate and new brominated flame retardants detected in US house dust. Environ. Sci. Technol. 2008, 42, 6910–6916. [Google Scholar] [CrossRef] [PubMed]
- La Guardia, M.J.; Hale, R.C.; Harvey, E. Detailed Polybrominated Diphenyl Ether (PBDE) Congener Composition of the Widely Used Penta-, Octa-, and Deca-PBDE Technical Flame-retardant Mixtures. Environ. Sci. Technol. 2006, 40, 6247–6254. [Google Scholar] [CrossRef] [PubMed]
- Wang, L.C.; Lee, W.J.; Lee, W.S.; Chang-Chien, G.P. Polybrominated diphenyl ethers in various atmospheric environments of Taiwan: Their levels, source identification and influence of combustion sources. Chemosphere 2011, 84, 936–942. [Google Scholar] [CrossRef]
- Shi, S.; Dong, L.; Yang, W.; Zhou, L.; Zhang, L.Z.; Zhang, X.; Huang, Y. Monitoring of Airborne Polybrominated Diphenyl Ethers in the Urban Area by Means of Road Dust and Camphor Tree Barks. Aerosol Air Qual. Res. 2014, 14, 1106–1113. [Google Scholar] [CrossRef]


| Monitoring Site | Type of Site | Principal Emission Sources |
|---|---|---|
| RM | Urban | Traffic, residential housing, human activities. |
| WWTP | Industrial/Suburban | Traffic, residential housing, wastewater treatment plant activities. |
| COW | Industrial/Rural | Livestock shelter and feeders, agricultural tractors. |
| FEED | Industrial/Rural | Grinding, mixing, and storing of feeds, feed handling, agricultural tractors |
Publisher’s Note: MDPI stays neutral with regard to jurisdictional claims in published maps and institutional affiliations. |
© 2021 by the authors. Licensee MDPI, Basel, Switzerland. This article is an open access article distributed under the terms and conditions of the Creative Commons Attribution (CC BY) license (https://creativecommons.org/licenses/by/4.0/).
Share and Cite
Pomata, D.; Di Filippo, P.; Riccardi, C.; Castellani, F.; Simonetti, G.; Sonego, E.; Buiarelli, F. Toxic Organic Contaminants in Airborne Particles: Levels, Potential Sources and Risk Assessment. Int. J. Environ. Res. Public Health 2021, 18, 4352. https://doi.org/10.3390/ijerph18084352
Pomata D, Di Filippo P, Riccardi C, Castellani F, Simonetti G, Sonego E, Buiarelli F. Toxic Organic Contaminants in Airborne Particles: Levels, Potential Sources and Risk Assessment. International Journal of Environmental Research and Public Health. 2021; 18(8):4352. https://doi.org/10.3390/ijerph18084352
Chicago/Turabian StylePomata, Donatella, Patrizia Di Filippo, Carmela Riccardi, Federica Castellani, Giulia Simonetti, Elisa Sonego, and Francesca Buiarelli. 2021. "Toxic Organic Contaminants in Airborne Particles: Levels, Potential Sources and Risk Assessment" International Journal of Environmental Research and Public Health 18, no. 8: 4352. https://doi.org/10.3390/ijerph18084352
APA StylePomata, D., Di Filippo, P., Riccardi, C., Castellani, F., Simonetti, G., Sonego, E., & Buiarelli, F. (2021). Toxic Organic Contaminants in Airborne Particles: Levels, Potential Sources and Risk Assessment. International Journal of Environmental Research and Public Health, 18(8), 4352. https://doi.org/10.3390/ijerph18084352