
The Effects of 15 or 30 s SIT in Normobaric Hypoxia on Aerobic, Anaerobic Performance and Critical Power


 ,
,  and
and
Abstract
1. Introduction
2. Materials and Methods
2.1. Participants
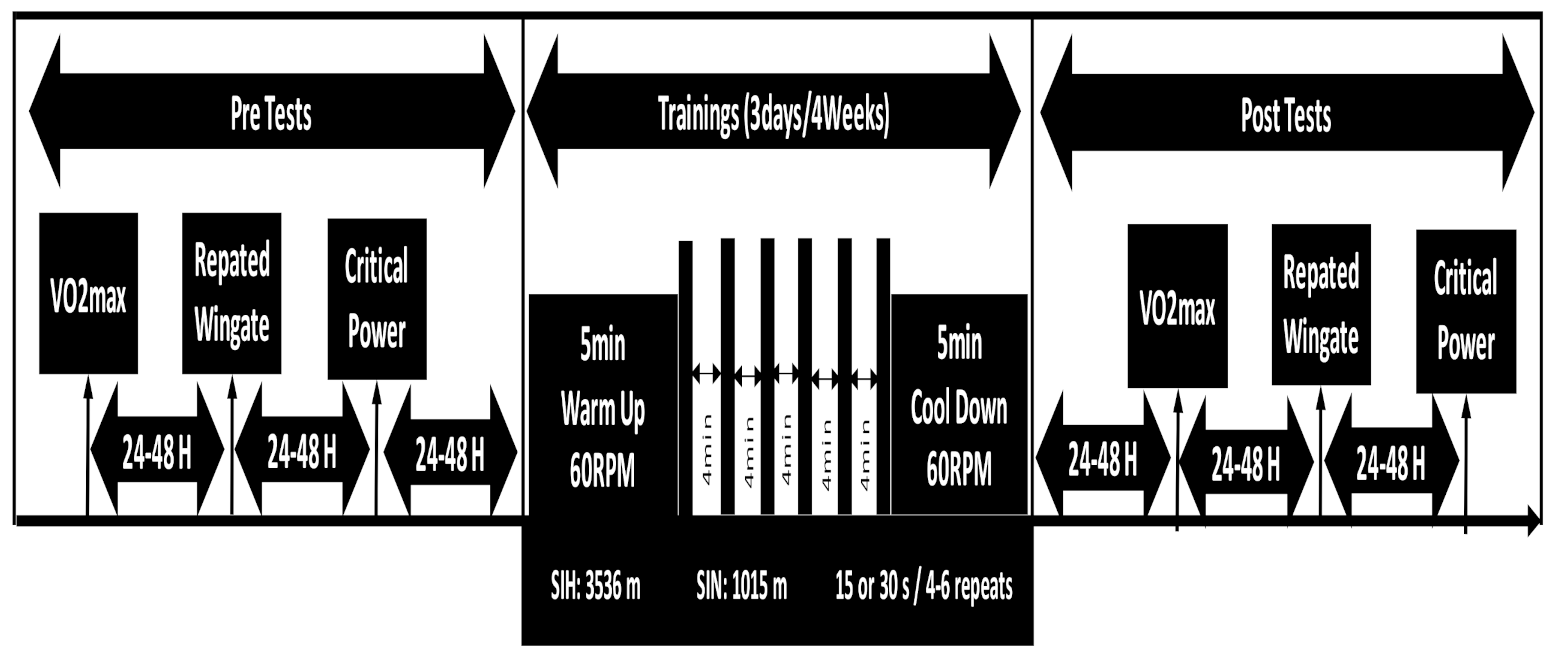
2.2. Study Design
2.3. VO2max Test
2.4. Repeated Wingate Test
2.5. Critical Power Test
2.6. Training Procedures
2.7. Statistics
3. Results
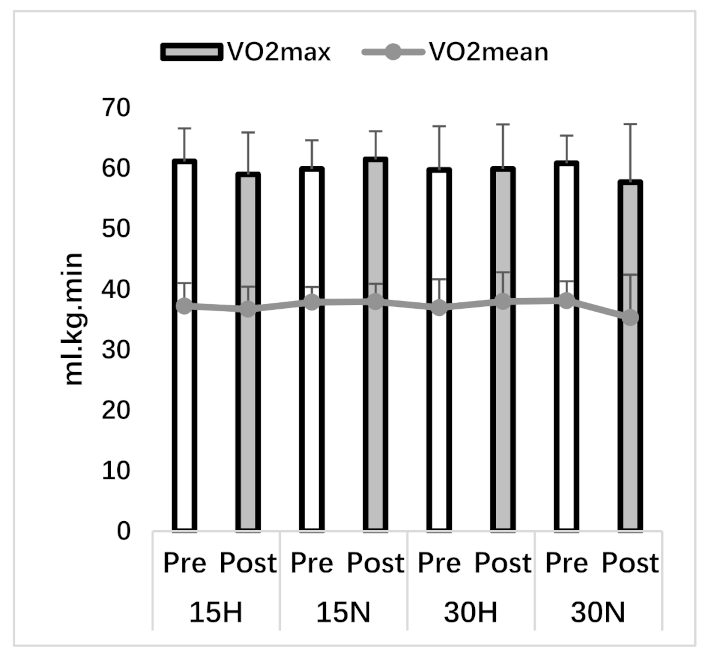
3.1. VO2max Test
3.2. Repeated Wingate Test
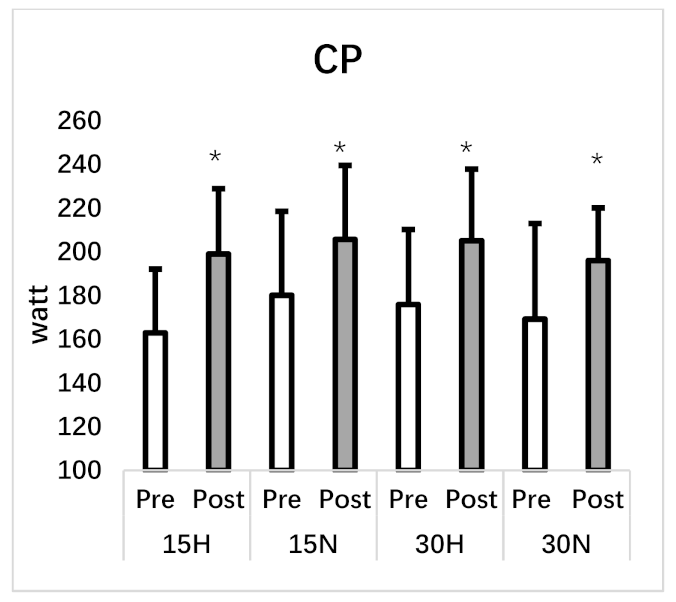
3.3. Critical Power Test
3.4. Training
4. Discussion
5. Conclusions
Author Contributions
Funding
Institutional Review Board Statement
Informed Consent Statement
Data Availability Statement
Conflicts of Interest
References
- MacDougall, J.D.; Hicks, A.L.; MacDonald, J.R.; McKelvie, R.S.; Green, H.J.; Smith, K.M. Muscle performance and enzymatic adaptations to sprint interval training. J. Appl. Physiol. 1998, 84, 2138–2142. [Google Scholar] [CrossRef] [PubMed]
- Buchheit, M.; Laursen, P.B. High-intensity interval training, solutions to the programming puzzle. Sports Med. 2013, 43, 313–338. [Google Scholar] [CrossRef] [PubMed]
- Gibala, M.J.; Little, J.P.; Van Essen, M.; Wilkin, G.P.; Burgomaster, K.A.; Safdar, A.; Raha, S.; Tarnopolsky, M.A. Short-term sprint interval versus traditional endurance training: Similar initial adaptations in human skeletal muscle and exercise performance. J. Physiol. 2006, 575, 901–911. [Google Scholar] [CrossRef] [PubMed]
- Laursen, P.B.; Jenkins, D.G. The scientific basis for high-intensity interval training. Sports Med. 2002, 32, 53–73. [Google Scholar] [CrossRef] [PubMed]
- Burgomaster, K.A.; Hughes, S.C.; Heigenhauser, G.J.; Bradwell, S.N.; Gibala, M.J. Six sessions of sprint interval training increases muscle oxidative potential and cycle endurance capacity in humans. J. Appl. Physiol. 2005, 98, 1985–1990. [Google Scholar] [CrossRef] [PubMed]
- Warnier, G.; Benoit, N.; Naslain, D.; Lambrecht, S.; Francaux, M.; Deldicque, L. Effects of Sprint Interval Training at Different Altitudes on Cycling Performance at Sea-Level. Sports 2020, 8, 148. [Google Scholar] [CrossRef]
- Morton, J.P.; Cable, N.T. The effects of intermittent hypoxic training on aerobic and anaerobic performance. Ergonomics 2005, 48, 1535–1546. [Google Scholar] [CrossRef]
- Brocherie, F.; Girard, O.; Faiss, R.; Millet, G.P. Effects of repeated-sprint training in hypoxia on sea-level performance: A meta-analysis. Sports Med. 2017, 47, 1651–1660. [Google Scholar] [CrossRef]
- Takei, N.; Kakinoki, K.; Girard, O.; Hatta, H. Short-Term repeated wingate training in hypoxia and normoxia in sprinters. Front. Sports Act. Living 2020, 2, 43. [Google Scholar] [CrossRef]
- Schmutz, S.; Däpp, C.; Wittwer, M.; Durieux, A.C.; Mueller, M.; Weinstein, F.; Vogt, M.; Hoppeler, H.; Flück, M. A hypoxia complement differentiates the muscle response to endurance exercise. Exp. Physiol. 2010, 95, 723–735. [Google Scholar] [CrossRef]
- Vogt, M.; Puntschart, A.; Geiser, J.; Zuleger, C.; Billeter, R.; Hoppeler, H. Molecular adaptations in human skeletal muscle to endurance training under simulated hypoxic conditions. J. Appl. Physiol. 2001, 91, 173–182. [Google Scholar] [CrossRef]
- Puype, J.; Van Proeyen, K.; Raymackers, J.-M.; Deldicque, L.; Hespel, P. Sprint interval training in hypoxia stimulates glycolytic enzyme activity. Med. Sci. Sports Exerc. 2013, 45, 2166–2174. [Google Scholar] [CrossRef]
- Zoll, J.; Ponsot, E.; Dufour, S.; Doutreleau, S.; Ventura-Clapier, R.; Vogt, M.; Hoppeler, H.; Richard, R.; Fluck, M. Exercise training in normobaric hypoxia in endurance runners. III. Muscular adjustments of selected gene transcripts. J. Appl. Physiol. 2006, 100, 1258–1266. [Google Scholar] [CrossRef]
- Faiss, R.; Léger, B.; Vesin, J.-M.; Fournier, P.-E.; Eggel, Y.; Dériaz, O.; Millet, G.P. Significant molecular and systemic adaptations after repeated sprint training in hypoxia. PLoS ONE. 2013, 8, e56522. [Google Scholar] [CrossRef]
- Dufour, S.P.; Ponsot, E.; Zoll, J.; Doutreleau, S.; Lonsdorfer-Wolf, E.; Geny, B.; Lampert, E.; Fluck, M.; Hoppeler, H.; Billat, V. Exercise training in normobaric hypoxia in endurance runners. Improvement in aerobic performance capacity. J. Appl. Physiol. 2006, 100, 1238–1248. [Google Scholar] [CrossRef]
- Mason, S.; Johnson, R.S. The role of hif-1 1 in hypoxic response in the skeletal muscle. Adv. Exp. Med. Biol. 2007, 618, 229–244. [Google Scholar]
- Girard, O.; Brocherie, F.; Millet, G.P. Effects of altitude/hypoxia on single-and multiple-sprint performance: A comprehensive review. Sports Med. 2017, 47, 1931–1949. [Google Scholar] [CrossRef]
- Gatterer, H.; Menz, V.; Salazar-Martinez, E.; Sumbalova, Z.; Garcia-Souza, L.F.; Velika, B.; Gnaiger, E.; Burtscher, M. Exercise performance, muscle oxygen extraction and blood cell mitochondrial respiration after repeated-sprint and sprint interval training in hypoxia: A pilot study. J. Sports Sci. Med. 2018, 17, 339. [Google Scholar]
- Vanhatalo, A.; Doust, J.H.; Burnley, M. Determination of critical power using a 3-min all-out cycling test. Med. Sci. Sports Exerc. 2007, 39, 548–555. [Google Scholar] [CrossRef]
- Yamagishi, T.; Babraj, J. Influence of recovery intensity on oxygen demand and repeated sprint performance. J. Sports Med. Phys. Fit. 2016, 56, 1103–1112. [Google Scholar]
- Hazell, T.J.; MacPherson, R.E.; Gravelle, B.M.; Lemon, P.W. 10 or 30-s sprint interval training bouts enhance both aerobic and anaerobic performance. Eur. J. Appl. Physiol. 2010, 110, 153–160. [Google Scholar] [CrossRef] [PubMed]
- Boyd, J.C.; Simpson, C.A.; Jung, M.E.; Gurd, B.J. Reducing the intensity and volume of interval training diminishes cardiovascular adaptation but not mitochondrial biogenesis in overweight/obese men. PLoS ONE. 2013, 8, e68091. [Google Scholar] [CrossRef] [PubMed]
- Zelt, J.G.; Hankinson, P.B.; Foster, W.S.; Williams, C.B.; Reynolds, J.; Garneys, E.; Tschakovsky, M.E.; Gurd, B.J. Reducing the volume of sprint interval training does not diminish maximal and submaximal performance gains in healthy men. Eur. J. Appl. Physiol. 2014, 114, 2427–2436. [Google Scholar] [CrossRef] [PubMed]
- Vollaard, N.B.; Metcalfe, R.S. Research into the health benefits of sprint interval training should focus on protocols with fewer and shorter sprints. Sports Med. 2017, 47, 2443–2451. [Google Scholar] [CrossRef]
- Glaister, M.; Howatson, G.; Pattison, J.R.; McInnes, G. The reliability and validity of fatigue measures during multiple–sprint work: An issue revisited. J. Strength Cond. Res. 2008, 22, 1597–1601. [Google Scholar] [CrossRef]
- Nowak-Lis, A.; Gabryś, T.; Nowak, Z.; Jastrzębski, P.; Szmatlan-Gabryś, U.; Konarska, A.; Grzybowska-Ganszczyk, D.; Pilis, A. The Use of Artificial Hypoxia in Endurance Training in Patients after Myocardial Infarction. Int. J. Environ. Res. Public Health 2021, 18, 1633. [Google Scholar] [CrossRef]
- Richardson, A.J.; Gibson, O.R. Simulated hypoxia does not further improve aerobic capacity during sprint interval training. J. Sports Med. Phys. Fit. 2015, 55, 1099–1106. [Google Scholar]
- Truijens, M.J.; Toussaint, H.M.; Dow, J.; Levine, B.D. Effect of high-intensity hypoxic training on sea-level swimming performances. J. Appl. Physiol. 2003, 94, 733–743. [Google Scholar] [CrossRef]
- Burgomaster, K.A.; Howarth, K.R.; Phillips, S.M.; Rakobowchuk, M.; MacDonald, M.J.; McGee, S.L.; Gibala, M.J. Similar metabolic adaptations during exercise after low volume sprint interval and traditional endurance training in humans. J. Physiol. 2008, 586, 151–160. [Google Scholar] [CrossRef]
- Arezzolo, D.; Coffey, V.G.; Byrne, N.M.; Doering, T.M. Effects of Eight Interval Training Sessions in Hypoxia on Anaerobic, Aerobic, and High Intensity Work Capacity in Endurance Cyclists. High Alt. Med. Biol. 2020, 21, 370–377. [Google Scholar] [CrossRef]
- Daussin, F.N.; Zoll, J.; Dufour, S.P.; Ponsot, E.; Lonsdorfer-Wolf, E.; Doutreleau, S.; Mettauer, B.; Piquard, F.; Geny, B.; Richard, R. Effect of interval versus continuous training on cardiorespiratory and mitochondrial functions: Relationship to aerobic performance improvements in sedentary subjects. Am. J. Physiol. Regul. Integr. Comp. Physiol. 2008, 295, R264–R272. [Google Scholar] [CrossRef]
- Jones, A.M.; Wilkerson, D.P.; DiMenna, F.; Fulford, J.; Poole, D.C. Muscle metabolic responses to exercise above and below the “critical power” assessed using 31P-MRS. Am. J. Physiol. Regul. Integr. Comp. Physiol. 2008, 294, R585–R593. [Google Scholar] [CrossRef]
- Vanhatalo, A.; Fulford, J.; DiMenna, F.J.; Jones, A.M. Influence of hyperoxia on muscle metabolic responses and the power–duration relationship during severe-intensity exercise in humans: A 31P magnetic resonance spectroscopy study. Exp Physiol. 2010, 95, 528–540. [Google Scholar] [CrossRef]
- Bailey, S.J.; Wilkerson, D.P.; DiMenna, F.J.; Jones, A.M. Influence of repeated sprint training on pulmonary O2 uptake and muscle deoxygenation kinetics in humans. J. Appl. Physiol. 2009, 106, 1875–1887. [Google Scholar] [CrossRef]
- Gibala, M.J.; McGee, S.L. Metabolic adaptations to short-term high-intensity interval training: A little pain for a lot of gain? Exerc. Sport Sci. Rev. 2008, 36, 58–63. [Google Scholar] [CrossRef]
- Harmer, A.R.; McKenna, M.J.; Sutton, J.R.; Snow, R.J.; Ruell, P.A.; Booth, J.; Thompson, M.W.; Mackay, N.A.; Stathis, C.G.; Crameri, R.M. Skeletal muscle metabolic and ionic adaptations during intense exercise following sprint training in humans. J. Appl. Physiol. 2000, 89, 1793–1803. [Google Scholar] [CrossRef]
- Poole, D.C.; Ward, S.A.; Whipp, B.J. The effects of training on the metabolic and respiratory profile of high-intensity cycle ergometer exercise. Eur. J. Appl. Physiol. Occup. Physiol. 1990, 59, 421–429. [Google Scholar] [CrossRef]
- Hobbins, L.; Gaoua, N.; Hunter, S.; Girard, O. Psycho-physiological responses to perceptually-regulated interval runs in hypoxia and normoxia. Physiol. Behav. 2019, 209, 112611. [Google Scholar] [CrossRef]
- Coppel, J.; Hennis, P.; Gilbert-Kawai, E.; Grocott, M.P. The physiological effects of hypobaric hypoxia versus normobaric hypoxia: A systematic review of crossover trials. Extrem. Physiol. Med. 2015, 4, 1–20. [Google Scholar] [CrossRef]
- Wilber, R.L. Application of altitude/hypoxic training by elite athletes. Med. Sci. Sports Exerc. 2007, 39, 1610–1624. [Google Scholar] [CrossRef]


| Parameters | 15 H (n = 8) | 15 N (n = 8) | 30 H (n = 8) | 30 N (n = 8) | ||||
|---|---|---|---|---|---|---|---|---|
| Pre | Post | Pre | Post | Pre | Post | Pre | Post | |
| Age (years) | 20.75 ± 1.83 | 20.88 ± 1.46 | 20.50 ± 1.31 | 20.13 ± 1.25 | ||||
| Height (cm) | 177.63 ± 8.43 | 177.38 ± 4.75 | 176.88 ± 7.16 | 174.00 ± 7.54 | ||||
| Body Weight (kg) | 66.38 ± 7.75 | 66.90 ± 7.59 | 74.16 ± 9.11 | 75.11 ± 8.54 | 73.61 ± 6.75 | 75.11 ± 8.54 | 72.33 ± 11.10 | 72.49 ± 11.72 |
| Body Fat Percent (%) | 11.11 ± 3.80 | 11.50 ± 2.98 | 13.25 ± 3.54 | 14.10 ± 2.86 | 11.29 ± 4.09 | 11.83 ± 3.93 | 13.55 ± 4.28 | 13.55 ± 4.47 |
| LBM (kg) | 57.68 ± 6.52 | 59.13 ± 6.26 | 64.11 ± 5.91 | 64.38 ± 5.99 | 65.18 ± 4.76 | 64.95 ± 3.91 | 62.18 ± 7.26 | 58.85 ± 7.92 |
| BMI | 20.55 ± 1.52 | 21.14 ± 1.04 | 23.56 ± 2.70 | 23.85 ± 2.42 | 23.55 ± 2.09 | 23.66 ± 2.13 | 23.85 ± 2.92 | 22.69 ± 4.04 |
| Parameters | 15 H | 15 N | 30 H | 30 N | ||||
|---|---|---|---|---|---|---|---|---|
| Pre | Post | Pre | Post | Pre | Post | Pre | Post | |
| VO2mean (ml.kg.min) | 37.23 ± 3.80 | 36.71 ± 3.73 | 37.88 ± 2.52 | 37.97 ± 2.94 | 36.96 ± 4.69 | 37.99 ± 4.82 | 38.13 ± 3.20 | 35.32 ± 7.09 |
| VO2max (ml.kg.min) | 61.15 ± 5.45 | 59.00 ± 6.94 | 59.90 ± 4.73 | 61.49 ± 4.64 | 59.74 ± 7.23 | 59.91 ± 7.36 | 60.84 ± 4.56 | 57.72 ± 9.59 |
| HR at VO2max | 188.17 ± 8.67 | 188.10 ± 7.50 | 190.13 ± 6.14 | 195.55 ± 5.99 | 191.81 ± 5.78 | 191.59 ± 9.31 | 193.39 ± 10.22 | 194.08 ± 10.05 |
| TTE (s) | 1144.5 ± 89.86 | 1193.88 ± 81.54 * | 1100.38 ± 83.80 | 1165.87 ± 69.99 * | 1114.13 ± 73.76 | 1176.25 ± 85.61 * | 1126.13 ± 106.8 | 1198.63 ± 96.09 * |
| RPEmean | 11.92 ± 0.91 | 10.55 ± 1.68 * | 11.60 ± 1.03 | 11.43 ± 1.30 * | 11.58 ± 2.08 | 11.09 ± 1.66 * | 11.91 ± 1.26 | 11.72 ± 1.11 * |
| RPEpeak | 19.25 ± 0.88 | 18.50 ± 2.13 | 19.50 ± 0.75 | 19.12 ± 0.99 | 18.50 ± 2.82 | 18.87 ± 1.80 | 18.87 ± 1.55 | 19.62 ± 0.74 |
| LA (mmol/L) | 10.76 ± 4.21 | 13.51 ± 3.79 * | 13.18 ± 3.62 | 15.69 ± 2.59 * | 11.33 ± 2.74 | 15.48 ± 3.58 * | 12.00 ± 2.97 | 13.84 ± 2.43 * |
| Parameters | 15 H | 15 N | 30 H | 30 N | ||||
|---|---|---|---|---|---|---|---|---|
| Pre | Post | Pre | Post | Pre | Post | Pre | Post | |
| PP (w/kg) | 9.85 ± 1.40 | 11.32 ± 1.49 * | 9.91 ± 1.49 | 11.25 ± 0.84 * | 9.97 ± 1.18 | 10.89 ± 1.43 * | 9.62 ± 1.53 | 10.65 ± 0.62 * |
| MP (w/kg) | 6.67 ± 0.70 | 7.20 ± 0.48 * | 6.40 ± 0.67 | 7.33 ± 0.41 * | 6.68 ± 0.46 | 7.10 ± 0.54 * | 6.33 ± 0.68 | 7.03 ± 0.43 * |
| Work (kJ) | 12.22 ± 1.07 | 13.14 ± 1.93 * | 13.41 ± 2.80 | 15.13 ± 2.41 * | 13.29 ± 1.37 | 14.55 ± 1.49 * | 12.80 ± 1.67 | 14.08 ± 2.08 * |
| Sprint Decrement (%) | 65.47 ± 9.65 | 72.24 ± 9.07 | 67.52 ± 9.21 | 68.36 ± 5.97 | 68.38 ± 3.45 | 70.55 ± 5.73 | 64.06 ± 7.69 | 64.98 ± 6.62 |
| sDec (%) | 16.63 ± 7.24 | 11.52 ± 2.74 * | 21.02 ± 5.97 | 13.49 ± 5.94 * | 20.14 ± 6.39 | 14.30 ± 3.74 * | 15.30 ± 6.91 | 11.85 ± 5.95 * |
| Average of Pre Sprint MPA | 4.25 ± 0.85 | 2.05 ± 1.11 * | 4.07 ± 1.37 | 3.01 ± 1.15 * | 4.48 ± 2.33 | 3.14 ± 1.47 * | 4.81 ± 1.21 | 2.89 ± 1.02 * |
| Average of Post Sprint MPA | 6.91 ± 1.52 | 4.18 ± 1.40 * | 6.80 ± 1.05 | 5.58 ± 1.91 * | 5.52 ± 1.57 | 4.16 ± 2.00 * | 6.78 ± 1.11 | 4.82 ± 1.29 * |
| Average of Pre Sprint RPE | 12.50 ± 1.18 | 9.17 ± 2.20 * | 12.65 ± 1.48 | 11.34 ± 1.61 * | 12.04 ± 2.43 | 10.43 ± 2.39 * | 13.97 ± 1.77 | 10.71 ± 1.89 * |
| Average of Post Sprint RPE | 16.15 ± 2.30 | 13.00 ± 2.25 * | 17.40 ± 1.64 | 15.46 ± 1.52 * | 15.26 ± 2.80 | 14.00 ± 3.12 * | 15.96 ± 1.06 | 14.31 ± 1.76 * |
| Average of Pre Sprint HR | 144.90 ± 7.68 | 134.09 ± 11.38 | 145.75 ± 15.70 | 146.21 ± 10.99 | 142.30 ± 11.81 | 140.38 ± 7.86 | 143.28 ± 10.86 | 140.80 ± 14.95 |
| Average of Post Sprint HR | 185.09 ± 5.82 | 179.71 ± 6.09 | 184.22 ± 9.78 | 186.34 ± 7.25 | 183.31 ± 5.24 | 184.02 ± 5.67 | 184.18 ± 6.73 | 182.50 ± 10.40 |
| Critical Power (w) | 162.95 ± 29.15 | 198.98 ± 29.90 * | 180.11 ± 38.41 | 205.67 ± 33.84 * | 175.87 ± 34.34 | 205.09 ± 32.79 * | 169.24 ± 43.71 | 196.04 ± 24.07 * |
| Parameters | 15 H | 15 N | 30 H | 30 N |
|---|---|---|---|---|
| PP (w/kg) | 10.54 ± 0.95 | 10.87 ± 1.18 | 9.91 ± 1.27 | 9.97 ± 0.79 |
| MP (w/kg) | 8.21 ± 0.54 * | 8.30 ± 0.62 * | 6.66 ± 0.56 | 6.54 ± 0.43 |
| Sprint Decrement (%) | 47.08 ± 9.01 | 47.86 ± 9.89 | 68.96 ± 4.97 # | 65.40 ± 4.09 # |
| sDec (%) | 10.65 ± 2.56 | 10.76 ± 2.27 | 16.53 ± 2.85 # | 14.79 ± 2.68 # |
| Work (kJ) | 8.07 ± 1.21 | 9.14 ± 1.49 | 13.51 ± 1.51 # | 13.09 ± 1.74 # |
| Average of Pre Sprint MPA | 2.67 ± 0.67 | 2.84 ± 0.90 | 3.14 ± 0.77 | 2.82 ± 1.23 |
| Average of Post Sprint MPA | 4.43 ± 1.22 | 4.67 ± 1.34 | 5.01 ± 1.14 | 4.48 ± 1.31 |
| Average of Pre Sprint RPE | 9.93 ± 1.65 | 10.62 ± 1.22 | 11.12 ± 1.75 | 10.88 ± 2.08 |
| Average of Post Sprint RPE | 12.80 ± 2.35 | 13.81 ± 1.79 | 15.00 ± 1.72 | 14.09 ± 1.81 |
| Average of Pre Sprint HR (beats/min) | 143.48 ± 10.0 | 143.68 ± 11.7 | 142.39 ± 6.92 | 140.36 ± 12.1 |
| Average of Post Sprint HR (beats/min) | 173.91 ± 6.30 | 175.11 ± 8.90 | 180.23 ± 5.36 | 180.93 ± 9.41 |
| Average of Pre Sprint SpO2 (%) | 84.71 ± 3.11 $ | 92.26 ± 1.36 | 83.9 ± 2.51 $ | 91.67 ± 1.91 |
| Average of Post Sprint SpO2 (%) | 83.97 ± 2.58 $ | 90.61 ± 1.04 | 83.59 ± 1.72 $ | 90.16 ± 1.87 |
Publisher’s Note: MDPI stays neutral with regard to jurisdictional claims in published maps and institutional affiliations. |
© 2021 by the authors. Licensee MDPI, Basel, Switzerland. This article is an open access article distributed under the terms and conditions of the Creative Commons Attribution (CC BY) license (https://creativecommons.org/licenses/by/4.0/).
Share and Cite
Karabiyik, H.; Eser, M.C.; Guler, O.; Yasli, B.C.; Ertetik, G.; Sisman, A.; Koz, M.; Gabrys, T.; Pilis, K.; Karayigit, R. The Effects of 15 or 30 s SIT in Normobaric Hypoxia on Aerobic, Anaerobic Performance and Critical Power. Int. J. Environ. Res. Public Health 2021, 18, 3976. https://doi.org/10.3390/ijerph18083976
Karabiyik H, Eser MC, Guler O, Yasli BC, Ertetik G, Sisman A, Koz M, Gabrys T, Pilis K, Karayigit R. The Effects of 15 or 30 s SIT in Normobaric Hypoxia on Aerobic, Anaerobic Performance and Critical Power. International Journal of Environmental Research and Public Health. 2021; 18(8):3976. https://doi.org/10.3390/ijerph18083976
Chicago/Turabian StyleKarabiyik, Hakan, Mustafa Can Eser, Ozkan Guler, Burak Caglar Yasli, Goktug Ertetik, Aysegul Sisman, Mitat Koz, Tomasz Gabrys, Karol Pilis, and Raci Karayigit. 2021. "The Effects of 15 or 30 s SIT in Normobaric Hypoxia on Aerobic, Anaerobic Performance and Critical Power" International Journal of Environmental Research and Public Health 18, no. 8: 3976. https://doi.org/10.3390/ijerph18083976
APA StyleKarabiyik, H., Eser, M. C., Guler, O., Yasli, B. C., Ertetik, G., Sisman, A., Koz, M., Gabrys, T., Pilis, K., & Karayigit, R. (2021). The Effects of 15 or 30 s SIT in Normobaric Hypoxia on Aerobic, Anaerobic Performance and Critical Power. International Journal of Environmental Research and Public Health, 18(8), 3976. https://doi.org/10.3390/ijerph18083976