
Impact of Technology-Based Intervention for Improving Self-Management Behaviors in Black Adults with Poor Cardiovascular Health: A Randomized Control Trial

 , , ,
, , ,
Abstract
1. Introduction
2. Methods
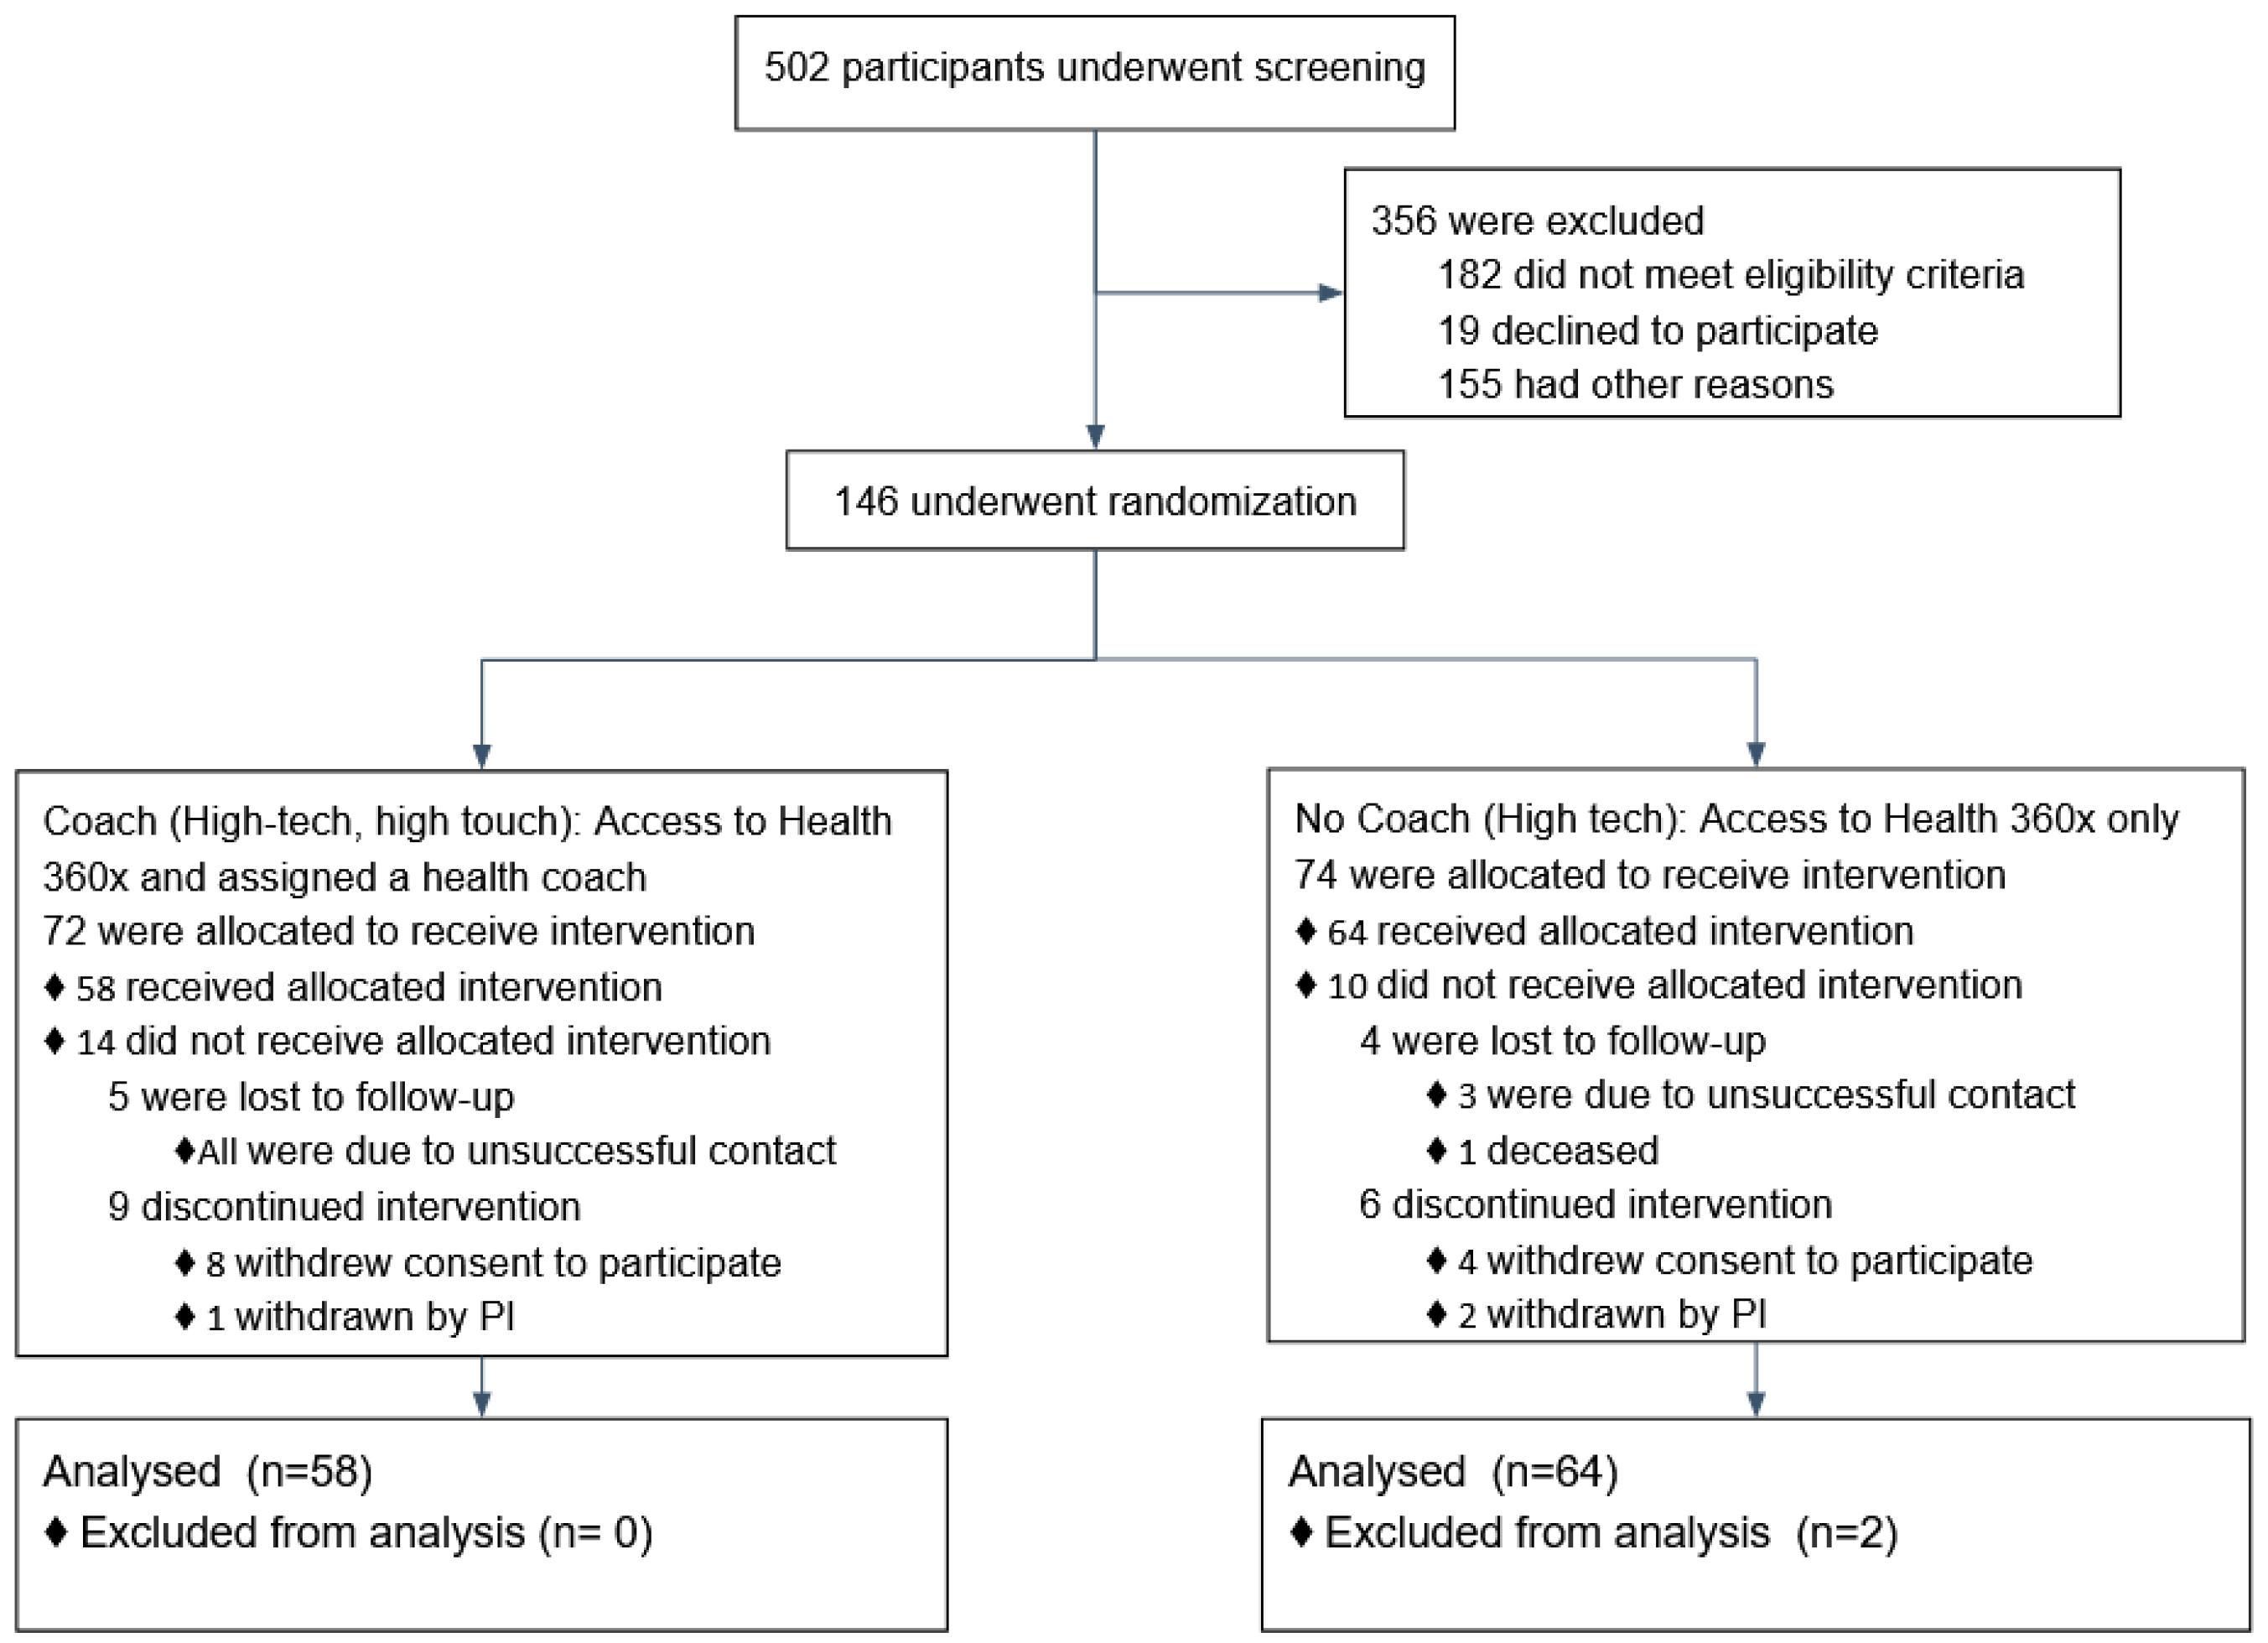
2.1. Participants and Recruitment
- BMI: Poor = ≥ 30.0 kg/m2; Intermediate = 25.0–29.9 kg/m2; Ideal = <25.0 kg/m2;
- Cholesterol: Poor = ≥ 240 mg/dL; Intermediate = 200–239 mg/dL (untreated) or treated to goal; Ideal = < 200 mg/dL (untreated);
- BP: Poor = SBP ≥ 140 mmHg or DBP ≥ 90 mmHg; Intermediate = Systolic Blood Pressure (SBP) 120–139 mmHg, Diastolic Blood Pressure (DBP) 80–89 mmHg, or treated to goal; Ideal = SBP < 140 mmHg and DBP < 90 mmHg;
- Fasting glucose: Poor = ≥ 126 mg/dL; Intermediate = 100–125 mg/dL (untreated) or treated to goal; Ideal = <100 mg/dL (untreated).
Inclusion and Exclusion Criteria
2.2. H360x Intervention for Cardiovascular Disease Self-Management
Randomization
2.3. Statistical Methods
2.3.1. Outcomes, Mediators and Effect-Modifier Variables
2.3.2. Sample Size Calculation
2.3.3. Statistical Analysis
3. Results
4. Discussion
4.1. Principal Findings
4.2. Limitations
5. Conclusions
Author Contributions
Funding
Institutional Review Board Statement
Informed Consent Statement
Data Availability Statement
Acknowledgments
Conflicts of Interest
References
- Virani, S.S.; Alonso, A.; Benjamin, E.J.; Bittencourt, M.S.; Callaway, C.W.; Carson, A.P.; Chamberlain, A.M.; Chang, A.R.; Cheng, S.; Delling, F.N.; et al. Heart Disease and Stroke Statistics—2020 Update: A Report From the American Heart Association. Circulation 2020, 141, e139–e596. [Google Scholar] [CrossRef] [PubMed]
- Daumit, G.L.; Hermann, J.A.; Coresh, J.; Powe, N.R. Use of cardiovascular procedures among black persons and white persons: A 7-year nationwide study in patients with renal disease. Ann. Intern. Med. 1999, 130, 173–182. [Google Scholar] [CrossRef] [PubMed]
- Bell, C.N.; Thorpe, R.J.; Bowie, J.V.; LaVeist, T.A. Race disparities in cardiovascular disease risk factors within socioeconomic status strata. Ann. Epidemiol. 2018, 28, 147–152. [Google Scholar] [CrossRef]
- Schultz, W.M.; Kelli, H.M.; Lisko, J.C.; Varghese, T.; Shen, J.; Sandesara, P.; Quyyumi, A.A.; Taylor, H.A.; Gulati, M.; Harold, J.G.; et al. Socioeconomic Status and Cardiovascular Outcomes. Circulation 2018, 137, 2166–2178. [Google Scholar] [CrossRef] [PubMed]
- Brothers, R.M.; Fadel, P.J.; Keller, D.M. Racial disparities in cardiovascular disease risk: Mechanisms of vascular dysfunction. Am. J. Physiol. Circ. Physiol. 2019, 317, H777–H789. [Google Scholar] [CrossRef]
- Dubbert, P.M.; Robinson, J.C.; Sung, J.H.; Ainsworth, B.E.; Wyatt, S.B.; Carithers, T.; Newton, R.; Rhudy, J.L.; Barbour, K.; Sternfeld, B.; et al. Physical Activity and Obesity in African Americans: The Jackson Heart Study. Ethn. Dis. 2010, 20, 383–389. [Google Scholar]
- Gillum, R. Frequency of attendance at religious services and cigarette smoking in American women and men: The Third National Health and Nutrition Examination Survey. Prev. Med. 2005, 41, 607–613. [Google Scholar] [CrossRef]
- Robinson, J.C.; Wyatt, S.B.; Dubbert, P.M.; May, W.; Sims, M. The impact of neighborhood on physical activity in the Jackson Heart Study. Prev. Med. 2016, 90, 216–222. [Google Scholar] [CrossRef]
- Islam, S.J.; Kim, J.H.; Baltrus, P.; Topel, M.L.; Liu, C.; Ko, Y.-A.; Mujahid, M.S.; Vaccarino, V.; Sims, M.; Mubasher, M.; et al. Neighborhood Characteristics and Ideal Cardiovascular Health Among Black Adults: Results From the Morehouse-Emory Cardiovascular (MECA) Center for Health Equity. Ann. Epidemiol. 2020. [Google Scholar] [CrossRef]
- Topel, M.L.; Kim, J.H.; Mujahid, M.S.; Ko, Y.; Vaccarino, V.; Mubasher, M.; Liu, C.; Dunbar, S.; Sims, M.; Taylor, H.A.; et al. Individual Characteristics of Resilience are Associated With Lower-Than-Expected Neighborhood Rates of Cardiovascular Disease in Blacks: Results From the Morehouse-Emory Cardiovascular (MECA) Center for Health Equity Study. J. Am. Heart Assoc. 2019, 8, e011633. [Google Scholar] [CrossRef] [PubMed]
- Clark, C.R.; Ommerborn, M.J.; Hickson, D.A.; Grooms, K.N.; Sims, M.; Taylor, H.A.; Albert, M.A. Neighborhood Disadvantage, Neighborhood Safety and Cardiometabolic Risk Factors in African Americans: Biosocial Associations in the Jackson Heart Study. PLoS ONE 2013, 8, e63254. [Google Scholar] [CrossRef]
- Kim, J.H.; Lewis, T.T.; Topel, M.L.; Mubasher, M.; Li, C.; Vaccarino, V.; Mujahid, M.S.; Sims, M.; Quyyumi, A.A.; Taylor, H.A.; et al. Identification of Resilient and At-Risk Neighborhoods for Cardiovascular Disease Among Black Residents: The Morehouse-Emory Cardiovascular (MECA) Center for Health Equity Study. Prev. Chronic Dis. 2019, 16, E57. [Google Scholar] [CrossRef]
- My Life Check: Life’s Simple 7. Available online: www.heart.org/en/healthy-living/healthy-lifestyle/my-life-check-lifes-simple-7 (accessed on 25 February 2021).
- Brown, J.; Michie, S.; Geraghty, A.W.A.; Yardley, L.; Gardner, B.; Shahab, L.; Stapleton, J.A.; West, R. Internet-based intervention for smoking cessation (StopAdvisor) in people with low and high socioeconomic status: A randomised controlled trial. Lancet Respir. Med. 2014, 2, 997–1006. [Google Scholar] [CrossRef]
- Thomas, R.E.; Lorenzetti, D.L.; Spragins, W. Systematic Review of Mentoring to Prevent or Reduce Tobacco Use by Adolescents. Acad. Pediatr. 2013, 13, 300–307. [Google Scholar] [CrossRef] [PubMed]
- Spencer, R.A.; Bower, J.; Kirk, S.F.L.; Friesen, C.H. Peer Mentoring Is Associated With Positive Change in Physical Activity and Aerobic Fitness of Grades 4, 5, and 6 Students in the Heart Healthy Kids Program. Health Promot. Pr. 2014, 15, 803–811. [Google Scholar] [CrossRef]
- Schulz, A.J.; Israel, B.A.; Mentz, G.B.; Bernal, C.; Caver, D.; Demajo, R.; Diaz, G.; Gamboa, C.; Gaines, C.; Hoston, B.; et al. Effectiveness of a Walking Group Intervention to Promote Physical Activity and Cardiovascular Health in Predominantly Non-Hispanic Black and Hispanic Urban Neighborhoods. Health Educ. Behav. 2015, 42, 380–392. [Google Scholar] [CrossRef]
- Jiang, L.; Huang, H.; Johnson, A.; Dill, E.J.; Beals, J.; Manson, S.M.; Roubideaux, Y.; Project, T.S.D.P.F.I.D.P.D. Socioeconomic Disparities in Weight and Behavioral Outcomes among American Indian and Alaska Native Participants of a Translational Lifestyle Intervention Project. Diabetes Care 2015, 38, 2090–2099. [Google Scholar] [CrossRef] [PubMed]
- Siren, R.; Eriksson, J.G.; Peltonen, M.; Vanhanen, H. Impact of Health Counselling on Cardiovascular Disease Risk in Middle Aged Men: Influence of Socioeconomic Status. PLoS ONE 2014, 9, e88959. [Google Scholar] [CrossRef] [PubMed]
- Lefevre, M.L. Behavioral Counseling to Promote a Healthful Diet and Physical Activity for Cardiovascular Disease Prevention in Adults with Cardiovascular Risk Factors: U.S. Preventive Services Task Force Recommendation Statement. Ann. Intern. Med. 2014, 161, 587–593. [Google Scholar] [CrossRef]
- Ford, E.S.; Greenlund, K.J.; Hong, Y. Ideal Cardiovascular Health and Mortality from All Causes and Diseases of the Circulatory System among Adults in the United States. Circulation 2012, 125, 987–995. [Google Scholar] [CrossRef] [PubMed]
- Fox, S. Health Topics. [online] Pew Research Center. 2011. Available online: https://web.archive.org/web/20111112000032; http://pewinternet.org/~/media/Files/Reports/2011/PIP_HealthTopics.pdf (accessed on 25 February 2021).
- Christopher Gibbons, M. Use of health information technology among racial and ethnic underserved communities. Perspect Health Inf. Manag. 2011, 8, 1f. [Google Scholar] [PubMed]
- Pemu, P.; Willock, R.J.; Alema-Mensa, E.; Rollins, L.; Brown, M.; Clair, B.S.; Olorundare, E.; McCaslin, A.; Akintobi, T.H.; Quarshie, A.; et al. Achieving Health Equity with e-Healthystrides©: Patient Perspectives of a Consumer Health Information Technology Application. Ethn. Dis. 2019, 29, 393–404. [Google Scholar] [CrossRef]
- Islam, S.J.; Kim, J.H.; Topel, M.; Liu, C.; Ko, Y.; Mujahid, M.S.; Sims, M.; Mubasher, M.; Ejaz, K.; Morgan-Billingslea, J.; et al. Cardiovascular Risk and Resilience Among Black Adults: Rationale and Design of the MECA Study. J. Am. Heart Assoc. 2020, 9, e015247. [Google Scholar] [CrossRef] [PubMed]
- Mensah, G.A.; Mokdad, A.H.; Ford, E.S.; Greenlund, K.J.; Croft, J.B. State of Disparities in Cardiovascular Health in the United States. Circ. 2005, 111, 1233–1241. [Google Scholar] [CrossRef] [PubMed]
- Obisesan, T.O.; Vargas, C.M.; Gillum, R.F. Geographic Variation in Stroke Risk in the United States. Stroke 2000, 31, 19–25. [Google Scholar] [CrossRef]
- Block, G.; Gillespie, C.; Rosenbaum, E.H.; Jenson, C. A rapid food screener to assess fat and fruit and vegetable intake. Am. J. Prev. Med. 2000, 18, 284–288. [Google Scholar] [CrossRef]
- Holmes, M.D.; Powell, I.J.; Campos, H.; Stampfer, M.J.; Giovannucci, E.L.; Willett, W.C. Validation of a food frequency questionnaire measurement of selected nutrients using biological markers in African-American men. Eur. J. Clin. Nutr. 2007, 61, 1328–1336. [Google Scholar] [CrossRef][Green Version]
- Simpson, K.; Parker, B.A.; Capizzi, J.A.; Thompson, P.; Clarkson, P.M.; Freedson, P.S.; Pescatello, L.S. Validity and Reliability of Question 8 of the Paffenbarger Physical Activity Questionnaire Among Healthy Adults. J. Phys. Act. Health 2015, 12, 116–123. [Google Scholar] [CrossRef]
- Chobanian, A.V.; Bakris, G.L.; Black, H.R.; Cushman, W.C.; Green, L.A.; Izzo, J.J.L.; Jones, D.W.; Materson, B.J.; Oparil, S.; Wright, J.J.T.; et al. The Seventh Report of the Joint National Committee on Prevention, Detection, Evaluation, and Treatment of High Blood PressureThe JNC 7 Report. JAMA 2003, 289, 2560–2571. [Google Scholar] [CrossRef]
- Lloyd-Jones, D.M.; Hong, Y.; Labarthe, D.; Mozaffarian, D.; Appel, L.J.; Van Horn, L.; Greenlund, K.; Daniels, S.; Nichol, G.; Tomaselli, G.F.; et al. American heart association strategic planning task force and statistics committee defining and setting national goals for cardiovascular health promotion and disease reduction: The American heart association’s strategic impact goal through 2020 and beyond. Circulation 2010, 121, 586–613. [Google Scholar] [CrossRef]
- Folsom, A.R.; Shah, A.M.; Lutsey, P.L.; Roetker, N.S.; Alonso, A.; Avery, C.L.; Miedema, M.D.; Konety, S.; Chang, P.P.; Solomon, S.D. American Heart Association’s Life’s Simple 7: Avoiding Heart Failure and Preserving Cardiac Structure and Function. Am. J. Med. 2015, 128, 970–976.e2. [Google Scholar] [CrossRef] [PubMed]
- Ofili, E.; Pemu, P.; Quarshie, A.; Johnson, P.; Linn, L.J.; Kaur, D.; Ali, J. System and Method for Chronic Illness Care. U.S. Patent US20100017229A1, 21 January 2010. [Google Scholar]
- Goetzel, R.Z.; Pei, X.; Tabrizi, M.J.; Henke, R.M.; Kowlessar, N.; Nelson, C.F.; Metz, R.D. Ten Modifiable Health Risk Factors Are Linked To More Than One-Fifth Of Employer-Employee Health Care Spending. Health Aff. 2012, 31, 2474–2484. [Google Scholar] [CrossRef] [PubMed]
- Al Mheid, I.; Kelli, H.M.; Ko, Y.; Hammadah, M.; Ahmed, H.; Hayek, S.; Vaccarino, V.; Ziegler, T.R.; Gibson, G.; Lampl, M.; et al. Effects of a Health-Partner Intervention on Cardiovascular Risk. J. Am. Heart Assoc. 2016, 5, e004217. [Google Scholar] [CrossRef] [PubMed]
- Xanthakis, V.; Enserro, D.M.; Murabito, J.M.; Polak, J.F.; Wollert, K.C.; Januzzi, J.L.; Wang, T.J.; Tofler, G.; Vasan, R.S. Ideal Cardiovascular Health. Circulation 2014, 130, 1676–1683. [Google Scholar] [CrossRef] [PubMed]


| Baseline Characteristics | Treatment Assignment Coach vs. No Coach | ||||||
|---|---|---|---|---|---|---|---|
| All | Coach (n = 58) | No Coach (n = 62) | p-Value | ||||
| n (%) | Mean (SD) | n (%) | Mean (SD) | n (%) | Mean (SD) | ||
| Age at Baseline | 120 (100) | 55.6 (8.87) | 58 (100) | 56.2 (8.32) | 62 (100) | 55.1 (9.09) | 0.5112 |
| Sex at Birth | |||||||
| Females | 80 (66.67) | - | 40 (68.97) | - | 40 (64.52) | - | 0.6056 |
| Income | - | ||||||
| Less than $25,000 | 61 (50.83) | - | 28 (48.28) | - | 33 (53.23) | - | 0.7993 |
| $25,000 to <$50,000 | 26 (21.67) | - | 16 (27.59) | - | 10 (16.13) | - | 0.3803 |
| $50,000 or higher | 28 (23.33) | - | 12 (20.69) | - | 16 (25.81) | - | Reference |
| Don’t Know/not sure | 5 (4.17) | - | 2 (3.45) | - | 3 (4.84) | - | - |
| Occupation | |||||||
| Employed | 50 (41.67) | - | 28 (48.28) | - | 22 (35.48) | - | 0.3572 |
| Unemployed | 31 (25.83) | - | 12 (20.69) | - | 19 (30.65) | - | 0.5323 |
| Retired | 39 (32.50) | - | 18 (31.03) | - | 21 (33.87) | - | Reference |
| Relationship Status | |||||||
| Divorced/Widowed/Separated | 58 (48.33) | - | 29 (50.00) | - | 29 (46.77) | - | 0.5348 |
| Married/member of unmarried couple | 34 (28.33) | - | 17 (29.31) | - | 17 (27.42) | - | 0.5752 |
| Never Married | 28 (23.33) | - | 12 (20.69) | - | 16 (25.81) | - | Reference |
| Census Tract Type (At risk, Resilient or none) | |||||||
| At risk | 22 (18.33) | - | 9 (19.52) | - | 13 (20.97) | - | 0.3638 |
| Resilient | 19 (15.83) | - | 8 (13.79) | - | 11 (17.74) | - | 0.4449 |
| None | 79 (65.83) | - | 41 (70.69) | - | 38 (61.29) | - | Reference |
| Highest level of education | |||||||
| High School or less | 36 (30.00) | - | 15 (25.86) | - | 21 (33.87) | - | 0.3398 |
| Some college or higher | 84 (70.00) | - | 43 (74.14) | - | 41 (66.13) | - | Reference |
| Engagement with Health360x | |||||||
| Number of successful logins | 104 (86.67) | 6.9 (10.45) | 46 (79.31) | 7.5 (8.23) | 58 (93.54) | 6.4 (11.98) | 0.5013 |
| Number of sessions (e.g., app usage occurring after >=5 min of no activity_ | 104 (86.67) | 8.1 (11.55) | 46 (79.31) | 7.7 (5.23) | 58 (93.54) | 8.5 (14.80) | 0.7054 |
| Median session duration | 104 (86.67) | 3.6 (4.09) | 46 (79.31) | 3.3 (3.40) | 58 (93.54) | 3.8 (4.57) | 0.5174 |
| LS7 and Key Risk Factors at Baseline and 6 Months | Treatment Assignment Coach vs. No Coach | ||||||
|---|---|---|---|---|---|---|---|
| All | Coach (n = 58) | No Coach (n = 62) | p-Value | ||||
| n (%) | Mean (SD) | n (%) | Mean (SD) | n (%) | Mean (SD) | ||
| LS7 | |||||||
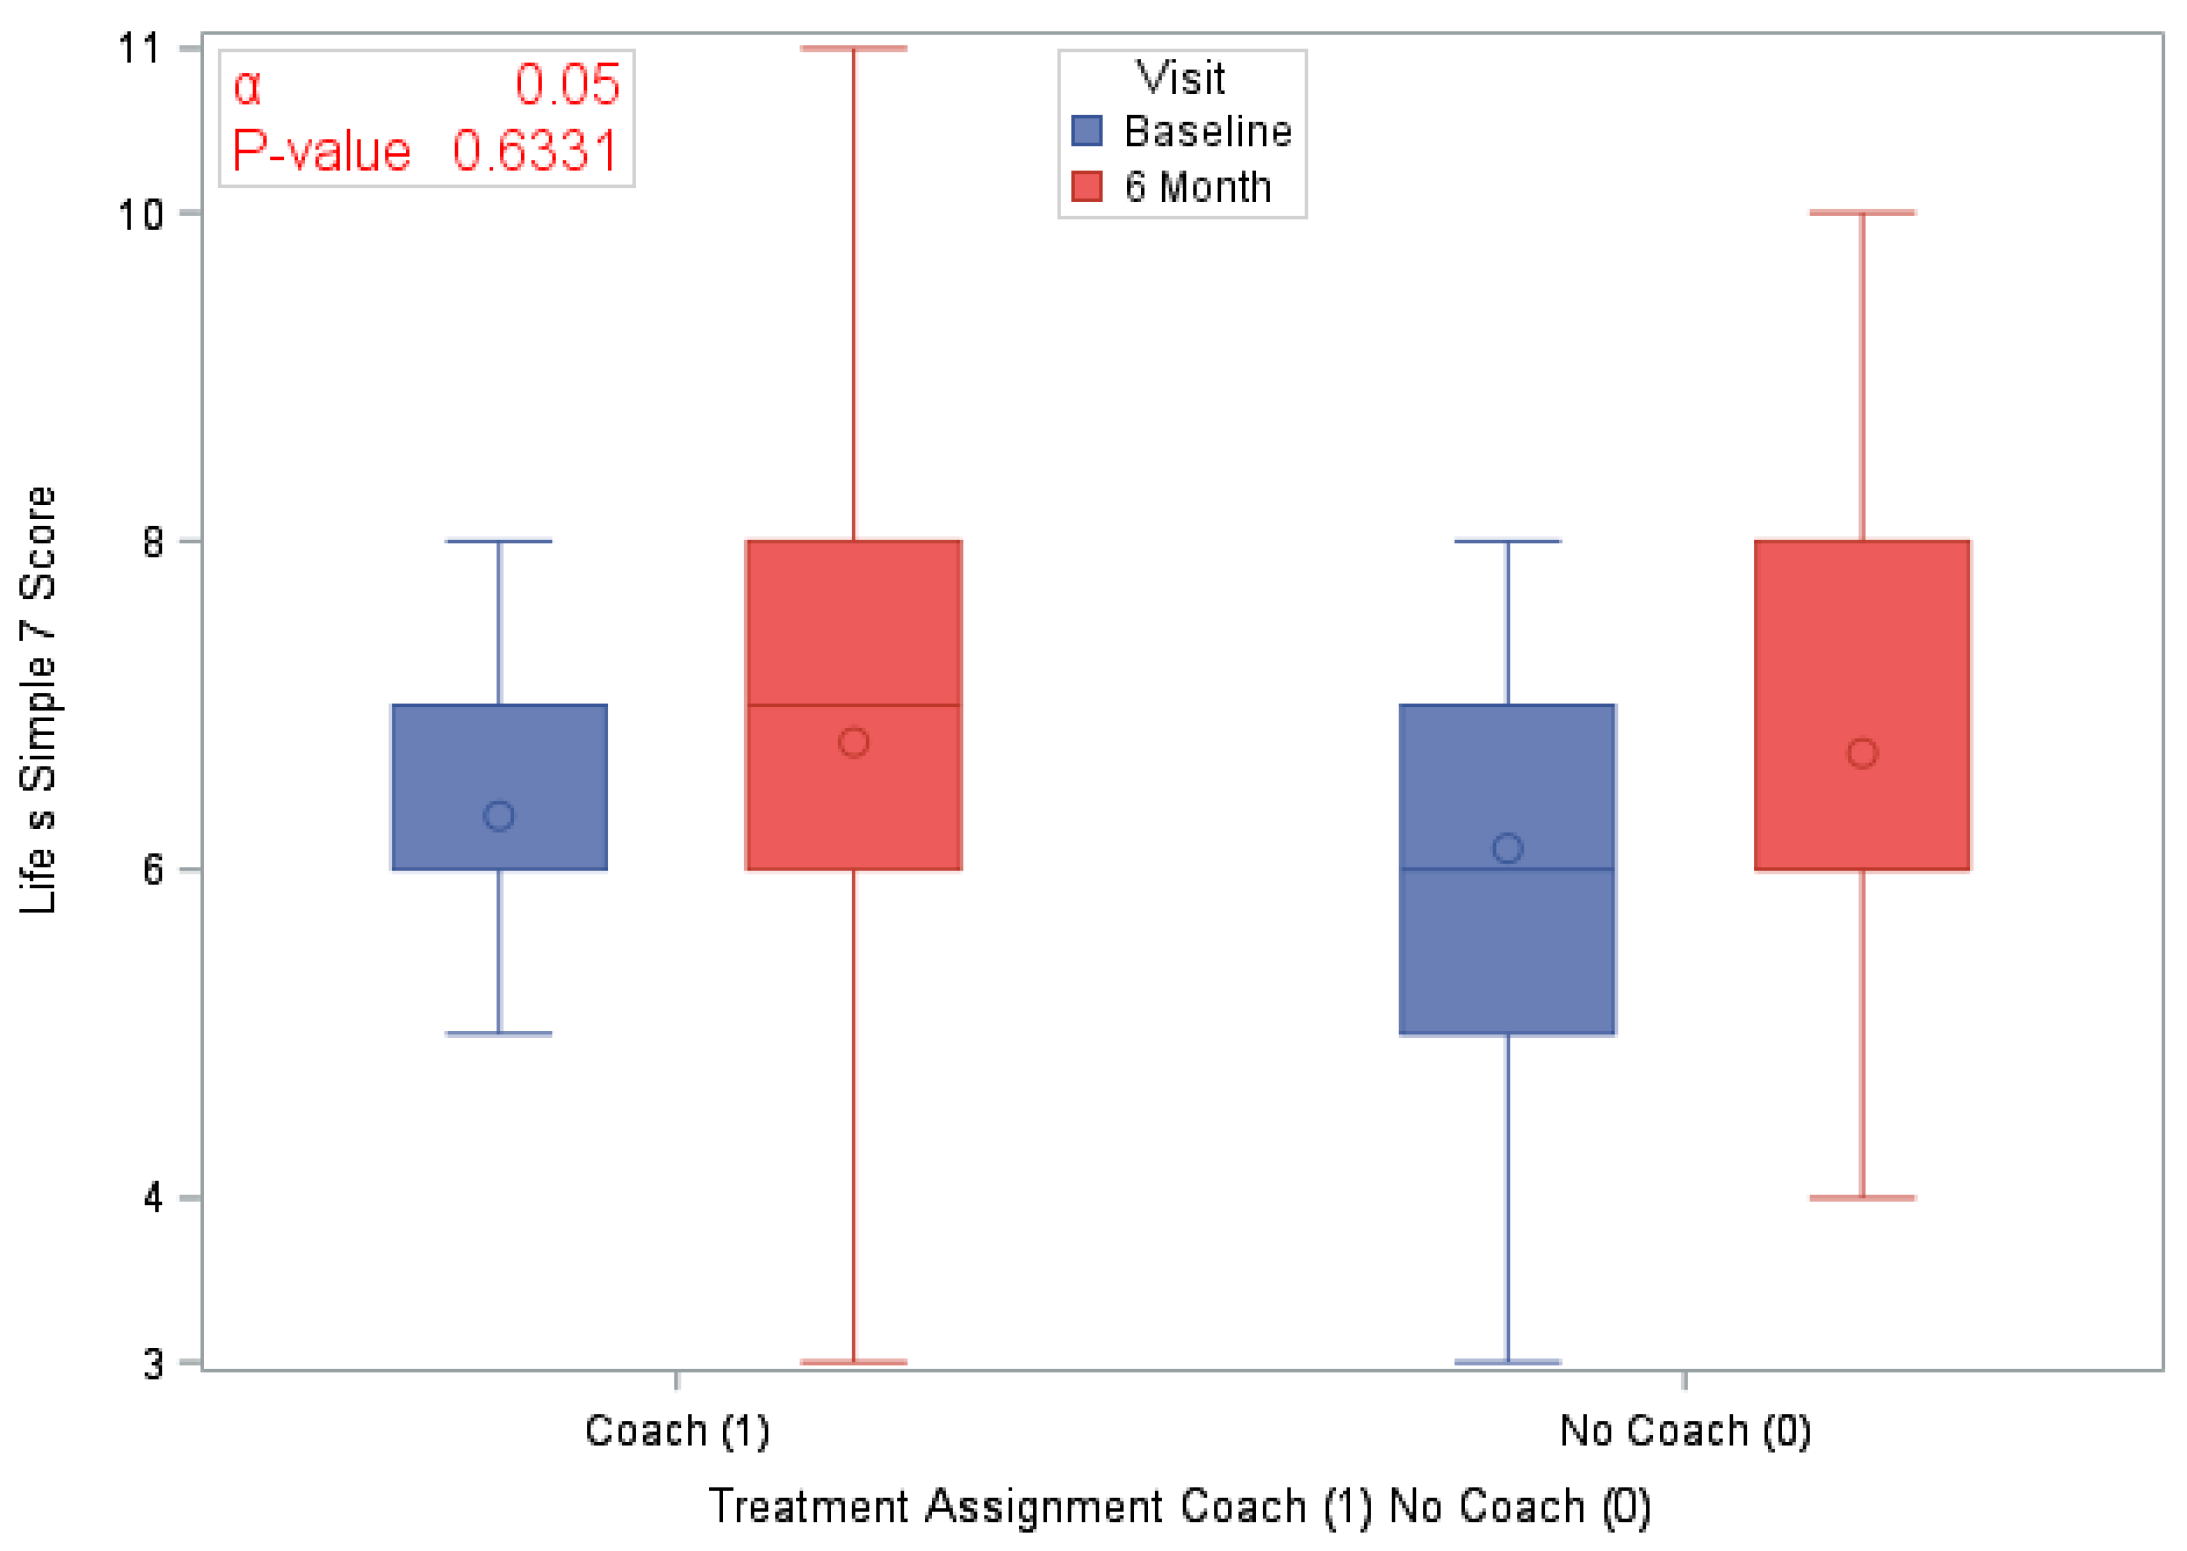
| LS7 at Baseline | 120 (100) | 6.2 (1.44) | 58 (100) | 6.3 (1.44) | 62 (100) | 6.1 (1.44) | 0.1475 |
| LS7 at 6 months | 120 (100) | 6.7 (1.72) | 58 (100) | 6.8 (1.84) | 62 (100) | 6.7 (1.61) | 0.8323 |
| Difference in LS7 at 6 months | 120 (100) | 0.5 (1.52) | 58 (100) | 0.4 (1.60) | 62 (100) | 0.6 (1.45) | 0.6331 |
| Blood Pressure (mmHg) | |||||||
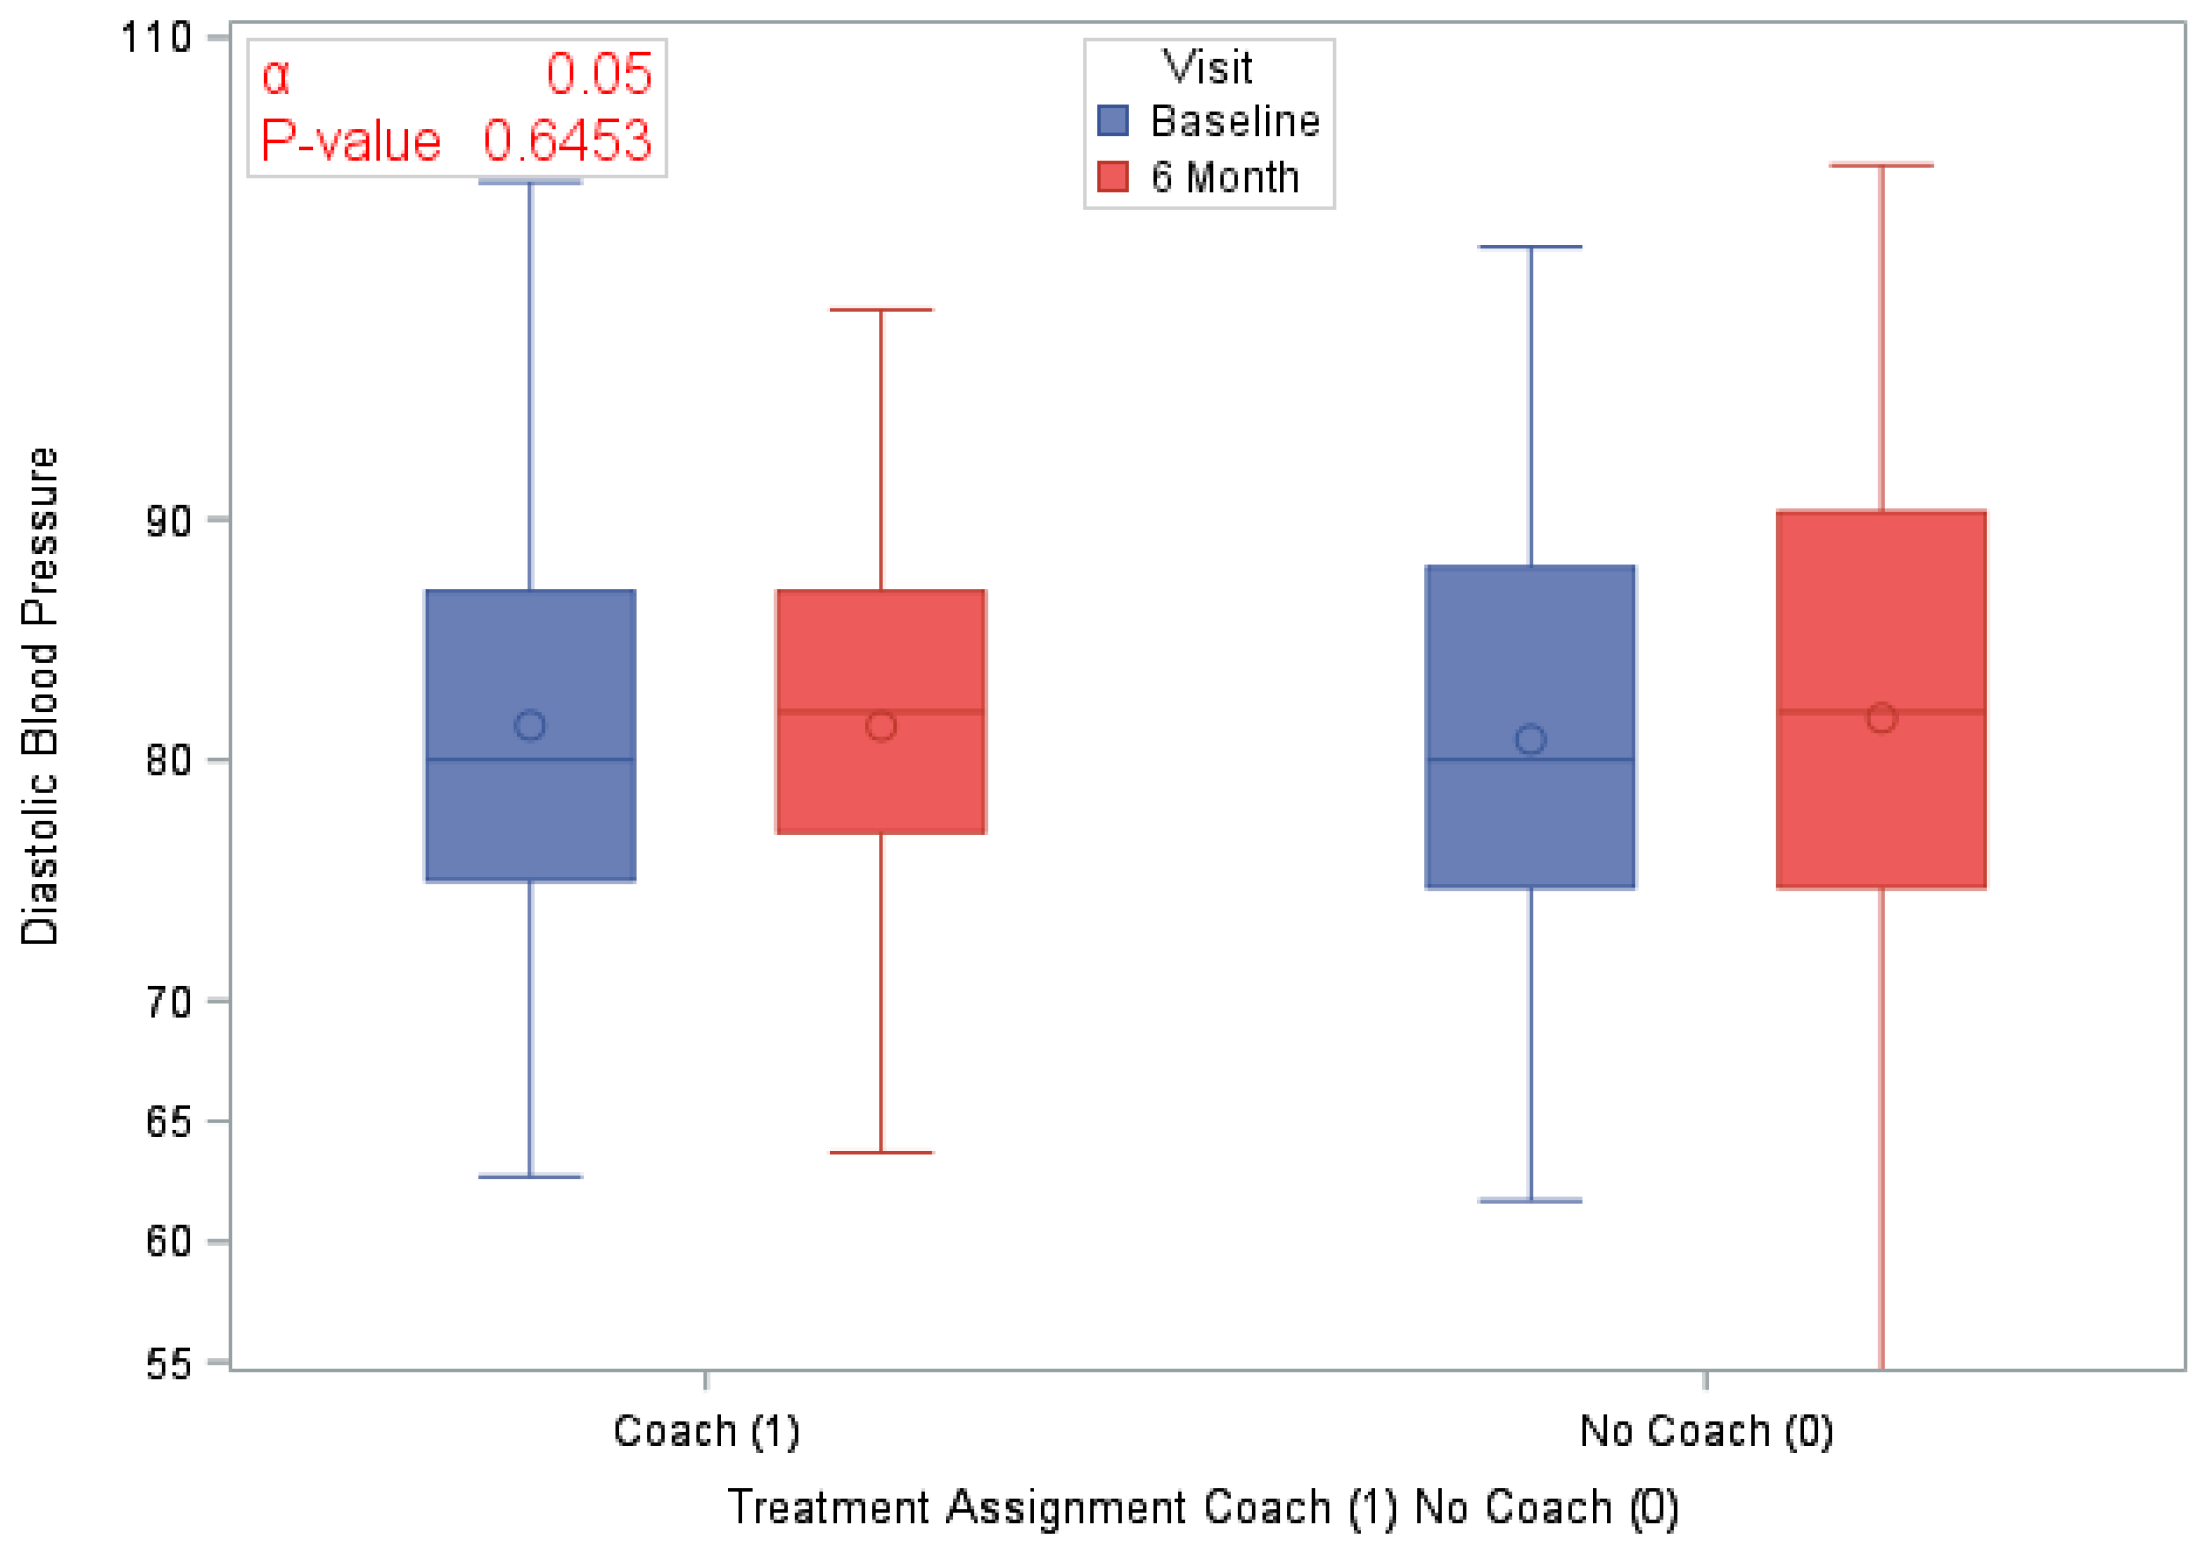
| Average Diastolic BP at Baseline | 120 (100) | 81.1 (9.81) | 58 (100) | 81.4 (9.75) | 62 (100) | 80.8 (9.93) | 0.7424 |
| Average Diastolic BP at 6 months | 120 (100) | 81.16 (10.84) | 58 (100) | 81.4 (9.82) | 62 (100) | 81.7 (11.79) | 0.8723 |
| Difference in Diastolic BP at 6 months | 120 (100) | 0.5 (10.78) | 58 (100) | 0.0 (10.48) | 62 (100) | 0.9 (11.13) | 0.6453 |
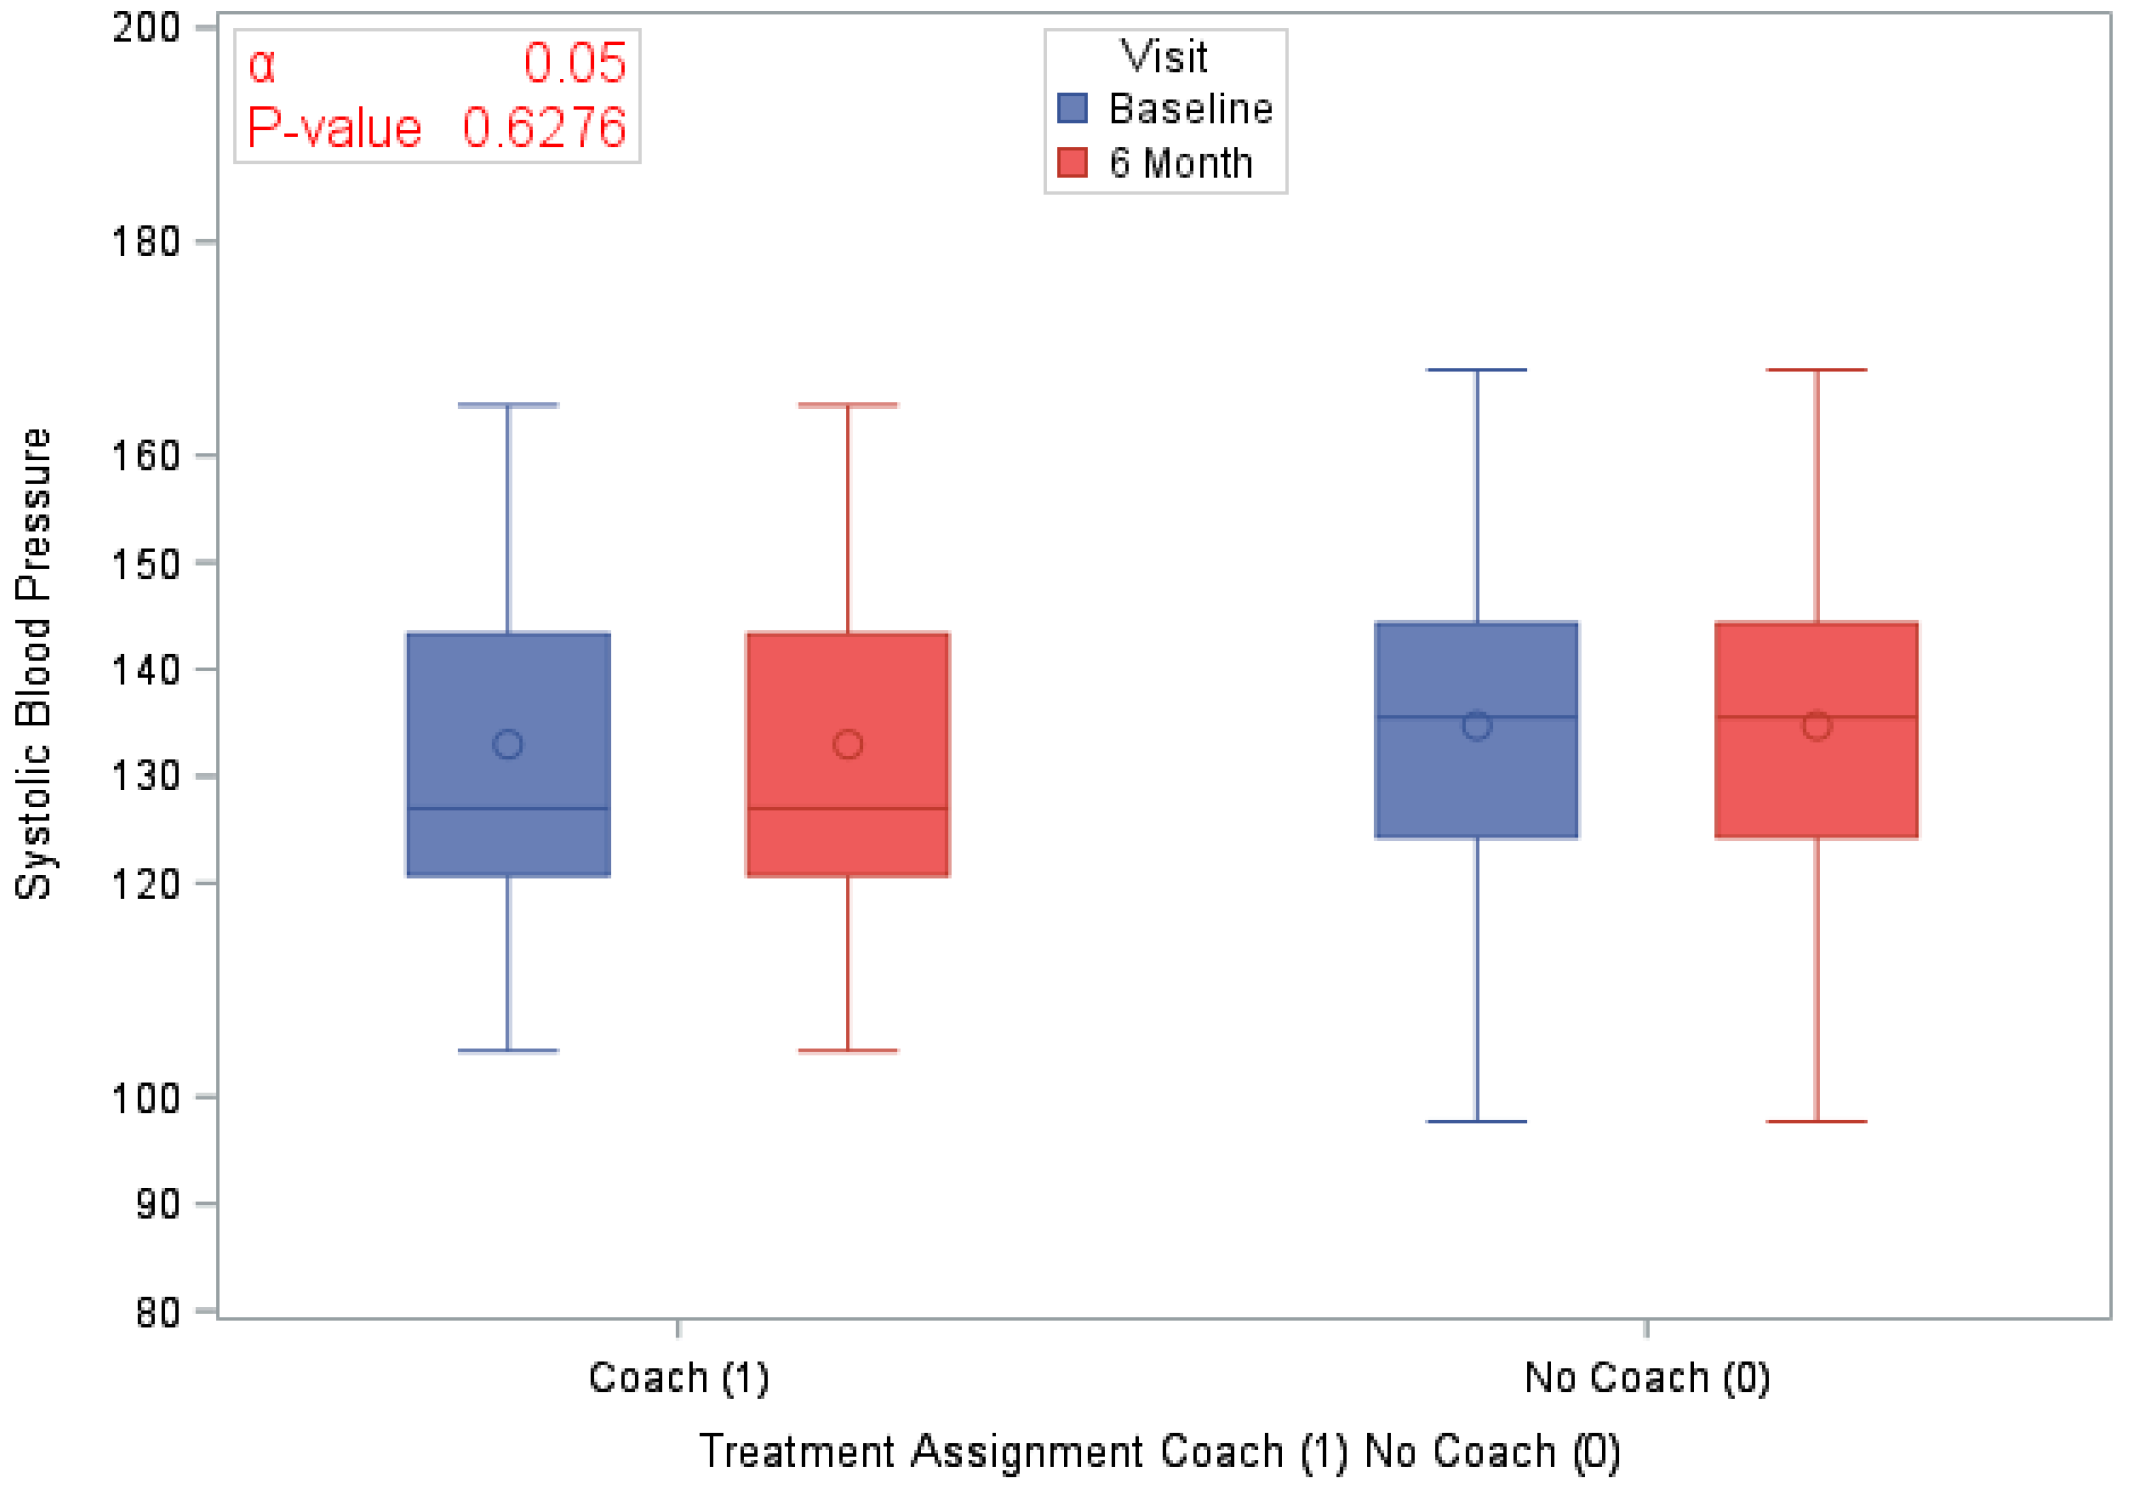
| Average Systolic BP at Baseline | 120 (100) | 133.9 (16.27) | 58 (100) | 133 (16.88) | 62 (100) | 134.7 (15.77) | 0.5526 |
| Average Systolic BP at 6 months | 120 (100) | 131.5 (18.67) | 58 (100) | 129.7 (17.31) | 62 (100) | 133.1 (19.86) | 0.3230 |
| Difference in Systolic BP at 6 months | 120 (100) | −2.4 (18.47) | 58 (100) | 20.13 (62) | 62 (100) | −1.6 (16.91) | 0.6276 |
| Cholesterol (mg/dL) | |||||||
| High cholesterol at Baseline | 79 (65.83) | - | 42 (72.41) | - | 37 (59.68) | - | 0.1434 |
| Blood Sugar (mg/dL) | |||||||
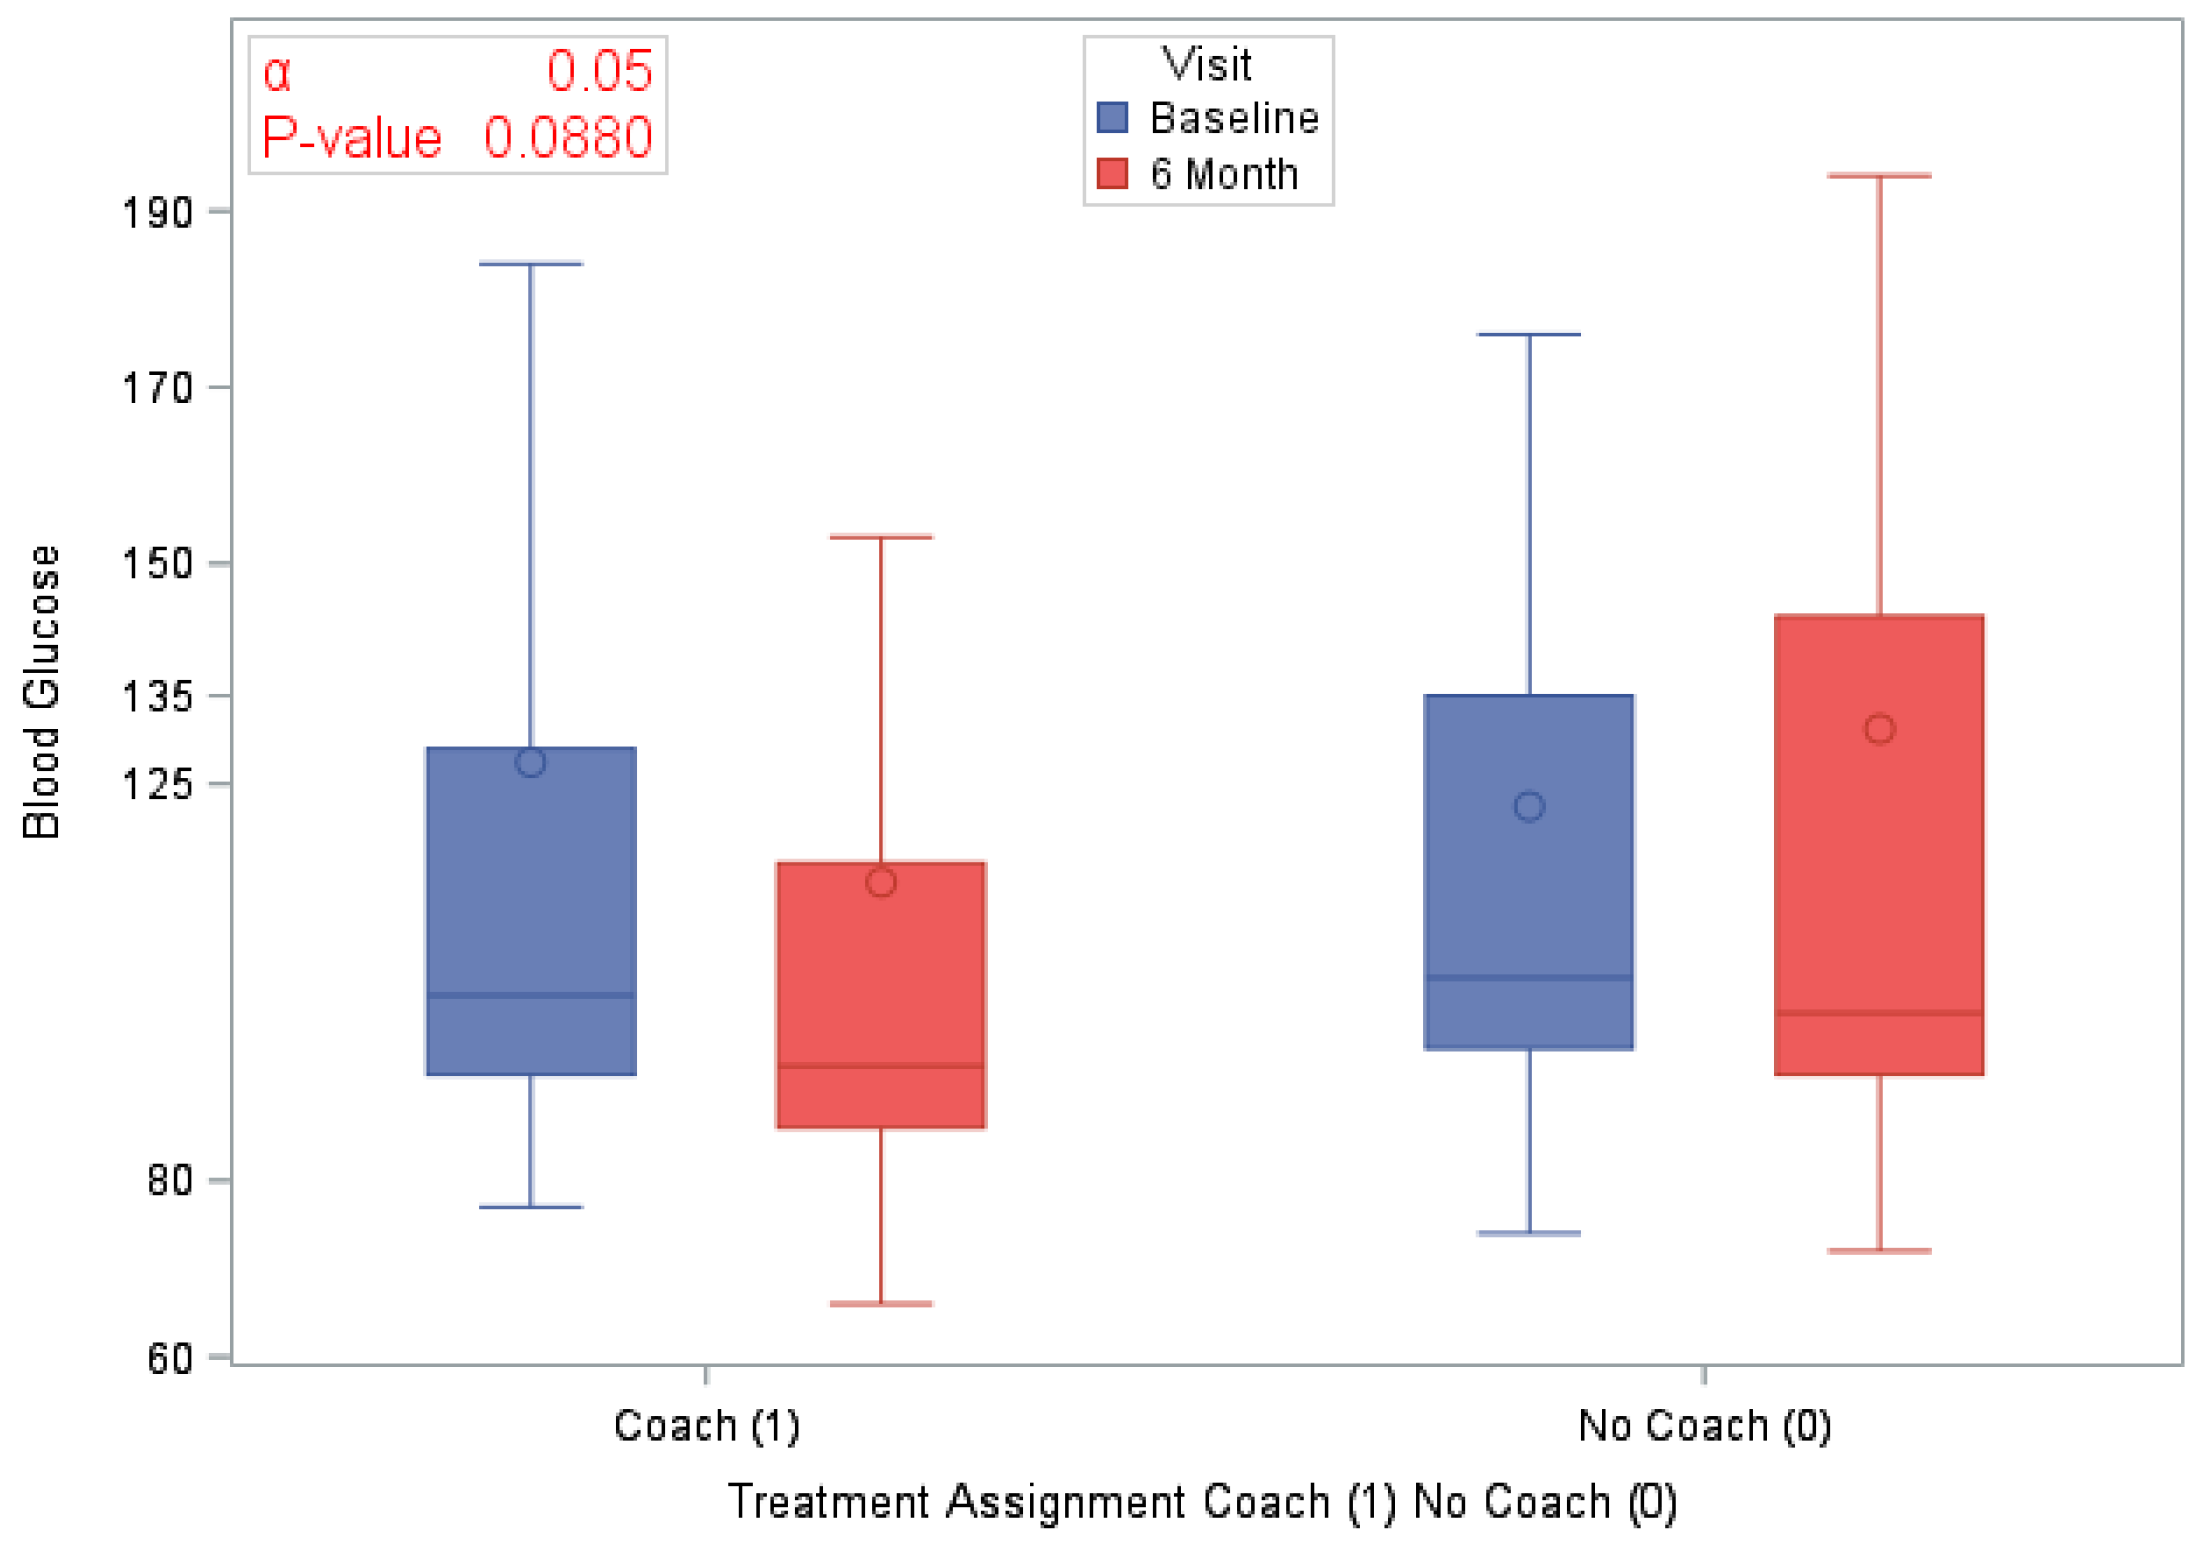
| Glucose at Baseline | 120 (100) | 124.9 (60.25) | 58 (100) | 127.4 (72.77) | 62 (100) | 122.5 (46.05) | 0.6503 |
| Glucose at 6 months | 120 (100) | 122.8 (65.37) | 58 (100) | 113.8 (48.82) | 62 (100) | 131.2 (77.2) | 0.1575 |
| Difference in Blood Glucose at 6 months | 120 (100) | −2.0 (66.46) | 58 (100) | −13.6 (61.31) | 62 (100) | 8.8 (69.71) | 0.0880 |
| Physical Activity (min) | |||||||
| Time spent in moderate exercise at Baseline | 120 (100) | 140.4 (175.19) | 58 (100) | 142.8 (206.8) | 62 (100) | 138.1 (140.95) | 0.8818 |
| Time spent in moderate exercise at 6 months | 120 (100) | 271.4 (685.57) | 58 (100) | 349.9 (930.47) | 62 (100) | 197.9 (310.72) | 0.2695 |
| BMI (kg/m2) | |||||||
| BMI at Baseline | 120 (100) | 35.4 (7.64) | 58 (100) | 34.6 (7.73) | 62 (100) | 36.1 (7.56) | 0.2876 |
| BMI at 6 months | 120 (100) | 35.2 (8.43) | 58 (100) | 34.0 (8.29) | 62 (100) | 36.3 (8.48) | 0.4497 |
| Difference in BMI at 6 months | 120 (100) | −0.2 (29.92) | 58 (100) | −0.6 (2.31) | 62 (100) | 0.2 (3.37) | 0.1601 |
| (a) | ||||||
| Variables | Outcome: LS7 as a Continuous Variable at 6 Months | |||||
| Treatment Assignment Coach vs. No Coach | Sex Male (1) Female (0) | Census Tract at Risk (1) Resilient (2) None of the Above (3) | Estimate | Standard Error | p-Value | |
| Treatment Assignment | Coaching | −0.5210 | 0.3631 | 0.1548 | ||
| Sex | Female | −0.3498 | 0.2964 | 0.2411 | ||
| Treatment × Area | Coaching | At risk (1) | 1.1269 | 0.5498 | 0.0433 | |
| Median lapsed time between sessions | −0.00002 | 8.599 × 10⁻⁶ | 0.0357 | |||
| (b) | ||||||
| Variables | Outcome: BMI as a Continuous Variable at 6 Months | |||||
| Treatment Assignment Coach (1) No Coach (0 | Sex Male (1) Female (0) | Census Tract at Risk (1) Resilient (2) None of the Above (3) | Estimate | Standard Error | p-Value | |
| Treatment Assignment | Coaching | −0.1896 | 0.6124 | 0.7576 | ||
| Sex | Female | −1.6234 | 0.6299 | 0.0116 | ||
| LS7 | 0.1399 | 0.2228 | 0.5315 | |||
| Median Lapsed Time Between Sessions | 0.00034 | 0.000019 | 0.0729 | |||
| (c) | ||||||
| Variables | Outcome: DBP at 6 Months | |||||
| Treatment Assignment Coach vs. No Coach | Sex Male (1) Female (0) | Census Tract at Risk (1) Resilient (2) None of the Above (3) | Estimate | Standard Error | p-Value | |
| Treatment Assignment | Coaching (1) | 0.7444 | 1.885 | 0.6944 | ||
| Sex | Female (0) | −4.0721 | 1.9622 | 0.0409 | ||
| Glucose | −0.01825 | 0.01536 | 0.2379 | |||
| Area | Resilient (2) vs At Risk | 15.4863 | 8.4346 | 0.0697 | ||
| None of the above vs At Risk | 26.6194 | 16.3022 | 0.1061 | |||
| Median Lapsed Time Between Sessions | 0.000109 | 0.000057 | 0.0603 | |||
| Binary Primary Outcomes | Odds Ratio | 95% Cis | p-Value | |
|---|---|---|---|---|
| Coach vs. No Coach groups comparison in Improvement (yes/no) in BP at 6 months | 1.834 | 0.701 | 4.798 | 0.2135 |
| Females vs. Males comparison of Improvement (yes/no) in BP at 6 months | 2.394 | 0.853 | 6.716 | 0.0963 |
| Coach vs. No Coach groups comparison in Improvement (yes/no) in LS7 at 6 months | 1.047 | 0.411 | 2.667 | 0.9226 |
| Females vs. Males comparison of Improvement (yes/no) in LS7 at 6 months | 0.574 | 0.214 | 1.542 | 0.2676 |
| Coach vs. No Coach groups comparison in Improvement (yes/no) in BG at 6 months | 1.078 | 0.417 | 2.787 | 0.8754 |
| Females vs. Males comparison of Improvement (yes/no) in BG at 6 months | 0.457 | 0.157 | 1.330 | 0.1487 |
| Coach vs. No Coach groups comparison in Improvement (yes/no) in BMI at 6 months | 0.482 | 0.195 | 1.188 | 0.1113 |
| Females vs. Males comparison of Improvement (yes/no) in BMI at 6 months | 2.119 | 0.822 | 5.466 | 0.1187 |
Publisher’s Note: MDPI stays neutral with regard to jurisdictional claims in published maps and institutional affiliations. |
© 2021 by the authors. Licensee MDPI, Basel, Switzerland. This article is an open access article distributed under the terms and conditions of the Creative Commons Attribution (CC BY) license (https://creativecommons.org/licenses/by/4.0/).
Share and Cite
Washington-Plaskett, T.; Idris, M.Y.; Mubasher, M.; Ko, Y.-A.; Islam, S.J.; Dunbar, S.; Taylor, H.; Quyyumi, A.A.; Pemu, P. Impact of Technology-Based Intervention for Improving Self-Management Behaviors in Black Adults with Poor Cardiovascular Health: A Randomized Control Trial. Int. J. Environ. Res. Public Health 2021, 18, 3660. https://doi.org/10.3390/ijerph18073660
Washington-Plaskett T, Idris MY, Mubasher M, Ko Y-A, Islam SJ, Dunbar S, Taylor H, Quyyumi AA, Pemu P. Impact of Technology-Based Intervention for Improving Self-Management Behaviors in Black Adults with Poor Cardiovascular Health: A Randomized Control Trial. International Journal of Environmental Research and Public Health. 2021; 18(7):3660. https://doi.org/10.3390/ijerph18073660
Chicago/Turabian StyleWashington-Plaskett, Tulani, Muhammed Y. Idris, Mohamed Mubasher, Yi-An Ko, Shabatun Jamila Islam, Sandra Dunbar, Herman Taylor, Arshed Ali Quyyumi, and Priscilla Pemu. 2021. "Impact of Technology-Based Intervention for Improving Self-Management Behaviors in Black Adults with Poor Cardiovascular Health: A Randomized Control Trial" International Journal of Environmental Research and Public Health 18, no. 7: 3660. https://doi.org/10.3390/ijerph18073660
APA StyleWashington-Plaskett, T., Idris, M. Y., Mubasher, M., Ko, Y.-A., Islam, S. J., Dunbar, S., Taylor, H., Quyyumi, A. A., & Pemu, P. (2021). Impact of Technology-Based Intervention for Improving Self-Management Behaviors in Black Adults with Poor Cardiovascular Health: A Randomized Control Trial. International Journal of Environmental Research and Public Health, 18(7), 3660. https://doi.org/10.3390/ijerph18073660