Article

Nasal Morphology and Its Correlation to Craniofacial Morphology in Lateral Cephalometric Analysis

by
Agnieszka Jankowska
1,
Joanna Janiszewska-Olszowska
2,* and
Katarzyna Grocholewicz
2
1
Private Practice “Dental Clinic Jankowscy”, 68-200 Żary, Poland
2
Department of Interdisciplinary Dentistry, Pomeranian Medical University in Szczecin, 70-111 Szczecin, Poland
*
Author to whom correspondence should be addressed.
Int. J. Environ. Res. Public Health 2021, 18(6), 3064; https://doi.org/10.3390/ijerph18063064
Submission received: 23 February 2021 / Revised: 10 March 2021 / Accepted: 11 March 2021 / Published: 16 March 2021

Abstract

:
Nose shape, size, and inclination influence facial appearance, but few studies concern the relationship between the nasal profile and craniofacial structures. The objective of this study was to analyze association of nasal cephalometric variables with skeletal structures, age, and sex. Cephalometric and nasal analysis was performed in 386 Polish orthodontic patients (aged 9–25 years). Student t-test and Mann–Whitney test were used to compare quantitative variables and Pearson’s or Spearman’s correlation coefficients—to find correlations. Soft tissue facial convexity angle correlates to Holdaway ratio, ANB (A-Nasion-B), and Wits appraisal. Nasal dorsum axis, nose length, nose depth (1) and nose depth (2), nose hump, lower dorsum convexity, and columella convexity increase with age. Nasal base angle, nasolabial angle, nasomental angle, soft tissue facial convexity and nasal bone angle decrease with age. Nasal base angle and nasomental angle are smaller in females. Thus, a relationship exists between nasal morphology and sagittal jaw configuration. Nasal parameters significantly change with age. Sexual dimorphism characterizes nasal bone angle and nasomental angle.

1. Introduction

The nose constitutes the most prominent part of the profile and occupies the most visible position in the face. It has a great influence on facial appearance and profile [1,2,3,4,5]. Thus, nasal balance and harmony are very important. Noses come in various sizes and shapes: upturned or straight, with or without a hump. Similarly, as a facial profile, the nasal dorsum can be classified as: straight, convex, or concave [6].
The nose, lips, and chin create facial harmony. The ideal nasal proportion requires a straight nasal dorsum with the dorsal cartilage and nasal tip cartilage above the nasal tip, forming the supratip break, and the alar rims 1–2 mm superior to the columella in the lateral view [2,4,5,7]. The main difference between an attractive and a below-average woman’s face is not in the proportion qualities of the nose, but in the relationship of the nasal and craniofacial measurements [5]. Moreover, the concept of an ideal nose is different among races, sexes, and ethnic groups [1,4]. Typical racial and ethnic differences in nasal morphology refer to the width, protrusion, and inclination of the longitudinal axis of the nostrils [5].
The nose shape in the cephalometric soft tissue profile is described by the nasolabial angle (NLA). By some authors, it is considered an excellent clinical and cephalometric parameter to reveal the anteroposterior position of the maxilla [1,8]. The NLA has two components: the inclination of the upper lip (lower nasolabial angle) and the upward nasal tip inclination (upper nasolabial angle) [1,9]. The inclination of the upper lip has a strong correlation with the amount of retraction of upper incisors, but nasal tip inclination has no correlation with incisor retraction [1,9,10]. Lo and Hunter [9] divided the NLA angle into its two contributing angles. (1) Nasal upward tip angle—the angle formed when the posterior columella point (PCm) (the most posterior point of the lower border of the nose) tangent is extended anteriorly to intersect with the Frankfurt horizontal plane/lower border of the nose to the Frankfurt horizontal plane; (2) the upper lip inclination—the angle formed by the PCm-Ls (labrale superius) line with the Frankfurt horizontal plane/inclination of the upper lip to the Frankfurt horizontal plane [1].
Previous studies evaluated the relationship between the nasal upward tip angle and vertical maxillary skeletal pattern. It was found that if an adult patient presents with an upturned nose, it might indicate that the maxillary plane is tipped anticlockwise [1]. Robinson et al. [6] analyzed lateral radiographs and proved that nasal shape followed the underlying skeletal pattern. Contrary results were obtained by Fitzgerald et al. [10], who found no correlation between soft tissue and skeletal measurements in the well-balanced profile.
Morphology of the nose shows a correlation with skeletal Classes. A pronounced elevation of the nasal dorsum and projection of the nasal bone is found in Class II subjects [6,11,12,13,14]. Class III subjects tend to have a concave dorsum and Class I subjects—a straight dorsum of the nose [12]. No relationship was found between the amount of nasal development and skeletal Class, the growth of the nose observed was relatively independent of the underlying skeletal hard tissue (skeletal Classes) [15].
Previous investigators stated that shape and size of the nose, and its inclination, have a significant influence on the orthodontic treatments plan. Excessive nasal growth in conjunction with extractions would probably have resulted in additional lip flattening and contributed directly to a poorly balanced profile [14]. Thus, orthodontic diagnosis and treatment planning should include nose evaluation and prediction of changes in facial aesthetics in a cumulative effect of the growth, development, and treatment [16].
Few studies have been found concerning the relationship between nasal profile and craniofacial structures. Thus, the purpose of this study was to analyze (1) correlations between nasal parameters and craniofacial skeletal structures; (2) correlations of nasal parameters with age (growth); and (3) sexual dimorphism of nasal parameters.

2. Materials and Methods

This study has been exempt from ethical approval, based on a written reply from the ethical commission. Sample size has been verified using an online power and sample size calculator (statisticalsolutions.net) assuming power of 0.8, level of significance at 0.05, and effect size equal to that calculated from a subsample of 100 patients.
After obtaining permission, 386 cephalograms of orthodontic patients aged 9–25 years were selected from the records of the Department of Radiology Pomeranian Medical University in Szczecin, based on the following criteria:
-
Caucasian origin;
-
Age 9–25 years;
-
Good visibility of all cephalometric and nasal structures;
-
Natural head position, the teeth occluded in the maximum intercuspation, relaxed lips;
-
No craniofacial deformities;
-
No fixed braces present at the time of the cephalogram.
Cephalometric analysis, according to Segner and Hasund [17], was performed by the first author using a specialized computer software (Ortodoncja 8.0, Ortobajt, Wrocław, Poland). Analysis of nasal morphology was made according to Gulsen et al. [
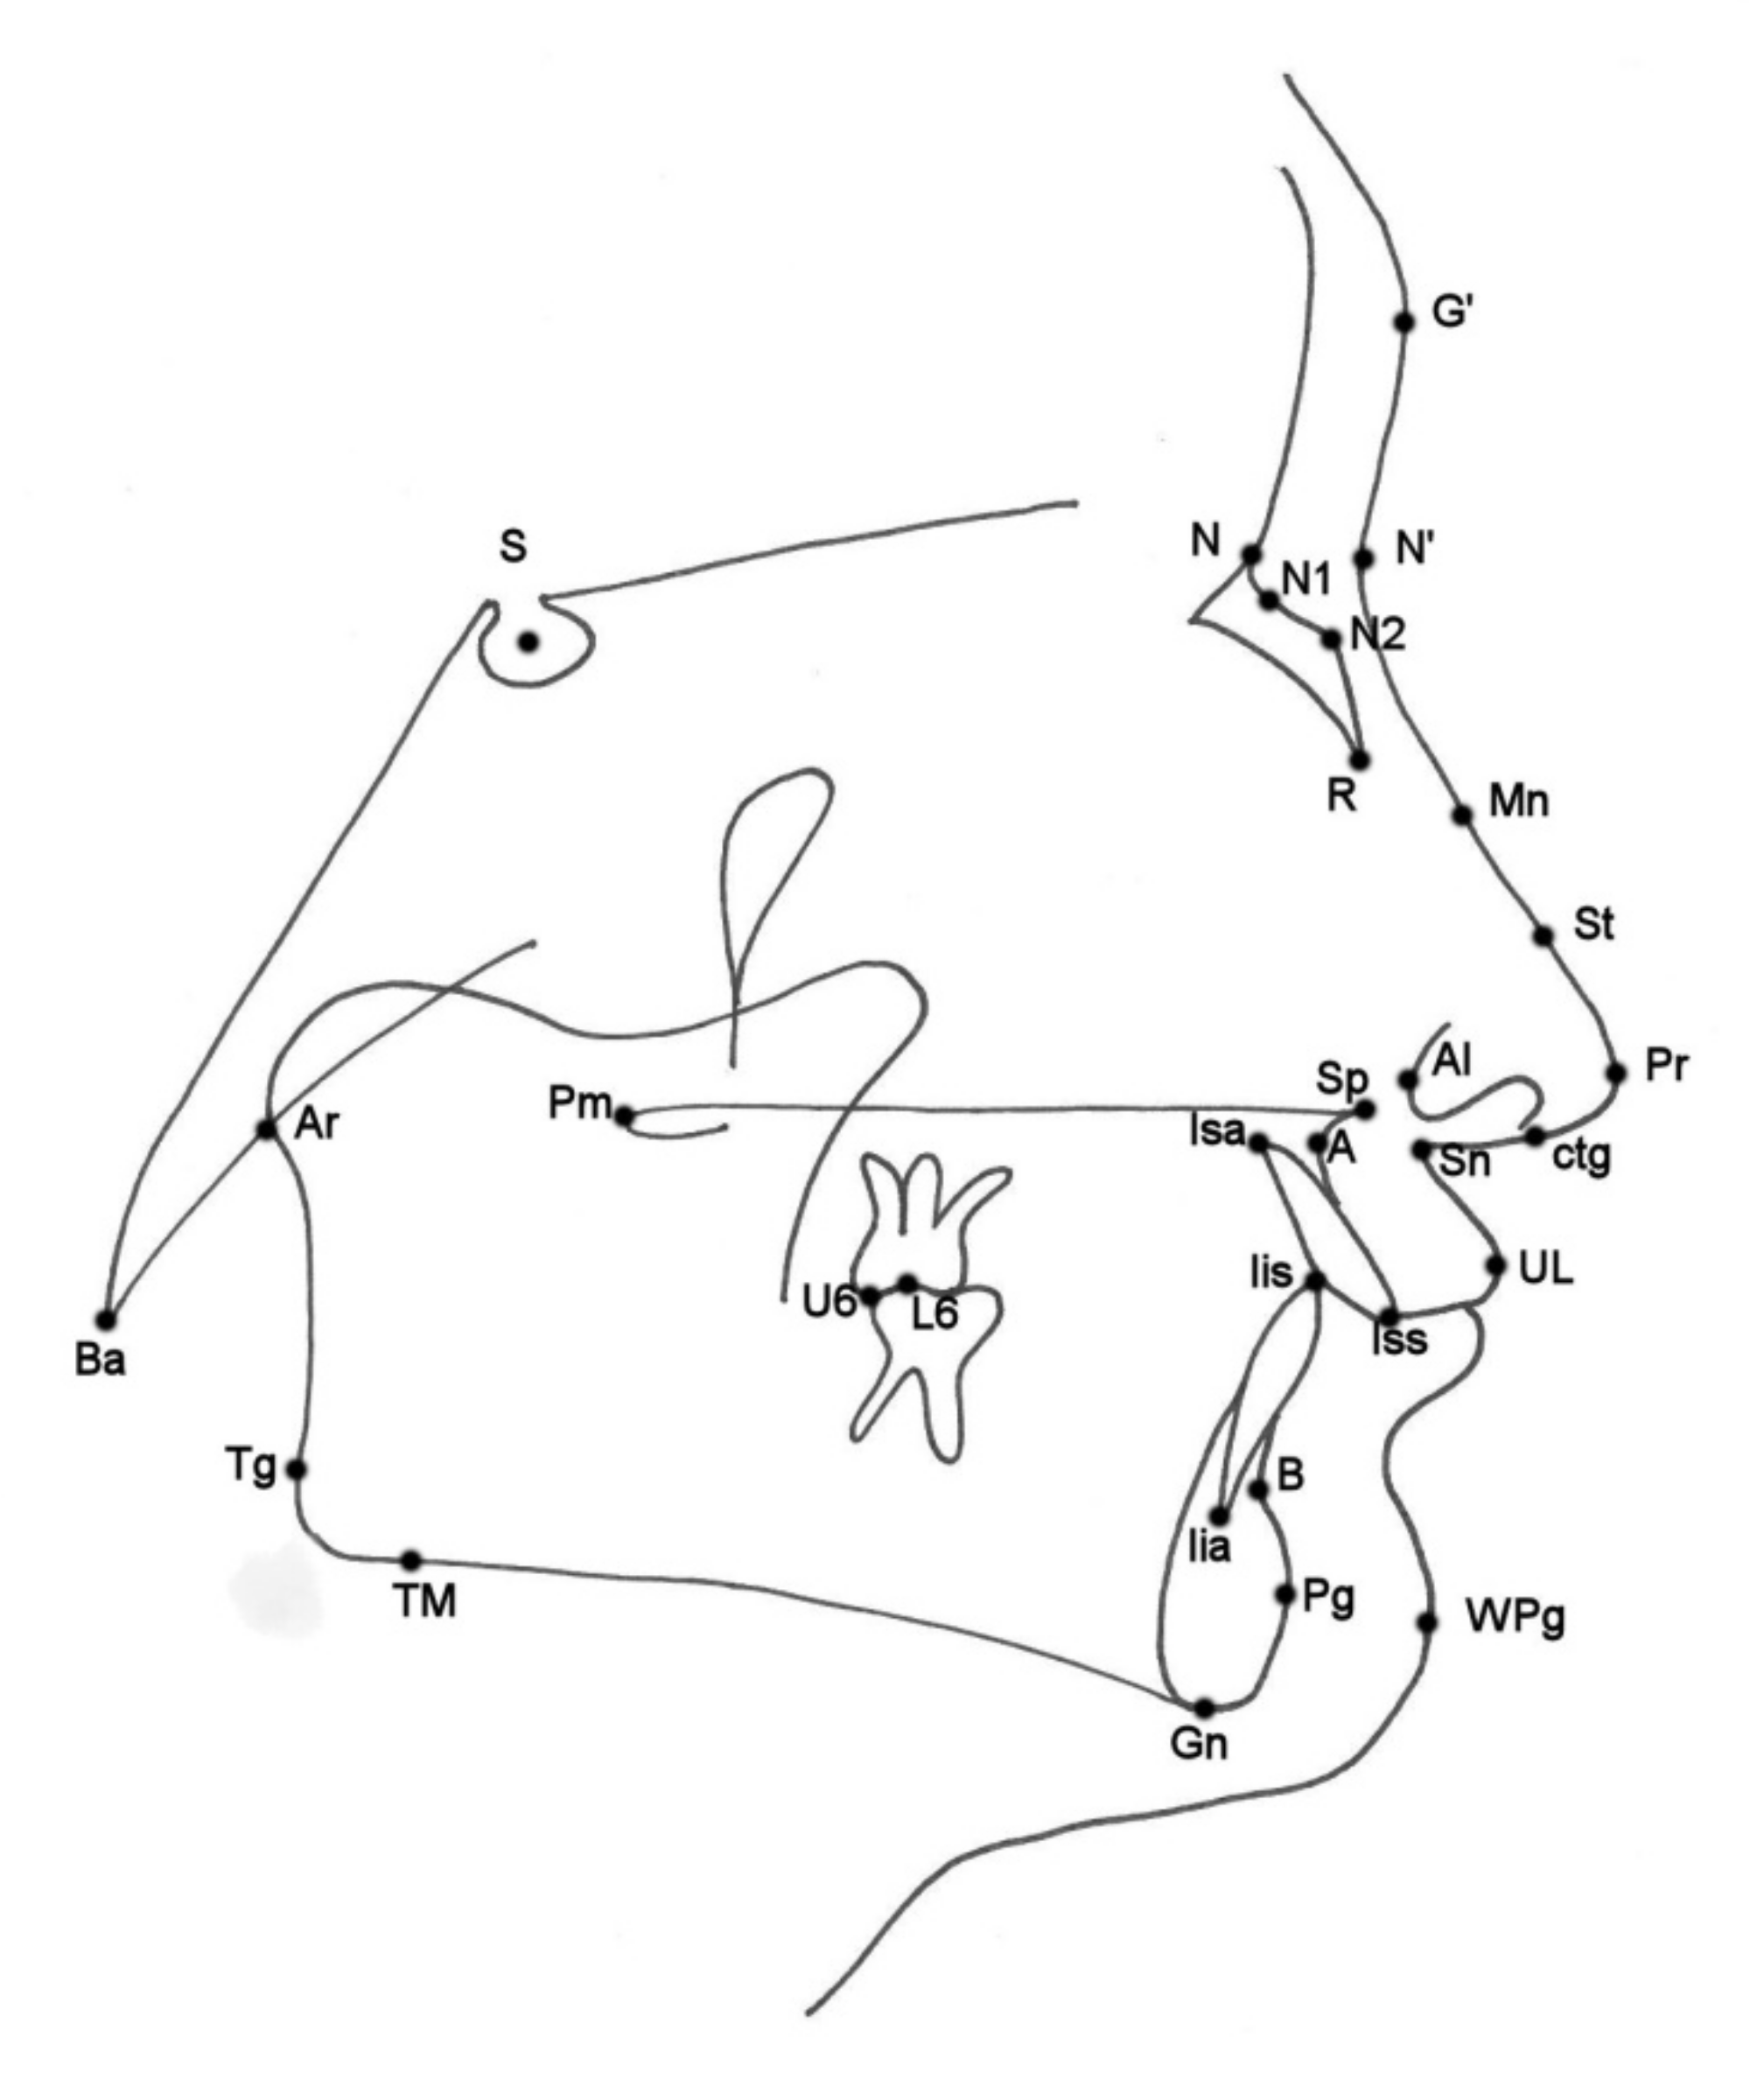
4] on acetate paper using a 0.5-mm pencil. The nasal and cephalometric landmarks used are presented in Figure 1 and described in Table 1. All cephalometric variables used are listed and described in Table 2.
Cephalometric and nasal analysis was repeated six months later, by the same investigator, in 100 randomly selected cephalograms. Repeatability of measurements was assessed using one-sided Wilcoxon test. The level of clinical significance has been set at 5 degrees for angular measurements and 2 mm for linear measurements.
Statistical analysis was performed using R software, version 4.0.3 [18]. Data distribution normality was assessed using Shapiro–Wilk test. The level of significance was established at p = 0.05. Comparisons of quantitative variables between the groups were made using Student t-test (for data of normal distribution) or Mann–Whitney test (otherwise). Correlations between quantitative variables were assessed using Pearson’s correlation coefficient (for data of normal distribution) or Spearman’s correlation coefficient (otherwise). The power of correlation was assessed according to the following schema [19]:
|r| ≥ 0.9—very strong;
0.7 ≤ |r| < 0.9—strong;
0.5 ≤ |r| < 0.7—moderate;
0.3 ≤ |r| < 0.5—weak;
|r| < 0.3—very weak.

3. Results

Sample size verification revealed that for the correlation coefficient between the SFC (Soft tissue facial convexity) angle and the H (Holdaway ratio) angle (0.763) a sample size of 11 subjects would be sufficient to show the significance, for the correlation coefficient between the NMA (nasomental angle) angle and the H angle (−0.517) the sample size yielded 37 and for the correlation coefficient between the NLA angle and the ANB (a point to B point angle) angle (0.247) 327 subjects would be sufficient to show the significance.
Wilcoxon one-sided test for repeated measurements revealed no differences between repeated measurements exceeding the level of clinical significance (5 degrees for angular measurements and 2 mm for linear measurements) for hump, NBA (nasal base angle), NMA, SFC. For N’–St (the axis of dorsum) and N’–Pr (nasal length) it was 1%, for nose depth (1) and NBoneA (nasal bone angle) it was 2%, for nose depth (2): 3%. For 1+:NA (°) (upper incisor angle) and 1−:NB (°) (Lower incisor angle) it was 4%, for 1+:NA (mm) and NBoneL (nasal bone length) it was 5%. For Pg:NB [mm] it was 6%. The highest percentage of discordant measurements (11%) was noted for the position of the lower incisors (1−:NB) (mm).
Characteristics of the study group, according to age, sex, and skeletal Class are presented in Table 3. Analysis of the data distribution normality are presented in Table 4. Cephalometric and nasal values of the study group are presented in Table 5.
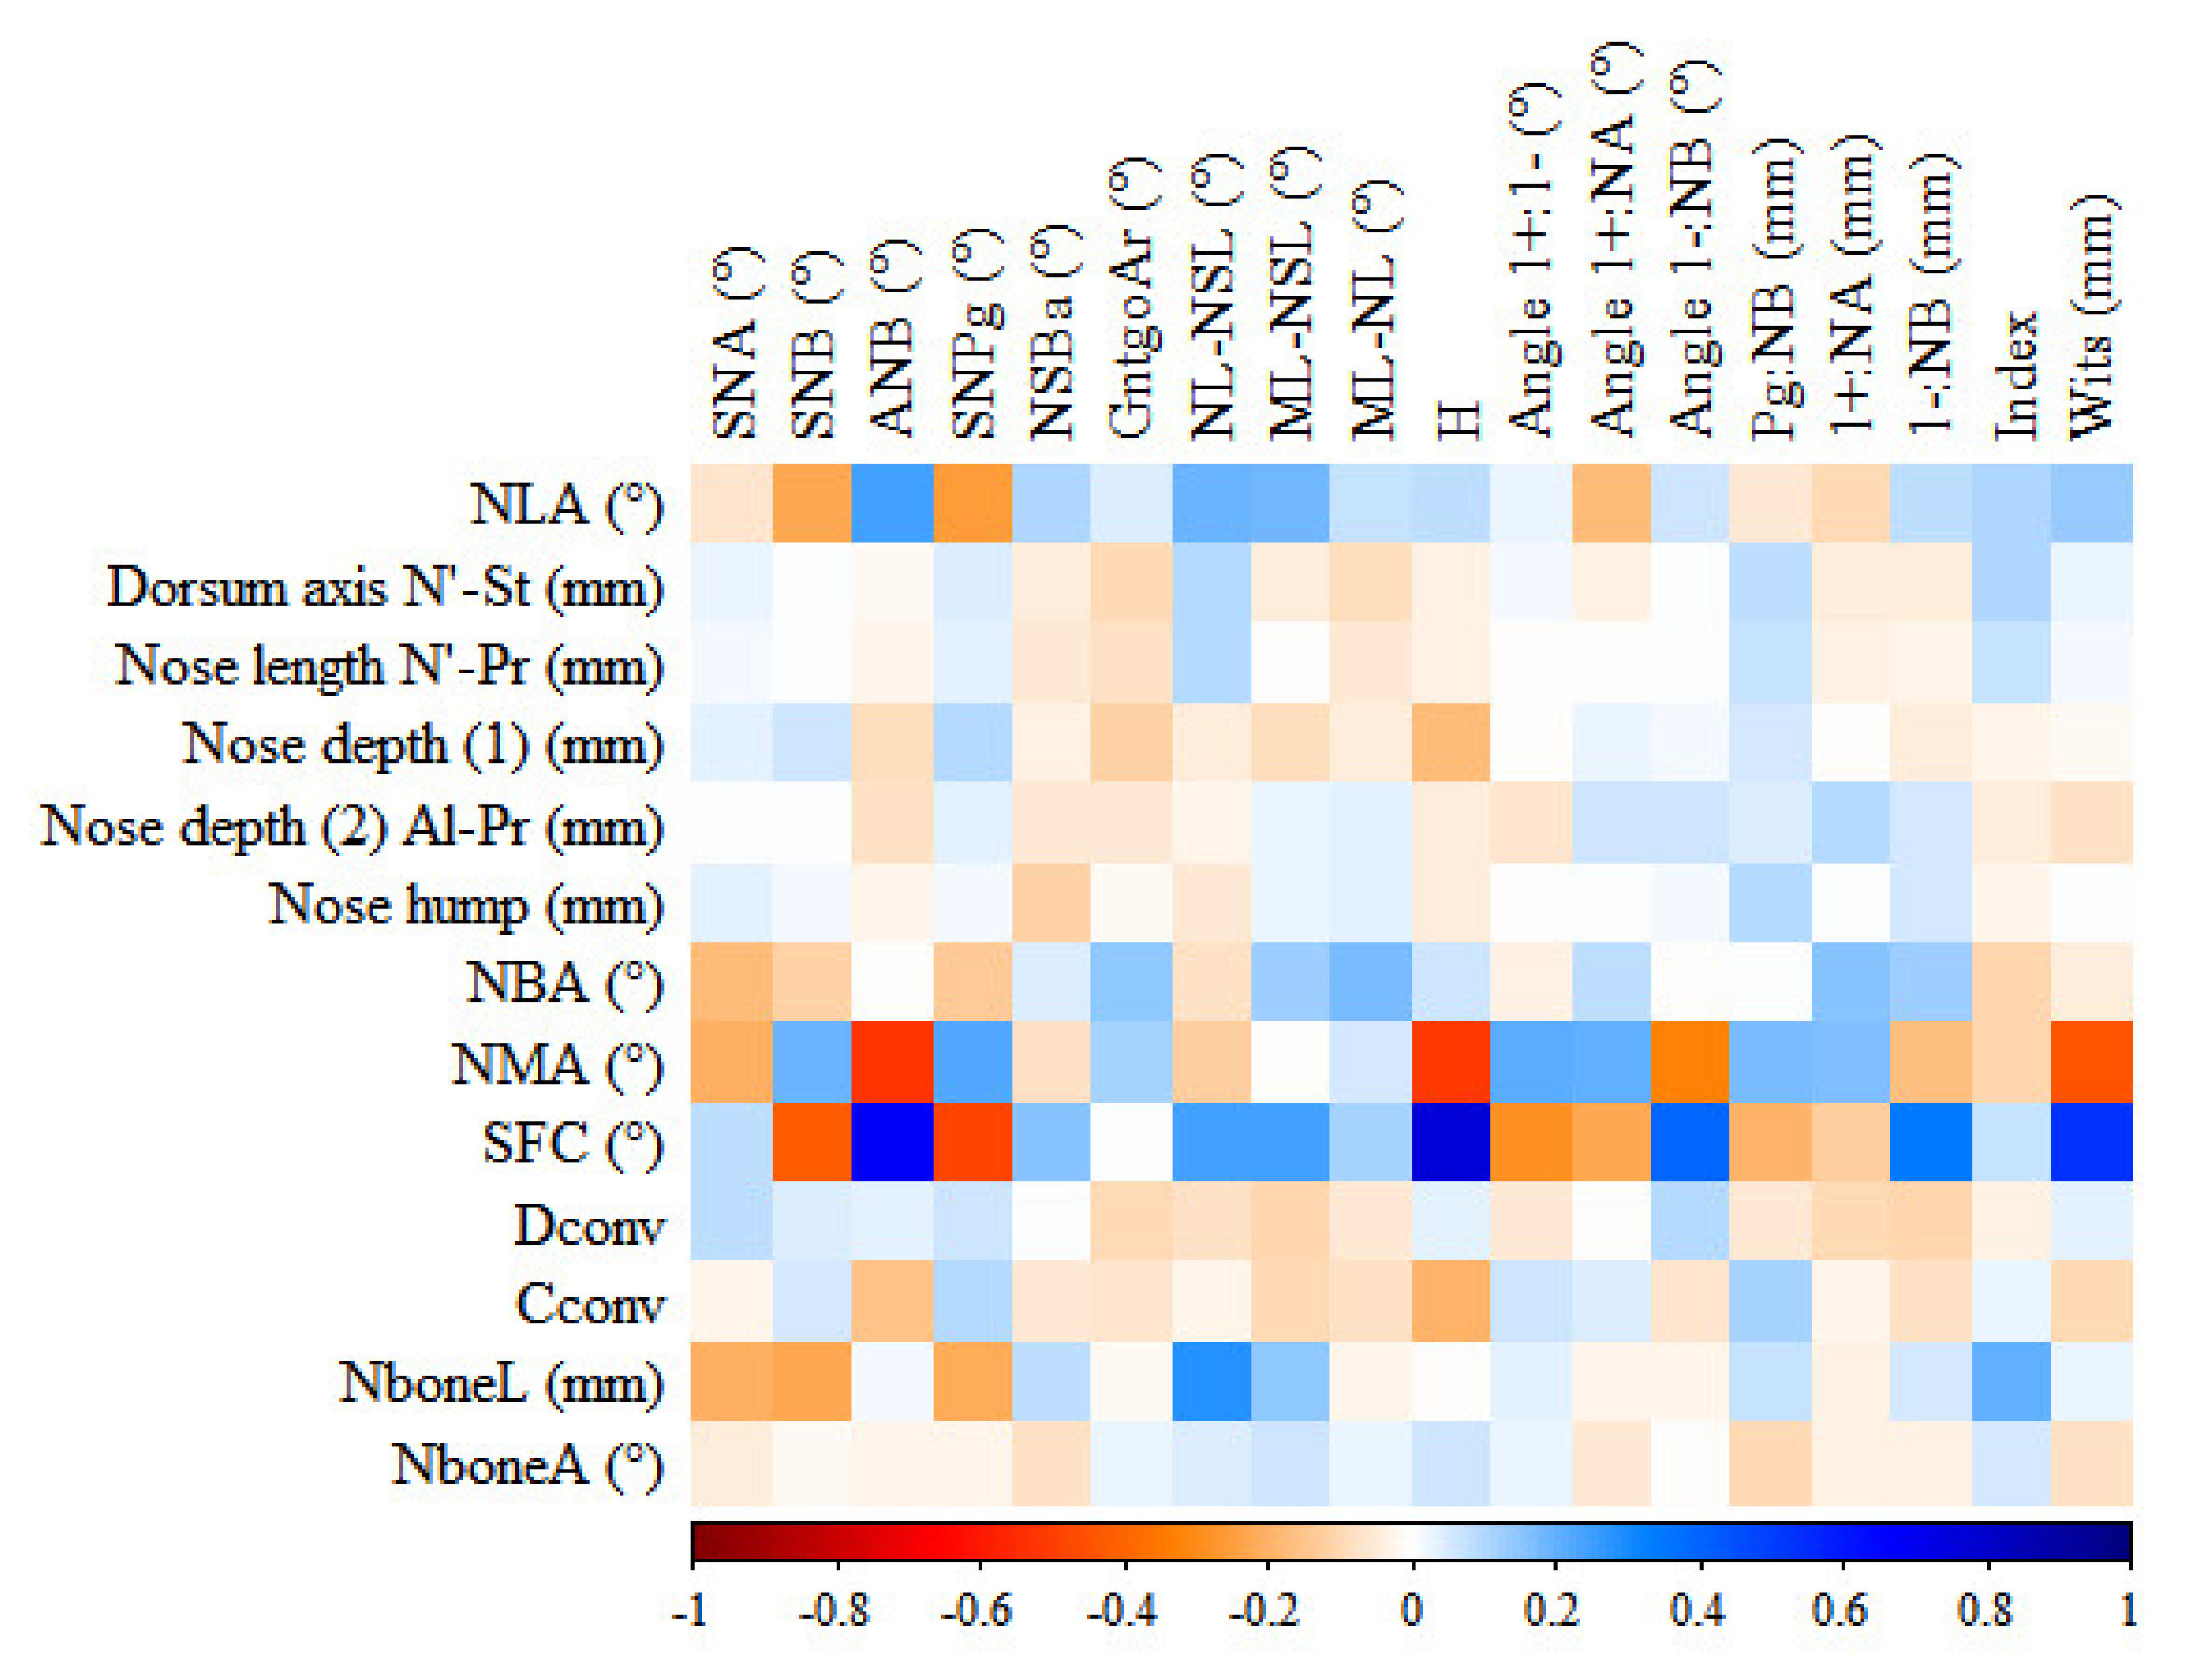
The matrix of correlations between nasal and cephalometric variables is presented in Figure 2. The blue area shows strong positive correlation, the red area shows strong negative correlation. SFC angle shows the strongest correlations with Holdaway ratio (H), sagittal angle between maxilla and mandible (ANB), and Wits appraisal (Wits).
In the study group, a weak positive correlation with age was found for the following nasal parameters: dorsum axis, nose length, nose depth (1), nose depth (2), and a very weak positive for: nose hump (Hump), lower dorsum convexity (Dconv), columella convexity (Cconv). No correlation with age was stated for nasal bone length (NboneL). A weak negative correlation with age was found for NBA and a very weak negative correlation for: NLA, NMA, soft tissue facial convexity (SFC), and nasal bone angle (NboneA).
Significant differences were found between the sexes. Table 5 shows distribution of the study group according to nasal and cephalometric values referring to sex. Nasal base angle (NBA) and nasomental angle (NMA) were significantly smaller in females (p < 0.05). The average NLA is 113.32 ± 10.4 in females and 112.64 ± 13.34 in males, no significant differences were found between the sexes.

4. Discussion

Knowledge on correlations between the nasal parameters and the skeletal structures may help orthodontists and maxillofacial surgeons in diagnosing and treatment planning, for example the nose depth (1) and (2), nasal length, SFC, NMA, NBA, and hump determine the size and shape of the nose, whereas NLA angle is considered during the extraction treatment decision. The size of the patient’s nose is important for maxillofacial surgeons as they influence the occlusion as well as the profile of the patient’s face.
In the present study, the SFC angle showed a statistically significant positive correlation to H, ANB, and Wits, in accordance with the studies by Arshad et al. [2] as well as by Gulsen et al. [4], indicating a correlation to skeletal Classes. The SFC showed a weak negative correlation to SNB angle (Sella-Nasion to point B angle) (mandibular position), in agreement with the study by Gulsen et al. [4]. The very weak negative correlation between nasal bone length and SNA angle (maxillary position) confirms previous findings by Gulsen et al. [4] as well.
The negative correlation of the NMA angle to H, ANB, and Wits is in agreement with the results by Arshad et al. [2] as well as by Gulsen et al. [4]. The NMA angle is related to the skeletal Classes, to the upper and lower incisor inclination, to the maxillary and mandibular positions, as well as to maxillary inclination. Gulsen et al. [4] have found a significant correlation between the NMA angle and mandibular and maxillary position. In the study by Taha and Ahmed [20], the NMA angle was significantly higher in skeletal Class III compared to Class I and II.
The lack of statistically significant correlation between the Hump and skeletal Class is contrary to findings reported by Chaconas [13], who reported that Class II subjects proved to have a more pronounced nose hump, whereas Class I subjects tended to have a straighter nose [13].
The positive correlation between NLA angle and ANB angle (although very weak) is in accordance with the study by Gulsen et al. [4], but it is contrary to the results by Arshad et al. [2], as well as those by Taha and Ahmed [20]. A possible reason for this discordance may be the sizes of the study groups, e.g., insufficient number of subjects to determine statistical significance of a week correlation: Arshad et al. [2] (119 subjects), Taha and Ahmed [20] (90 subjects), Gulsen et al. [4] (262 subjects), present study (386 subjects). No significant differences concerning NLA angle were found between patients with skeletal Class I and other skeletal patterns (Class II/1, Class II/2, Class III) [21]. The very weak negative correlation between NLA and SNB (mandibular position) angles in the present study is consistent with the results by Gulsen et al. [4]. A positive correlation was found in the present investigation between NLA and mandibular inclination also increased, in accordance with the study by Gulsen et al. [4] on patients with a history of orthodontic treatment. However contrary to this are the findings by Nehra and Sharma [1], who reported no significant correlation. The reason could be that the study group was 190 Indian adults, who had undergone orthodontic treatment [1]. Burstone [8] reported that increased NLA indicated a maxillary retrusion and decreased—a maxillary protrusion. Contrary conclusions have been drawn by Gulsen et al. [4], who did not find any correlations between NLA and maxillary position, similarly as the present study.
Concerning nasal growth, the dorsum shape changes, especially during adolescence (between ages 10 and 14) and the hump of the nose appears during the adolescence period and is associated with positional changes of the nasal bone [11,22,23]. The nasal dorsum consists of upper and lower part. The angulation of the lower part of is closely associated with vertical growth changes of the tip of the nose [11].
Nasal development is almost completed in females by the age of 16 and in males by the age of 18 [1,3,12,22,23]. However, Meng et al. [3] stated that nasal growth in males continues above the age of 18. Nevertheless, most of the soft tissue development in women ceases at the age of 12 and in men—17 [15].
The nose is responsible for the total increase in soft tissue profile convexity with age [12,13]. The nose grows forward and downward and continues during maturation [2,3,12,13,22,23,24]. Compositely, this tendency increases nose prominence relatively to the facial profile [13,14,15,22,24,25,26]. However, female subjects have a smaller increase in nose depth than male subjects [3,12].
After the age of 14 years, the tip of the nose does not grow forward to the same extent as does the nasal bone and this results in nasal dorsum straightening or humping [22]. Subsequently nasal bone length is approximately 40–45 per cent of the total length of the nose [24]. In both sexes, the increase of growth in vertical dimension is much greater than the increase in anteroposterior dimension [24]. Interestingly, it was stated, that nasal growth occurred in all patients during orthodontic therapy, including those in whom skeletal growth had declined [14]. Nasal imbalance was intensified during orthodontic treatment [14].
During growth, soft tissue facial profile, excluding the nose, tends to remain relatively stable in its degree of convexity. However, when the nose is included in profile evaluation, the convexity of the soft tissue profile increases markedly with growth [12,15,23]. The present study is in agreement with these findings. Angular shapes and positional relationship of the nose, lips, and chin remain relatively constant throughout the developmental period for both sexes [15].
The increase of nose depth with age found is consistent with the study by Meng et al. [3], who proved that upper and lower nose height, as well as nose depth, showed most growth between 7 and 16 years, and females are characterized by a smaller increase in nose depth. Similar results were reported by Kumar et al. [27]. Moreover, nasal growth in men continued longer, after the age of 18 [3,13].
The increase of nasal dorsum with age is in agreement with the findings by Buschang et al. [11], who reported that nasal dorsum increases 10 degrees between 6 and 14 years, and changes are slightly greater during childhood. The increase in nasal length with age is consistent with the study by Chaconas [13] and Kumar et al. [27]. It was found that nasal length was correlated to other linear cephalometric measurements changing with age, for example mandibular length [4,13]. The length of the nose was negatively correlated to the angular measurement N’PrnP’ (nasomental angle) revealing that the length of the nose contributed to the convexity of the soft tissue profile [13].
In the present study, no statistically significant difference concerning NLA was found between white men and women, which is consistent with the papers by Fitzgerald et al. [10] and Hwang et al. [28]. Similar results were reported by Bagwan et al. [29], referring to Egyptian adults. However, contrary results were found by Magnani et al. [30] in young Brazilian black from 10 to 14 years, as well as by Taha and Ahmed [20] in Iraqi adults. Moreover, statistically significant sexual dimorphism of NMA angle is contrary to the studies by Taha and Ahmed [20], Hwang et al. [28], as well as by Lopatiene et al. [31], Aljabaa [32], and Kumar et al. [27]. The different findings may result from various sizes and age ranges of the groups analyzed. Taha and Ahmed [20] reported on 45 men and 45 women (age range: 18–25 years), Hwang et al. [28] reported on 15 men and 27 women (age range: 18–34 years), whereas Lopatiene et al. [31]—on 114 patients (age range: 14–16 years), Aljabaa [32]—on 32 females and 30 males (age range: 20–24 years), Kumar et al. [27] reported on 80 females and 80 males (age range: 8–16 years), while the present study reports on 229 females and 157 males (age range: 9–25 years).
The results of the present study referring to significant sex differences in nasal length, nose depth (1) and nose depth (2) and nasal hump are contrary to those reported by Gulsen et al. [4] on 262 Anatolian Turkish adults (age range: 18–30 years) as well as Arshad et al. [2] on 119 subjects of Pakistani origin (age range: 18–40 years). The present study is in accordance with the study by Aljabaa [32] on 62 Saudi subjects, (age range: 20–24 years), who found statistically significant sex differences in nasal length. The present study is contrary to this by Kumar et al. [27], who did not find significant differences in nose depth. Taha and Ahmed [20] observed no significant differences concerning nasal length and nose depth between the sexes. The significant difference for SFC angle between the sexes in the present study confirms the results by Gulsen et al. [4], however, is contrary to the study by Arshad et al. [2]. The different findings may result from age structure of the study groups or racial differences. The lack of significant sexual dimorphism referring to SFC angle is in accordance with the findings by Bagwan et al. [29].
Ethnic variability should always be taken under consideration. The NLA angle is smaller in Brazilian subjects of color than in white individuals [30]. It was also proved that this angle was significantly smaller in females [30]. However, black individuals showed similar angular measurements in both sexes [10].
NLA value in the literature has been presented in Table 6. All ethnic groups, presented in Table 6, had similar NLA angle in men and woman.

5. Conclusions

  • A relationship exists between nasal morphology and sagittal jaw configuration.
  • The following nasal parameters increase with age: dorsum axis, nose length, nose depth (1), nose depth (2), nasal hump, lower dorsum convexity, columella convexity. Parameters decreasing with age are: nasal bone angle, nasolabial angle, nasomental angle, soft tissue facial convexity, and nasal bone angle.
  • Sexual dimorphism has been found for nasal parameters: nasal bone angle and nasomental angle are significantly smaller in females.

Author Contributions

Conceptualization, A.J.; methodology, A.J. and J.J.-O.; software, A.J.; validation, A.J. and J.J.-O.; formal analysis, A.J. and J.J.-O.; investigation, A.J.; resources, A.J. and J.J.-O.; data curation, A.J.; writing—original draft preparation, A.J. and J.J.-O.; writing—review and editing, A.J., J.J.-O. and K.G.; visualization, A.J.; supervision, J.J.-O.; project administration, J.J.-O.; funding acquisition, K.G. All authors have read and agreed to the published version of the manuscript.

Funding

No funding was needed for the research. APC was founded by Pomeranian Medical University in Szczecin.

Institutional Review Board Statement

Not applicable.

Informed Consent Statement

Not applicable.

Data Availability Statement

All data is a part of the manuscript.

Conflicts of Interest

The authors declare no conflict of interests.

List of Abbreviations

NLAnasolabial angle
PCmposterior columella point—the most posterior point of the lower border of the nose at which it begins to turn inferiorly to merge with the philtrum of the upper lip (1).
Lslabrale superius = UL—the upper lip point—the most anterior point on the upper lip (1).
NBAnasal base angle
NMAnasomental angle
Nose depth (1)one of the two values of the nose depth
Nose depth (2)(Al-Pr) one of the two values of the nose depth
Humpnose hump
Dconvlower dorsum convexity
Cconvcolumella convexity
NboneLnasal bone length
SFCsoft tissue facial convexity
NboneAnasal bone angle
HHoldaway ratio (H),
ANBsagittal angle between maxilla and mandible
WitsWits appraisal

References

  1. Nehra, K.; Sharma, V. Nasal morphology as an indicator of vertical maxillary skeletal pattern. J. Orthod. 2009, 36, 160–166. [Google Scholar] [CrossRef] [PubMed]
  2. Arshad, T.; Shaikh, A.; Fida, M. Comparison of nasal profiles in various skeletal patterns. J. Ayub Med. Coll. Abbottabad 2013, 25, 31–35. [Google Scholar] [PubMed]
  3. Meng, H.P.; Goorhuis, J.; Kapila, S.; Nanda, R.S. Growth changes in the nasal profile from 7 to 18 years of age. Am. J. Orthod. Dentofac. Orthop. 1988, 94, 317–326. [Google Scholar] [CrossRef]
  4. Gulsen, A.; Okay, C.; Aslan, B.I.; Unerk, O.; Yavuzer, R. The relationship between craniofacial structures and the nose in Anatolian Turkish adults: A cephalometric evaluation. Am. J. Orthod. Dentofac. Orthop. 2006, 130, 131.e15–132.e25. [Google Scholar] [CrossRef]
  5. Farkas, L.G.; Kolar, J.C.; Munro, I.R. Geography of the nose: A morphometric study. Aesthetic Plast. Surg. 1986, 10, 191–223. [Google Scholar] [CrossRef]
  6. Robison, J.M.; Rinchuse, D.J.; Zullo, T.G. Relationship of skeletal pattern and nasal form. Am. J. Orthod. 1986, 89, 499–506. [Google Scholar] [CrossRef]
  7. Sarver, D.M.; Rousso, D.R. Surgical procedures to improve esthetics when orthognathic surgery is not an option. Am. J. Orthod. Dentofac. Orthop. 2004, 126, 299–301. [Google Scholar] [CrossRef]
  8. Burstone, C.J. The integumental profile. Am. J. Orthod. 1958, 44, 1–25. [Google Scholar] [CrossRef]
  9. Lo, F.D.; Hunter, W.S. Changes in nasolabial angle related to maxillary incisor retraction. Am. J. Orthod. 1982, 82, 384–391. [Google Scholar] [CrossRef]
  10. Fitzgerald, J.P.; Nanda, R.S.; Currier, G.F. An evaluation of the nasolabial angle and the relative inclinations of the nose and upper lip. Am. J. Orthod. Dentofac. Orthop. 1992, 102, 328–334. [Google Scholar] [CrossRef]
  11. Buschang, P.H.; De La Cruz, R.; Viazis, A.D.; Demirjian, A. A longitudinal shape changes of the nasal dorsum. Am. J. Orthod. Dentofac. Orthop. 1993, 104, 539–543. [Google Scholar] [CrossRef]
  12. Chaconas, S.J.; Bartroff, J.D. Prediction of normal soft tissue facial changes. Angle Orthod. 1975, 45, 12–25. [Google Scholar] [CrossRef] [PubMed]
  13. Chaconas, S.J. A statistical evaluation of nasal growth. Am. J. Orthod. 1969, 56, 403–414. [Google Scholar] [CrossRef]
  14. Clements, B.S. Nasal imbalance and the orthodontic patient. Am. J. Orthod. 1969, 55, 477–498. [Google Scholar] [CrossRef]
  15. Genecov, J.S.; Sinclair, P.M.; Dechow, P.C. Development of the nose and soft tissue profile. Angle Orthod. 1990, 60, 191–198. [Google Scholar] [CrossRef] [PubMed]
  16. Garner, L.D. Soft tissue changes concurrent with orthodontie tooth movement. Am. J. Orthod. 1974, 66, 367–377. [Google Scholar] [CrossRef]
  17. Segner, D.; Hasund, A. Individualisierte Kephalometrie, 4th ed.; Dietmar Segner Verlag: Hamburg, Germany, 2003; pp. 7–27. [Google Scholar]
  18. R Core Team. R: A Language and Environment for Statistical Computing; R Foundation for Statistical Computing: Vienna, Austria, 2020; Available online: https://www.r-project.org/ (accessed on 2 August 2020).
  19. Yadav, S. Correlation analysis in biological studies. J. Pract. Cardiovasc. Sci. 2018, 4, 116–121. [Google Scholar] [CrossRef]
  20. Taha, A.A.; Ahmed, A.S. A comprehensive assessment of the nasal profile among Iraqi adults with different skeletal classes: A retrospective study. J. Oral Biol. Craniofac. Res. 2020, 10, 175–179. [Google Scholar] [CrossRef]
  21. Perović, T.M.; Blažej, Z.; Jovanović, I. The influence of antero-posterior dentoskeletal pattern on the value of nasal soft tissue angles: A cephalometric study. Folia Morphol. 2020. [Google Scholar] [CrossRef] [PubMed]
  22. Posen, J.M. A longitudinal study of the growth of the nose. Am. J. Orthod. 1967, 53, 746–756. [Google Scholar] [CrossRef]
  23. Subtelny, J.D. A longitudinal study of soft tissue facial structures and their profile characteristics, defined in relation to underlying skeletal structures. Am. J. Orthod. 1959, 45, 481–507. [Google Scholar] [CrossRef]
  24. Manera, J.F.; Subtelny, J.D. A cephalometric study of the growth of the nose. Am. J. Orthod. 1961, 47, 703–705. [Google Scholar]
  25. Clements, B.S. Nasal imbalance and the orthodontic patient. Am. J. Orthod. 1969, 55, 244–264. [Google Scholar] [CrossRef]
  26. Clements, B.S. Nasal imbalance and the orthodontic patient. Am. J. Orthod. 1969, 55, 329–352. [Google Scholar] [CrossRef]
  27. Kumar, A.; Tandon, P.; Singh, G.K.; Singh, G.P. Soft tissue growth changes from 8 to 16 years of age: A cross-sectional study. Natl. J. Maxillofac. Surg. 2019, 10, 161–167. [Google Scholar] [CrossRef] [PubMed]
  28. Hwang, H.S.; Kim, W.S.; McNamara, J.A., Jr. Ethnic differences in Soft Tissue Profile of Korean and European-American adults with normal occlusions and well balanced faces. Angle Orthod. 2002, 72, 72–80. [Google Scholar] [CrossRef] [PubMed]
  29. Bagwan, A.A.; Alshennawy, M.; Alskhawy, M.M. Evaluation of soft tissue parameters for adults with accepted occlusion using Legan and Burstone analysis. Tanta Dent. J. 2015, 12, 1–6. [Google Scholar] [CrossRef] [Green Version]
  30. Magnani, M.B.; Nouer, D.F.; Nouer, P.R.; Pereira Neto, J.S.; Garbui, I.U.; Böeck, E.M. Assessment of the nasolabial angle in young Brazilian black subjects with normal occlusion. Braz. Oral Res. 2004, 18, 233–237. [Google Scholar] [CrossRef] [Green Version]
  31. Lopatienė, K.; Šidlauskas, A.; Vasiliauskas, A.; Čečytė, L.; Švalkauskienė, V.; Šidlauskas, M. Relationship between malocclusion, soft tissue profile, and pharyngeal airways: A cephalometric study. Medicina 2016, 52, 307–314. [Google Scholar] [CrossRef] [PubMed]
  32. Aljabaa, A.H. Lateral cephalometric analysis of the nasal morphology among Saudi adults. Clin. Cosmet. Investig. Dent. 2019, 11, 9–17. [Google Scholar] [CrossRef] [Green Version]
  33. Burstone, C.J. Lip posture and its significance in treatment planning. Am. J. Orthod. 1967, 53, 262–284. [Google Scholar] [CrossRef]
  34. Arnett, G.W.; Jelic, J.S.; Kim, J.; Cummings, D.R.; Beress, A.; Worley, C.M., Jr.; Chung, B.; Bergman, R. Soft tissue cephalometric analysis: Diagnosis and treatment planning of dentofacial deformity. Am. J. Orthod. Dentofac. Orthop. 1999, 116, 239–253. [Google Scholar] [CrossRef]
  35. Fernández-Riveiro, P.; Smyth-Chamosa, E.; Suárez-Quintanilla, D.; Suárez-Cunqueiro, M. Angular photogrammametric analysis of soft tissue profile. Eur. J. Orthod. 2003, 25, 393–399. [Google Scholar] [CrossRef] [PubMed] [Green Version]
  36. Scavone, H., Jr.; Trevisan, H., Jr.; Garib, D.G.; Ferreira, F.V. Facial profile evaluation in Japanese—Brazilian adults with normal occlusions and well balanced faces. Am. J. Orthod. Dentofac. Orthop. 2006, 129, 721.e1–721.e5. [Google Scholar] [CrossRef] [PubMed]
  37. Dua, V.; Gupta, S.; Singh, C. Evaluation of the nasolabial angle in the Indian population. Contemp. Clin. Dent. 2010, 1, 79–82. [Google Scholar] [CrossRef] [PubMed]
  38. Anić-Milošević, S.; Meštrović, S.; Lapter-Varga, M.; Dumancic, J.; Šlaj, M. Analysis of soft tissue profile in Croatians with normal occlusions and well-balanced faces. Eur. J. Orthod. 2011, 33, 305–310. [Google Scholar] [CrossRef] [PubMed] [Green Version]
  39. Kandhasamy, K.; Prabu, N.M.; Sivanmalai, S.; Prabu, P.S.; Philip, A.; Chiramel, J.C. Evaluation of the nasolabial angle of the Komarapalayam population. J. Pharm. Bioallied Sci. 2012, 4, S313–S315. [Google Scholar] [CrossRef]
  40. Paradowska-Stolarz, A.M.; Kawala, B. The Nasolabial Angle Among Patients with Total Cleft Lip and Palate. Adv. Clin. Exp. Med. 2015, 24, 481–485. [Google Scholar] [CrossRef] [PubMed] [Green Version]
Figure 1. Nasal and cephalometric landmarks.
Ijerph 18 03064 g001
Figure 2. Correlation matrix for nasal and cephalometric variables.
Ijerph 18 03064 g002
Table 1. Nasal and cephalometric landmarks.
LandmarkDefinition
G’Soft tissue glabellaSoft tissue point on the inferior part of the forehead between the eyebrows
N’Soft tissue nasionSoft tissue point—borderline between the forehead and the nose
MnMidnasaleSoft tissue point in the middle of the distance between the points N’ and Pr
StSupratipSoft tissue point halfway between the Midnasale point and the Pronasale points
PrPronasaleTip of the nose (soft tissue point)
CtgColumellaThe most prominent point on the Sn-Pr curve, borderline between lower part of the nose contour and nasal tip
SnSubnasaleSoft tissue point between columella and upper lip.
ULUpper LipThe most protruding point of the upper lip
Al.AlareThe most receding soft tissue point of the nasal alar curvature.
WPgPogonionThe most prominent point on the soft tissue chin
NNasionThe most receding point of the anterior surface of the frontonasal suture
N1Nasion 1The most receding point of the frontal curvature on the nasal bone
N2Nasion 2The most protruding point of the frontal curvature on the nasal bone
RRhinionThe most prominent and inferior point on the nasal bone
SSellaCentre the sella turcica
SpSpina nasalis anteriorThe most protruding point of the nasal spine
ASubspinaleThe most posterior point on the anterior surface of the maxilla
IssIncision superiusIncisal edge of the most protruded upper central incisor
IsaIncision superius apicalisApex of upper central incisor
BSupramentaleThe most posterior point on the anterior surface of the mandible
IisIncision infernusIncisal edge of the most protruded lower central incisor
IiaIncision infernus apicalisApex of lower central incisor
PgPogonionThe most anterior point on the bony chin
GnGnationThe most inferior bony point of the mandible
tgoTuberositas gonialeThe point constructed of the intersection between the posterior and inferior edges of the mandible
PmPterygomaxillaryThe most posterior point of the nasal spine
ArArticulareThe point constructed of the intersection the lower contour of cranial base with the posterior contour of mandibular ramus
BaBasionThe most posterior and inferior point of the clivus
U6Upper molar 6Distal cusp of upper first molar
L6Lower molar 6Distal cusp of lower first molar
Table 2. Cephalometric and nasal variables.
Abbreviation (unit)NameDefinitionInterpretation
Nasal variablesN’–St (mm)The axis of dorsumDistance between the soft tissue nasion point and the supratip pointLength of the nasal dorsum
N’–Pr (mm)Nasal lengthDistance between the N’ point and the Pr pointTotal nasal length
Nose depth (1) (mm)Nose depth (1)Perpendicular distance between Pr and the N’-Sn lineSagittal position of the nose tip referring to the face
Al–Pr (mm)Nose depth (2)Distance between points Al and PrSagittal position of the nose tip referring to alar base
Hump (mm)HumpPerpendicular distance between the axis of dorsum and its most prominent soft tissue pointConvexity of nasal dorsum
NBA (°)Nasal base angleAngle between the G’-Sn line and the long axis of the nostrilInclination of nasal base referring to the face
NMA (°)Nasomental angleAngle between the axis of the dorsum and the Pr-WPg lineRelation between nasal dorsum inclination and chin position
SFC (°)Soft tissue facial convexityAngle between the lines G’-Sn and Sn-WPg lineProfile convexity
Dconv (mm)Lower dorsum convexityPerpendicular distance between the Mn-Pr line and its most prominent pointConvexity of the lower part of nasal dorsum
Cconv (mm)Columella convexityPerpendicular distance between the Pr-Sn line and the most anterior point on the convexity of columellaConvexity of nasal base
NboneL (mm)Nasal bone lengthThe line constructed between the N point and the R pointLength of long axis of nasal bone
NboneA (°)Nasal bone angleThe posterior angle between the lines N1-N2 and N2-RCurvature of the nasal bone
Cephalometric variablesSNA (°)Sella-Nasion to point A angleAngle between Sella-Nasion line and the Nasion-A lineSagittal position of the maxillary alveolar process referring to anterior cranial fossa
SNB (°)Sella-Nasion to point B angleAngle between lines Sella-Nasion and Nasion-BSagittal position the alveolar part of the mandible referring to anterior cranial fossa
ANB (°)A point to B point angleDifference between SNA and SNBSagittal relation between maxilla and mandible
SNPg (°)Sella-Nasion to point Pg angleAngle between the lines Sella-Nasion and Nasion-PgSagittal position of the chin referring to anterior cranial fossa
NSBa (°)Cranial base angleAngle between the lines Nasion-Sella and Sella- BasionInclination of clivus referring to anterior cranial fossa
Gn–tgo–Ar (°)Mandibular angleAngle between the lines Gn-tgo and tgo-ArAngulation between mandibular corpus and ramus
NL–NSL (°)Maxillary base angleThe angle between the NL (maxillary base) line and Nasion-Sella lineMaxillary inclination to the anterior cranial fossa
ML–NSL (°)Mandibular base angleAngle between the ML (mandibular base) line and Nasion-Sella lineInclination of mandibular base to the anterior cranial fossa
ML–NL (°)Intermaxillary angleAngle between the ML (mandibular) line and NL (maxillary) lineInclination between the bases of maxilla and mandible
NLA (°)Nasolabial angleAngle between the points ctg, Sn, ULRelationship between the upper lip and columella
HHoldaway ratioAngle between the lines UL-WPg and NBRelationship between soft tissue profile and hard tissue profile
1+1− (°)Interincisal angleAngle between the axes of upper and lower incisorsInclination of upper and lower central incisors
1+:NA (°)Upper incisor angleAngle between long axis of the most protruded upper central incisor and NA lineUpper central incisor inclination to maxillary base
1−:NB (°)Lower incisor angleAngle between long axis of the most protruded lower central upper incisor and NB lineLower central incisor inclination to mandibular base
Pg:NB (mm)Distance Pg-NBDistance between Pg point and NB lineSagittal position of the chin referring to alveolar part of the mandible
1+NA (mm)Upper incisor distanceDistance from upper incisor to NA lineSagittal position of upper incisal edge to maxilla
1−NB (mm)Lower incisor distanceDistance from upper incisor to NB lineSagittal position of lower incisal edge to mandible
Index (%)Lower face height indexRatio between the middle and lower face heightsLower face height in proportion to midface
Wits (mm)Wits appraisalDistance between the perpendicular projections of points A and B on the occlusal planeSagittal relation between maxilla and mandible
Table 3. Characteristics of the study group (n = 386).
FeatureValues
AgeMean ± SD14.19 ± 3.58
median14
quartiles12–16
SexFemales229 (59.33%)
Males157 (40.67%)
Skeletal ClassI173 (44.82%)
II138 (35.75%)
III75 (19.43%)
Table 4. Data normality (Shapiro–Wilk test, p < 0.05).
Variablep-ValueNormality
Age<0.001No
SNA (°)0.006No
SNB (°)0.001No
ANB (°)<0.001No
SNPg (°)0.001No
NSBa (°)0.516Yes
GntgoAr (°)0.332Yes
NL–NSL (°)<0.001No
ML–NSL (°)0.641Yes
ML–NL (°)0.132Yes
H0.803Yes
Angle 1+:1− (°)0.004No
Angle 1+:NA (°)0.211Yes
Angle 1−:NB (°)0.269Yes
Pg:NB (mm)<0.001No
1+:NA (mm)<0.001No
1−:NB (mm)<0.001No
Index0.972Yes
Wits (mm)<0.001No
NLA (°)<0.001No
Dorsum axis N’–St (mm)0.285Yes
Nose length N’–Pr (mm)0.47Yes
Nose depth (1) (mm)0.008No
Nose depth (2) Al–Pr (mm)0.001No
Nose hump (mm)<0.001No
NBA (°)0.475Yes
NMA (°)<0.001No
SFC (°)<0.001No
Dconv<0.001No
Cconv<0.001No
NboneL (mm)0.003No
NboneA (°)0.976Yes
Table 5. Distribution of the study group according to nasal and cephalometric values.
VariableFemalesMalesTotalp1
SNA (°)mean ± SD81.07 ± 3.7680.13 ± 4.7180.43 ± 4.680.022
median81.180.180.5NP
quartiles78.9–83.677.2–82.978.0–83.1
SNB (°)mean ± SD78.1 ± 3.8878.04 ± 5.1477.94 ± 4.710.572
median78.0577.877.9NP
quartiles75.38–80.5374.7–81.174.9–80.6
ANB (°)mean ± SD2.96 ± 3.082.09 ± 3.72.49 ± 3.50.031
median32.52.7NP
quartiles1.1–5.2−0.2–4.60.58–4.9
SNPg (°)mean ± SD79.09 ± 4.0679.07 ± 5.2678.97 ± 4.820.473
median79.278.578.9NP
quartiles76.4–81.675.5–8275.9–81.7
NSBa (°)mean ± SD129.81 ± 5.4129.21 ± 5.49129.5 ± 5.520.286
median129.5129.4129.4P
quartiles126.1–133.4125–133.1125.6–133.3
GntgoAr (°)mean ± SD125.92 ± 7.98127.7 ± 7.73126.77 ± 7.930.03
median125.2127.9126.20P
quartiles120.5–131.6122.4–132.8121.2–132.3
NL–NSL (°)mean ± SD7.8 ± 3.667.89 ± 3.887.86 ± 4.230.671
median7.77.97.8NP.
quartiles5.6–10.25.7–10.35.6–10.3
ML–NSL (°)mean ± SD32.27 ± 6.5933.6 ± 6.8532.9 ± 6.760.058
median32.334.332.9P
quartiles28.2–36.928.6–38.428.3–37.5
ML–NL (°)mean ± SD24.48 ± 6.3725.97 ± 6.725.21 ± 6.660.069
median24.425.224.9NP
quartiles20.3–28.621.5–30.321.1–29.5
Hmean ± SD11.35 ± 5.7812.36 ± 5.7411.55 ± 6.070.089
median1112.911.7P
quartiles7.3–14.78–16.67.3–15.8
Angle 1+:1− (°)mean ± SD128.62 ± 11.74128.1 ± 11.6128.19 ± 13.850.545
median128.1126.5127.5NP
quartiles121.2–135.9120.6–134.5120.9–135.9
Angle 1+:NA (°)mean ± SD22.87 ± 8.3124.57 ± 8.0224.00 ± 10.50.047
median23.424.724.1P
quartiles17.2–28.720.5–3018.2–29.4
Angle 1−:NB (°)mean ± SD25.6 ± 6.9625.23 ± 7.2125.35 ± 7.420.619
median25.725.925.7P
quartiles20.9–30.5221.5–3020.8–30.3
Pg:NB (mm)mean ± SD4.6 ± 5.956.58 ± 7.375.6 ± 6.760.028
median3.254.53.9NP
quartiles1.08–7.71.3–11.91.1–9.7
1+:NA (mm)mean ± SD11.6 ± 11.7414.43±14.0312.7 ± 12.80.031
median9.412.610.6NP
quartiles3–18.74.7–22.23.4–19.5
1−:NB (mm)mean ± SD12.83 ± 11.1315.36 ± 12.1113.8 ± 11.470.037
median10.151411.55NP
quartiles4.2–20.025–23.64.38–21.58
Indexmean ± SD79.69 ± 8.2978.84 ± 8.6278.52 ± 11.040.326
median79.579.179.1P
quartiles74.4–85.672.7–84.673.5–84.8
Wits (mm)mean ± SD0.03 ± 13.75−3.97 ± 17.78−1.28 ± 16.930.007
median0.8−2.25−0.3NP
quartiles−4.67–5.62−12.15–5.4−8.7–5.8
NLA (°)mean ± SD113.32 ± 10.4112.64 ± 13.34112.54 ± 12.460.589
median114.6113.5113.7NP
quartiles106.1–120.3105.8–121105.7–120.5
Dorsum axis N’–St (mm)mean ± SD44.01 ± 4.7343.71 ± 5.7143.81 ± 5.150.575
median444444P
quartiles41–4740–4740.5–47
Nose length N’–Pr (mm)mean ± SD58.57 ± 6.1558.4 ± 7.6858.4 ± 6.820.811
median5958.559P
quartiles54.5–6353–6354–63
Nose depth (1) (mm)mean ± SD23.8 ± 2.8723.32 ± 3.1623.6 ± 3.010.083
median242324NP
quartiles22–25.521–25.521.5 –25.5
Nose depth (2) Al–Pr (mm)mean ± SD36.52 ± 3.5337.12 ± 4.0736.71 ± 3.790.136
median363736NP
quartiles34–3934–4034–39
Nose hump (mm)mean ± SD−0.03 ± 1.420.17 ± 1.360.06 ± 1.390.118
median000NP
quartiles−0.5–1−0.5–1−0.5–1
NBA (°)mean ± SD96.5 ± 7.1698.04 ± 7.7197.07 ± 7.490.046
median9697.597P
quartiles91.5–10193–10392–102
NMA (°)mean ± SD122.33 ± 6.08124.46 ± 6.72123.43 ± 6.550.018
median123124123.50NP
quartiles118.5–126120–128120–127
SFC (°)mean ± SD15.21 ± 7.2614.79 ± 7.9214.75 ± 7.900.579
median151615NP
quartiles11–2011–2011–20
Dconvmean ± SD1.64 ± 0.971.54 ± 0.921.60 ± 0.950.435
median21.51.5NP
quartiles1–21–21–2
Cconvmean ± SD3.45 ± 1.153.67 ± 1.283.57 ± 1.260.098
median343.5NP
quartiles3–43–4.53–4.5
NboneL (mm)mean ± SD30.42 ± 4.5130.84 ± 5.330.66 ± 5.020.465
median303130.50NP
quartiles27.5–3328–3428–33.5
NboneA (°)mean ± SD148.02 ± 9.58148.61 ± 10.21148.25 ± 9.950.568
median147.5149148.50P
quartiles142–154141–156142–155
1 P = normality of distribution in both groups, t-test; NP = lack of normality in at least one group, Mann–Whitney test.
Table 6. NLA value in the literature.
Author, YearPopulationNLA Values
MenWomenTotal
Burstone [33], 1967Caucasian adolescentno datano data74 +/− 8.00
Fitzgerald et al. [10], 1992white Americans113.55 +/− 9.44116.19114.08 +/− 9.58
Arnett et al. [34], 1999white Americans106.40 +/− 7.70103.50 +/− 6.80no data
Fernandez-Riveiro et al. [35], 2003Caucasians from Galicia, young adults105 +/− 13.28107 +/− 8.50no data
Hwang et al. [28], 2002European–American origin adults112.05 +/− 9.86109.71 +/− 7.60no data
Hwang et al. [28], 2002Korean origin adults91.11 +/− 8.1292.00 +/− 9.55no data
Magnani et al. [30], 2004Young Brazilian subjects of color92.00 +/− 12.5285.05 +/− 11.9388.14 +/− 12.52
Scavone et al. [36], 2006Japanese–Brazilian adults108.40 +/− 10.76110.10 +/− 8.97no data
Nehra and Sharma [1], 2009Indian adultsno datano data92.69 +/− 11.09
Dua et al. [37], 2010Indian adults population96.74 +/− 10.8995.64 +/− 8.9096.10 +/− 9.70
Anic-Milosevic et al. [38], 2011Croatians105.00 +/− 9.52109.39 +/− 7.84no data
Kandhasamy et al. [39], 2012Komarapalayam adults population116.51 +/− 8.01115.701 +/− 4.00116.10 +/− 10.00
Arshad et al. [2], 2013Pakistani origin100.55 +/− 14.5298.87 +/− 15.76no data
Paradowska-Stolarz and Kawala [40], 2015white adult Poles—healthy patients116.60 +/− 11.53112.77 +/− 13.17no data
Paradowska-Stolarz and Kawala [40], 2015white adult Poles with any cleft (lip/ palate/both)100.36 +/− 18.13101.14 +/− 17.51no data
Bagwan et al. [29], 2015Egyptian adults94.40 +/− 10.2396.46 +/− 11.3095.00 +/− 10.40
Aljabaa [32], 2019Saudi adults96.23 +/− 12.74104.19 +/− 11.92no data
Taha and Ahmed [20], 2020Iraqi adults, skeletal Class I97.93 +/− 9.75101.73 +/− 12.15no data
Taha and Ahmed [20], 2020Iraqi adults, skeletal Class II91.20 +/− 14.9598.80 +/− 13.10no data
Taha and Ahmed [20], 2020Iraqi adults, skeletal Class III95.33 +/− 10.75101.93 +/− 9.81no data
Perović et al. [21], 2020Caucasian adults from Serbia, skeletal Class Ino datano data111.67 +/− 10.76
Present studywhite adult Poles112.64 +/− 13.34113.32 +/− 10.40112.54 +/− 12.46
Publisher’s Note: MDPI stays neutral with regard to jurisdictional claims in published maps and institutional affiliations.

