3.1. Data Acquisition and Analysis
This paper uses big data to build a predictive and early-warning model for HFMD through multi-dimensional data fusion. The data used mainly include two parts: incidence data and environmental data.
First of all, the incidence data comes from HFMD in Shanxi Province in 2016. There is no personal privacy data in this data, including: region (township), date of onset, age group, gender group, and population classification.
For the incidence data, we carried out exploratory data analysis to select appropriate characteristic factors affecting the HFMD epidemic in the model construction process, mainly analyzing indicators such as gender, population type, onset time, and patient age:
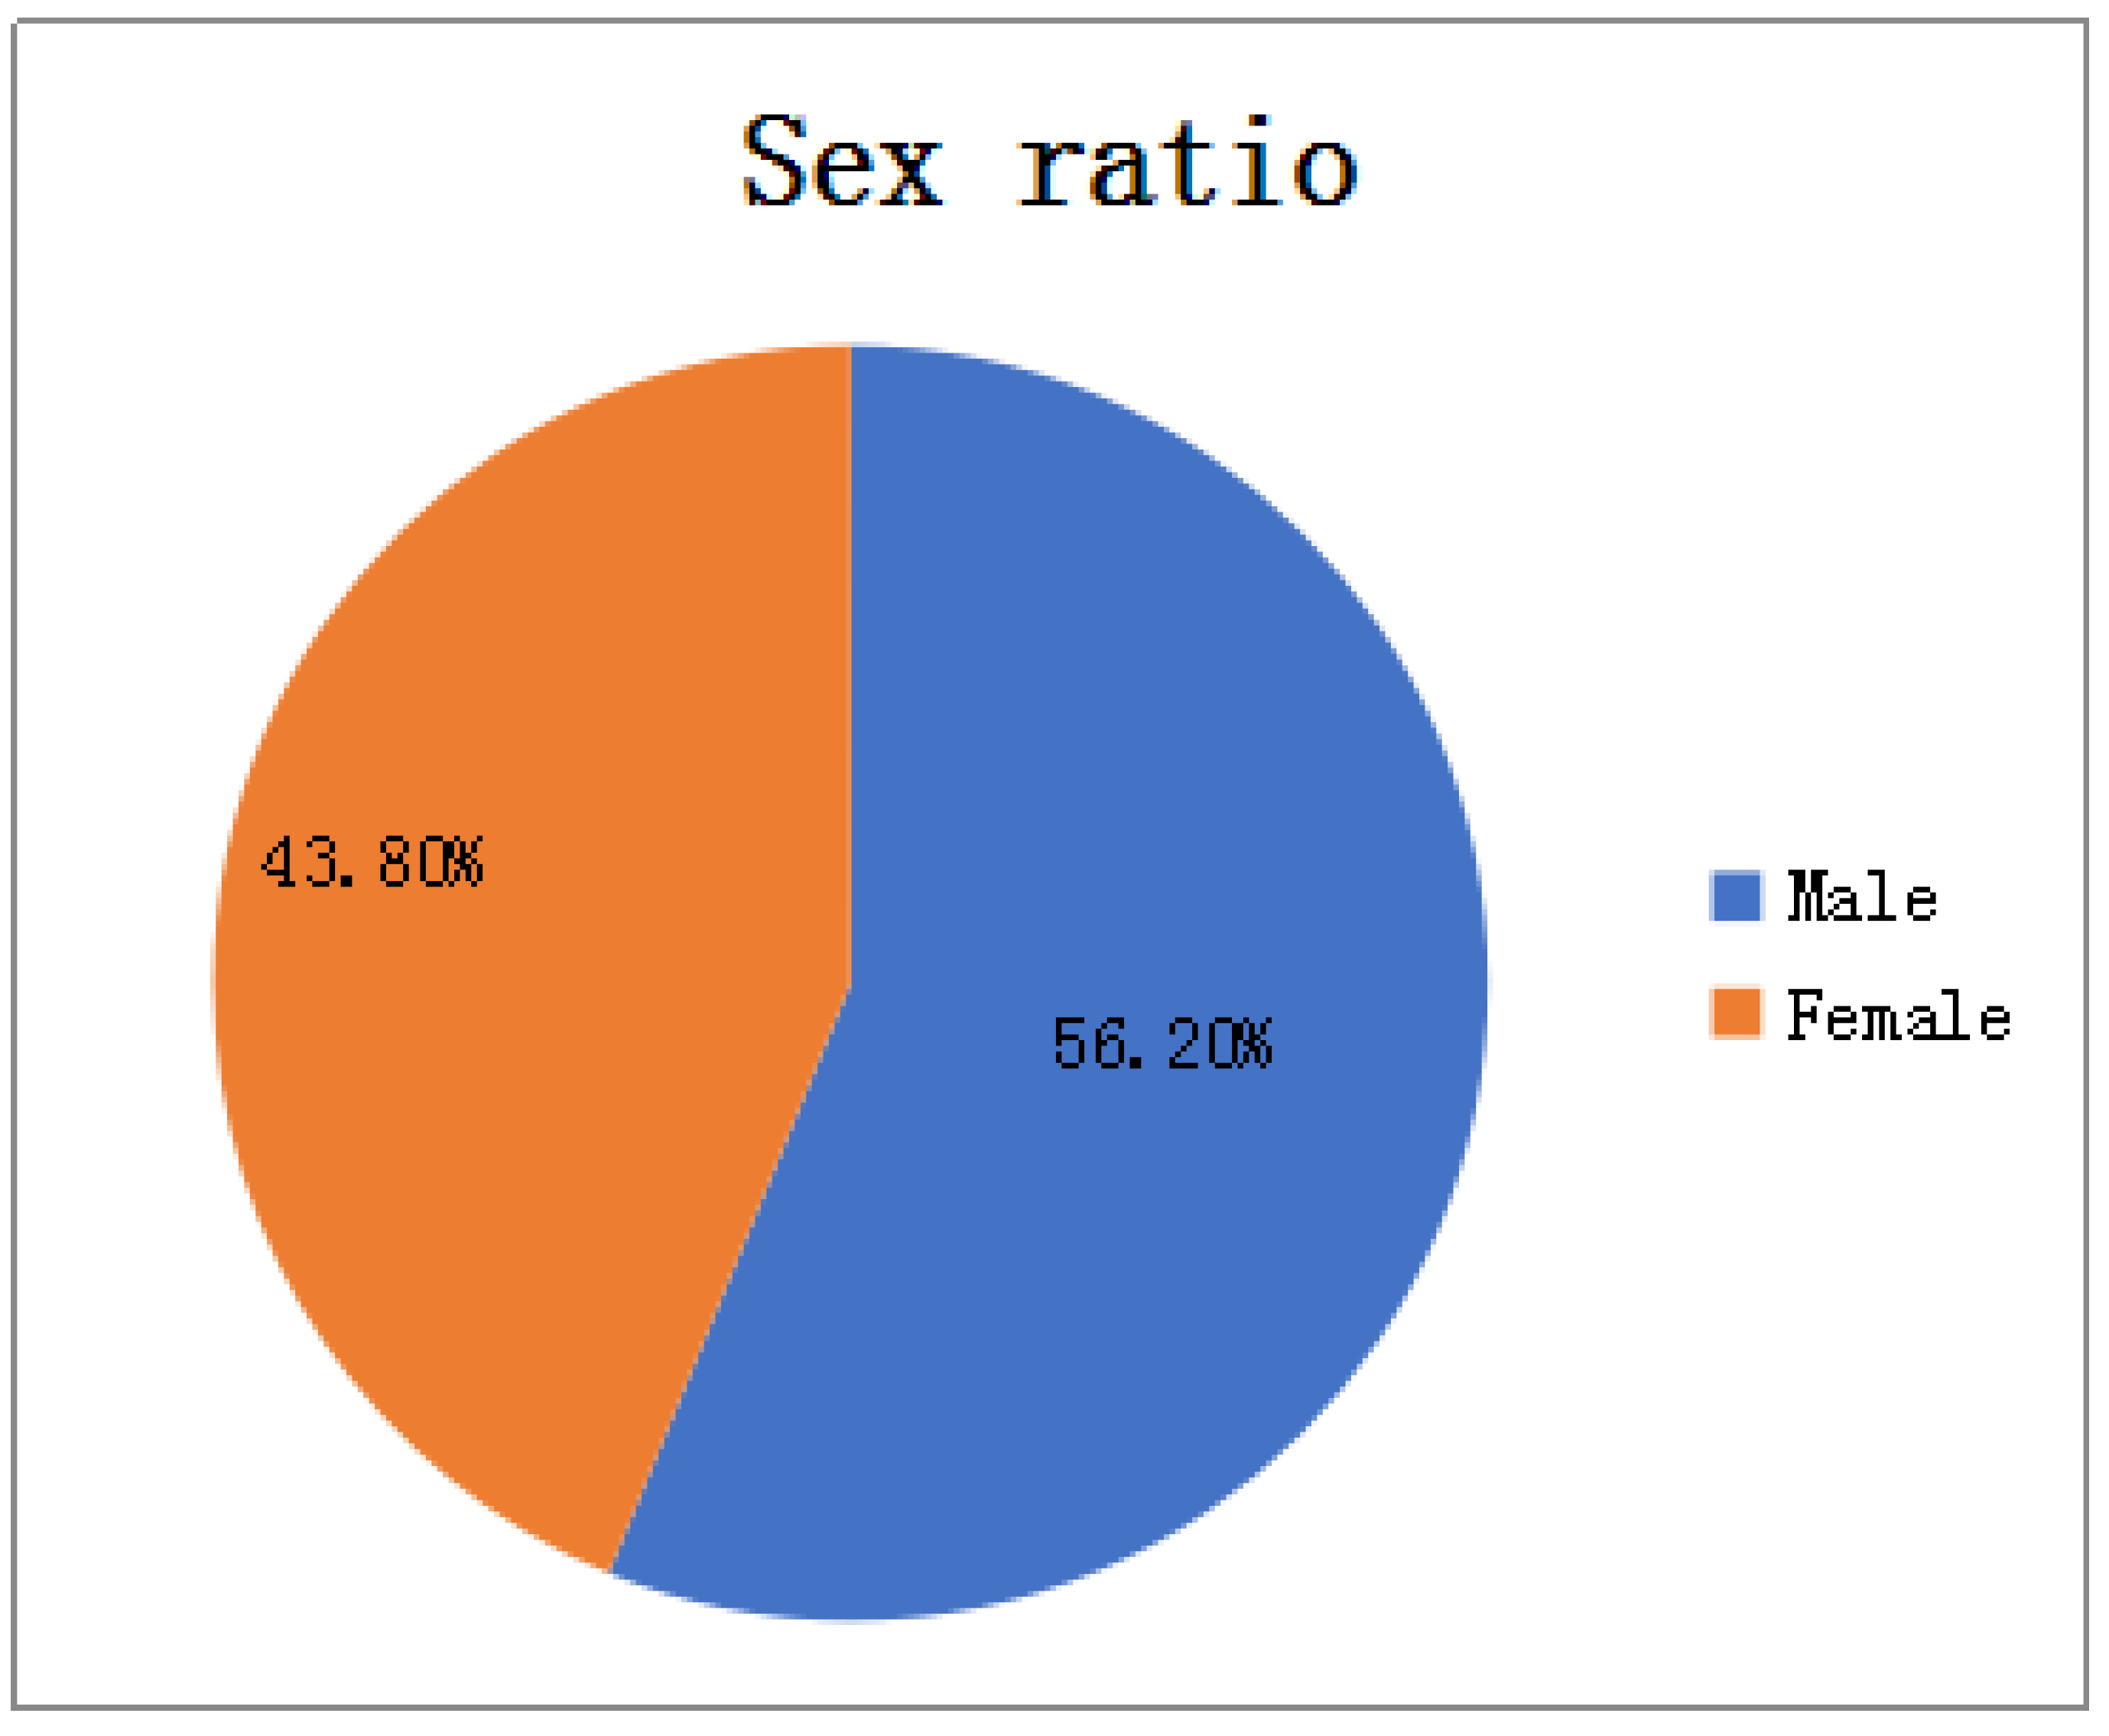
In terms of gender: As shown in
Figure 2, among all HFMD patients in the province in 2016, the ratio of male to female patients was about 4:3. It can be considered that the relationship between HFMD infection and gender is very small, i.e., the chances of male and female being infected with HFMD are equal, so the ratio of men to women is not considered as a relevant factor affecting the prevalence of HFMD.
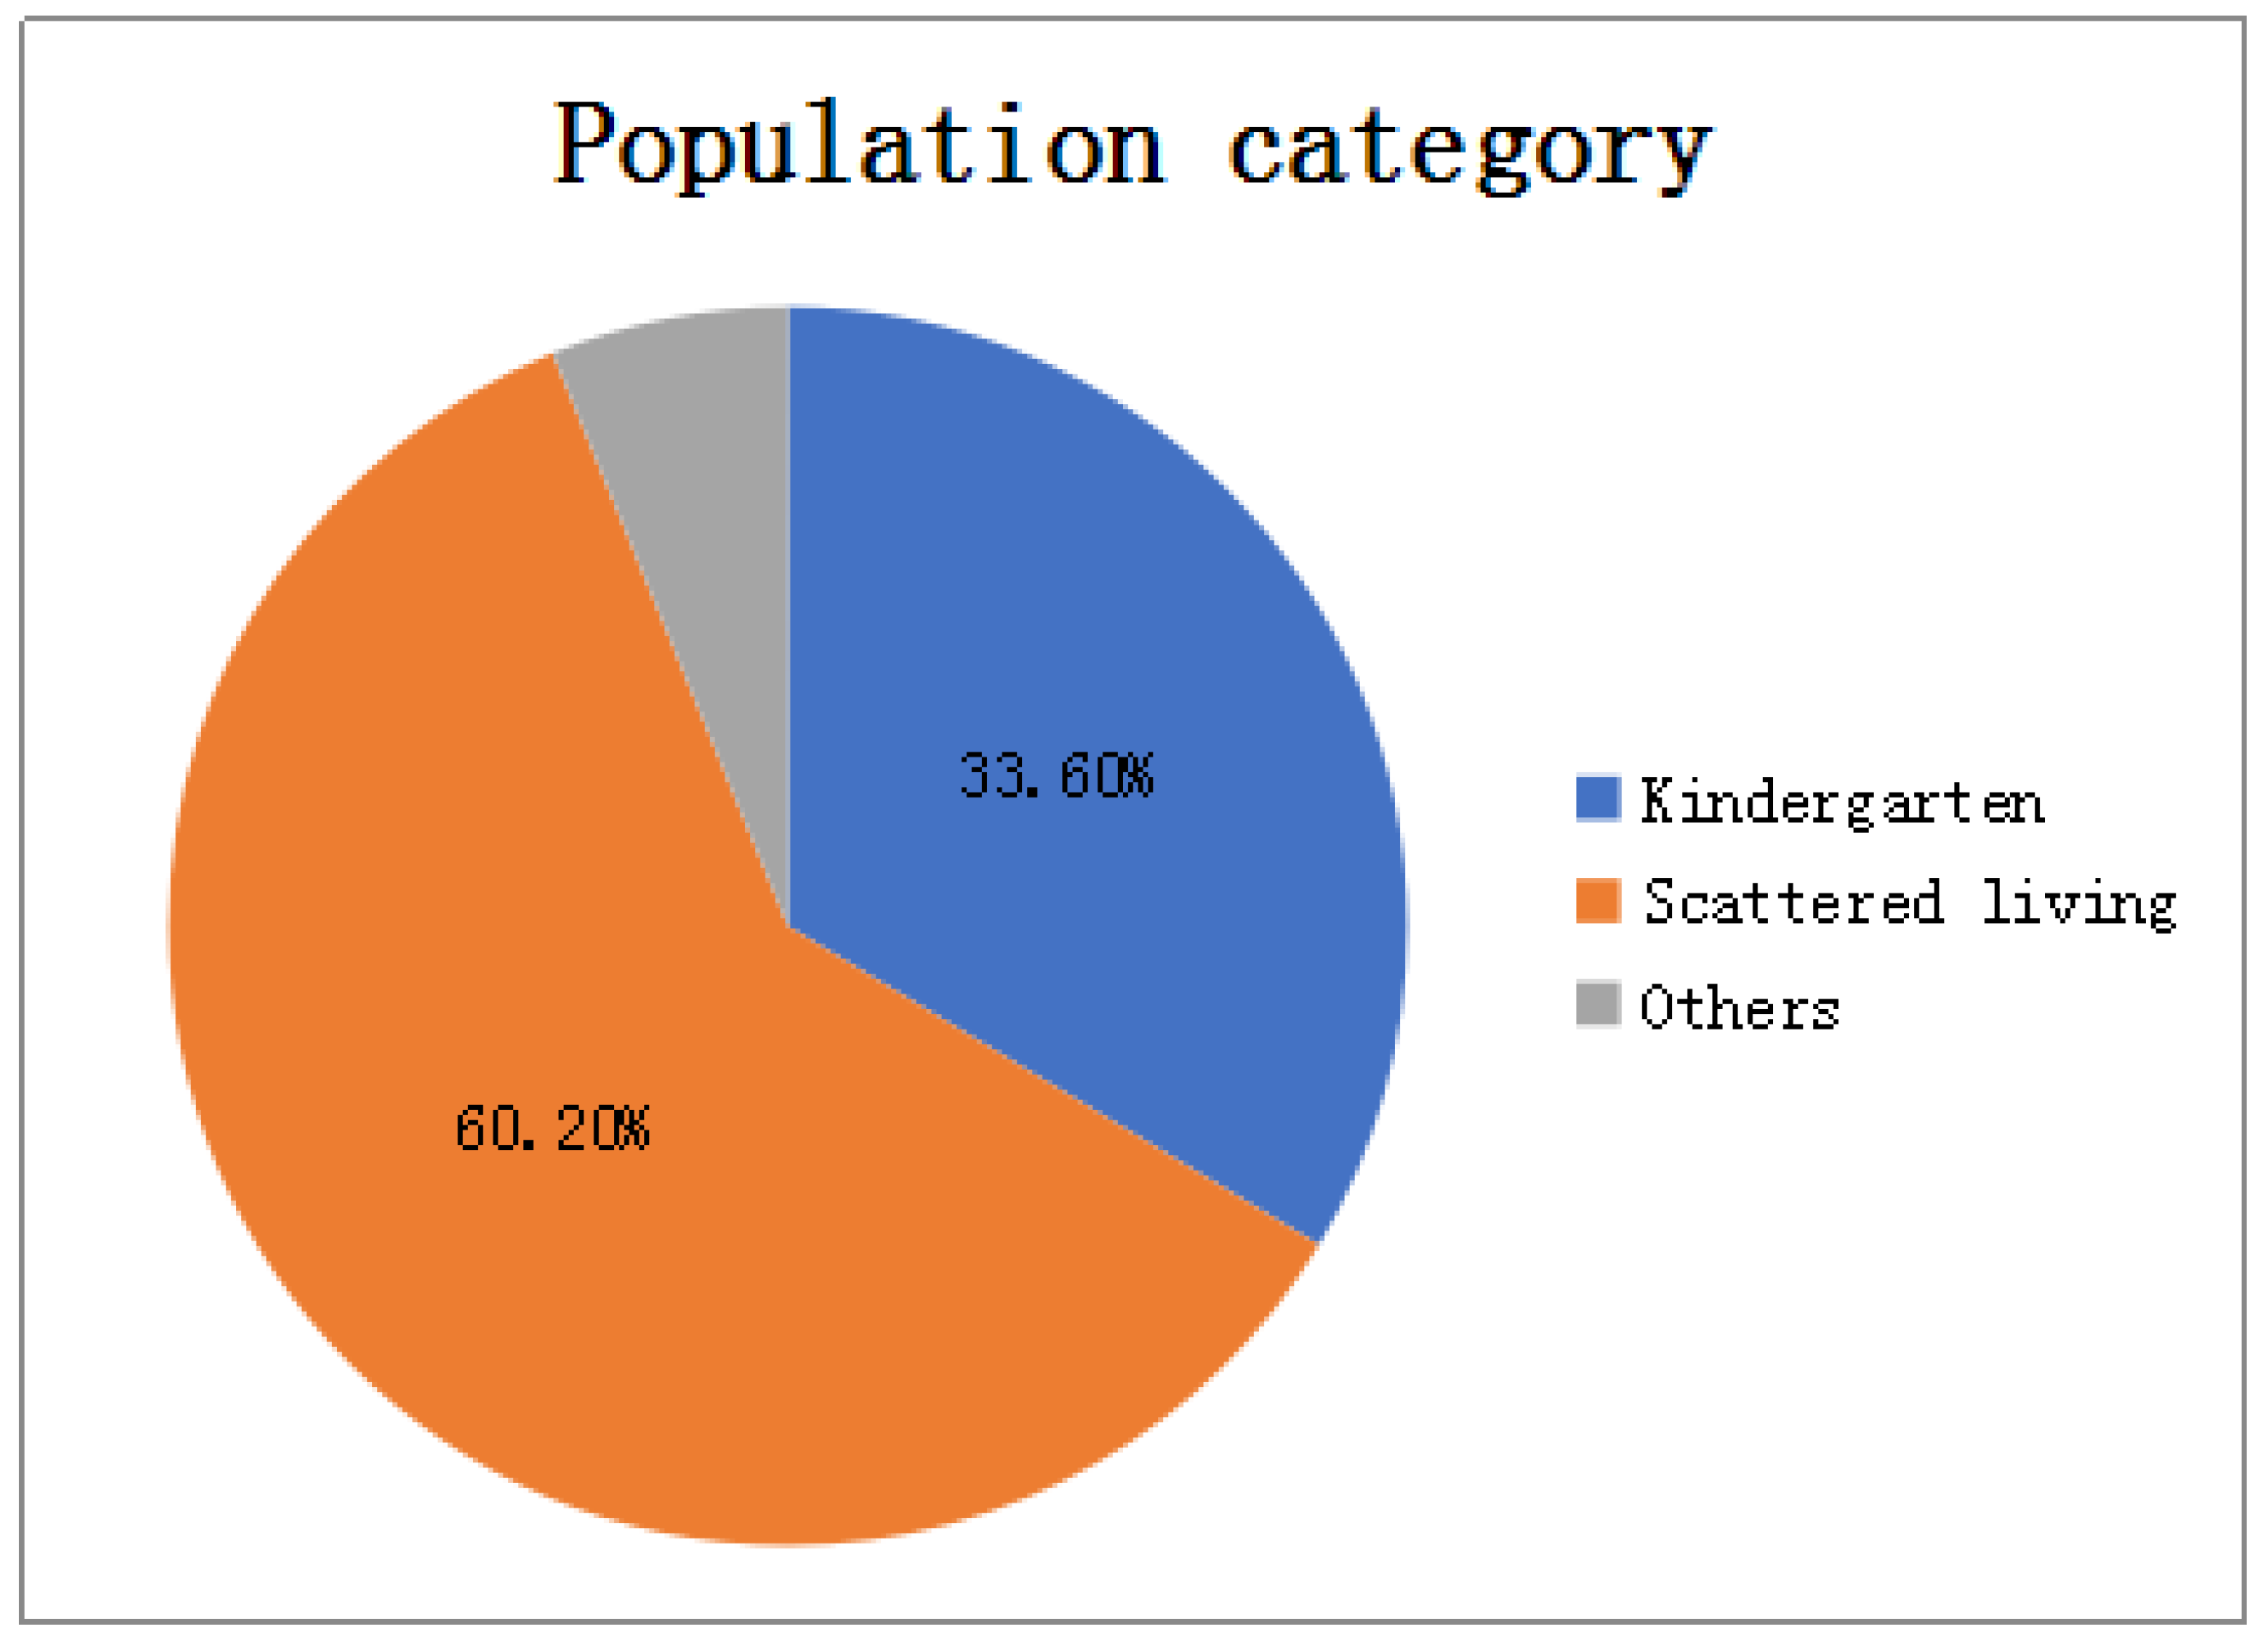
In terms of population types: As shown in
Figure 3, there are three types of populations for all patients: kindergarten, scattered living, and other categories. The proportions of patients are 33.6%, 60.2%, and 6.2% respectively. Patients infected with HFMD are mainly concentrated in kindergartens and scattered populations, but the proportion of scattered patients is twice that of kindergarten patients, so the number of children in kindergartens cannot be a good predictor of HFMD infection patients.
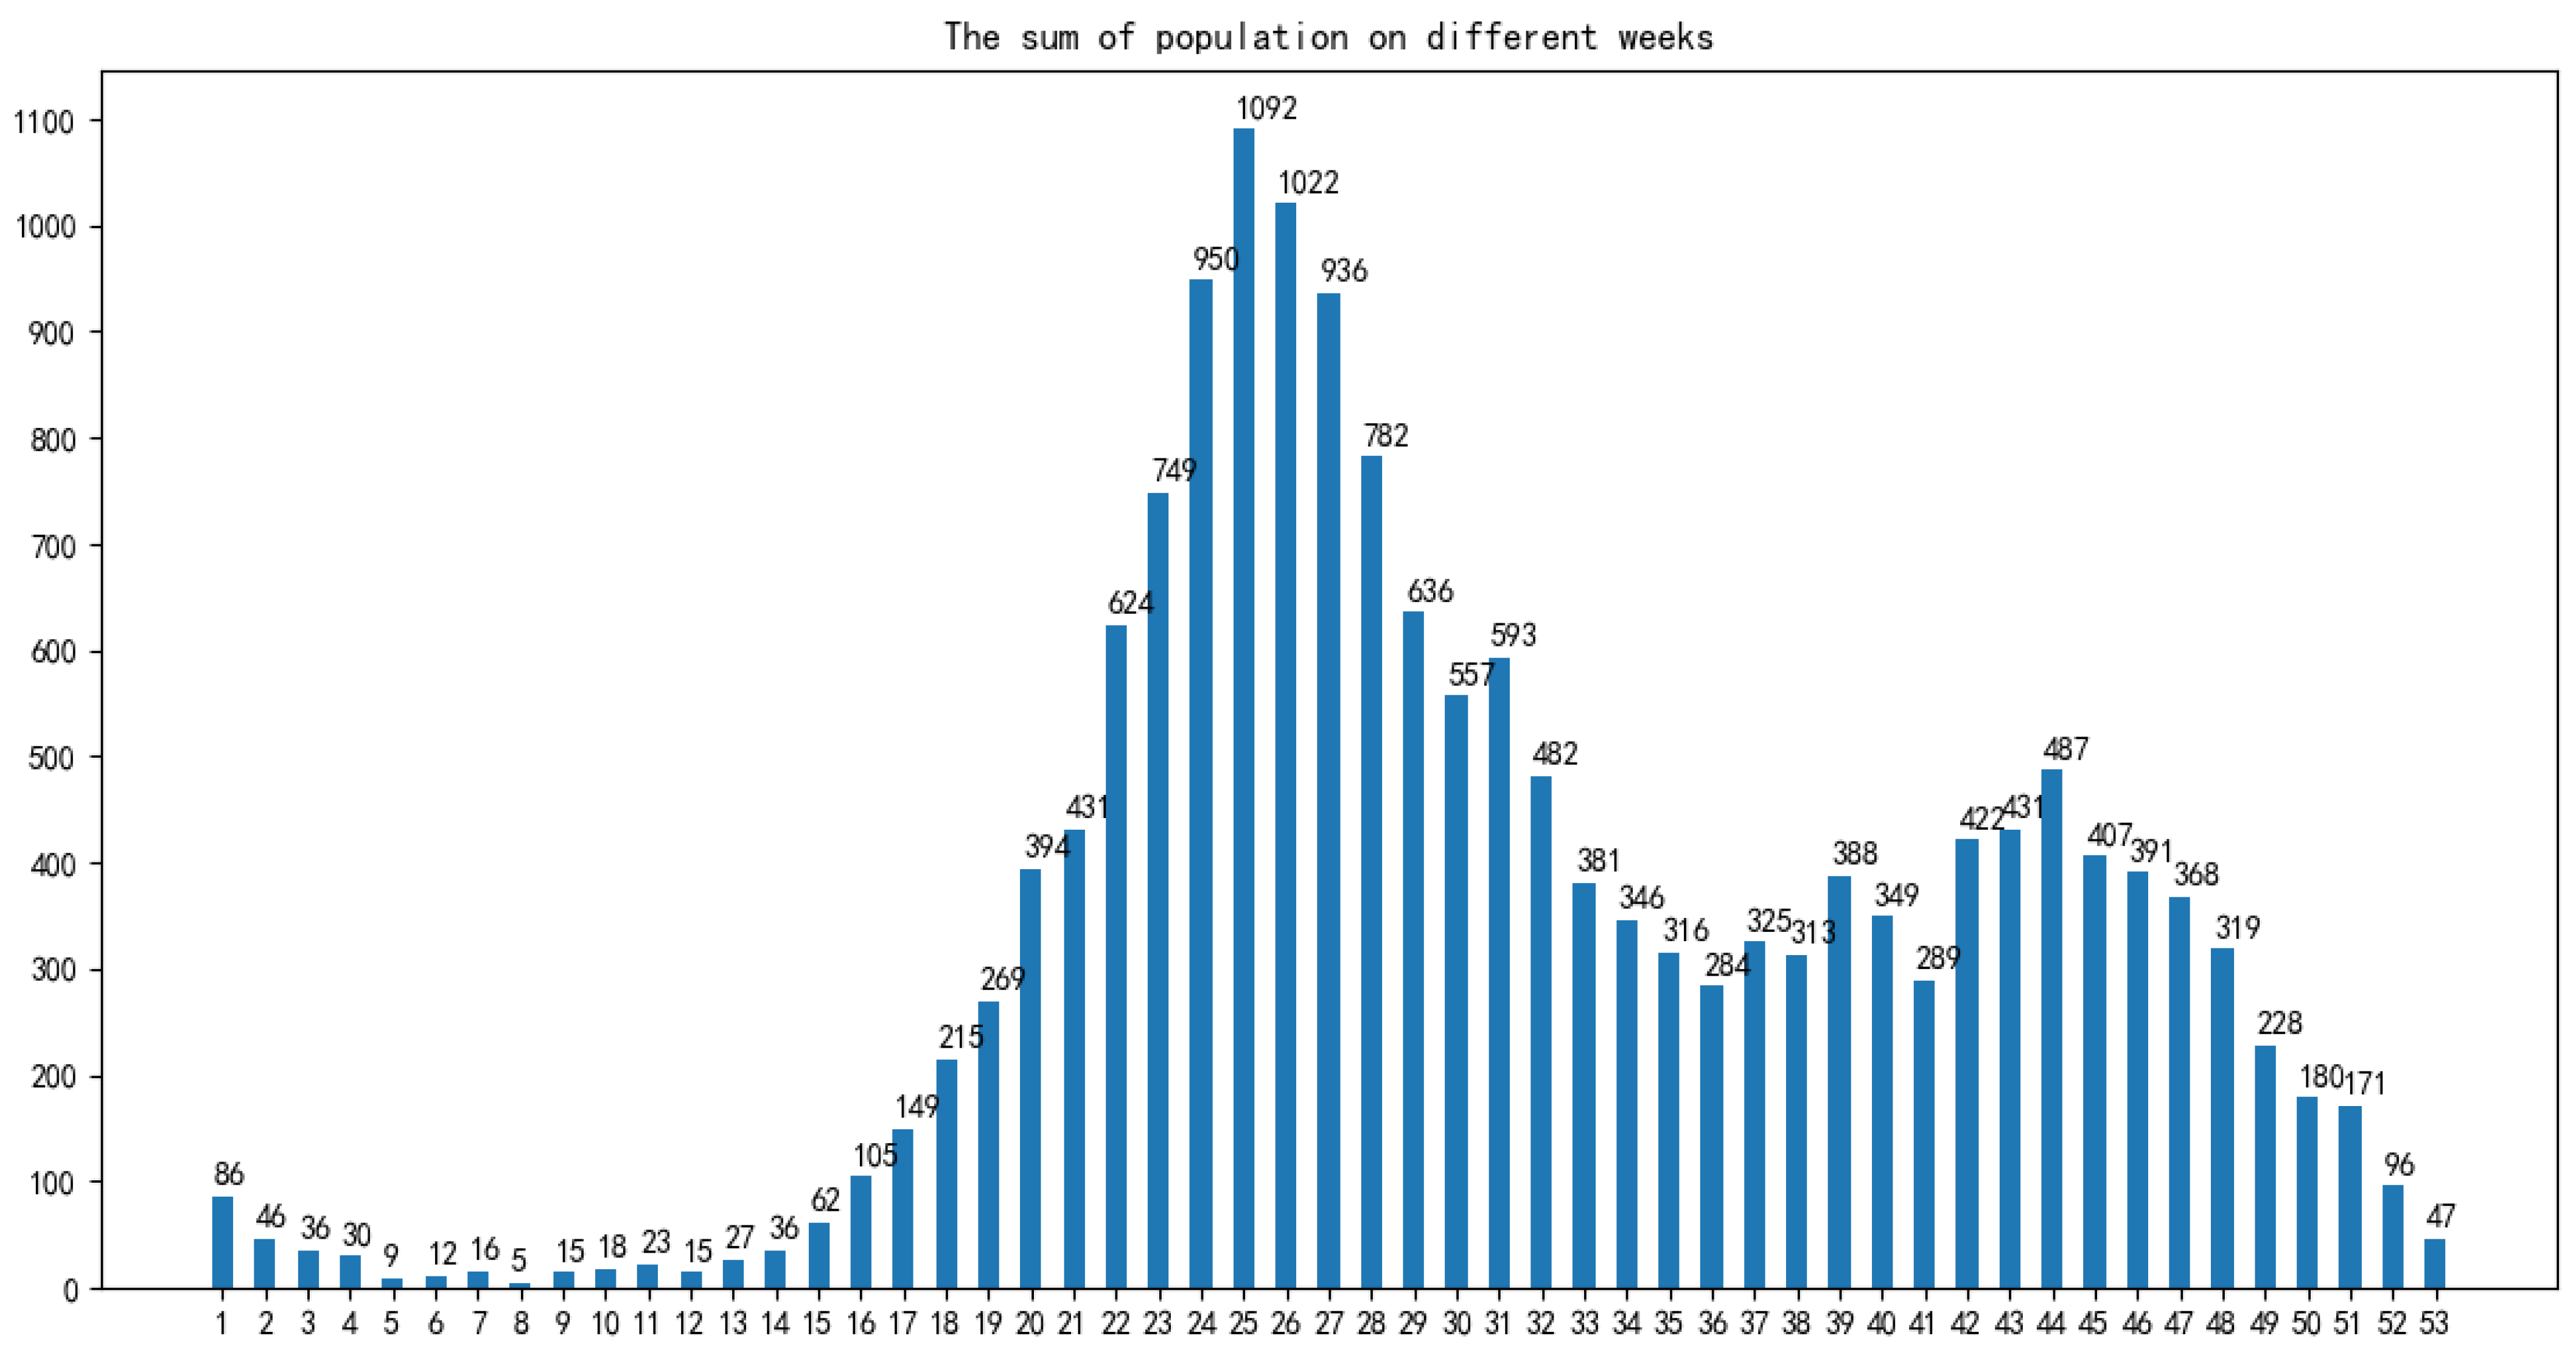
In terms of time: As shown in
Figure 4, the infection time of patients is mainly concentrated in 22–32 weeks (June-August). The 24th, 25th, and 26th week is the HFMD epidemic period, and the number of infections reaches a large peak. There are also multiple occurrences in 36–48 weeks, reaching a small peak of infection around the 44th week. Therefore, the prevalence of HFMD is characterized by a strong seasonal infection. The relevant weather indicators can be used as one of the important factors in determining the prevalence of HFMD.
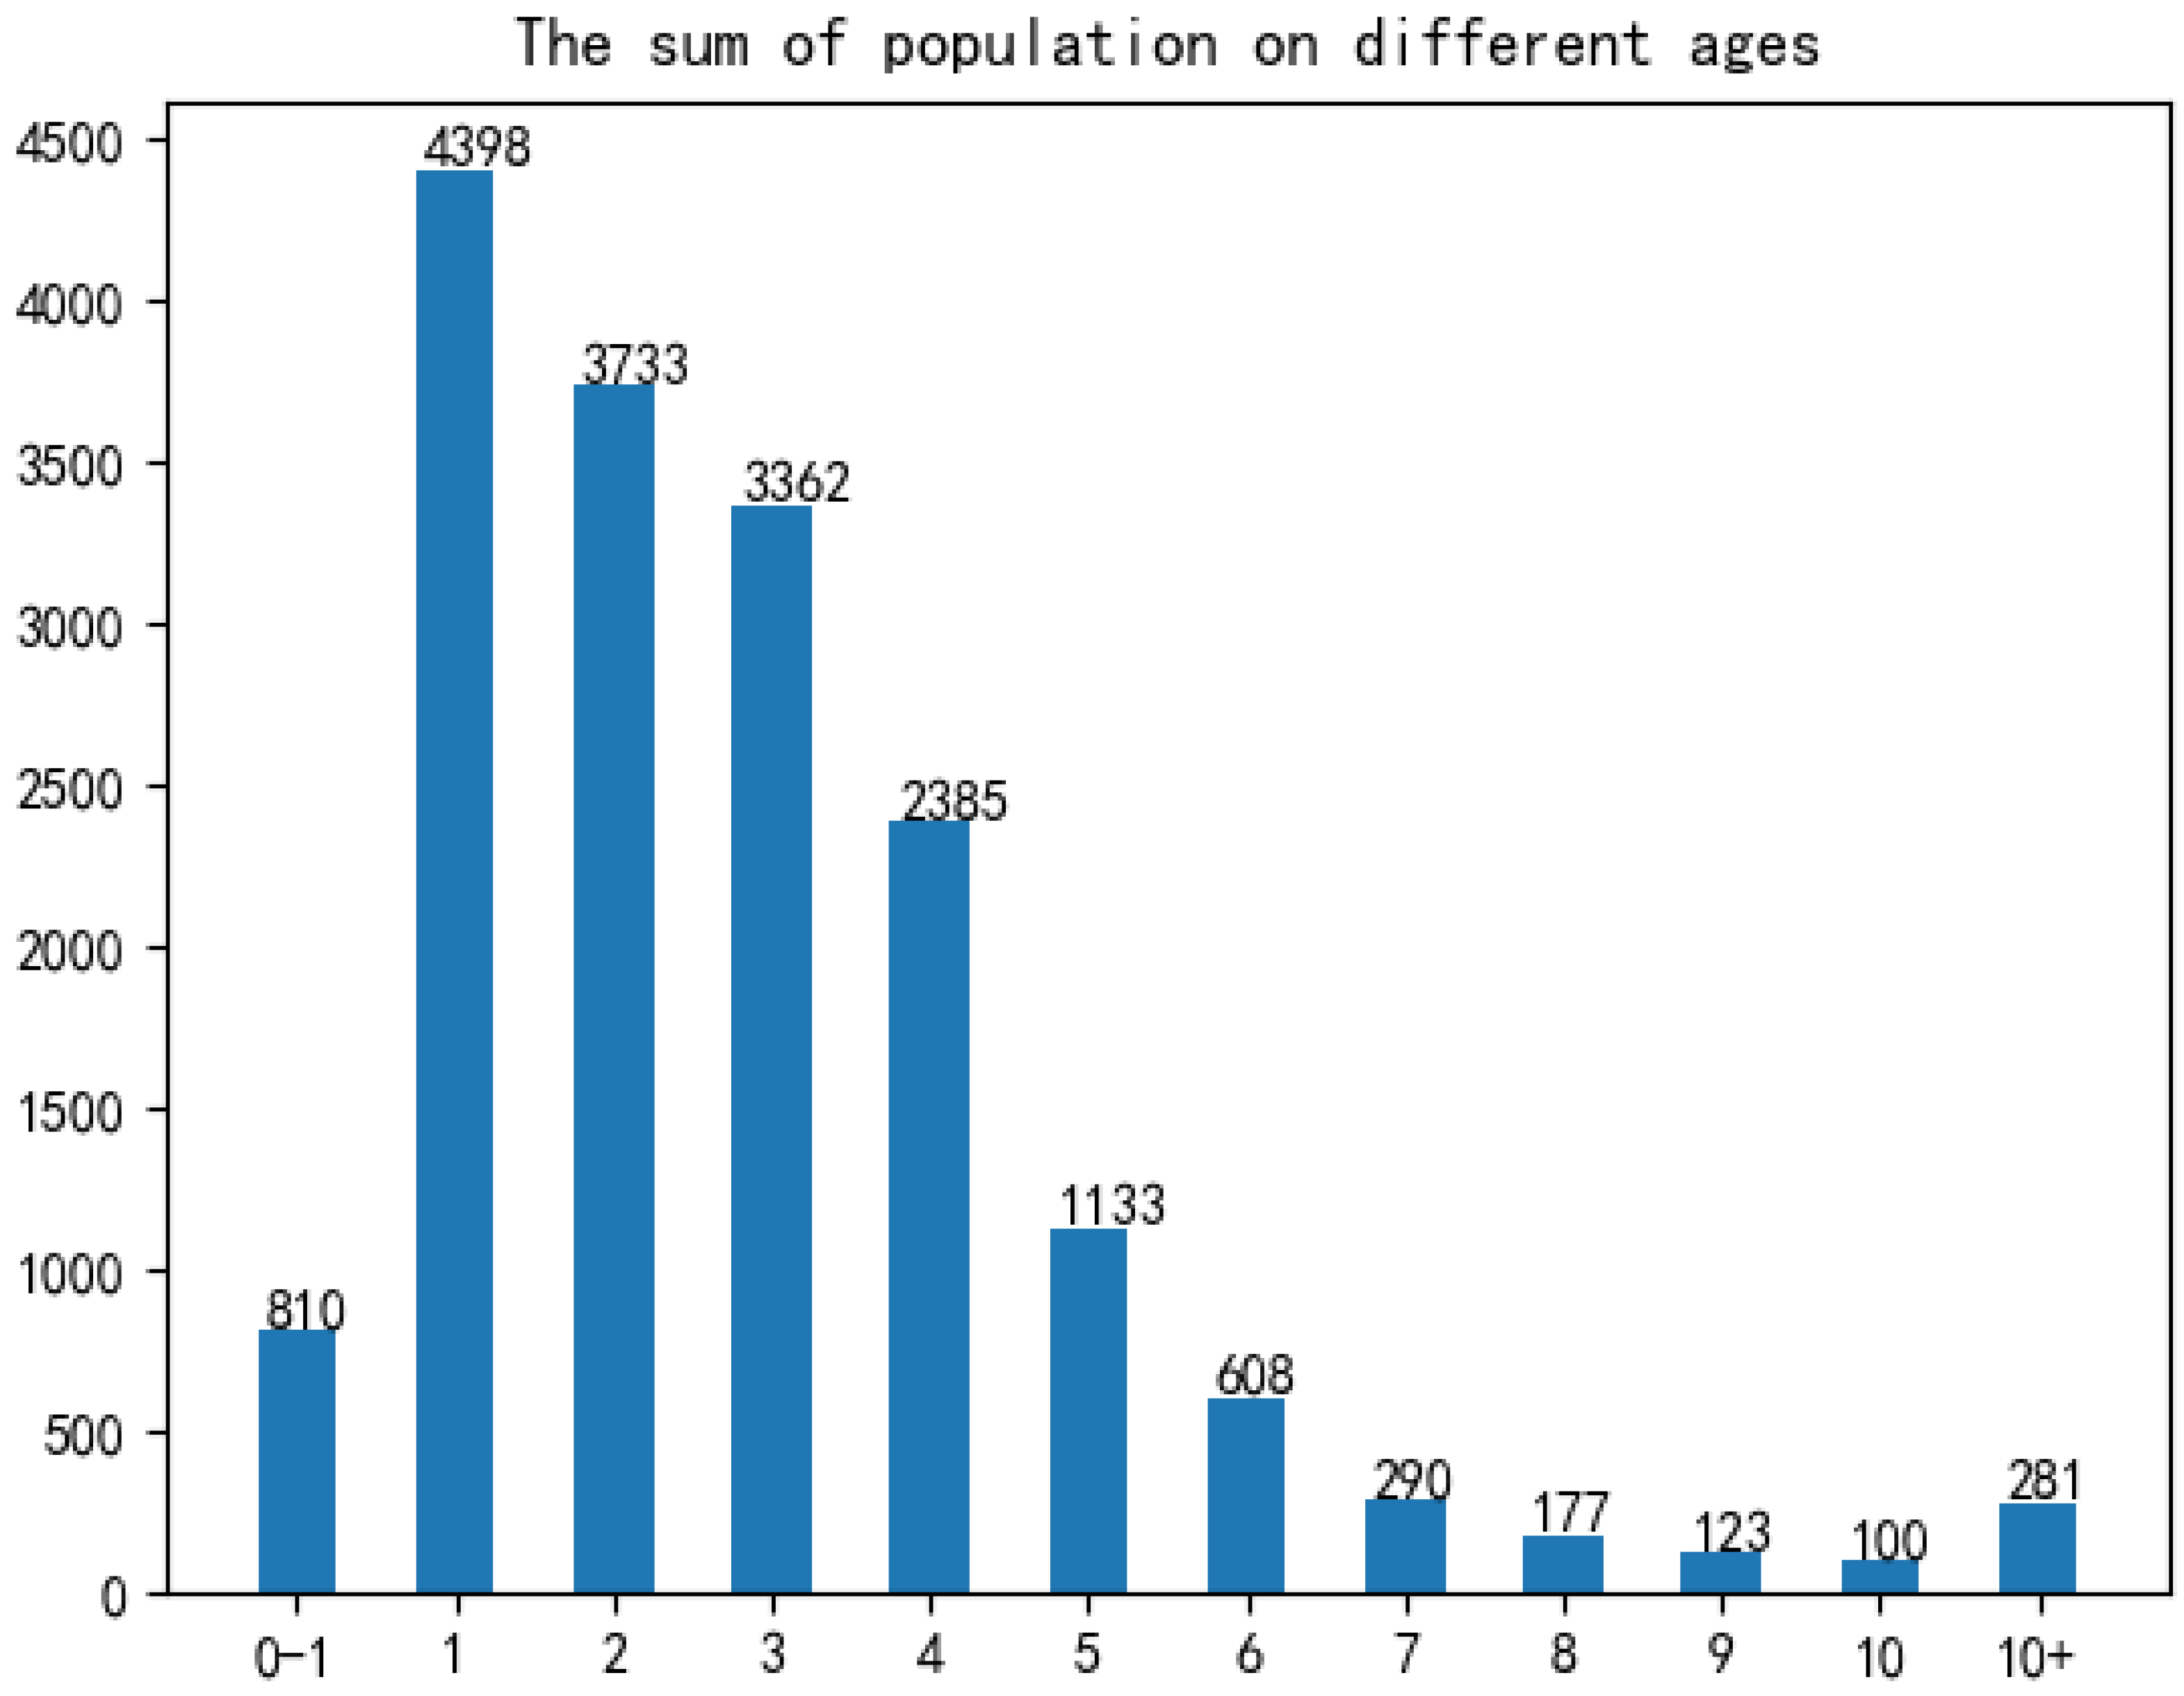
In term of age: As shown in
Figure 5, infants and children aged 0–6 years of HFMD infection account for a considerable portion, accounting for about 95% of all infected people.Therefore, the number of children aged 0–6 in each region can be used as an important indicator to predict the prevalence of HFMD.
After the epidemic analysis of the original data, according to the number of cases per day in each district and county, the statistics are summarized, and only the date, area and statistical incidence in the original data file are retained.
Then, according to the results of epidemic analysis, the daily weather of each district and county was obtained. Due to different weather data sources and different ways of data acquisition, some weather data (maximum temperature, minimum temperature, wind level) need to be obtained from lishi.tianqi.com by web crawler; the other part of weather data (sunshine duration, air humidity, average air pressure) is obtained by file download. Because this part of the weather data only exists in the meteorological stations in the province and the data index is stable, the three weather data of 18 meteorological stations in Shanxi Province are downloaded from the
http://data.sheshiyuanyi.com/WeatherData/, accessed on 1 March 2020, and the statistical areas are allocated according to the weather data of the nearest meteorological stations. Before the distribution, the nearest meteorological stations can be found by crawling the geographical location of the regions and meteorological stations, i.e., latitude and longitude data, and the three weather data of the nearest stations are allocated to the statistical areas; to consider the effect of the incubation period (usually 4 days) on the daily incidence of disease, the corresponding weather data of the day before 4 days were obtained, and the weather indexes such as maximum temperature, minimum temperature, wind grade, average sunshine duration, average air humidity and average air pressure were obtained in the same way.
Finally, according to the results of HFMD epidemic analysis, population data needs to be summarized, so the internal population data is calculated to count the number of children aged 0–6 in each region, and integrated into the data file generated in the previous step; at the same time, in order to consider the impact of the incidence of the day before the day on the day, the number of cases from the previous day is also included in the model characteristics to generate complete data for establishing the HFMD epidemic prediction model.
3.2. Data Preprocessing
The process of data preprocessing will greatly influence the result of data analysis [
20].
3.2.1. Missing Value Processing
Among the data related to the factors affecting the spread of HFMD, the weather data or the population data of districts and counties on the day have some variable values missing, so appropriate methods must be used to deal with them. First of all, for variables whose values are not collected and most of the individuals whose variables are missing, the simple deletion method is used to directly delete variables or individual data, and will not be included in experimental research and data analysis. Then, the nearest neighbor padding method is used to fill the attributes with stable attribute values and small numerical variance. Finally, the mean value filling method is used to deal with the situation where a small part of the data is missing.
3.2.2. Outlier Handling
The regional weather data obtained by the web crawler is identified through outliers, and it is found that some data is abnormal, so the outliers need to be replaced or corrected. First, for univariate factors, define constraints that meet actual needs, and use the mean replacement method for variable outliers that do not meet the constraint definition. That is, when the value of a certain variable of a certain object is found to be abnormal, the average value of all other normal and non-missing values on the variable is calculated to replace the abnormal value. Secondly, for multiple variable factors, the order of the highest temperature and the lowest temperature often changes due to changes in the structure and content of the crawler page. Therefore, it is necessary to identify the individual data with the lowest temperature higher than the highest temperature, and exchange the two to make the data meet the constraints.
3.2.3. Data Standardization
The Z-score standardization method used in this paper. This paper also uses a simple downgrading standardization method, because the number of population plays a crucial role in the incidence of HFMD, and the magnitude of the difference between the number of population and the actual incidence of HFMD is large, which is not conducive to analysis. Therefore, the value of this variable is degraded.
3.3. Feature Selection
Through the data preprocessing process, we finally established the data table shown in
Table 1.
When constructing the supervised learning model for the prediction of the number of HFMD cases, we maximized the fact that many a priori unknown related features (meteorological and demographic features) were incorporated into the learning objectives. So that the target problem (the number of HFMD cases) can be trained and learned more effectively. However, some of the related features are not very relevant to the learning goal, or even have no relationship. These features are usually called redundant features. When they are added to the learning task, problems such as poor learner performance and data disaster are likely to occur. Therefore, it is very necessary to select all features to greatly enhance the generalization ability of the prediction model. This paper uses a multivariate joint feature selection method based on correlation analysis.
In the study of the HFMD epidemic prediction model, three comprehensive feature selection algorithms including filtering, wrapping and embedding are used. Different methods are used in different training and learning stages, using filtering algorithms before training, using embedded algorithms during training, and using wrapped algorithms after training. In this way, the feature subset with the best performance is selected, the learner with the strongest generalization ability is selected, and the number of cases is predicted more accurately for scientific prevention and control.
The core of the embedded algorithm is to integrate the feature selection process into the model learning process, and the features are selected cleverly while learning, so the algorithm depends on the machine learning algorithm used. However, embedded algorithms are not used in the preprocessing of data in the early stage, and only used during model training.
The core of the wrapped algorithm is to directly use the evaluation index of the learner to reflect the pros and cons of the feature subset. The higher the accuracy of the learner, the better the feature subset. Therefore, it is necessary to repeatedly use different feature subsets to construct multiple learners until the best learner is obtained and the best feature subset is obtained.
The core of the filtering algorithm is to directly filter out undesirable features to filter out relatively good feature subsets. Then, without training the model, use an appropriate evaluation function to evaluate the pros and cons of the feature subset until the best evaluated feature subset is selected. Therefore, the feature selection of this method is independent of the target learner, and the advantage is that it is simple, efficient and fast.
Before the actual training of the learner, the filter method is usually used to select the features, and the dependency metric is used to evaluate the feature subset. At the same time, according to the results of the dependency measurement, the measurement threshold is set, and the features whose relevant indicators are greater than the threshold are selected, and further statistically significant tests are performed on them as a double standard for selecting features. At the same time, bivariate correlation analysis is difficult to escape the influence of confounding factors, so multiple linear regression analysis methods must be used to establish a regression model for the influencing factors and the number of hand, foot and mouth cases, and find the secondary confounding factors according to the partial regression coefficients. The previous filtering feature selection process is completed.
The selection process can be divided into the following steps:
Calculate the variance of all variables using a single variable analysis method;
Filter out attributes whose variance is greater than the variance threshold, and get a preliminary feature subset;
Using bivariate correlation analysis method, calculate the Pearson coefficient, Spearman coefficient, distance correlation coefficient and p-value of the independent variable and the dependent variable;
According to the correlation coefficient and statistical p-value results, select the features whose p-value is less than the significance level and the correlation coefficient is greater than the coefficient threshold to obtain a more accurate initial feature subset;
According to the feature subset selected by the variable analysis method, establish a multivariate joint regression model based on the multiple linear regression model, and obtain the partial regression coefficient, intercept and statistical p-value of the model;
According to the multiple regression parameter table, filter and select variables whose p value is less than the significance level, and obtain the feature subset in the linear model;
Then the k features with the largest nonlinear correlation coefficients in the initial feature subset, which do not exist in the linear model feature subset, are included in the nonlinear model feature subset.
3.4. Construction of HFMD Prediction Model
Commonly used machine learning regression prediction algorithms include multiple linear regression (LR), support vector regression (SVR), differential integrated moving average autoregressive models and BP neural networks [
15] and so on. Through analysis, we will select BP neural network to construct an early prediction model for HFMD on big data.
After analysis of related factors, seven related variables were obtained. After these seven related variables are normalized by Min-Max, the training set and the test set are randomly selected according to the ratio of 7:3. Then input the training set into the prediction model to be established, and train and adjust the parameters in the model. After a series of training processes, a HFMD epidemic prediction model suitable for solving this problem is obtained. Then input the test set into the HFMD prevalence prediction model for prediction, obtain the prediction result, and compare the result with the expected output to evaluate the HFMD prevalence prediction model.
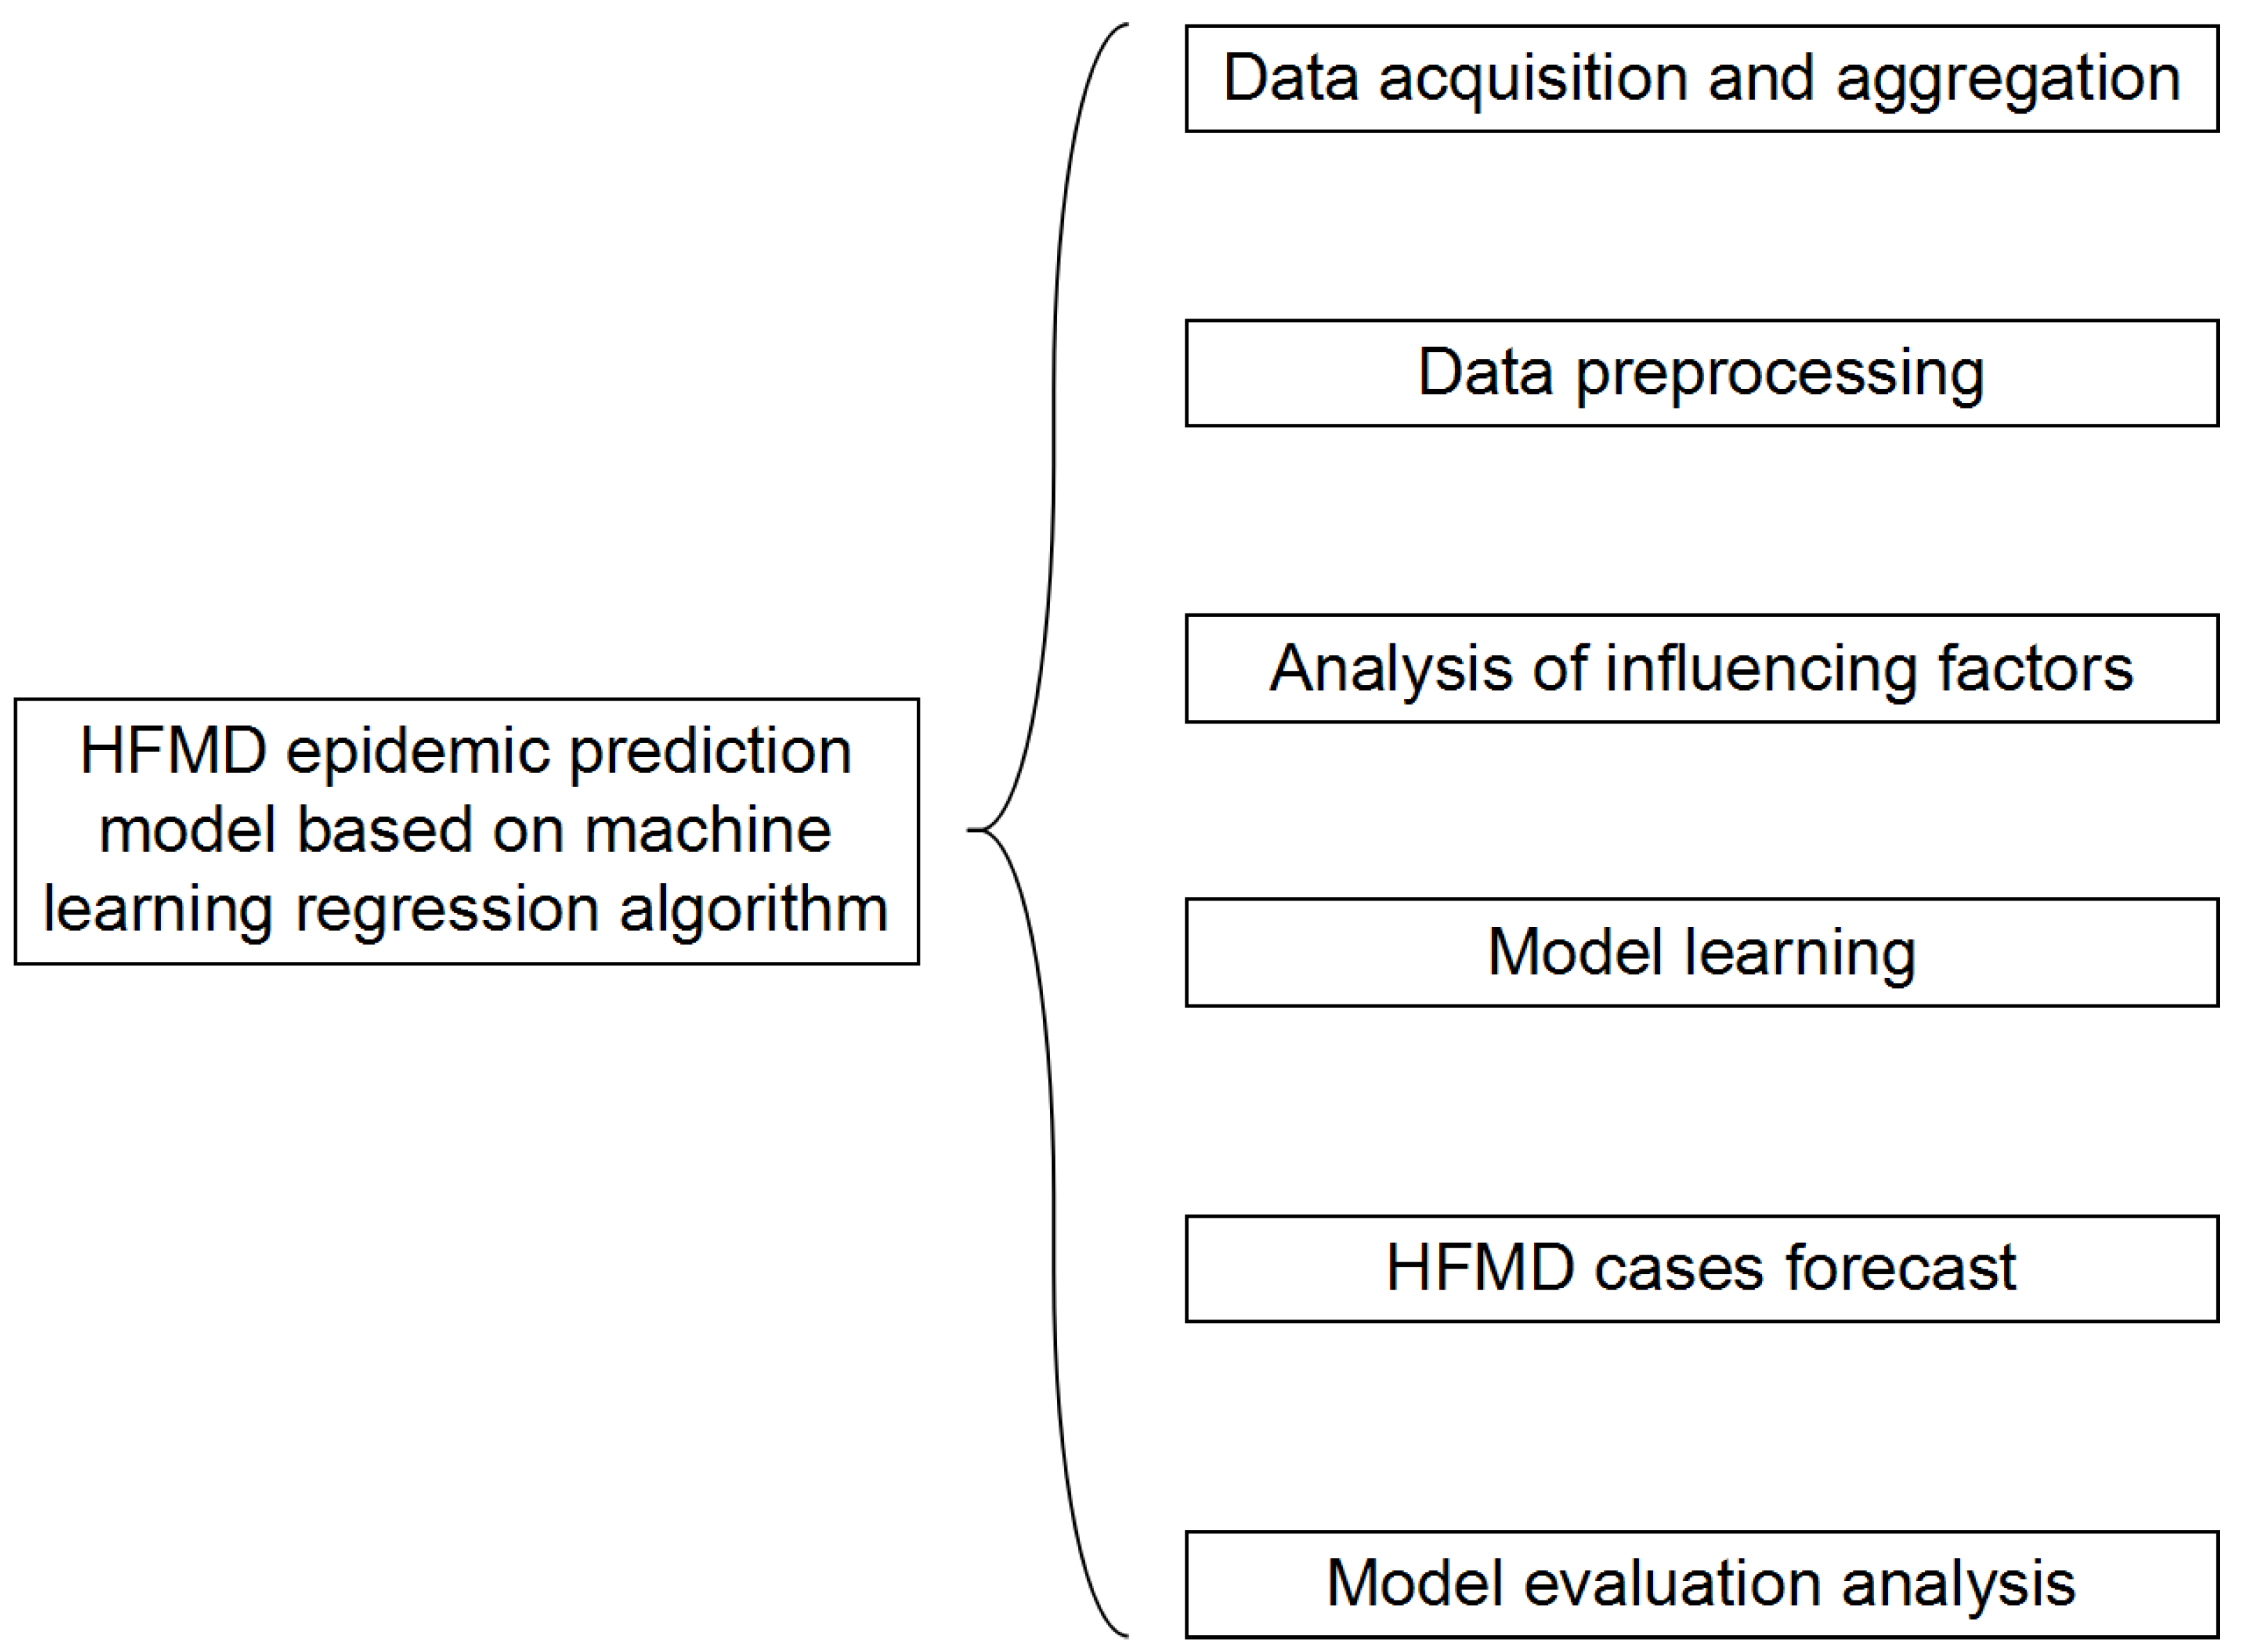
The structure of the HFMD prediction model based on the machine learning regression algorithm is shown in
Figure 6. It includes six modules: data acquisition and summary, data preprocessing, influencing factor analysis, model learning, epidemic case number prediction, and model evaluation analysis. In the data acquisition and summary module, the meteorological factors and demographic factors data related to the HFMD epidemic are acquired in multiple ways, and the county daily data is summarized as city weekly data; the dirty data is mainly cleaned in the data preprocessing module; in the influencing factor analysis module, univariate, bivariate and multivariate joint analysis of the correlation between influencing factors and the number of popular populations are carried out, and the feature set of relevant HFMD epidemic influencing factors suitable for modeling is selected; in the process of model learning, the machine learning regression model is used to learn to obtain the optimal structure; in the HFMD epidemic case number prediction module, the test set is input into the model; in the model evaluation and analysis module, the learned optimal model is analyzed with different weights on the training set and the test set, and the relevant evaluation index values are obtained to judge the pros and cons of the model.
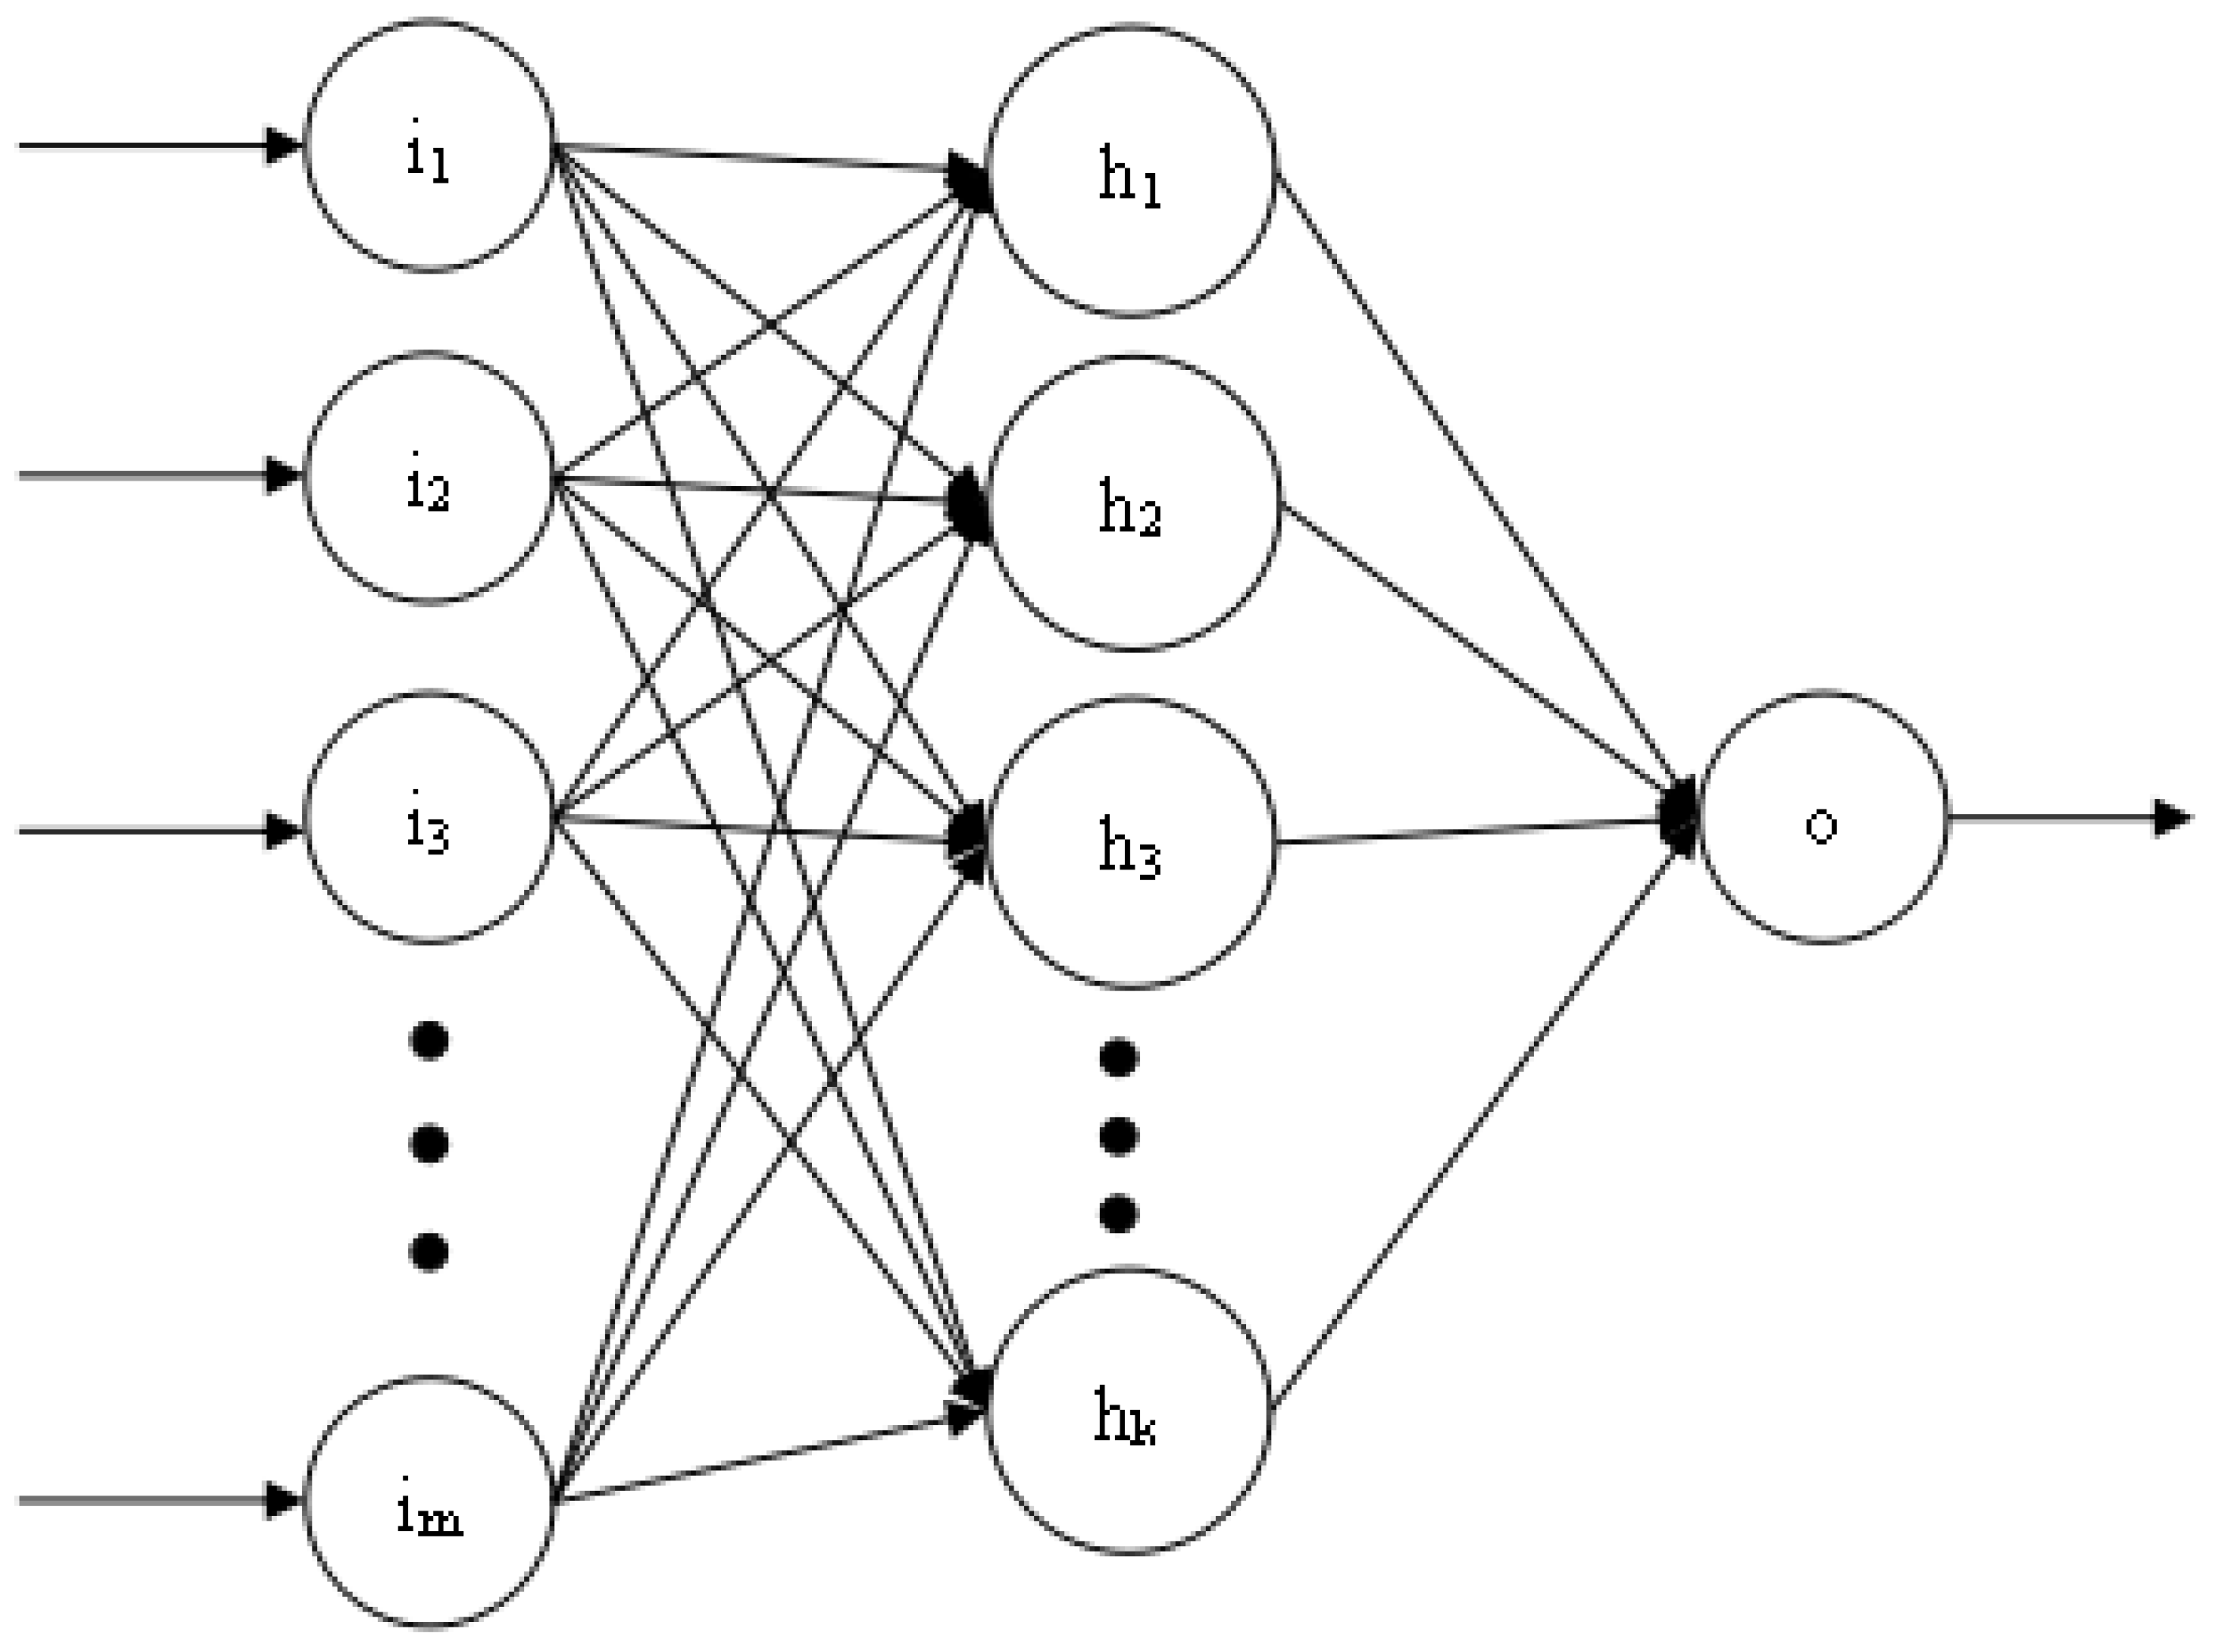
Figure 7 shows the three-layer structure of the BP neural network used in this article. The number of neurons in each layer is
m,
k, and 1, respectively. The number of hidden layers and the number of neurons in each layer can be dynamically adjusted according to the training effect. However, the number of neurons in the first and last layers is fixed. The training process of BP neural network is realized by error feedback mechanism [
16]. The activation function used is the relu function.
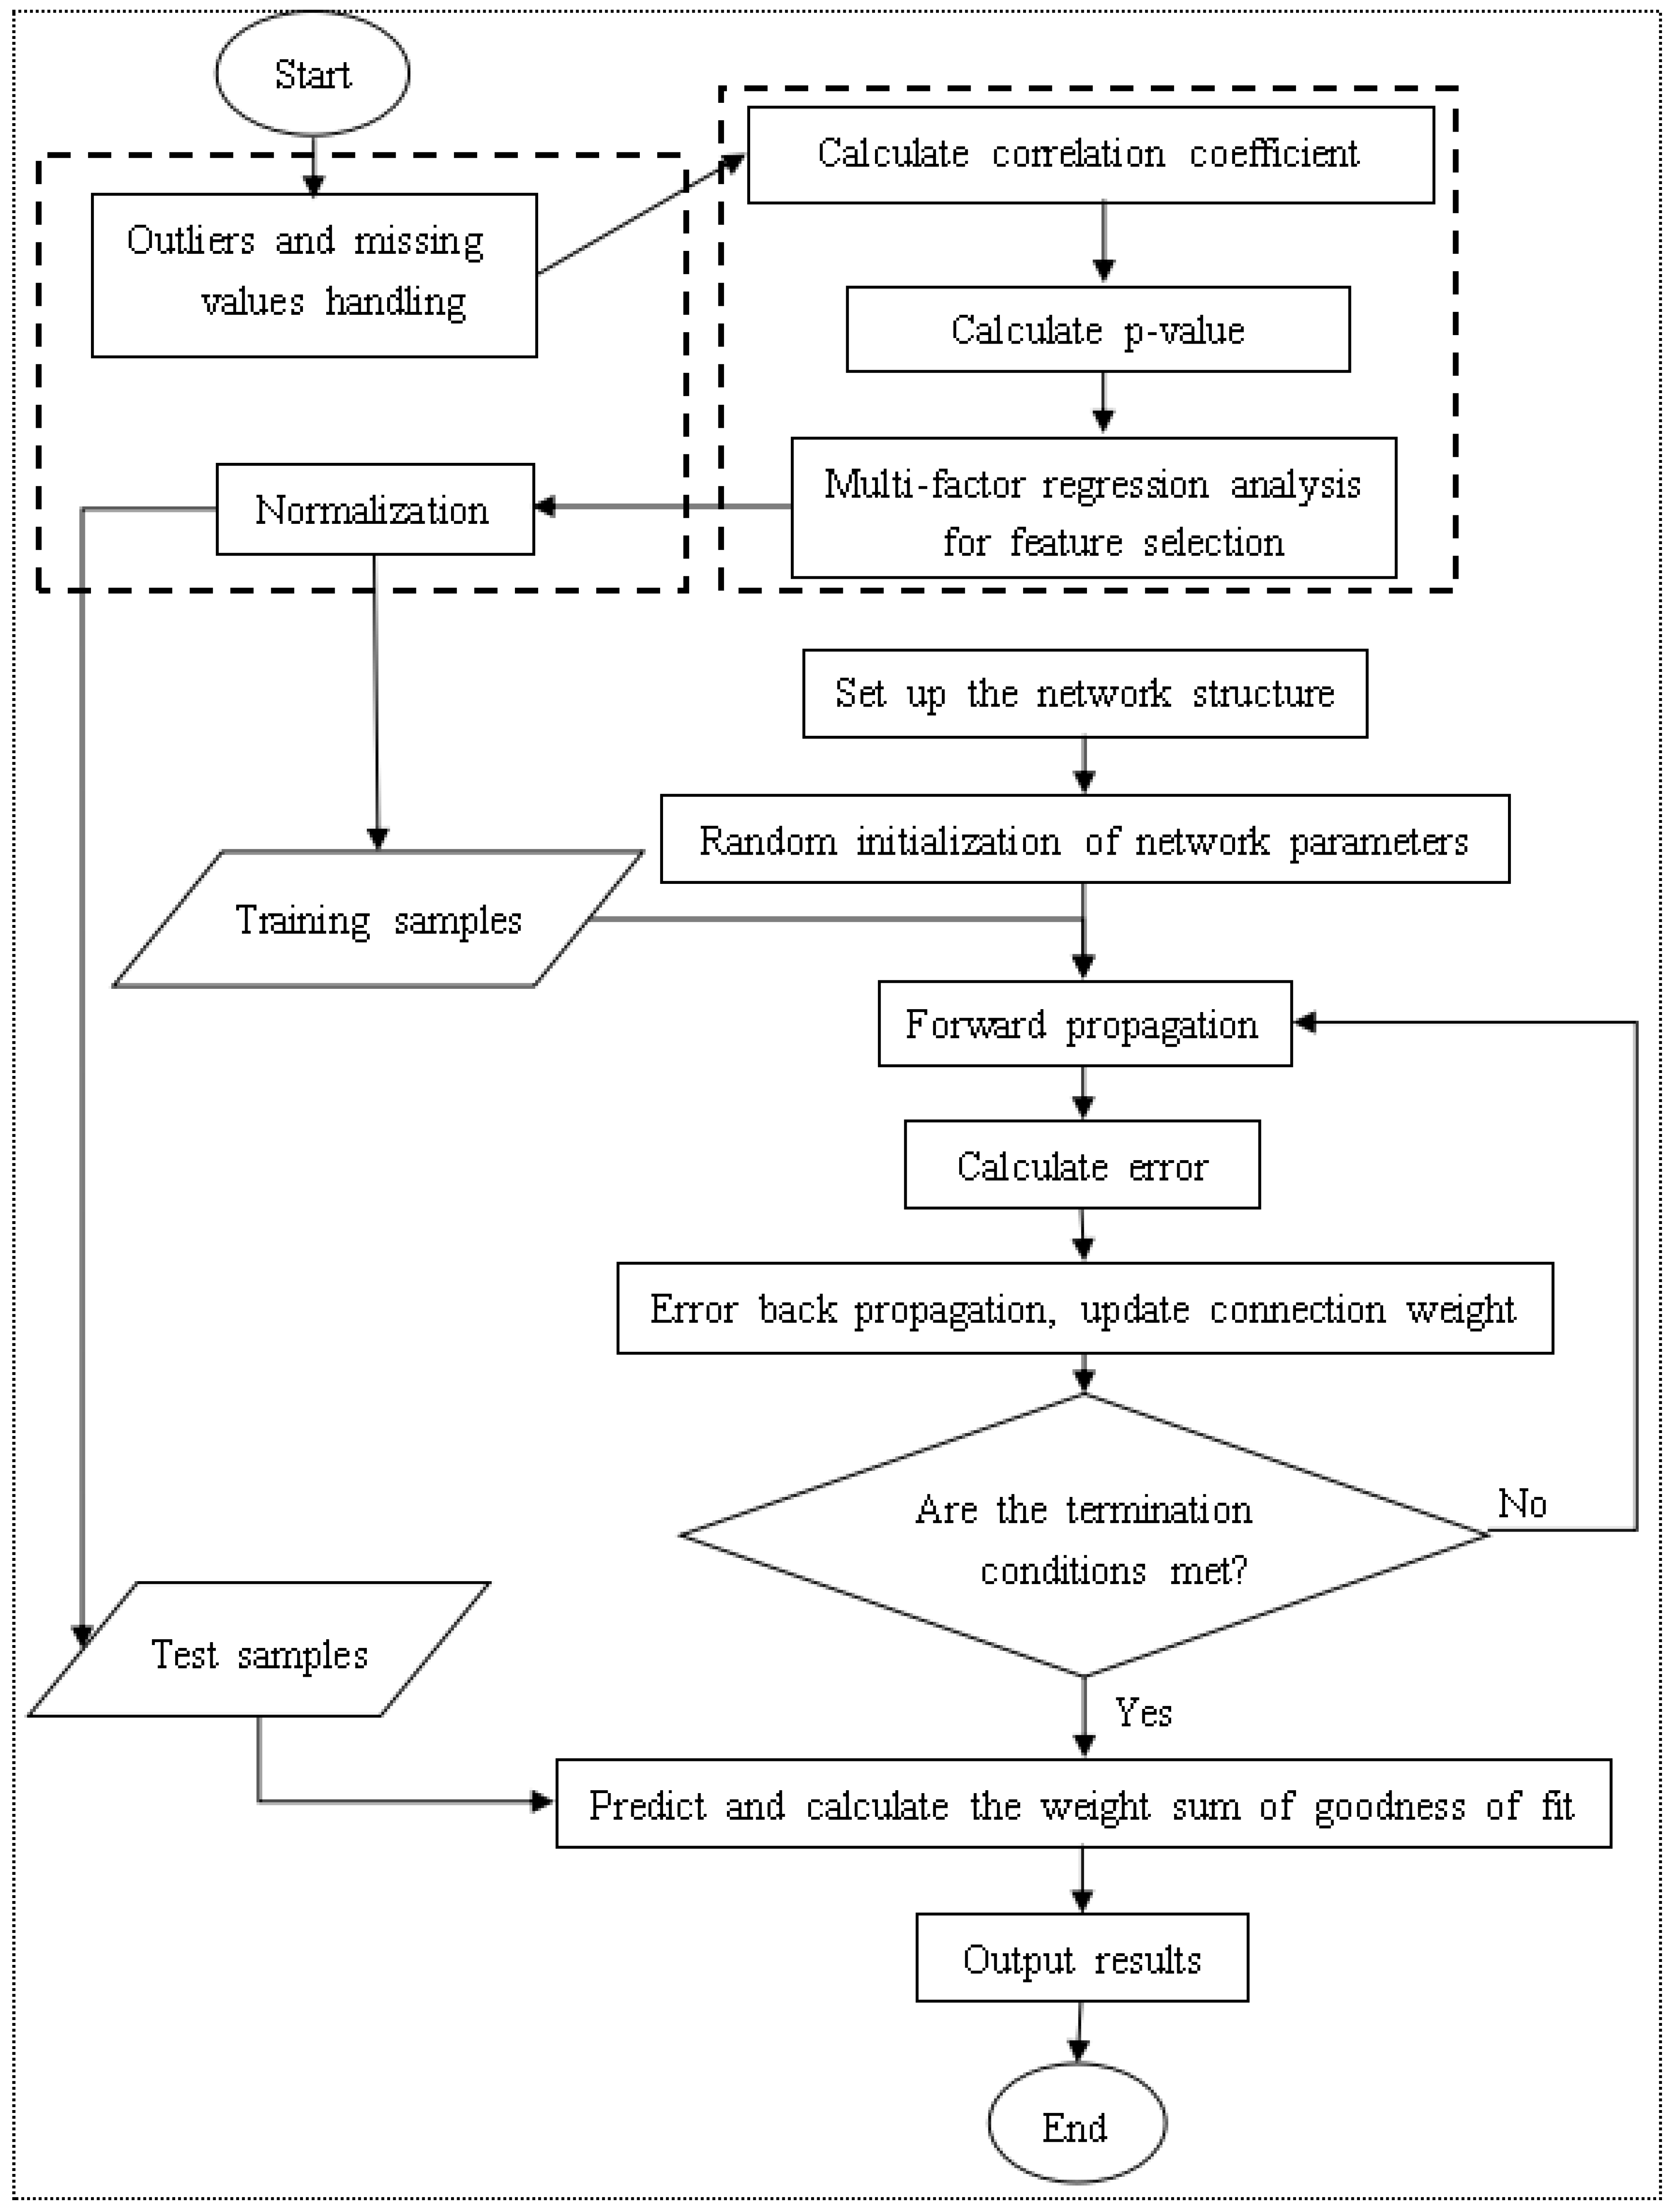
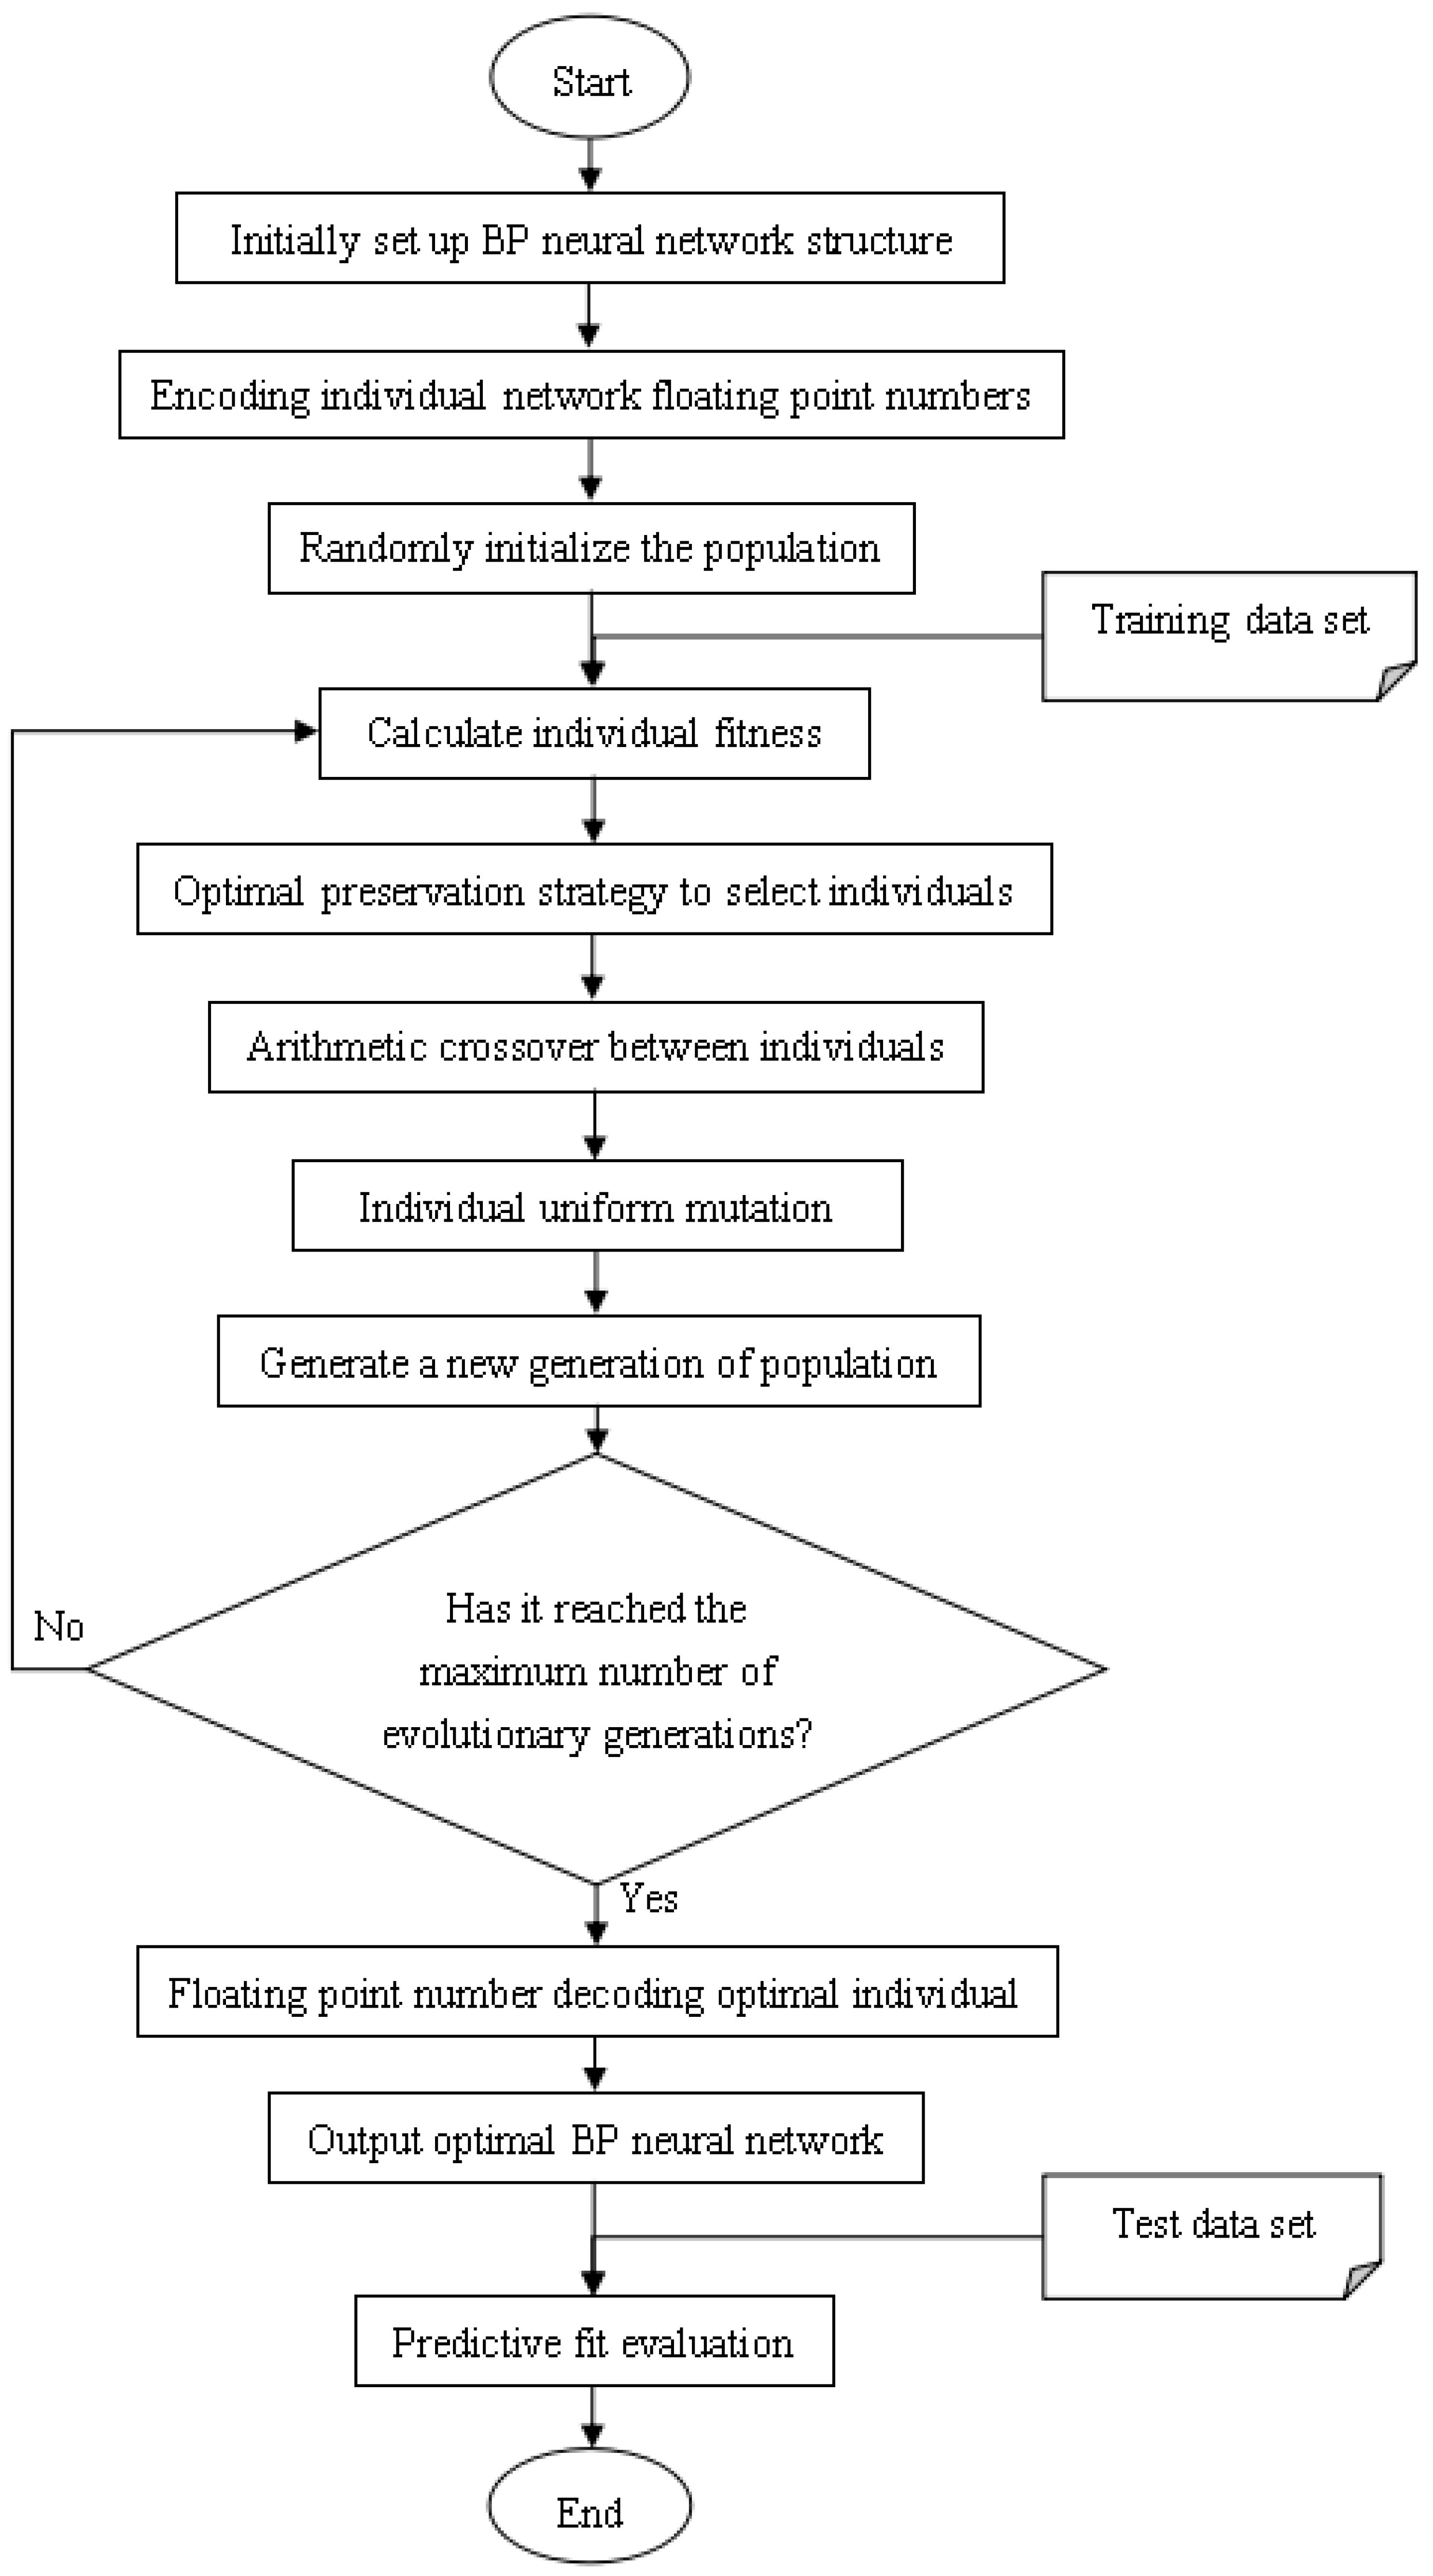
The model training process is:
Establish the network structure according to the actual HFMD prediction problem. There is only one input layer and output layer, which contain the number of neurons as the feature number and 1, respectively. A hidden layer with k neurons is initially set. If the training result is not Ideally, the number of layers and the number of neurons on each layer can be dynamically changed, but not more than three hidden layers;
Initialize the hyperparameters in the network structure, including learning rate, training times, and connection weights. If the training results are not ideal, the hyperparameter values can also be dynamically adjusted;
Start to input training samples into the network, obtain the predicted value of each sample through the forward propagation process, and calculate the overall error between the output predicted value and the expected value;
If the error does not meet the condition or the training does not reach the number of generations, the error is propagated back to the input layer, and the connection weight is updated in the process;
If it is greater than the set number of generations, the training process is ended, the structure of the BP neural network is output, and the test data is evaluated according to relevant indicators;
If the test result does not reach a certain threshold, it is necessary to adjust the relevant hyperparameters or the number of hidden layers or the number of neurons in each hidden layer in the network, and repeat the above training process.


