
A Model for the Implementation of Lean Improvements in Healthcare Environments as Applied in a Primary Care Center


Abstract
1. Introduction
- The Spanish population has the longest life expectancy in the European Union, standing at 83.4 years in 2017, 2.5 years above the European average. This is largely due to advances in medical treatments, which have meant a notable reduction in mortality and an increase in longevity of four years in the last two decades. This entailed an increase in health expenditure to 2371 Euros per inhabitant, of which 71% was publicly funded and 29% privately funded. Specifically, Spanish health expenditure amounted to 8.9% of the Gross Domestic Product (GDP), though still lower when compared to the 9.8% average in the European Union.
- The National Health System (NHS) provides a broad level of coverage, reducing financial, social, and geographic barriers to accessing care.
- The level of decentralization of services is reflected in the 17 health systems that manage healthcare resources across the Autonomous Communities.
- Waiting lists in the NHS remain a persistent problem. At the end of 2019, 704,997 people were awaiting a date for surgery, 5% more than the previous year. Specifically, 1.5% of the Spanish population was on the waiting list for surgery and 6.5% for consultations and diagnostic tests.
- Primary care is a key part of health services. However, coordination between different levels of care remains an organizational challenge, especially in order to improve care for chronic diseases.
- A health system unprepared for rapid growth in the flow of patients, which would lead to increased costs from more human resources (labor), materials (equipment) and financial resources (income).
- Reduced waiting times.
- Improved patient satisfaction.
- Improved productivity.
- Reduced costs.
- Service capacity increase.
- Improved response time to patient/patient demands.
- Improved staff satisfaction.
- Reduced number of errors.
- Diagnostic tools: Value Stream Mapping (VSM).
- Operational tools: 5S, Single-Minute Exchange of Dies (SMED), Total Productive Maintenance/Team approach to problem solving (TPM), Kanban.
- Tracking tools: Visual Management (VM), Key Performance Indicator (KPI).
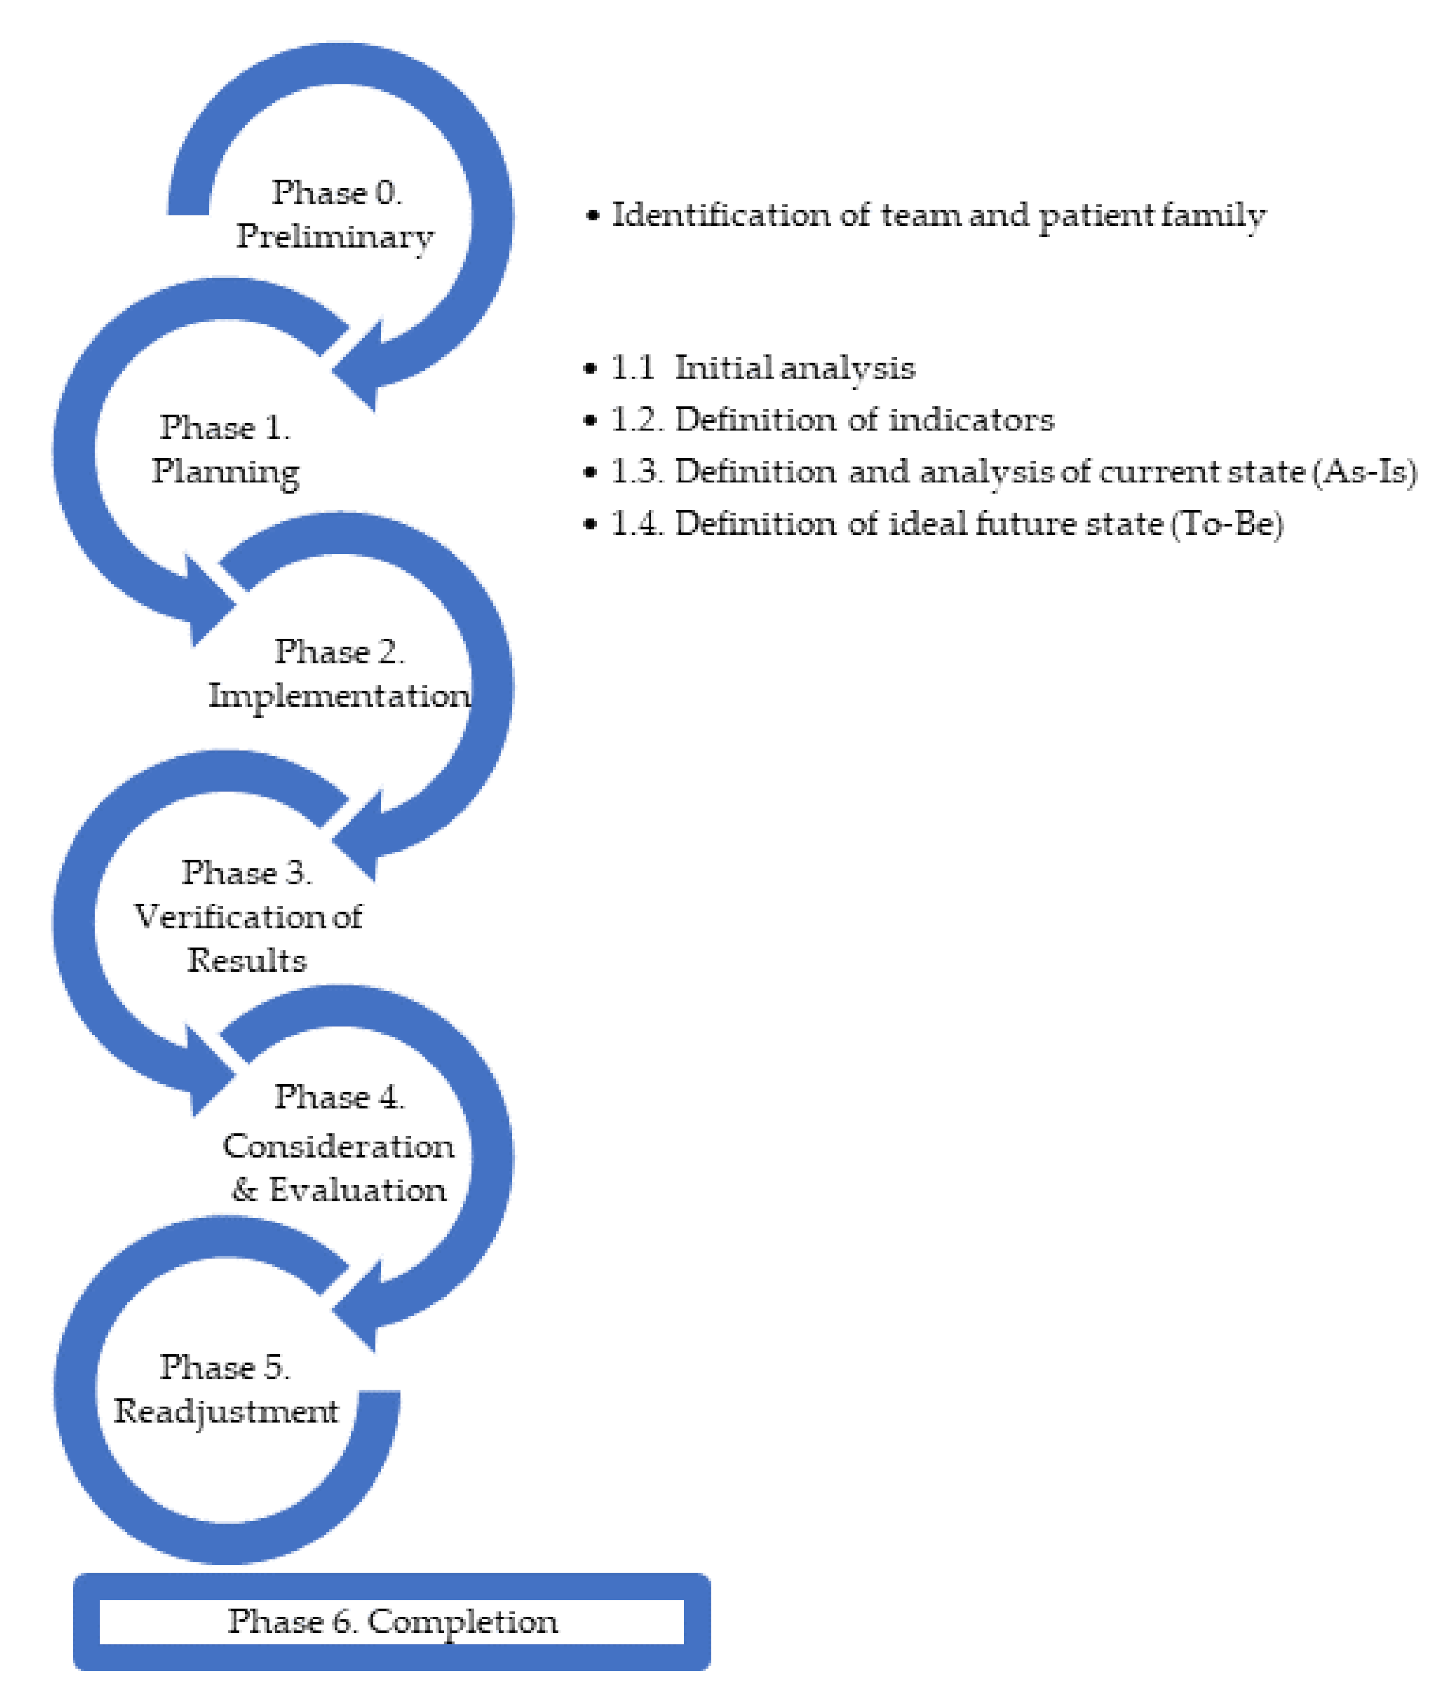
2. Materials and Methods: Model for the Implementation of Process Improvement in a Healthcare Environment
- It is applied to improve specific practices. Action research is based on action, evaluation, and critical analysis of practices based on data collected to introduce improvements in relevant areas. It enables the creation of knowledge.
- It is facilitated by the participation and collaboration of a number of people with a common purpose. It requires close collaboration between the researchers and the organization.
- It focuses on specific situations and their context. Results are obtained from the efficiency of the process carried out.
- Plan to initiate the change.
- Implement the change (act), observe the implementation process and its consequences.
- Collect and review data.
- Reflect and evaluate.
- Readjustment.
- The improvement promoter: A person within the organization with the capacity (formal power) to provide resources and impose changes as necessary [60].
- The facilitator: A person who must have the quality to know and validate the tools to be followed and at the same time must understand the needs of the organization. This will allow the process to be followed and fulfilled with the necessary rigor [46].
- Specific: Number or percentage that avoids generality.
- Measurable: Number or series of numbers that allow the measurement of its effectiveness.
- Achievable: Objective is achievable.
- Realistic: Objective is realistic.
- Time-limited: There must be a timeline for when it must be met.
- Analyze the project closing with the team.
- Establish future improvements based on the actions not implemented and the objectives not reached.
- Summarize the lessons learned in this process for future processes.
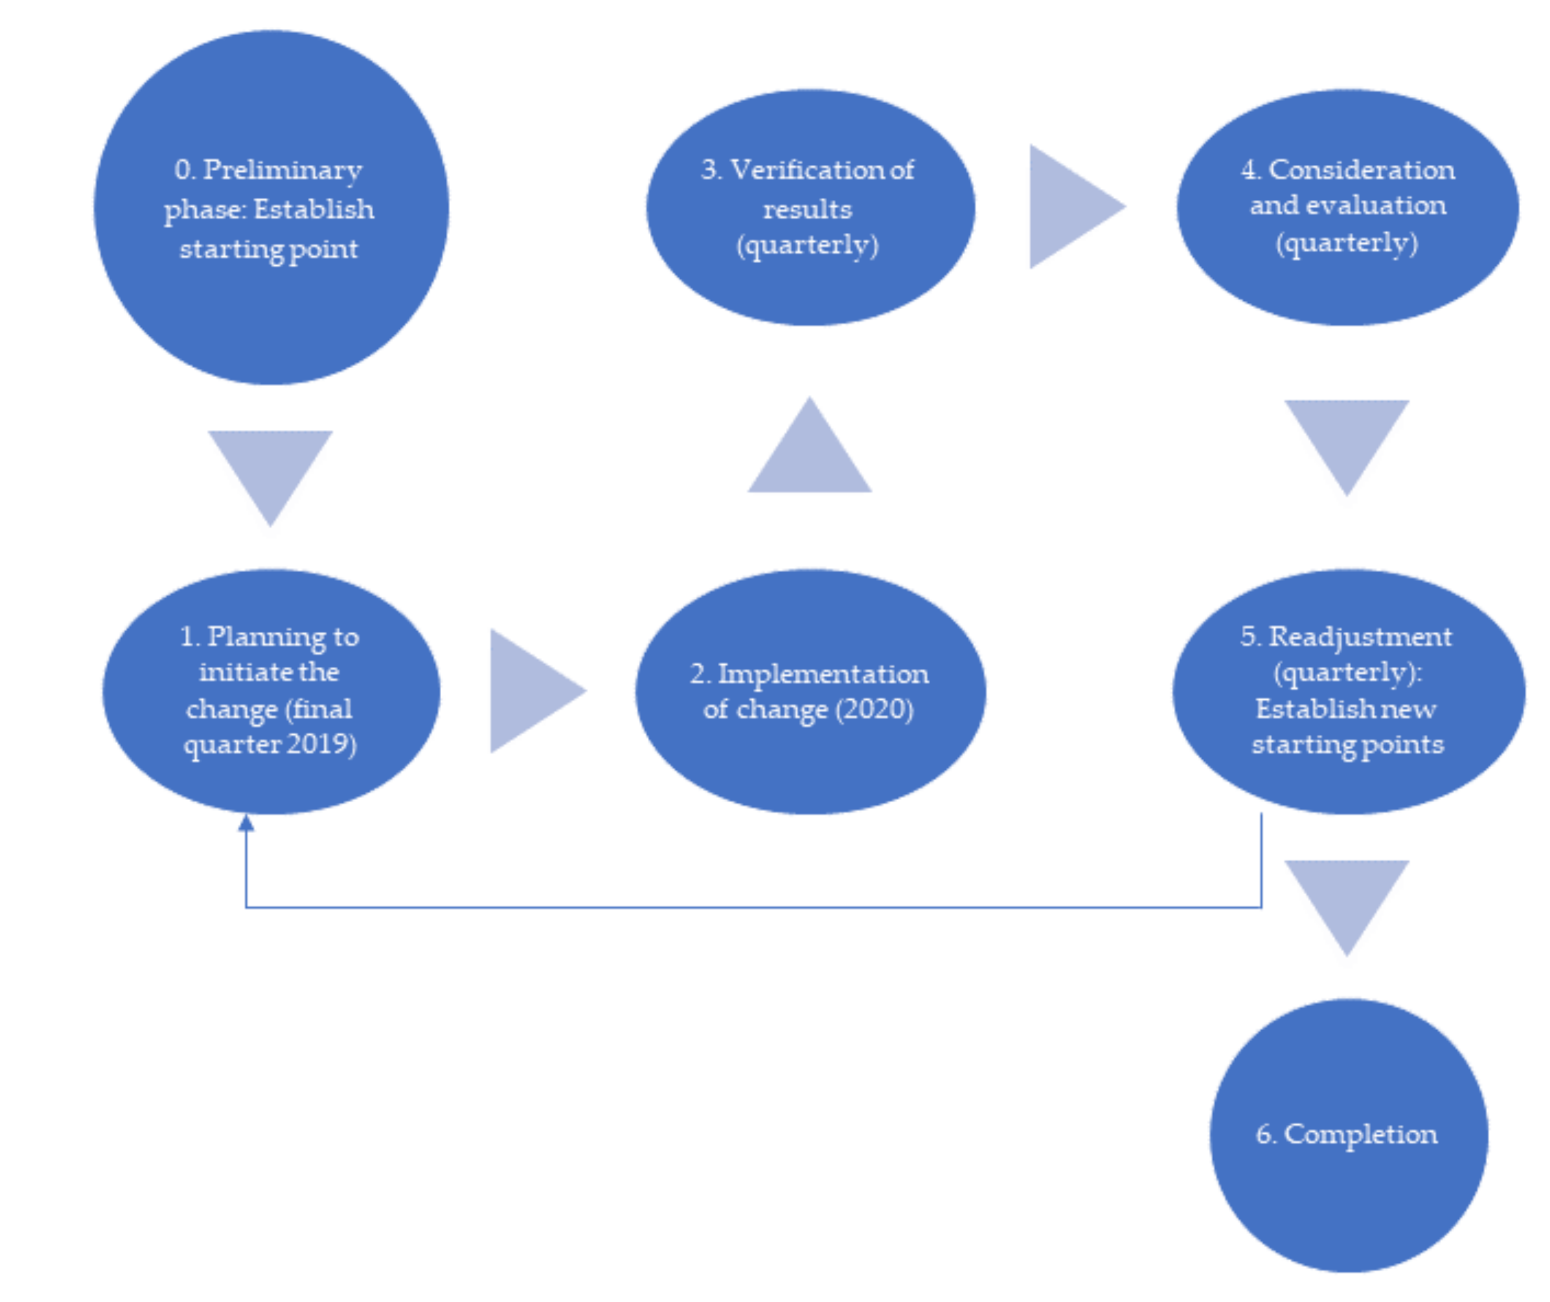
- From Q4 2019 to Q1 2020.
- From Q1 2020 to Q2 2020 (Covid-19).
- Q4 2019:
- Create a working group to analyze the processes of the primary care center.
- Identify opportunities for improvement.
- Establish an action plan with its corresponding actions.
- Establish indicators to measure the results.
- Implement the actions.
- 2020 and forward:
3. Application of the Proposed Model to a Primary Care Center for the Improvement of Patient Care
- O1: Improve the quality of patient care at the Health Center.
- O2: Improve worker satisfaction as indicated.
- O3: Improve professional satisfaction.
- Number of emergency visits: Represents the number of emergency or walk-in visits that arrive and that are scheduled at health centers in a given period of time.
- Number of scheduled visits: Represents the number of demand appointments scheduled in a given period of time.
- Number of telephone appointments for emergencies.
- Number of telephone appointments for a scheduled activity.
- Number of workers providing direct patient care service.
- Delayed care: Number of business days until a patient can make a scheduled appointment.
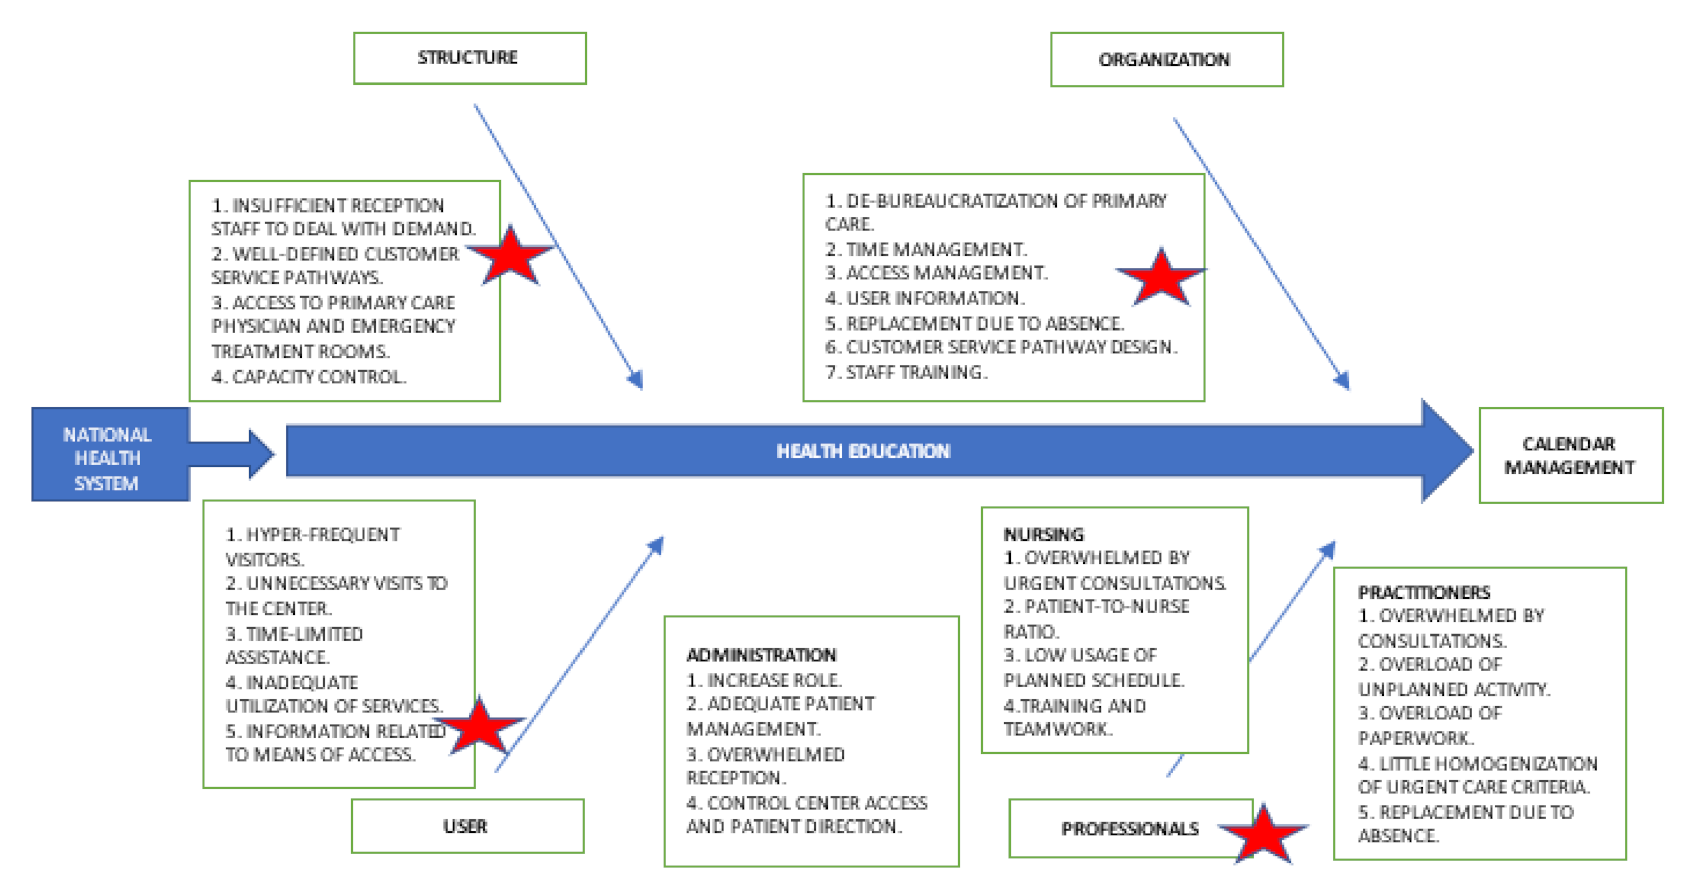
- Patient-dependent factors.
- Primary Care Team-dependent factors.
- Factors dependent on the organization of the center.
- Factors dependent on the structure of the center.
- Factors dependent on the laws that regulate the National Health System.
- The number of visits decreased by approximately 4.6%, from 66,604 to 63,563. Of a total of 63,563 visits, approximately 80% were programmed visits.
- The number of scheduled appointments increased by 9.62%, while the number of visits dropped by only 4.6%.
- The number of unscheduled appointments reduced by 57%. These data were relevant when compared with the total number of views, which were virtually the same as in the last quarter of 2019.
- The emergencies attended were approximately 15% of the total visits.
- The delay, whose ideal standard of 2 days was virtually achieved, having dropped from 2.46 to 2.02 days.
- The work carried out had a positive impact as shown by the indicators and the various improvements achieved.
- The actions resulted in improved patient care, but one quarter was not considered enough time for definitive conclusions. In addition, a tool should be developed to collect customer satisfaction data with respect to the actions carried out.
- The staff noticed a lessening of their workload and therefore have been able to perform better, but a tool is also needed to collect job satisfaction data.
- Table 7 above was created from the information gathered by those responsible for monitoring, as well as, to a certain extent, from the impressions conveyed by the staff. Therefore, there was a need to establish how to collect this information and make it uniform, easier to collect, and measurable.
4. Application of the Proposed Model to the Covid-19 Situation
- O1-Covid-19: Maintain accessibility to the health system for the Health Center’s reference population.
- O2-Covid-19: Ensure, as far as possible, the safety of care consultations for both healthcare professionals and for patients.
- O3-Covid-19: Improve information between the different levels of care, giving priority and resources to primary care centers, which were the first level of health care.
- Maintain the number of non-Covid-19 appointments (face-to-face or telematic).
- Maintain the number of face-to-face services at below 30%.
- Maintain an average delay of less than 3 days.
- Number of telephone appointments in scheduled activity.
- Number of face-to-face appointments in scheduled activity.
- Number of unscheduled urgent appointments.
- Number of appointments in Covid-19 calendar.
- Total visits.
- Delay.
- The number of non-Covid-19 appointments was maintained, either by face-to-face or by telephone. In this period, 48,113 patients were seen, compared to 63,563 in the first quarter of 2020 and 66,604 in the last quarter of 2019.
- The number of face-to-face services was less than 30% at a value of 24%.
- Considering the situation, the work carried out has had positive results, as shown by the indicators and the improvements achieved. However, the actions should be reviewed, mainly to reduce the delay in patient care.
- Due to the uncertainty of the situation as well as sudden changes caused by the peaks of health saturation, it was not possible to collect data concerned with patient satisfaction with care received, nor has it been possible to dedicate time to elaborate a tool to obtain this information as it is not the priority at this time.
- In terms of working environment, the staff suffer stress due to saturation, which is diminished when the new agenda is applied. Yet, this change is not enough. As is the case with patient data, it has not been possible to devote time to the development of a tool to collect data connected with job satisfaction.
- As in the previous phase, Table 10 was drawn up from information gathered by the managers and the impressions given by the staff. There is still a need to establish a method of collecting this information, making it uniform, easier to collect (i.e., not adding to the existing workload), and measurable. Again, it is not considered a priority at this time.
- The priority is to adjust the actions to reduce the delays in patient care, which have increased considerably, as shown by the indicators.
5. Discussion
6. Conclusions
- Implementing and adapting the Lean philosophy in the healthcare sector can help to make the necessary changes and improvements discussed in the introduction. In this particular case, identifying the need to reorganize the agendas according to the care needs mainly allowed the reduction of the worker care load, highlighted the need to create new patient care circuits according to the type of appointment thereby reducing waiting times for patients, and revealing how to better readjust human and material resources.
- The applicability of new Lean working methodologies makes it possible to be more sustainable in the long term in the different aspects covered by sustainability, which are summarized below:
- Economic sustainability: Patient care times are reduced and improved and both material and human resources are managed more efficiently.
- Social sustainability: Internal work circuits are improved and the level of work stress is reduced due to the adaptation and continuous change of protocols that are adapted to the needs of the population and its environment. This has a positive impact on patients’ perception of the service provided.
- Environmental sustainability: Secondarily and after the establishment of specific protocols, exposure to biological risks, among others, can be minimized, contributing to environmental improvement.
- The methodology proposed here can be extrapolated and used in other primary care centers to facilitate and reduce the barriers and limitations that are generated when working and introducing it for the first time.
7. Limitations and Future Lines of Research
- Measuring the satisfaction of patients and workers at the Health Center. Still pending is the development of questionnaires to measure satisfaction, but the situation up to publication had not allowed it. Comments were based on the ad hoc feedback received from both the staff and the patients.
- As Lean implementation progresses, we might also consider the possibility of consolidating research with Six Sigma methodology, which facilitates the application of statistical methods and techniques for continuous improvement.
- The indicator times were established through observation of the calendars and follow-up with patients by the medical director and principally the nursing coordinator. Still pending is the development of a tool to collect information in a uniform, easy, and measurable way.
- At the quantification-of-results level, comparison with the post Covid-19 stage was virtually impossible due to the variability of the new processes, which were subject to constant changes, the declaration of the state of alarm, and their sustainability over time.
- Study the advantages and disadvantages of the various Lean tools as well as other alternatives in order to determine which of them are the most appropriate for the organization’s situation.
- Hospital management has considered replicating this methodology in other primary care centers and other areas in order to assess and improve their management and at the same time, to check whether the proposed methodology would serve as a checklist for the management being carried out.
- In terms of sustainability, the Lean philosophy contributes greater value to economic and social sustainability, having a much smaller impact on environmental sustainability.
Author Contributions
Funding
Institutional Review Board Statement
Informed Consent Statement
Data Availability Statement
Conflicts of Interest
References
- Bonet, J.L.; Bonet, J.L.; Coronil, A.; del Castillo, A.; Ibern, P.; Madera, V.; Mayol, J.; de Baranda, P.S.; Trilla, A. Informe sobre las Reformas e Innovaciones que requiere el Sistema de Sanidad español (IRISS). 2020. Available online: https://docuhttps://documentos.fedea.net/pubs/fpp/2020/06/FPP2020-08.pdfmentos.fedea.net/pubs/fpp/2020/06/FPP2020-08.pdf (accessed on 31 July 2020).
- Díaz, A.; Pons, J.; Solís, L. Improving healthcare services: Lean lessons from Aravind. Int. J. Bus. Excell. 2012, 5, 413–428. [Google Scholar] [CrossRef]
- Rodríguez Santiago, J.M. Análisis de Eficiencia en el Sector Sanitario; Escuela Técnica Superior de Ingeniería: Sevilla, Spain, 2020. [Google Scholar]
- Marin-Garcia, J.A.; Garcia-Sabater, J.P.; Ruiz, A.; Maheut, J.; Garcia-Sabater, J.J. Operations Management at the service of health care management: Example of a proposal for action research to plan and schedule health resources in scenarios derived from the COVID-19 outbreak. J. Ind. Eng. Manag. 2020, 13, 213–227. [Google Scholar] [CrossRef]
- Instituto para la Mejora de la Asistencia Sanitaria (IMAS). Los Sanitarios Frente a la COVID-19. Available online: http://sectcv.es/wp-content/uploads/2020/10/LOS_PROFESIONALES_SANITARIOS_FRENTE_A_LA_COVID-19.pdf (accessed on 31 October 2020).
- Marco, J.C.S.; Montes, M.T.P.; Aparicio, M.S.; Pardo, M.L. Experiencia de desescalada en la Zona Bàsica de Salut d’Oliva. Model de citació en Atenció Primària. Rev. De Med. De Fam. Y Atención Primaria (FML) 2020, 25, 7. [Google Scholar]
- Adán, M.A.; García, M.C.G.; Pons, I.R.; Mares, A.A.R.; Casanova, A.P.; Plasencia, M.J.R. Observatorio de Atención Primaria de la Comunidad Valenciana. “Resultados de la encuesta de organización de Atención Primaria durante la pandemia COVID-19. Rev. De Med. De Fam. Y Atención Primaria (FML) 2020, 25, 6. [Google Scholar]
- Morrison, I. Health Care in the New Millennium: Vision, Values, and Leadership; Jossey-Bass: San Francisco, CA, USA, 2000. [Google Scholar]
- Sinha, N.; Matharu, M. A comprehensive insight into Lean management: Literature review and trends. J. Ind. Eng. Manag. 2019, 12, 302–317. [Google Scholar] [CrossRef]
- Condori, D.G.; Likhodei, M. Aplicación de Lean Manufacturing en el Sector Sanitario. 2020. Available online: https://uvadoc.uva.es/handle/10324/41715 (accessed on 30 September 2020).
- García-Altés, A.; Ortún, V. Reformas pendientes en la organización de la actividad sanitaria. Cuad. Económicos De ICE 2018, 96, 57–81. [Google Scholar] [CrossRef]
- Nino, V.; Claudio, D.; Valladares, L.; Harris, S. An Enhanced Kaizen Event in a Sterile Processing Department of a Rural Hospital: A Case Study. Int. J. Environ. Res. Public Health 2020, 17, 8748. [Google Scholar] [CrossRef] [PubMed]
- Zepeda-Lugo, C.; Tlapa, D.; Baez-Lopez, Y.; Limon-Romero, J.; Ontiveros, S.; Perez-Sanchez, A.; Tortorella, G. Assessing the Impact of Lean Healthcare on Inpatient Care: A Systematic Review. Int. J. Environ. Res. Public Health 2020, 17, 5609. [Google Scholar] [CrossRef]
- Taype-Huamaní, W.; Chucas-Ascencio, L.; la Cruz-Rojas, D.; Amado-Tineo, J. Tiempo de espera para atención médica urgente en un hospital terciario después de implementar un programa de mejora de procesos. Anales de la Facultad de Medicina 2019, 80, 438–442. [Google Scholar] [CrossRef]
- Vega, B. Gestión de Pacientes de un Servicio de Urgencia Hospitalaria; Universidad de la Palmas de Gran Canarias: Las Palmas, Spain, 2013. [Google Scholar]
- Sepetis, A. Sustainable Health Care Management in the Greek Health Care Sector. Open J. Soc. Sci. 2019, 7, 386–402. [Google Scholar] [CrossRef][Green Version]
- Walley, P. Designing the accident and emergency system: Lessons from manufacturing. Emerg. Med. J. 2003, 20, 126–130. [Google Scholar] [CrossRef]
- Prado-Prado, J.C.; García-Arca, J.; Fernández-González, A.J.; Mosteiro-Añón, M. Increasing Competitiveness through the Implementation of Lean Management in Healthcare. Int. J. Environ. Res. Public Health 2020, 17, 4981. [Google Scholar] [CrossRef]
- Dahlgaard, J.J.; Pettersen, J.; Dahlgaard-Park, S.M.; Langstrand, J. Quality and lean health care: A system for assessing and improving the health of healthcare organisations. Total Qual. Manag. Bus. Excell. 2011, 22, 673–689. [Google Scholar] [CrossRef]
- Hernández, J.; Vizaán, A. Lean Manufacturing Conceptos, Técnicas e Implantación; Fundación EOI: Madrid, Spain, 2013. [Google Scholar]
- Rajadell, M.; Sánchez, J. Lean Manufacturing: La Evidencia de una Necesidad; Díaz de Santos: Madrid, Spain, 2010. [Google Scholar]
- Lima, R.M.; Dinis-Carvalho, J.; Souza, T.A.; Vieira, E.; Gonçalves, B. Implementation of lean in health care environments: An update of systematic reviews. Int. J. Lean Six Sigma 2020. [Google Scholar] [CrossRef]
- Cottington, S.; Forst, S. Lean Healthcare: Get your Facility into Shape; HCPro: Danvers, MA, USA, 2010. [Google Scholar]
- Graban, M. Lean Hospitals: Improving Quality, Patient Safety, and Employee Satisfaction; Productivity Press: New York, NY, USA, 2009. [Google Scholar]
- Marin-Garcia, J.A.; Vidal-Carreras, P.I.; Garcia-Sabater, J.J. The Role of Value Stream Mapping in Healthcare Services: A Scoping Review. Int. J. Environ. Res. Public Health 2021, 18, 951. [Google Scholar] [CrossRef] [PubMed]
- Socconini, L. Lean Manufacturing. Paso a Paso; Marge Books: México City, México, 2019. [Google Scholar]
- Carter, P.M.; Desmond, J.S.; Akanbobnaab, C.; Oteng, R.A.; Rominski, S.D.; Barsan, W.G.; Cunningham, R.M. Optimizing Clinical Operations as Part of a Global Emergency Medicine Initiative in Kumasi, Ghana: Application of Lean Manufacturing Principals to Low-resource Health Systems. Acad. Emerg. Med. 2012, 19, 338–347. [Google Scholar] [CrossRef]
- Marin-Garcia, J.A.; Bonavia, T. Strategic Priorities and Lean Manufacturing Practices in Automotive Suppliers. Ten Years After. In New Trends and Developments in Automotive Industry; Gece Kitapligi: Çankaya/Ankara, Turkey, 2011; pp. 123–136. [Google Scholar]
- Elshennawy, A.K.; Bahaitham, H.; Furterer, S. Assessing Sustainability of Lean Implementation in Healthcare: A Case Study Using the Lean Sustainability Assessment Framework (LSAF). J. Manag. Eng. Integr. 2012, 5, 29. [Google Scholar]
- Machado, R.A. Gestión por Procesos de un Centro Médico; Escuela Politéctica Superior de Alicante: Alicante, Spain, 2020. [Google Scholar]
- Martinez, A.M.; Audor, J.S.M.; Muñoz, E.M.I. Propuesta de mejoramiento a través de la técnica VSM (Value Stream Mapping) para el área de Urgencias en una clínica de Popayan, Colombia. In Proceedings of the Congreso Internacional de Tecnología, Ciencia y Sociedad, Madrid, Spain, 3–4 October 2019. [Google Scholar]
- Tapping, D.; Luyster, T.; Shuker, T. Value Stream Management Eight Steps to Planning, Mapping, and Sustaining Lean Improvements, 1st ed.; Productivity Press: New York, NY, USA, 2002. [Google Scholar]
- Morell-Santandreu, O.; Santandreu-Mascarell, C.; García-Sabater, J. Sustainability and Kaizen: Business Model Trends in Healthcare. Sustainability 2020, 12, 10622. [Google Scholar] [CrossRef]
- Anuar, A.; Saad, R.; Yusoff, R.Z. Sustainability through lean healthcare and operational performance in the private hospitals: A proposed framework. Int. J. Supply Chain Manag. 2018, 7, 221–227. [Google Scholar]
- Kaplan, G.S.; Patterson, S.H.; Ching, J.M.; Blackmore, C.C. Why Lean doesn’t work for everyone. BMJ Qual. Saf. 2014, 23, 970–973. [Google Scholar] [CrossRef] [PubMed]
- Marksberry, P.; Church, J.; Schmidt, M. The employee suggestion system: A new approach using latent semantic analysis. Hum. Factors Ergon. Manuf. 2014, 24, 29–39. [Google Scholar] [CrossRef]
- Drotz, E.; Poksinska, B. Lean in healthcare from employees’ perspectives. J. Health Organ. Manag. 2014, 28, 177–195. [Google Scholar] [CrossRef]
- Fillingham, D. Can lean save lives? Leadersh. Health Serv. 2007, 20, 231–241. [Google Scholar] [CrossRef]
- Radnor, Z.; Burgess, N.; Sohal, A.S.; O’Neill, P. Readiness for lean in healthcare: Views from the executive. In Proceedings of the 18th EUROMA Conference, Cambridge, UK, 3–6 July 2011. [Google Scholar]
- Hines, P.; Lethbridge, S. New development: Creating a lean university. Public Money Manag. 2010, 28, 53–56. [Google Scholar]
- Womack, J.P.; Jones, D.T.; Roos, D. The Machine that Changed the World: The Story of Lean Production—Toyota’s Secret Weapon in the Global Car Wars that is Now Revolutionizing World Industry; Simon and Schuster: New York, NY, USA, 2007; pp. 1–11. [Google Scholar]
- Chiarini, A.; Baccarini, C.; Mascherpa, V. Lean production, Toyota production system and kaizen philosophy. TQM J. 2018, 30, 425–438. [Google Scholar] [CrossRef]
- Quintero, A.N. La nueva gestión pública: Una herramienta para el cambio. Rev. Nueva Perspect. 2010, 23, 36–38. [Google Scholar]
- Rother, M.; Shook, J. Learning to See; Lean Enterprise Institute, Inc.: Brookline, MA, USA, 1999. [Google Scholar]
- Escaida Villalobos, I.; Jara Valdés, P.; Letzkus Palavecino, M. Mejora de procesos productivos mediante lean manufacturing. Trilogía 2016, 28, 26–55. [Google Scholar]
- Garcia-Sabater, J.J.; Marin-Garcia, J.A.; Perello-Marin, M.R. Is implementation of continuous improvement possible? An evolutionary model of enablers and inhibitors. Hum. Factors Ergon. Manuf. Serv. Ind. 2012, 22, 99–112. [Google Scholar] [CrossRef]
- Guzmán-Pulido, A.; Triana-Moreno, L.C. Propuesta de Mejoramiento al Sistema de Producción de Sanitarios One Piece Smart Mediante Herramientas de Lean Manufacturing y de Estudio de Métodos y Tiempos en la Empresa, Corona SAS Planta Madrid; Trabajo de grado, programa de Ingeniería Industrial: Bogotá D.C., Colombia, 2020. [Google Scholar]
- Claire, F.L.; Kumar, M.; Juleff, L. Operationalising Lean in Healthcare: The Impact of Professionalism. Prod. Plan. Control 2020, 31, 615–629. [Google Scholar]
- Sales Coll, M.; Castro Vila, R.D. Value-based lean implementation in a surgical unit: The impact of the methodology. TQM J. 2021. [Google Scholar] [CrossRef]
- Perona, M.; Saccani, N.; Bonetti, S.; Bacchetti, A. Manufacturing lead time shortening and stabilisation by means of workload control: An action research and a new method. Prod. Plan. Control 2016, 27, 660–670. [Google Scholar] [CrossRef]
- Visintin, F.; Cappanera, P.; Banditori, C.; Danese, P. Development and implementation of an operating room scheduling tool: An action research study. Prod. Plan. Control 2017, 28, 758–775. [Google Scholar] [CrossRef]
- Bryman, A.; Bell, E.Y. Business Research Methods, 3rd ed; Oxford University Press: Oxford, UK, 2011. [Google Scholar]
- Koshy, E.; Koshy, V.; Waterman, H. Action Research in Healthcare; SAGE: Thousand Oaks, CA, USA, 2010. [Google Scholar]
- Collis, J.; Hussey, R.Y. Business Research. Una Guía Práctica para Estudiantes de Pregrado y Posgrado, 2nd ed.; Palgrave Macmillan: London, UK, 2003. [Google Scholar]
- McNiff, J. Action Research: Principles and Practice; Routledge: Philadelphia, PA, USA, 2013. [Google Scholar]
- Näslund, D.; Kale, R.; Paulraj, A. Action research in supply chain management-a framework for relevant and rigorous research. J. Bus. Logist. 2010, 31, 331–355. [Google Scholar] [CrossRef]
- Kemmis, S.; McTaggart, R.; Nixon, R. The Action Research Planner: Doing Critical Participatory Action Research; Springer Science & Business Media: Berlin/Heidelberg, Germany, 2013. [Google Scholar]
- Roy, M.; Prévost, P. La recherche-action: Origines, caractéristiques et implications de son utilisation dans les sciences de la gestion. Rech. Qual. 2013, 32, 129–151. [Google Scholar]
- Lewin, K. Action research and minority problems. J. Soc. Issues 1946, 2, 34–46. [Google Scholar] [CrossRef]
- Akmal, A.; Foote, J.; Podgorodnichenko, N.; Greatbanks, R.; Gauld, R. Understanding resistance in lean implementation in healthcare environments: An institutional logics perspective. Prod. Plan. Control 2020, 1–15. [Google Scholar] [CrossRef]
- Moran, J.; Avergun, A. Creating lasting change. Total Qual. Manag. 1997, 9, 146–151. [Google Scholar] [CrossRef]
- Steffens, G.; Cadiat, A.C. Los Criterios SMART: El Método Para Fijar Objetivos con Éxito; 50Minutos.es.: 2016. Available online: https://www.50minutos.es/libro/los-criterios-smart/ (accessed on 28 February 2020).
- Ishikawa, K. Que es el Control Total de Calidad? Editorial Norma: Barcelona, Spain, 2003. [Google Scholar]
- Marin-Garcia, J.A.; Garcia -Sabater, J.J.; Garcia-Sabater, J.P.; Maheut, J. Protocol: Triple Diamond method for problem solving and design thinking. Rubric validation. Work. Pap. Oper. Manag. 2020, 11, 49–68. [Google Scholar] [CrossRef]
- Alvarez, A.K.G.; Santos, E.D.Z. Gestión de seguridad psicológica del personal sanitario en situaciones de emergencia por COVID-19 en el contexto hospitalario o de aislamiento. Rev. Cuba. De Enfermería 2020, 36, 1–19. [Google Scholar]
- World Health Organization. Situation Report-41. Coronavirus Disease 2019. 01 March 2020. Ginebra: OMS; 2020. Available online: https://www.who.int/emergencies/diseases/novel-coronavirus-2019 (accessed on 15 March 2020).
- World Health Organization. (2020). Clinical management of severe acute respiratory infection (SARI) when COVID-19 disease is suspected: Interim guidance, 13 March 2020. Available online: https://extranet.who.int/iris/restricted/bitstream/handle/10665/331446/WHO-2019-nCoV-clinical-2020.4-eng.pdf?sequence=1&isAllowed=y (accessed on 1 April 2020).
- Iparraguirre, S.T.; Álvarez, R.M. La semFYC y la Medicina de Familia en tiempos del Coronavirus. Atención Primaria 2020, 52, 291–293. [Google Scholar] [CrossRef] [PubMed]
- Boletín Oficial del Estado núm. 67, de 14 de Marzo de 2020, Páginas 25390-25400. Sección I. Disposiciones Generales. Available online: https://www.boe.es/eli/es/rd/2020/03/14/463 (accessed on 30 March 2020).


| Area | Problems/Limitations |
|---|---|
| Primary Care |
|
| Hospitals |
|
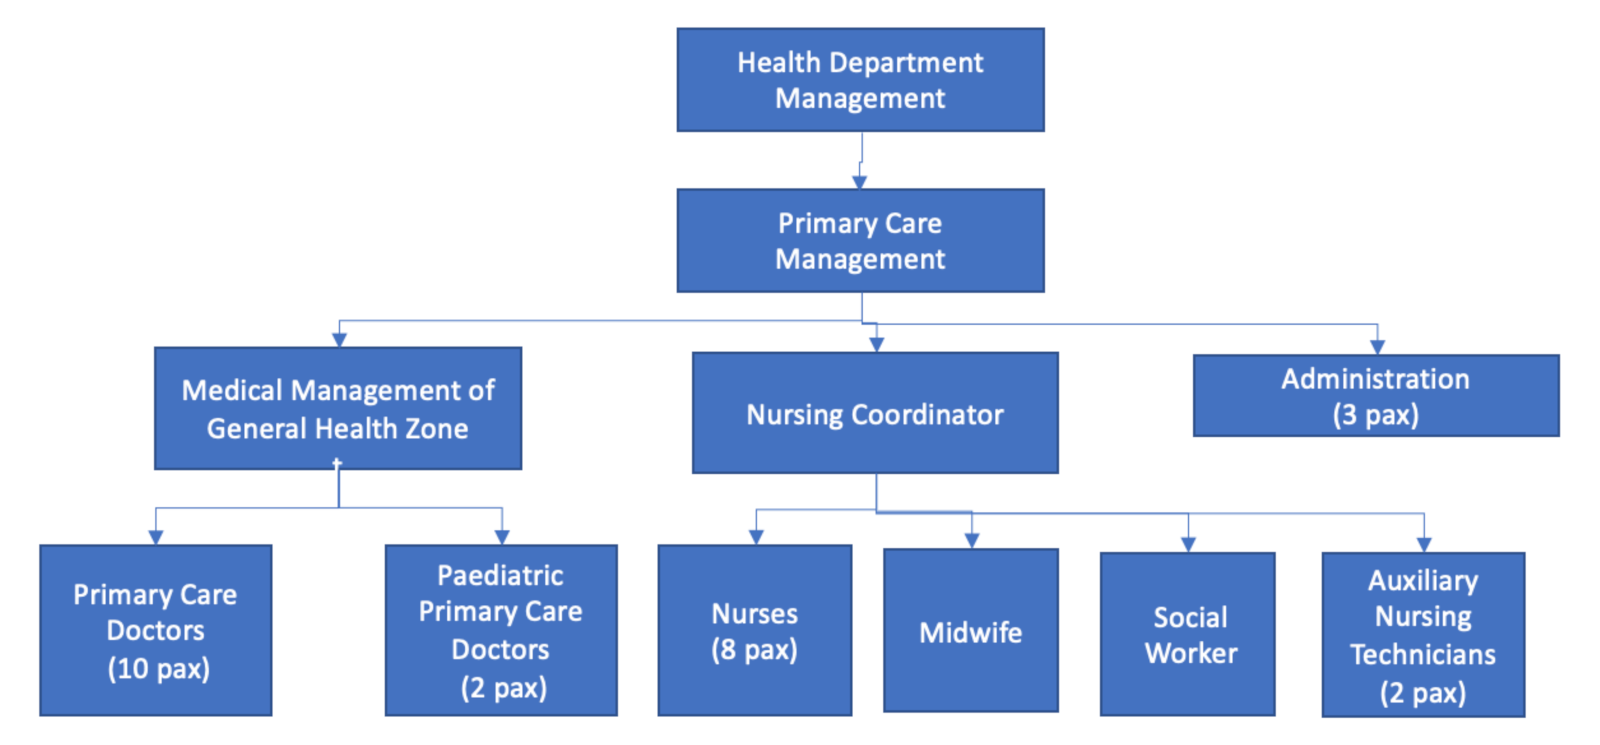
| Post | Role |
|---|---|
| Director of primary medical care | Improvement promoter (non-participating) |
| Director of basic health zone | Promoter and facilitator. Team leader |
| Coordinator of nurses of basic health zone | Support for the facilitator and participant |
| Primary care team administration and auxiliary positions | Passive subjects: Aware of the process and propose improvements |
| Evolution of Number of Visits | Numerical Value | % (of Total Visits) |
|---|---|---|
| Number of daily emergency visits | 15,468 | 23.23% |
| Number of scheduled visits plus regular appointments | 40,935 | 61.46% |
| Number of telephone appointments for emergencies | 2641 | 3.96% |
| Number of telephone appointments for scheduled activities | 1890 | 2.84% |
| Number of emergency visits of the day scheduled in activity | 5670 | 8.52% |
| Total visits | 66,604 | 100% |
| Appointment delay | 2.46 |
| Definition | Functions/Tasks | |
|---|---|---|
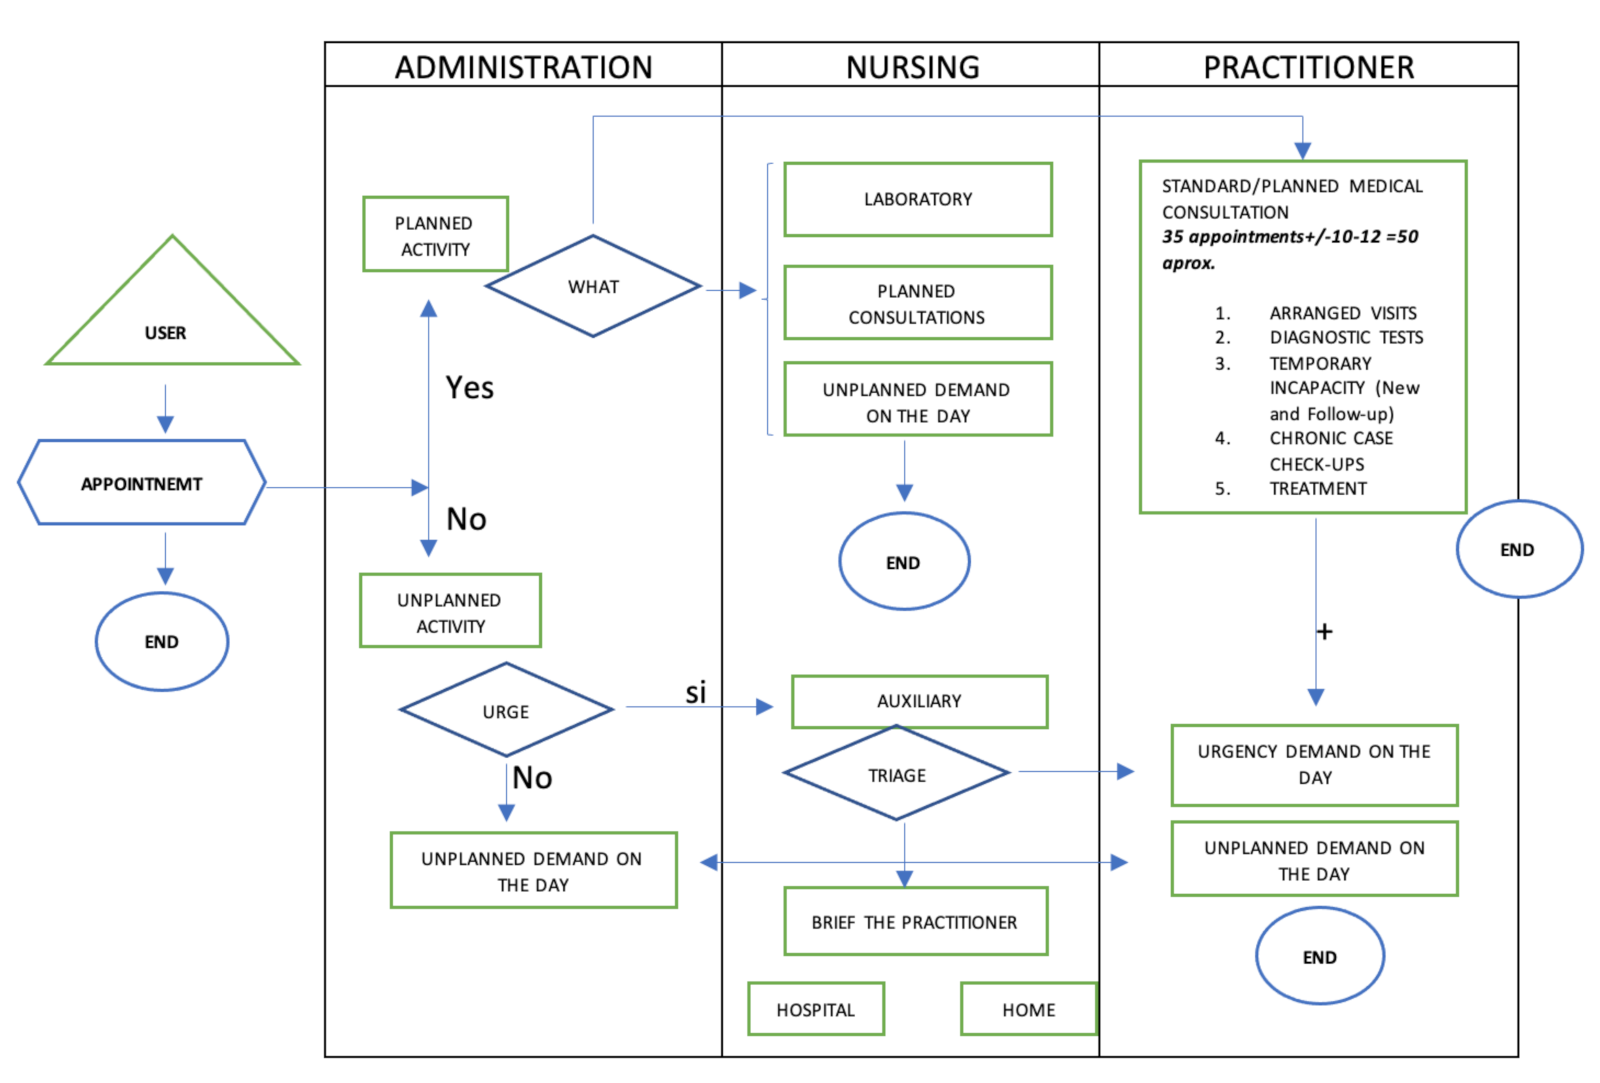
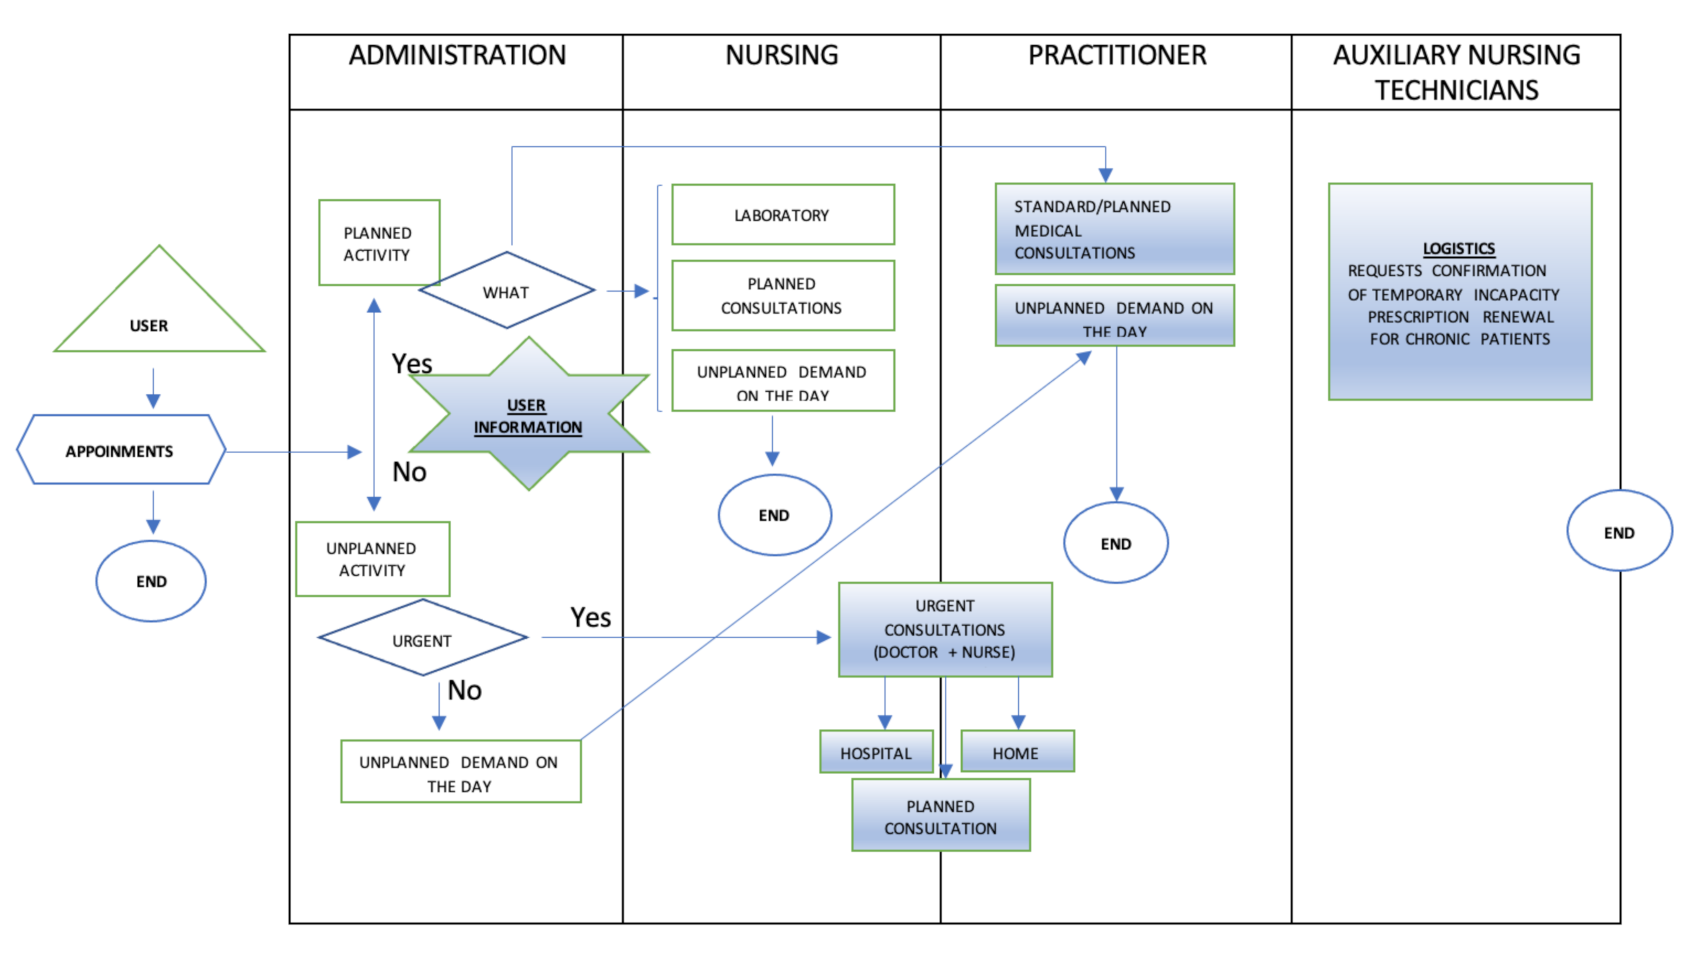
Upon patient request:
| Daily demand from patients who have requested it by appointment through the App, Web, or at the Health Center | Patient-generated demands (chronic and non-chronic) while integrating part of the program activities and protocols, as well as relevant preventative activities, into these consultations |
| Programmed: | Claims derived from the activity of health personnel or social workers and scheduled by the doctor themselves | Complex processes of chronic patient care or with social vulnerabilities which cannot be developed in the on-demand consultation. In this type of consultation, care and screening programs defined as quality standards to improve the health of the population are also developed. This planned activity is carried out in conjunction with nursing |
| Appointment not in person or by phone | Generated by the doctor themselves | Procedures derived from medical records |
| Diagnostic support | Generated by nursing | Blood extraction, biological sample taking, electrocardiograms, spirometry, wax extractions, blood pressure measurement, Mantoux test, cytology sample extraction, anticoagulation control. |
| Actions | Activities |
|---|---|
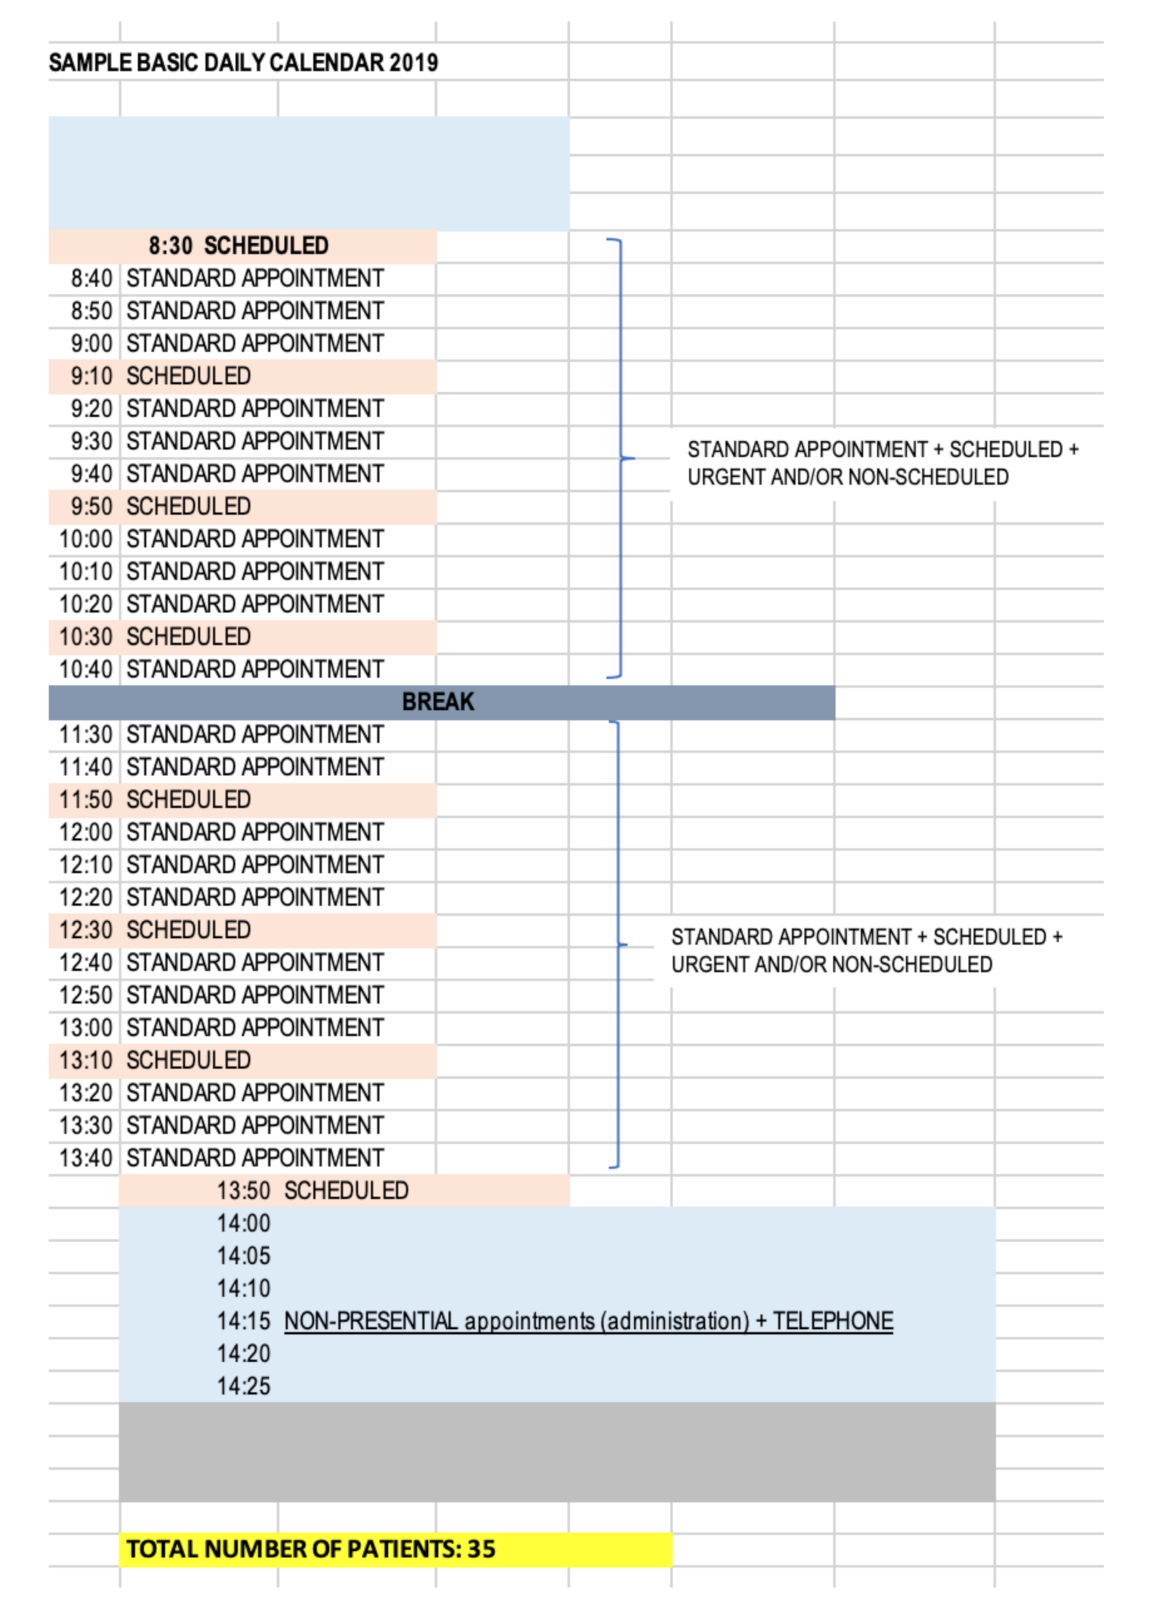
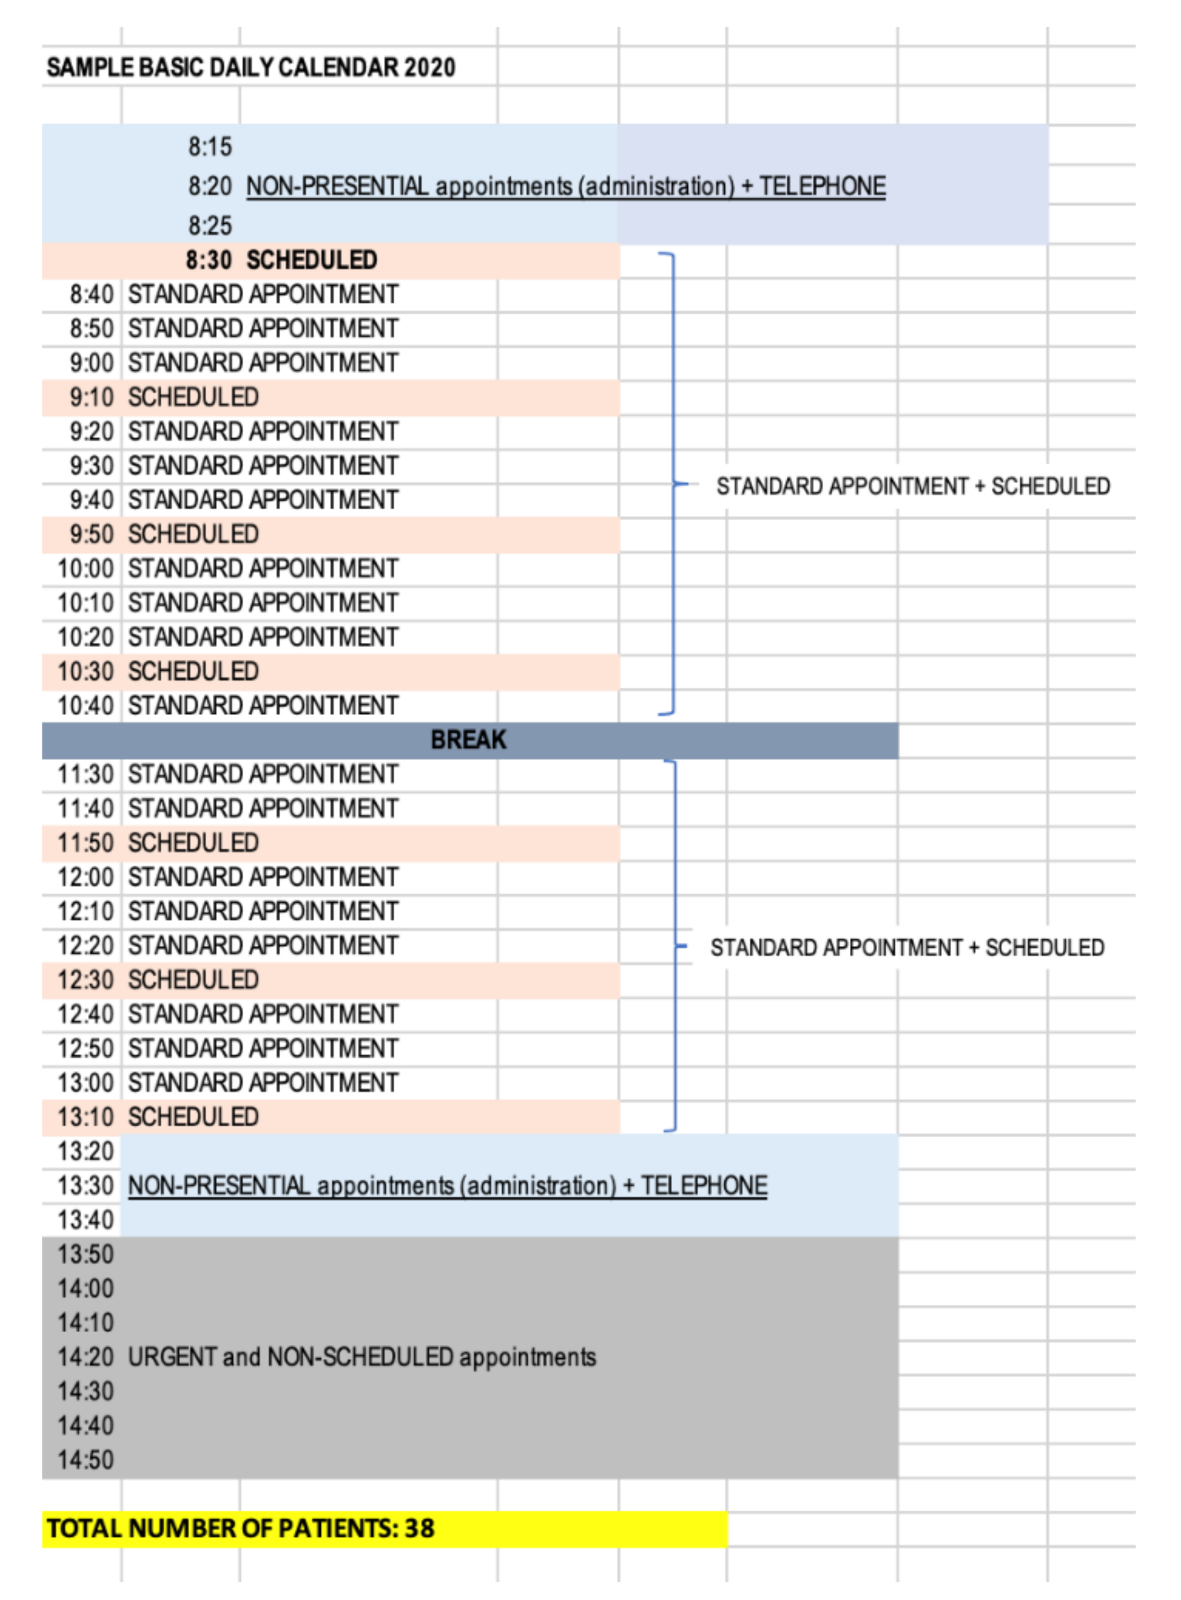
| Reorganize agenda management | A specific calendar was created for daily emergencies to which one human resource (optional) of the 10 existing in the center was assigned as well as a material resource, office specific. Figure 8 below shows this calendar had two modalities of patient care within the same calendar, one for ordinary plus programmed and another for non-urgent unscheduled demands. This modality of attention was distributed in two differentiated time slots from 0800 to 1330 and from 1350 to 1500, this last time slot being where non-urgent unscheduled visits were attended. In this model, the time period for doctors to carry out administrative tasks was from 0815 to 0825 and from 1320 to 1340. Another important action was to separate the circuits of attention to the scheduled visit and the unscheduled visit once the changes were made at the organizational and functional levels of the center. |
| Reduce bureaucracy | In order to carry out this action, the plan determined which non-healthcare bureaucratic aspects and the urgent daily demand could be eliminated, as they imply an increase in the healthcare burden and could be carried out at alternate levels. The following five activities were carried out:
|
| Improve consultation efficiency | Create internal pathways and redirect the demand towards programmed visits, and establishing protocols of action. The objective was to improve the quality of care of chronic diseases through the following six activities:
|
| Increase decision making roles by group | Training activities were required to promote leadership attitudes and teamwork. Following are two examples:
|
| Keeping patients informed | A dissemination and communication plan was established through the installation of informative posters and notes at the counters of the Health Center with the aim of providing information on the different care pathways (see Reduce Bureaucracy Action 1 above). Community activities were promoted such as educational talks to the patients allowing the differentiation of the word “emergencies” (vital cases) and using the term “unscheduled activity” to make the patient aware of the correct use of the new work processes of the Health Center |
| Evolution of Number of Visits | Numerical Value | % (of Total Visits) |
|---|---|---|
| Number of daily emergency visits | 9867 | 15.53% |
| Number of scheduled visits plus regular appointments | 51,225 | 80.60% |
| Number of telephone appointments for emergencies | 536 | 0.85% |
| Number of telephone appointments for scheduled activities | 895 | 1.41% |
| Number of emergency visits of the day scheduled in activity | 1040 | 1.7% |
| Total visits | 63,563 | 100% |
| Appointment delay | 2.02 |
| Actions | Achievements |
|---|---|
| Reorganize agenda management | This allows physicians to better organize their time as they reorganize their schedules (Figure 8). With these changes, the doctors on the calendar could attend 38 visits with a time of availability of 10 min. In the time range from 0800 to 1330 the visits were for ordinary plus scheduled so the doctor could manage, depending on the requirements and needs of the patient and the type of visit, an average of 10 min availability as they were aware of what they were going to attend, thus reducing stress, uncertainty, the burden of care, and they could ultimately improve patient care. By establishing a time slot (1350 to 1500) for non-urgent unscheduled visits, these did not have to be entered into the calendar at random or to distort the day-to-day planning such so scheduled appointments were not delayed. In addition, 80% of the attention was provided in person and 20% by telematic means. On the one hand, patients who demanded unscheduled urgent activity during the day would be directed to a specific location in the center where vital emergencies were attended with less risk, higher efficiency, and multidisciplinary support, i.e., an extra consultation would be established with personal care resources thus minimizing the patient risk. It also reduced then number of unnecessary trips within the center. On the other hand, patients who demanded a non-scheduled, non-urgent appointment would be scheduled during the day in care modules of the daily work calendar designed for this purpose and according to their demand. This allowed release of the care burden in the time slots of patients who had requested or arranged an appointment in advance, thus increasing the time by scheduled demand and ultimately patient satisfaction including decreasing waiting time. |
| Reduce bureaucracy | Allowed an increase to the time allowed to attend the patient in their scheduled appointment. Promoted a reduction in work stress due to administrative activity time allocation to the scheduled activity. Allowed for consultation planning and organization. |
| Improve consultation efficiency | Reduced the care overload due to the protocol familiarity. Reduced stress when dealing with patients. Increased the time allowed to care for the patient in their scheduled appointment. Improved communication with co-workers. Improved patient–physician relationship and trust. Improved patient satisfaction. Allowed early diagnosis and problem solving. |
| Increase decision making roles by group | Improved the communication with the public. Improved the accessibility and the patient traffic within the center. Improved the agenda management in the programmed activity. |
| Keeping patients informed | Improved the education of the population. Improved the operation of the center. |
| Actions | Achievements |
|---|---|
| Reorganize the calendars | The physician who only attended to emergencies was maintained, but they will try to resolve the calendars by telephone. Two physicians, a doctor and a nurse, were added to cover the Covid-19 calendar. In this way, the calendar of the rest of the physicians changed to the structure shown in Figure 10 below. The structure of the calendar during the Covid-19 period for physicians who did not perform Covid-19 assistance (Figure 10) was reorganized as follows: 0800 to 0830 and 1330 to 1425. The physicians performed administrative tasks on medical records. 0830 to 1330. The physicians in the ordinary plus scheduled calendar could attend 41 visits with a time availability of 9.5 min. Here there was a radical change due to capacity restrictions to limit contact. It was decided that ordinary appointments would be used for telematic care (80%) and scheduled appointments would be used to continue face-to-face care for chronic pathologies (20%). 1425 to 1500. This period was intended for one scheduled home visit. |
| Increase telemedicine (NEW ACTION) | The way of working was changed by promoting “telemedicine”, which was the safest method of care, although not always ideal. To promote and improve telemedicine, an attempt was made to provide more technological resources, but it was not possible due to all the economic resources being earmarked for purchasing PPE and other resources to increase safety in the center. To solve this problem, the existing technological resources were redistributed and interconnections with this department were promoted. |
| Improve information flow between levels (NEW ACTION) | The process of transferring information between the different levels of the health department was precarious and reliant on manual processes. In many cases, it could take several calls to ensure that all the information transferred between levels. To guarantee continuity of care between the different levels of care, clear referral and fresh communication protocols were established. These protocols were provided with the necessary resources to maintain safe and agile referrals (e-mail, telephone numbers, designation of referrers, clear referral criteria). |
| Reduce bureaucracy | The process of de-bureaucratization in primary care should be continued in order to eliminate the non-care burden. The situation allowed for continuation of those primary care physician de-bureaucratization activities that were not implemented in the first quarter of 2020 due to excessive pushback including the following:
|
| Increase decision making roles by group and delegate more responsibilities and functions | The needs in the current situation demanded that all personnel become much more decisive, not only because efficiency gains, but also because it was safer for physicians, professionals, and patients. In order to be more decisive and to eliminate the workload on the staff, the competencies and functions of the nursing staff were extended to perform previous triage of patients for clear cases, for which they were perfectly qualified. |
| Indicator | Result |
|---|---|
| Number of telephone appointments in scheduled activity | 36,648 |
| Number of face-to-face appointments in scheduled activity | 9665 |
| Number of unscheduled urgent appointments | 1800 |
| Number of appointments in Covid-19 calendar | 4950 |
| Total visits | 53,063 |
| Delay | 4.78 |
| Actions | Improvements |
|---|---|
| Reorganize the calendars | This continued to allow the physician to manage according to the needs and requirements of the patient and the type of visit, as they were aware of what they were going to attend. In the same way as in the previous period, stress, uncertainty, and the burden of care were reduced and patient care was improved. In addition, it allowed for efficient management of the work agenda. |
| Increase telemedicine (new action) | These measures made it possible to:
|
| Improve information flow between levels (new action) | The establishment of new care communications between the different levels of care (primary-hospital) made it possible to:
|
| Reduce bureaucracy | Continued de-bureaucratization helped to improve the administrative burden on the center’s staff so that they could provide better service and care to patients. This improvement involved increasing the dedication of the practice to purely clinical matters, decreasing the care load and improving the quality of work. |
| Increase decision making roles by group and delegate more responsibilities and functions | The expansion of functions and competencies allowed:
|
| Q4 2019 | Q1 2020 | Covid-19 | |
|---|---|---|---|
| Times | Average care for 50 patients
| Average care for 38 patients
| Average care for 41 patients
|
| Physicians |
|
|
|
| Nursing |
|
|
|
| Administration |
|
|
|
| Patients |
|
|
|
| General |
|
|
|
Publisher’s Note: MDPI stays neutral with regard to jurisdictional claims in published maps and institutional affiliations. |
© 2021 by the authors. Licensee MDPI, Basel, Switzerland. This article is an open access article distributed under the terms and conditions of the Creative Commons Attribution (CC BY) license (http://creativecommons.org/licenses/by/4.0/).
Share and Cite
Morell-Santandreu, O.; Santandreu-Mascarell, C.; Garcia-Sabater, J.J. A Model for the Implementation of Lean Improvements in Healthcare Environments as Applied in a Primary Care Center. Int. J. Environ. Res. Public Health 2021, 18, 2876. https://doi.org/10.3390/ijerph18062876
Morell-Santandreu O, Santandreu-Mascarell C, Garcia-Sabater JJ. A Model for the Implementation of Lean Improvements in Healthcare Environments as Applied in a Primary Care Center. International Journal of Environmental Research and Public Health. 2021; 18(6):2876. https://doi.org/10.3390/ijerph18062876
Chicago/Turabian StyleMorell-Santandreu, Oscar, Cristina Santandreu-Mascarell, and Julio J. Garcia-Sabater. 2021. "A Model for the Implementation of Lean Improvements in Healthcare Environments as Applied in a Primary Care Center" International Journal of Environmental Research and Public Health 18, no. 6: 2876. https://doi.org/10.3390/ijerph18062876
APA StyleMorell-Santandreu, O., Santandreu-Mascarell, C., & Garcia-Sabater, J. J. (2021). A Model for the Implementation of Lean Improvements in Healthcare Environments as Applied in a Primary Care Center. International Journal of Environmental Research and Public Health, 18(6), 2876. https://doi.org/10.3390/ijerph18062876