
Statewide Ambulance Coverage of a Mixed Region of Urban, Rural and Frontier under Travel Time Catchment Areas


Abstract
1. Introduction
2. Literature Review
2.1. A Mixed Geographic Region
2.2. Population and Land Coverage
2.3. Geographical Backup Coverage
2.4. Summary
3. Model Development
3.1. Regional Service Model Using Geographically Different Response Time
- 9 min in urban areas (R = 0);
- 20 min in rural areas (R = 1);
- 30 min in frontier areas (R = 2).
3.2. Response Time: Chute Time and Travel Time
3.3. Performance Measure: Population- and Land Covered Ratio
4. Case Study
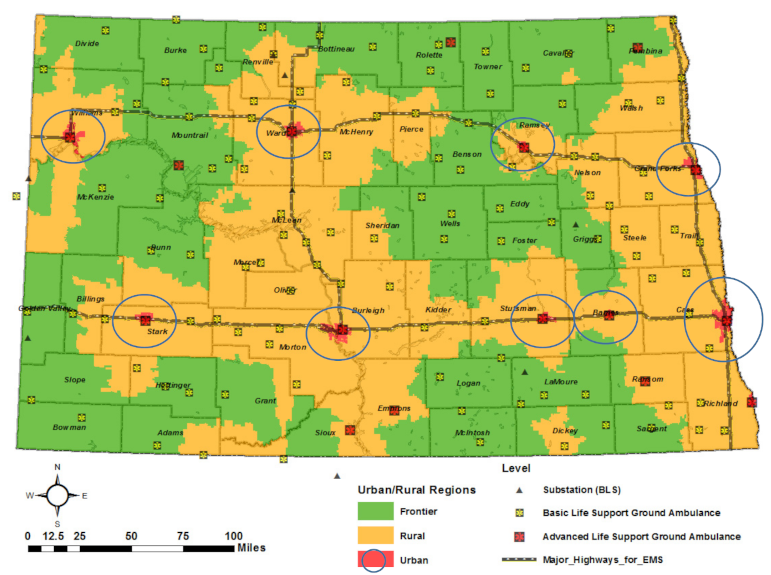
4.1. North Dakota
4.2. Defining Urban, Rural, and Frontier Areas
4.3. Data Sources
4.4. Scenarios, Assumptions and Parameters
4.4.1. Travel Speed Estimation
4.4.2. Chute Time and Travel Time
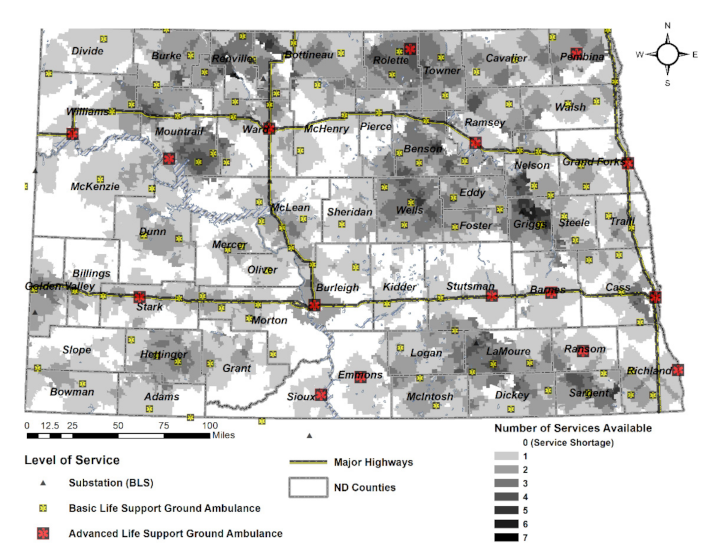
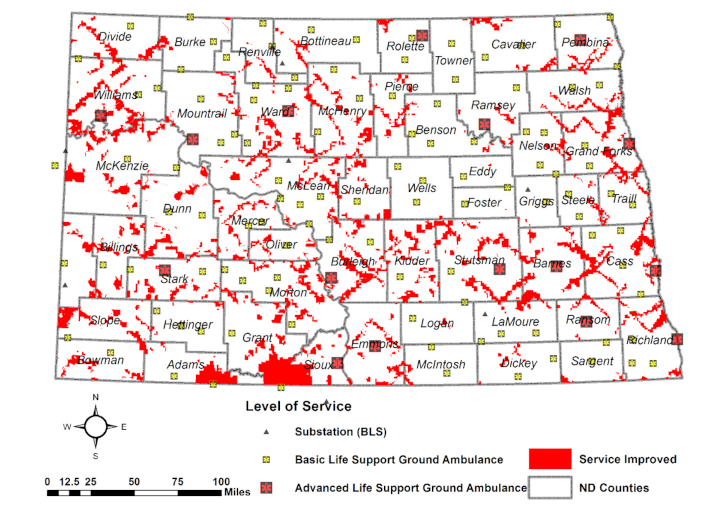
4.5. Results and Visual Analytics
4.5.1. Backup Coverages
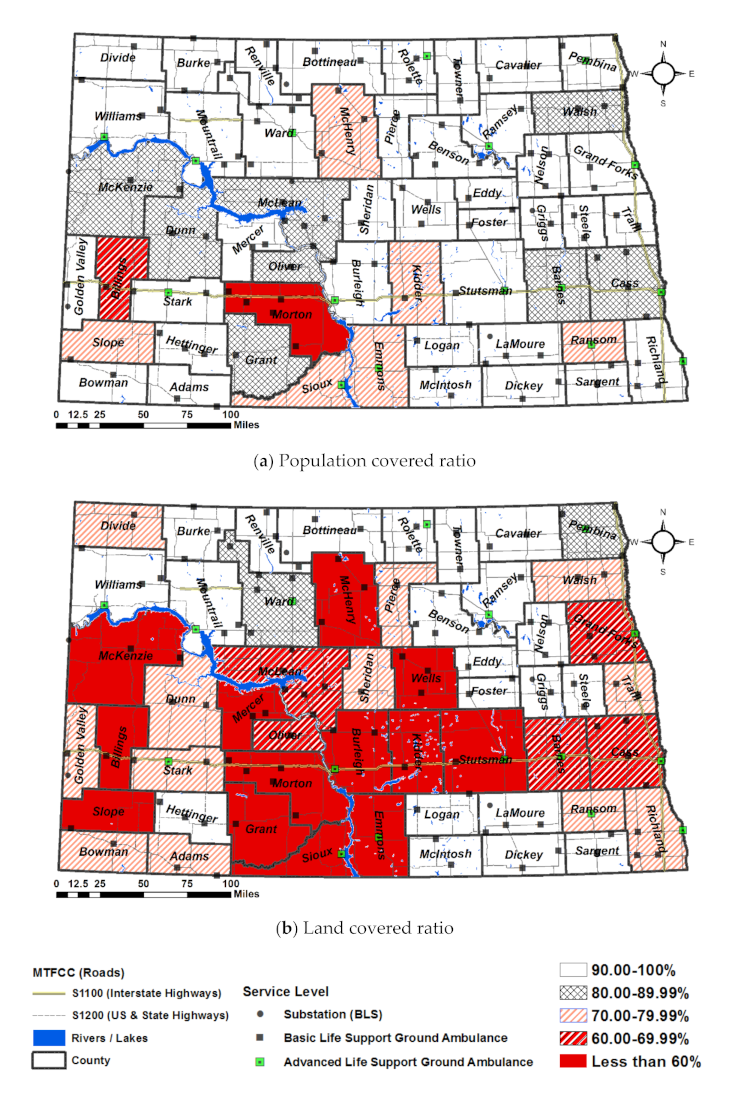
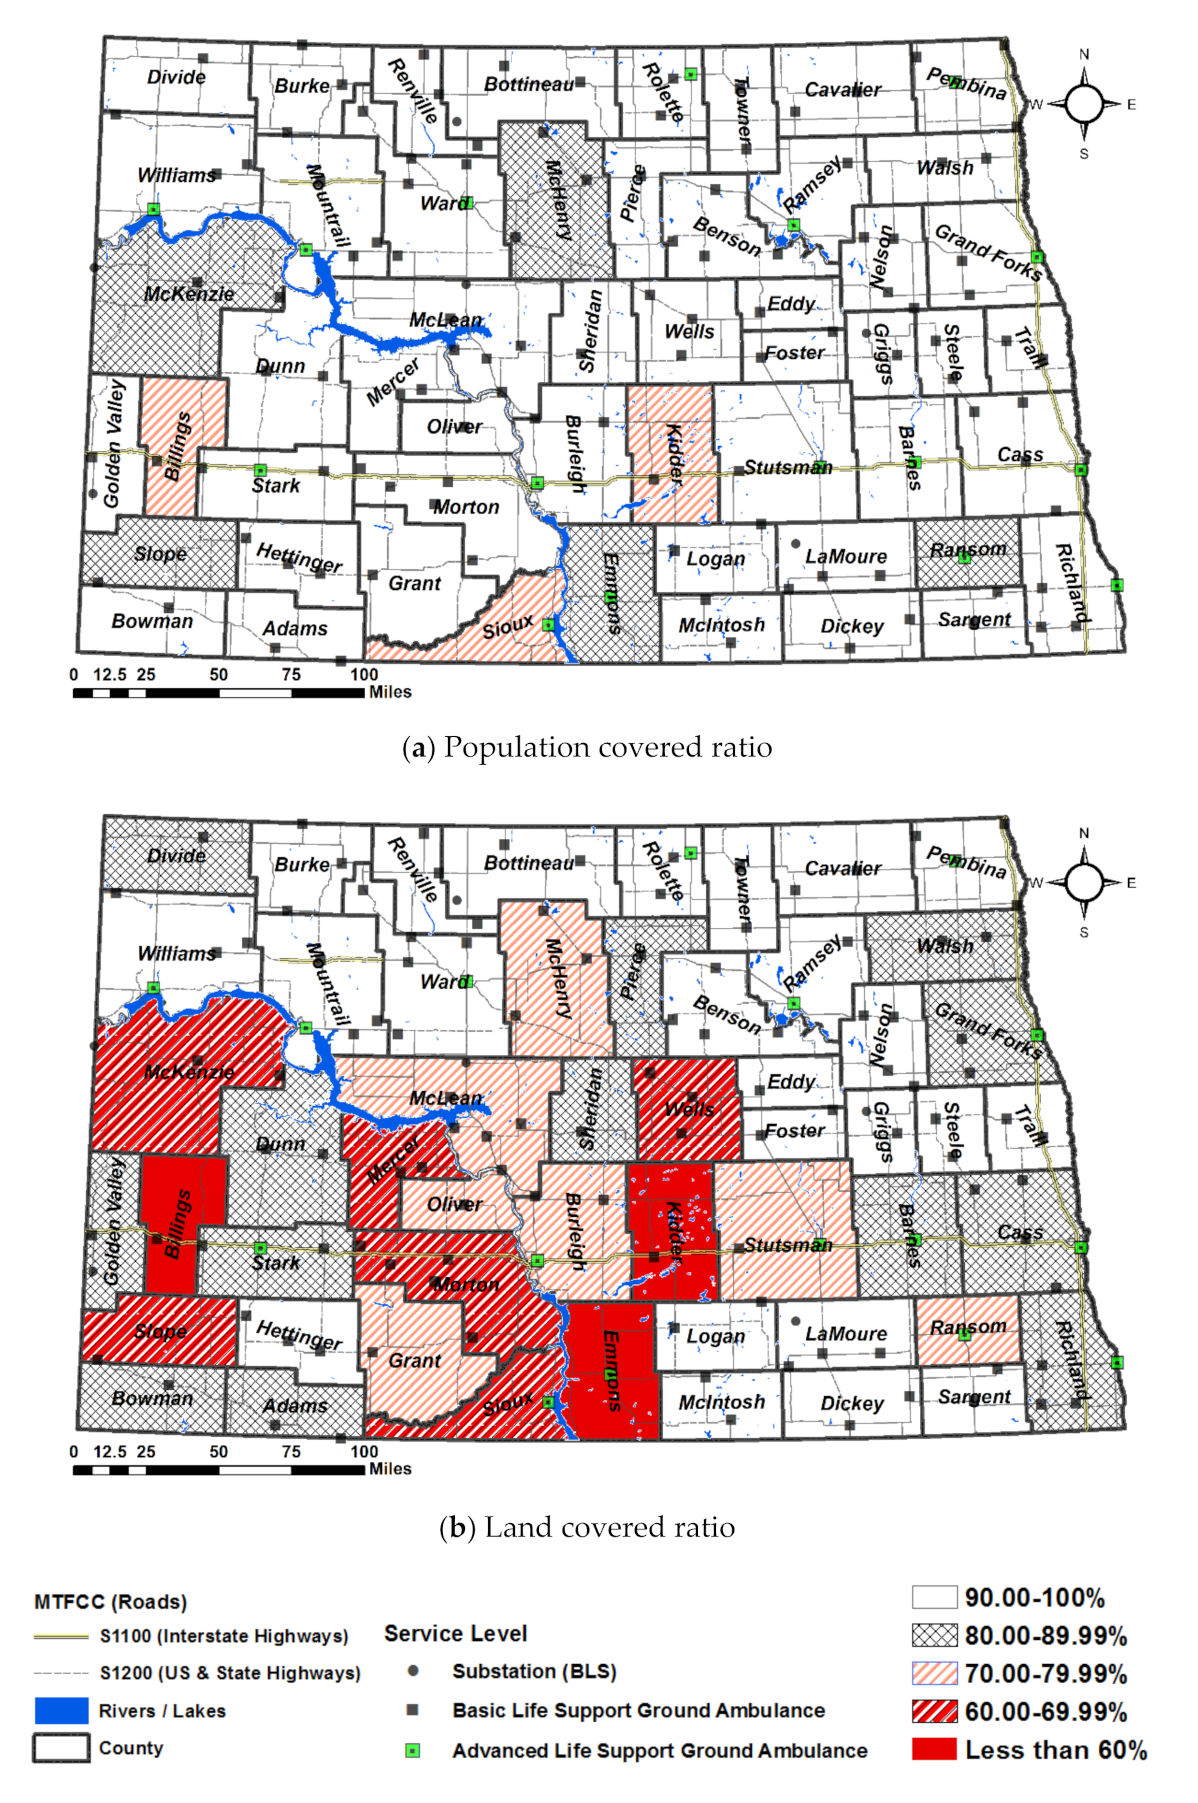
4.5.2. Service Level by Region: Population Covered Ratio and Land Covered Ratio
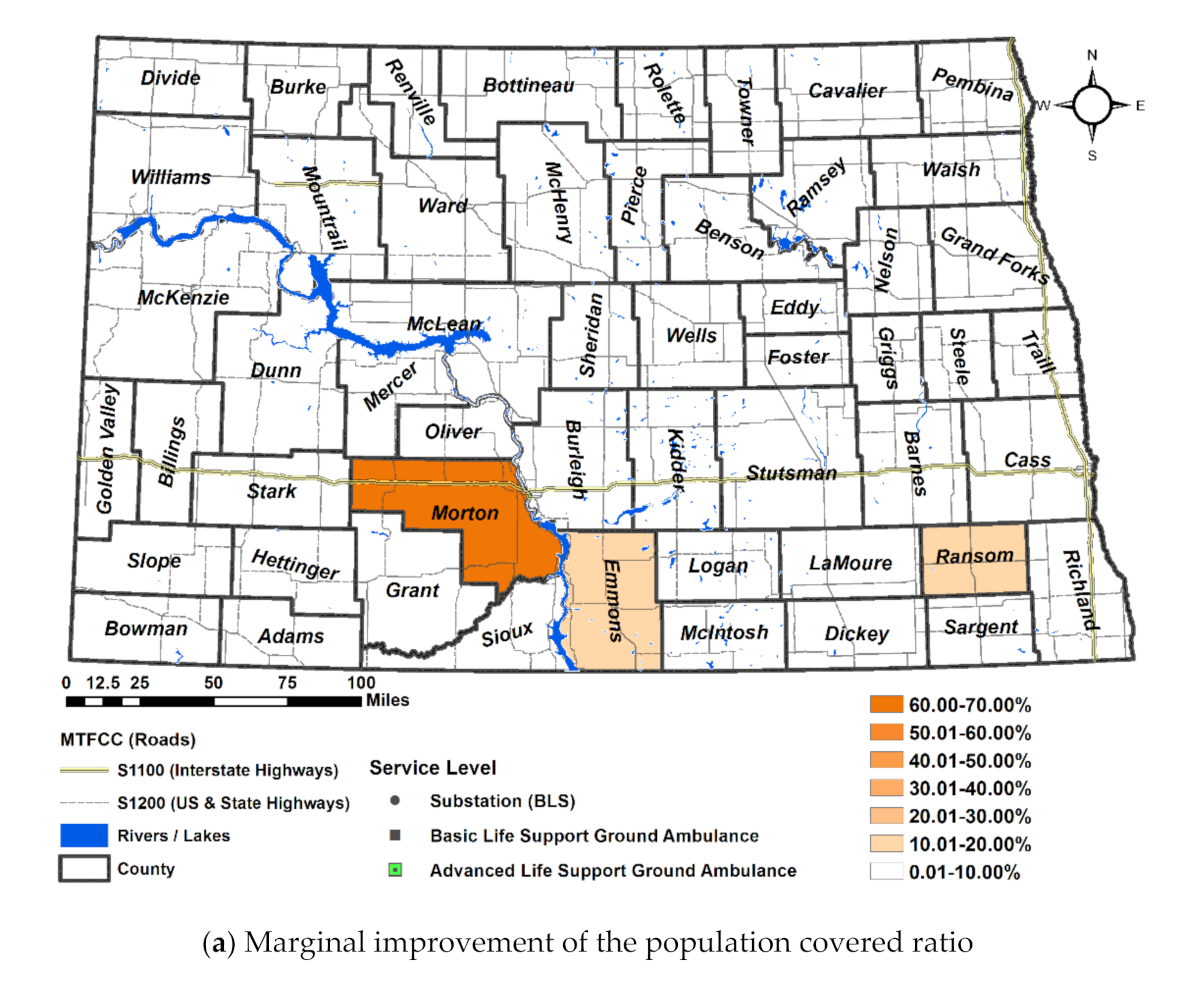
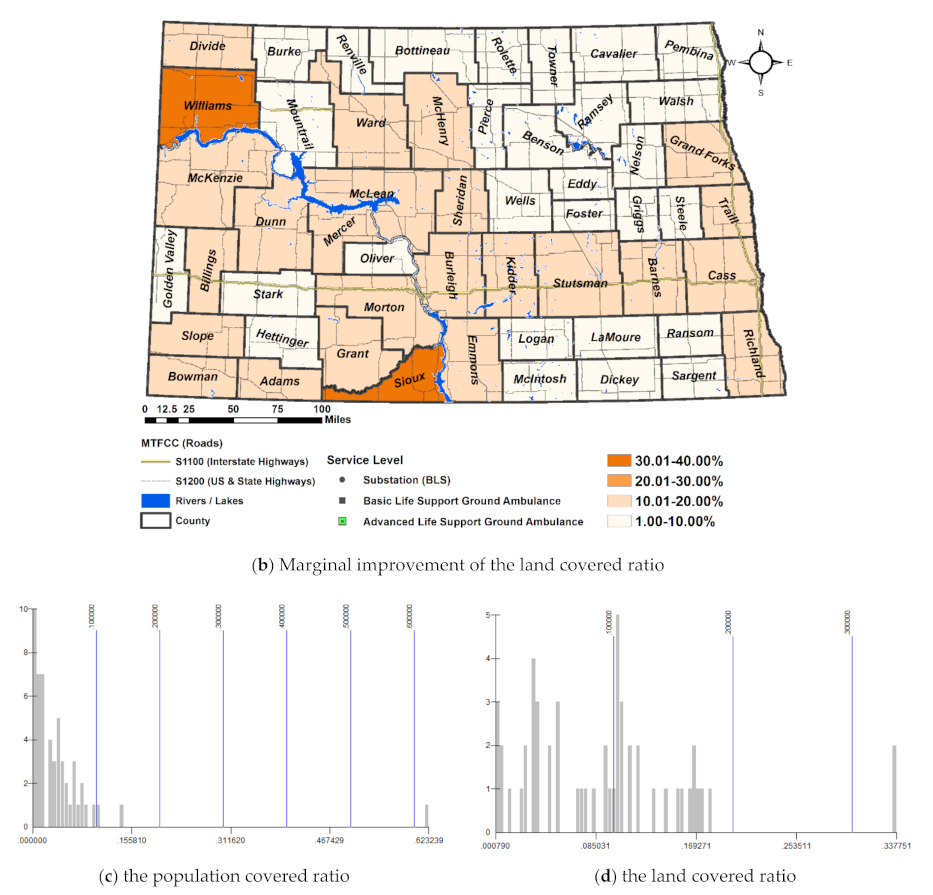
4.5.3. Service Level by County: Population and Land
5. Discussion and Implications
5.1. Discussion
5.2. Implications
6. Conclusions
Author Contributions
Funding
Institutional Review Board Statement
Informed Consent Statement
Data Availability Statement
Acknowledgments
Conflicts of Interest
References
- Wang, E.H.; Mann, N.C.; Jacobson, K.; Dai, M.; Mears, G.; Smyrski, K.; Yealy, D. National Characteristics of Emergency Medical Services Responses in the United States. Prehospital Emerg. Care 2013, 17, 8–14. [Google Scholar] [CrossRef]
- Washington, D.C. EMS Response Time. 2020. Available online: https://fems.dc.gov/page/ems-response-time (accessed on 10 December 2020).
- MITRE Corporation. Medicare’s Ground Ambulance Data Collection System: Sampling and Instrument Considerations and Recommendations; Centers for Medicare & Medicaid Services: McLean, VA, USA, 2019.
- EMSWorld. Should Response Time Be a Performance Indicator? Available online: https://www.emsworld.com/article/12071652/response-time-expert-opinions (accessed on 10 December 2020).
- He, Z.; Qin, X.; Renger, R.; Souvannasacd, E. Using spatial regression methods to evaluate rural emergency medical service (EMS). Am. J. Emerg. Med. 2019, 37, 1633–1642. [Google Scholar] [CrossRef]
- Baker, J.R.; Clayton, E.R.; Moore, L.J. Redesign of primary response areas for county ambulance services. Eur. J. Oper. Res. 1989, 41, 23–32. [Google Scholar] [CrossRef]
- Berg, P.; Fiskerstrand, P.; Aardal, K.; Einerkjaer, J.; Thoresen, T.; Roislien, J. Improving ambulance coverage in a mixed urban-rural region in Norway using mathematical modeling. PLoS ONE 2019, 14, e0215385. [Google Scholar] [CrossRef]
- Wong, H.T.; Lin, T.-K.; Lin, J.-J. Identifying rural-urban differences in the predictors of emergency ambulance service demand and misuse. J. Formos. Med. Assoc. 2019, 118, 324–331. [Google Scholar] [CrossRef] [PubMed]
- Hart, G. Frontier/Remote, Island, and Rural Literature Review; University of North Dakota: Grand Forks, ND, USA, 2012. [Google Scholar]
- Hirsch, S. Methodology for Designation of Frontier and Remote Areas; Federal Register: Washington, DC, USA, 2012.
- National Academies of Sciences, Engineering, and Medicine. Emergency Medical Services Response to Motor Vehicle Crashes in Rural Areas; The National Academies Press: Washington, DC, USA, 2013. [Google Scholar] [CrossRef]
- Cho, J.; You, M.; Yoon, Y. Characterizing the influence of transportation infrastructure on Emergency Medical Service (EMS) in urban area—A case study of Seoul, South Korea. PLoS ONE 2017, 14, e0215385. [Google Scholar] [CrossRef] [PubMed]
- Al-Shaqsi, S.Z.K. Response time as a sole performance indicator in EMS: Pitfalls and solutions. Open Access Emerg. Med. 2010, 2, 1–6. [Google Scholar] [CrossRef] [PubMed]
- Batta, R.; Mannur, N.R. Covering-Location models for emergency situations that require multiple response units. Manag. Sci. 1990, 36, 16–23. [Google Scholar] [CrossRef]
- Eaton, D.J.; Héctor, M.L.S.U.; Lantigua, R.R.; Morgan, J. Determining Ambulance Deployment in Santo Domingo, Dominican Republic. J. Oper. Res. Soc. 1986, 37, 113–126. [Google Scholar] [CrossRef]
- Budge, S.; Ingolfsson, A. Empirical Analysis of Ambulance Travel Times: The Case of Calgary Emergency Medical Ser-vices. Manag. Sci. 2010, 56, 716–723. [Google Scholar] [CrossRef]
- Schnetzer, M.; Zimney, M. Greatest Needs Analysis-Ambulance Station; North Dakota Association Oil and Gas Producing Counties: Bismarck, ND, USA, 2013. [Google Scholar]
- Tansley, G.; Stewart, B.; Zakariah, A.; Boateng, E.; Achena, C.; Lewis, D.; Mock, C. Population-level spatial access to pre-hospital care by the national ambulance service in Ghana. Prehospital Emerg. Care 2016, 20, 768–775. [Google Scholar] [CrossRef] [PubMed]
- Lee, E. Designing Service Coverage and Measuring Accessibility and Serviceability of Rural and Small Urban Ambulance Systems. Systems 2014, 2, 34–53. [Google Scholar] [CrossRef]
- Røislien, J.; Berg, P.L.v.d.; Lindner, T.; Zakariassen, E.; Uleberg, O.; Aardal, K.; Essen, J.T.V. Comparing population and incident data for optimal air ambulance base locations in Norway. Scand. J. Trauma Resusc. Emerg. Med. 2018, 26, 42. [Google Scholar] [CrossRef] [PubMed]
- Hogan, K.; Revelle, C. Concepts and Applications of Backup Coverage. Manag. Sci. 1986, 32, 1434–1444. [Google Scholar] [CrossRef]
- Erdogan, G.; Erkut, E.; Ingolfsson, A.; Laporte, G. Scheduling Ambulance Crews for Maximum Coverage. J. Oper. Res. Soc. 2010, 61, 543–550. [Google Scholar] [CrossRef]
- Norris, D.F.; Mandell, M.B.; Hathaway, W.E. Volunteers in Emergency Medical Service: A Case Study from Rural America. Public Product. Manag. Rev. 1993, 16, 257–269. [Google Scholar] [CrossRef]
- North Dakota Legislators. North Dakota Ground Ambulance Services; North Dakota Century Code: Washington, DC, USA, 2010. [Google Scholar]
- NEMSIS. NEMSIS Data Dictionary; NEMSIS Technical Assistance Center: Washington, DC, USA, 2016. [Google Scholar]
- Cash, R.E.; Rivard, M.K.; Chrzan, K.; Mercer, C.B.; Camargo, C.A., Jr.; Panchal, A.R. Comparison of Volunteer and Paid EMS Professionals in the United States. Prehospital Emerg. Care 2020, 25, 205–212. [Google Scholar] [CrossRef] [PubMed]
- Ratcliffe, M.; Burd, C.; Holder, K.; Fields, A. Defining Rural at the U.S. Census Bureau: American Community Survey and Geography Brief; U.S. Census Bureau: Washington, DC, USA, 2016.
- Wilger, S. Definition of Frontier; National Rural Health Association: Washington, DC, USA, 2016. [Google Scholar]
- U.S. Department of Agriculture. Frontier and Remote Area Codes. 2010. Available online: https://www.ers.usda.gov/data-products/frontier-and-remote-area-codes/frontier-and-remote-area-codes/#2010%20Frontier%20and%20Remote%20Area%20Codes%20Data%20Files (accessed on 15 February 2021).
- U.S Census Bureau. Cartographic Boundary Shapefiles. 2010. Available online: https://www2.census.gov/geo/tiger/TIGER2010/TABBLOCK/2010/ (accessed on 3 January 2018).
- Rossiter, K. What Are Census Blocks? 2011. Available online: https://www.census.gov/newsroom/blogs/random-samplings/2011/07/what-are-census-blocks.html (accessed on 15 February 2021).
- U.S Census Bureau. Cartographic Boundary Files. 2010. Available online: https://www.census.gov/geo/maps-data/data/tiger-line.html (accessed on 17 November 2018).
- ND Department of Health. Ambulance Service Locations. 14 April 2016. Available online: https://gishubdata.nd.gov/dataset/ambulance-service-locations (accessed on 15 February 2021).
- ND Department of Transportation. State and Federal Roads. 24 September 2018. Available online: https://gishubdata.nd.gov/search/field_topic/transportation-50 (accessed on 15 February 2021).
- ND Department of Transportation. City and County Roads. 27 December 2018. Available online: https://gishubdata.nd.gov/dataset/city-and-county-roads (accessed on 15 February 2021).
- Upper Great Plains Transportation Institute. Speed Limits in North Dakota; ND Department of Transportation: Fargo, ND, USA, 2018.
- U.S. Census Bureau. TIGER/Line Shapefiles and TIGER/Line Files. 2018. Available online: https://www.census.gov/geo/maps-data/data/tiger-line.html (accessed on 4 February 2021).
- Agenda, E.M.S. 2050 Technical Expert Panel. EMS Agenda 2050: A People-Centered Vision for the Future of Emergency Medical Services; National Highway Traffic Safety Administration: Washington, DC, USA, 2019.
- Seaman, A. Be Prepared for Ambulance Wait Times. 2017. Available online: https://www.reuters.com/article/us-health-emergency-response-times/be-prepared-for-ambulance-wait-times-idUSKBN1A42KQ (accessed on 9 July 2020).


| Region in the Midwest | Organization Status | Median | Lower Limit | Upper Limit | N |
|---|---|---|---|---|---|
| Urban/Suburban | Volunteer | 4.87 | 4.82 | 4.91 | 3993 |
| Non-Volunteer | 2.50 | 2.45 | 2.52 | 5250 | |
| Rural | Volunteer | 5.50 | 5.41 | 5.64 | 1754 |
| Non-Volunteer | 3.86 | 3.80 | 3.94 | 1993 | |
| Wilderness (frontier) | Volunteer | 6.25 | 6.13 | 6.33 | 2113 |
| Non-Volunteer | 4.00 | 3.39 | 4.00 | 2200 | |
| Overall (95% Bootstrap CI: Percentile Method) | Volunteer | 4.89 | 4.84 | 4.93 | 2844 |
| Non-Volunteer | 4.12 | 4.06 | 4.16 | 2844 |
| MTFCC | Description | Scenario 1 & 3 | Scenario 2 & 4 | |
|---|---|---|---|---|
| Speed Estimated (Miles per Hour) | Speed Assumed for Ambulance | |||
| S1100 | Primary roads with limited access on highways | Rural | 75 | 80 |
| Urban | 55 | 60 | ||
| S1200 | Secondary roads (US highway, State highway, county highways) | Paved and divided multilane | 70 | 75 |
| Paved two-lane | 65 | 70 | ||
| S1400 | Local neighborhood road, rural road, city street; paved non-arterial | 55 | 60 | |
| S1500 | Vehicle trail (4WD) | 25 | 25 | |
| S1630 | Ramp | 25 | 25 | |
| S1640 | Service drive usually along a limited access highway | 25 | 30 | |
| S1740 | Private road for service vehicles (logging, oil fields, ranches, etc.) | 25 | 30 | |
| Scenarios | Location of An Ambulance | Chute Time (Minutes) | Recommended Drive Time (Minutes) | ||
|---|---|---|---|---|---|
| Scenario 1 and 2 | Urban | CTR=1 = 2.5 | d*11= [0.00–6.50] | d*12 = [0.00–17.50] | d*13 = [0.00–27.50] |
| Rural | CTR=2 = 5.5 | d*21 = [0.00–3.50) | d*22 = [0.00–14.50] | d*23 = [0.00–24.50] | |
| Frontier | CTR=3 = 6.25 | d*33 = [0.00–2.57] | d*32 = [0.00–13.75] | d*33 = [0.00–23.75] | |
| Scenario 3 and 4 | Urban | CTR=1 = 0.5 | d*11 = [0–8.5] | d*12 = [0.0–19.5] | d*13 = [0–29.5] |
| Rural | CTR=2 = 4.95 | d*21 = [0–4.05] | d*22 = [0–15.05] | d*23 = [0–25.05] | |
| Frontier | CTR=3 = 5.62 | d*31 = [0–3.38] | d*32 = [0–14.38] | d*33 = [0–24.38] | |
| Region | Scenarios | Changes | Population (Person) | Land (Square Miles) | ||||
|---|---|---|---|---|---|---|---|---|
| Sum | Covered | Ratio | Sum | Covered | Ratio | |||
| Frontier PR=2(%) | Scenario 1 | As-Is | 105,889 | 103,368 | 97.6% | 35,616 | 31,306 | 87.9% |
| Scenario 2 | Speed ↑ | 105,889 | 104,686 | 98.9% | 35,616 | 33,237 | 93.3% | |
| Scenario 3 | Chute ↓ | 105,889 | 103,721 | 98.0% | 35,616 | 31,806 | 89.3% | |
| Scenario 4 | Speed ↑ & Chute ↓ | 105,889 | 104,876 | 99.0% | 35,616 | 33,576 | 94.3% | |
| Rural PR=1(%) | Scenario 1 | As-Is | 182,667 | 159,054 | 87.1% | 34,614 | 20,772 | 60.0% |
| Scenario 2 | Speed ↑ | 182,667 | 165,194 | 90.4% | 34,614 | 23,621 | 68.2% | |
| Scenario 3 | Chute ↓ | 182,667 | 163,034 | 89.3% | 34,614 | 22,384 | 64.7% | |
| Scenario 4 | Speed ↑ & Chute ↓ | 182,667 | 169,300 | 92.7% | 34,614 | 25,238 | 72.9% | |
| Urban PR=0(%) | Scenario 1 | As-Is | 384,035 | 350,271 | 91.2% | 483 | 327 | 67.7% |
| Scenario 2 | Speed ↑ | 384,035 | 368,065 | 95.8% | 483 | 376 | 77.8% | |
| Scenario 3 | Chute ↓ | 384,035 | 377,722 | 98.4% | 483 | 408 | 84.5% | |
| Scenario 4 | Speed ↑ & Chute ↓ | 384,035 | 382,504 | 99.6% | 483 | 429 | 88.8% | |
| Total P(%) | Scenario 1 | As-Is | 672,591 | 612,693 | 91.1% | 70,713 | 52,405 | 74.1% |
| Scenario 2 | Speed ↑ | 672, 591 | 637,945 | 94.8% | 70,713 | 57,235 | 80.9% | |
| Scenario 3 | Chute ↓ | 672, 591 | 644,477 | 95.8% | 70,713 | 54,598 | 77.2% | |
| Scenario 4 | Speed ↑ & Chute ↓ | 672, 591 | 656,680 | 97.6% | 70,713 | 59,243 | 83.8% | |
Publisher’s Note: MDPI stays neutral with regard to jurisdictional claims in published maps and institutional affiliations. |
© 2021 by the authors. Licensee MDPI, Basel, Switzerland. This article is an open access article distributed under the terms and conditions of the Creative Commons Attribution (CC BY) license (http://creativecommons.org/licenses/by/4.0/).
Share and Cite
Lee, E.; McDonald, M.; O’Neill, E.; Montgomery, W. Statewide Ambulance Coverage of a Mixed Region of Urban, Rural and Frontier under Travel Time Catchment Areas. Int. J. Environ. Res. Public Health 2021, 18, 2638. https://doi.org/10.3390/ijerph18052638
Lee E, McDonald M, O’Neill E, Montgomery W. Statewide Ambulance Coverage of a Mixed Region of Urban, Rural and Frontier under Travel Time Catchment Areas. International Journal of Environmental Research and Public Health. 2021; 18(5):2638. https://doi.org/10.3390/ijerph18052638
Chicago/Turabian StyleLee, EunSu, Melanie McDonald, Erin O’Neill, and William Montgomery. 2021. "Statewide Ambulance Coverage of a Mixed Region of Urban, Rural and Frontier under Travel Time Catchment Areas" International Journal of Environmental Research and Public Health 18, no. 5: 2638. https://doi.org/10.3390/ijerph18052638
APA StyleLee, E., McDonald, M., O’Neill, E., & Montgomery, W. (2021). Statewide Ambulance Coverage of a Mixed Region of Urban, Rural and Frontier under Travel Time Catchment Areas. International Journal of Environmental Research and Public Health, 18(5), 2638. https://doi.org/10.3390/ijerph18052638