
Soil Contamination Assessments from Drilling Fluids and Produced Water Using Combined Field and Laboratory Investigations: A Case Study of Arkansas, USA


Abstract
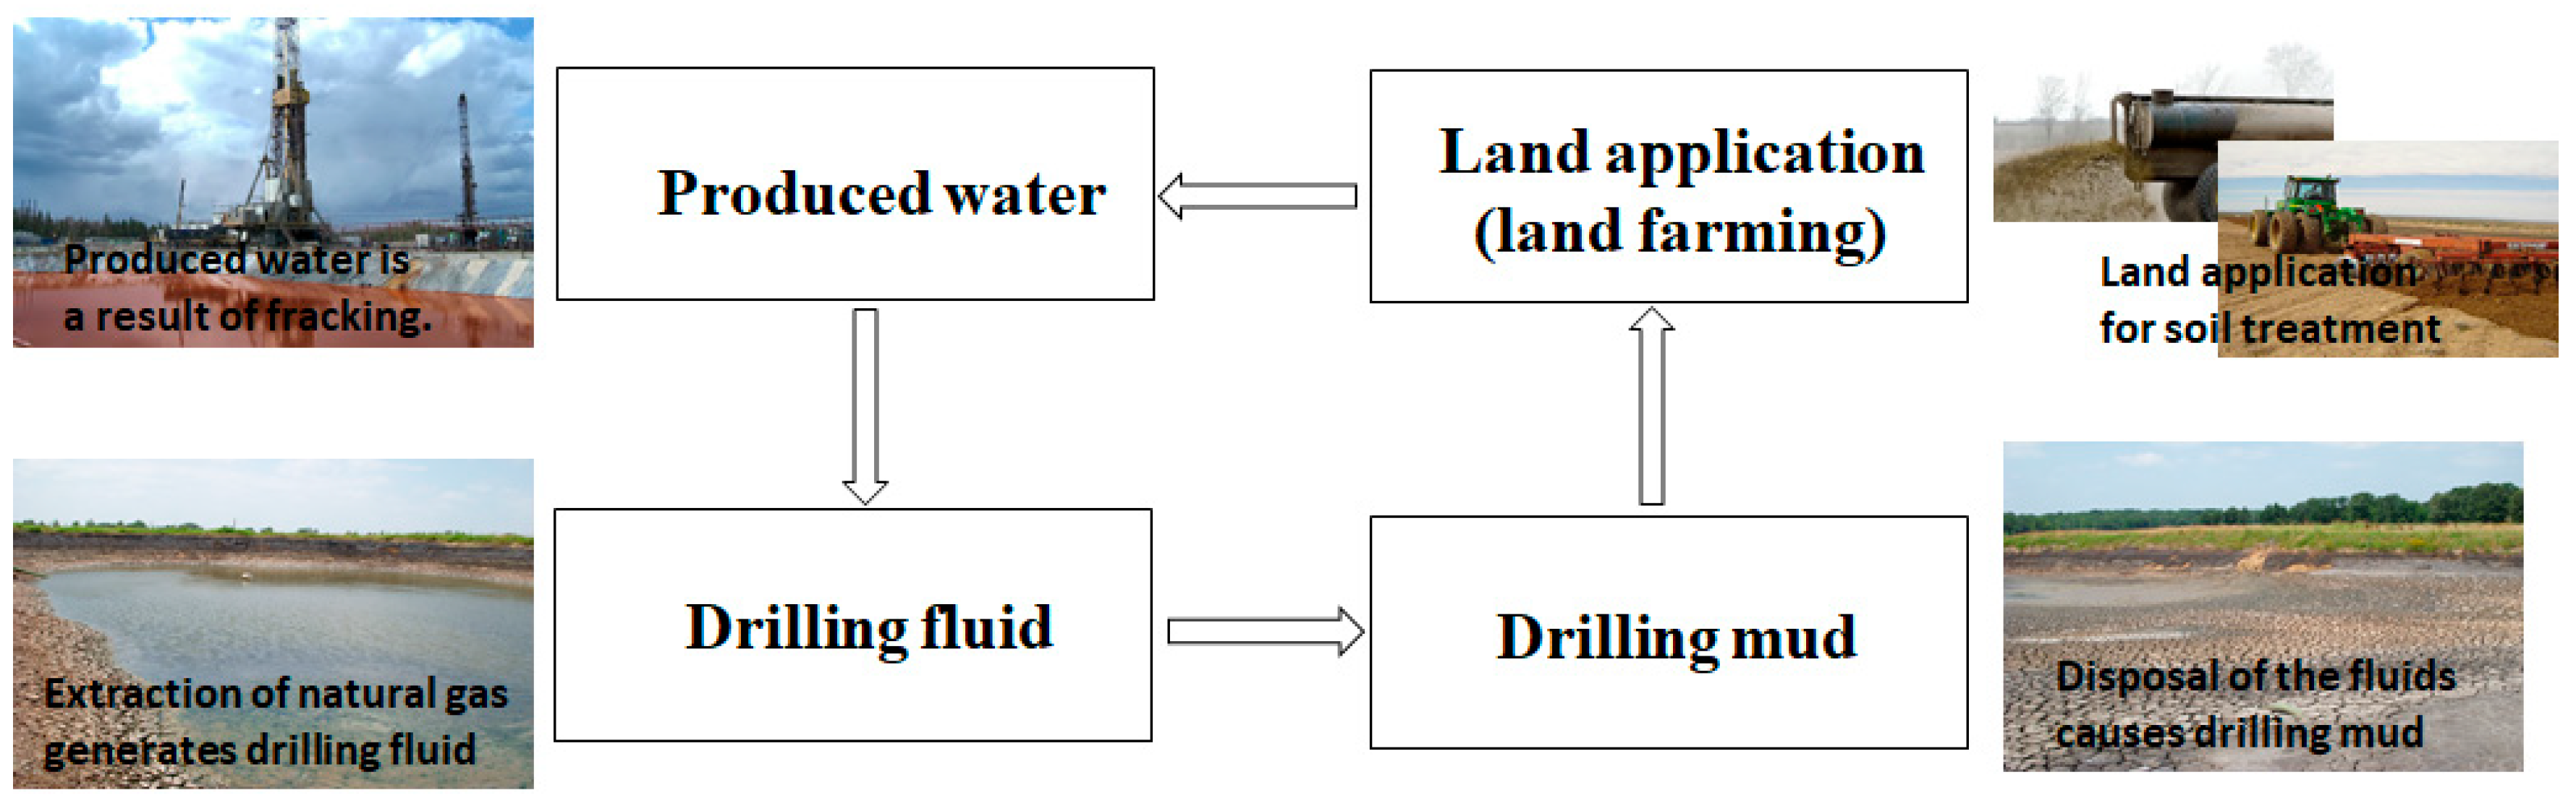
1. Introduction
2. Study Area
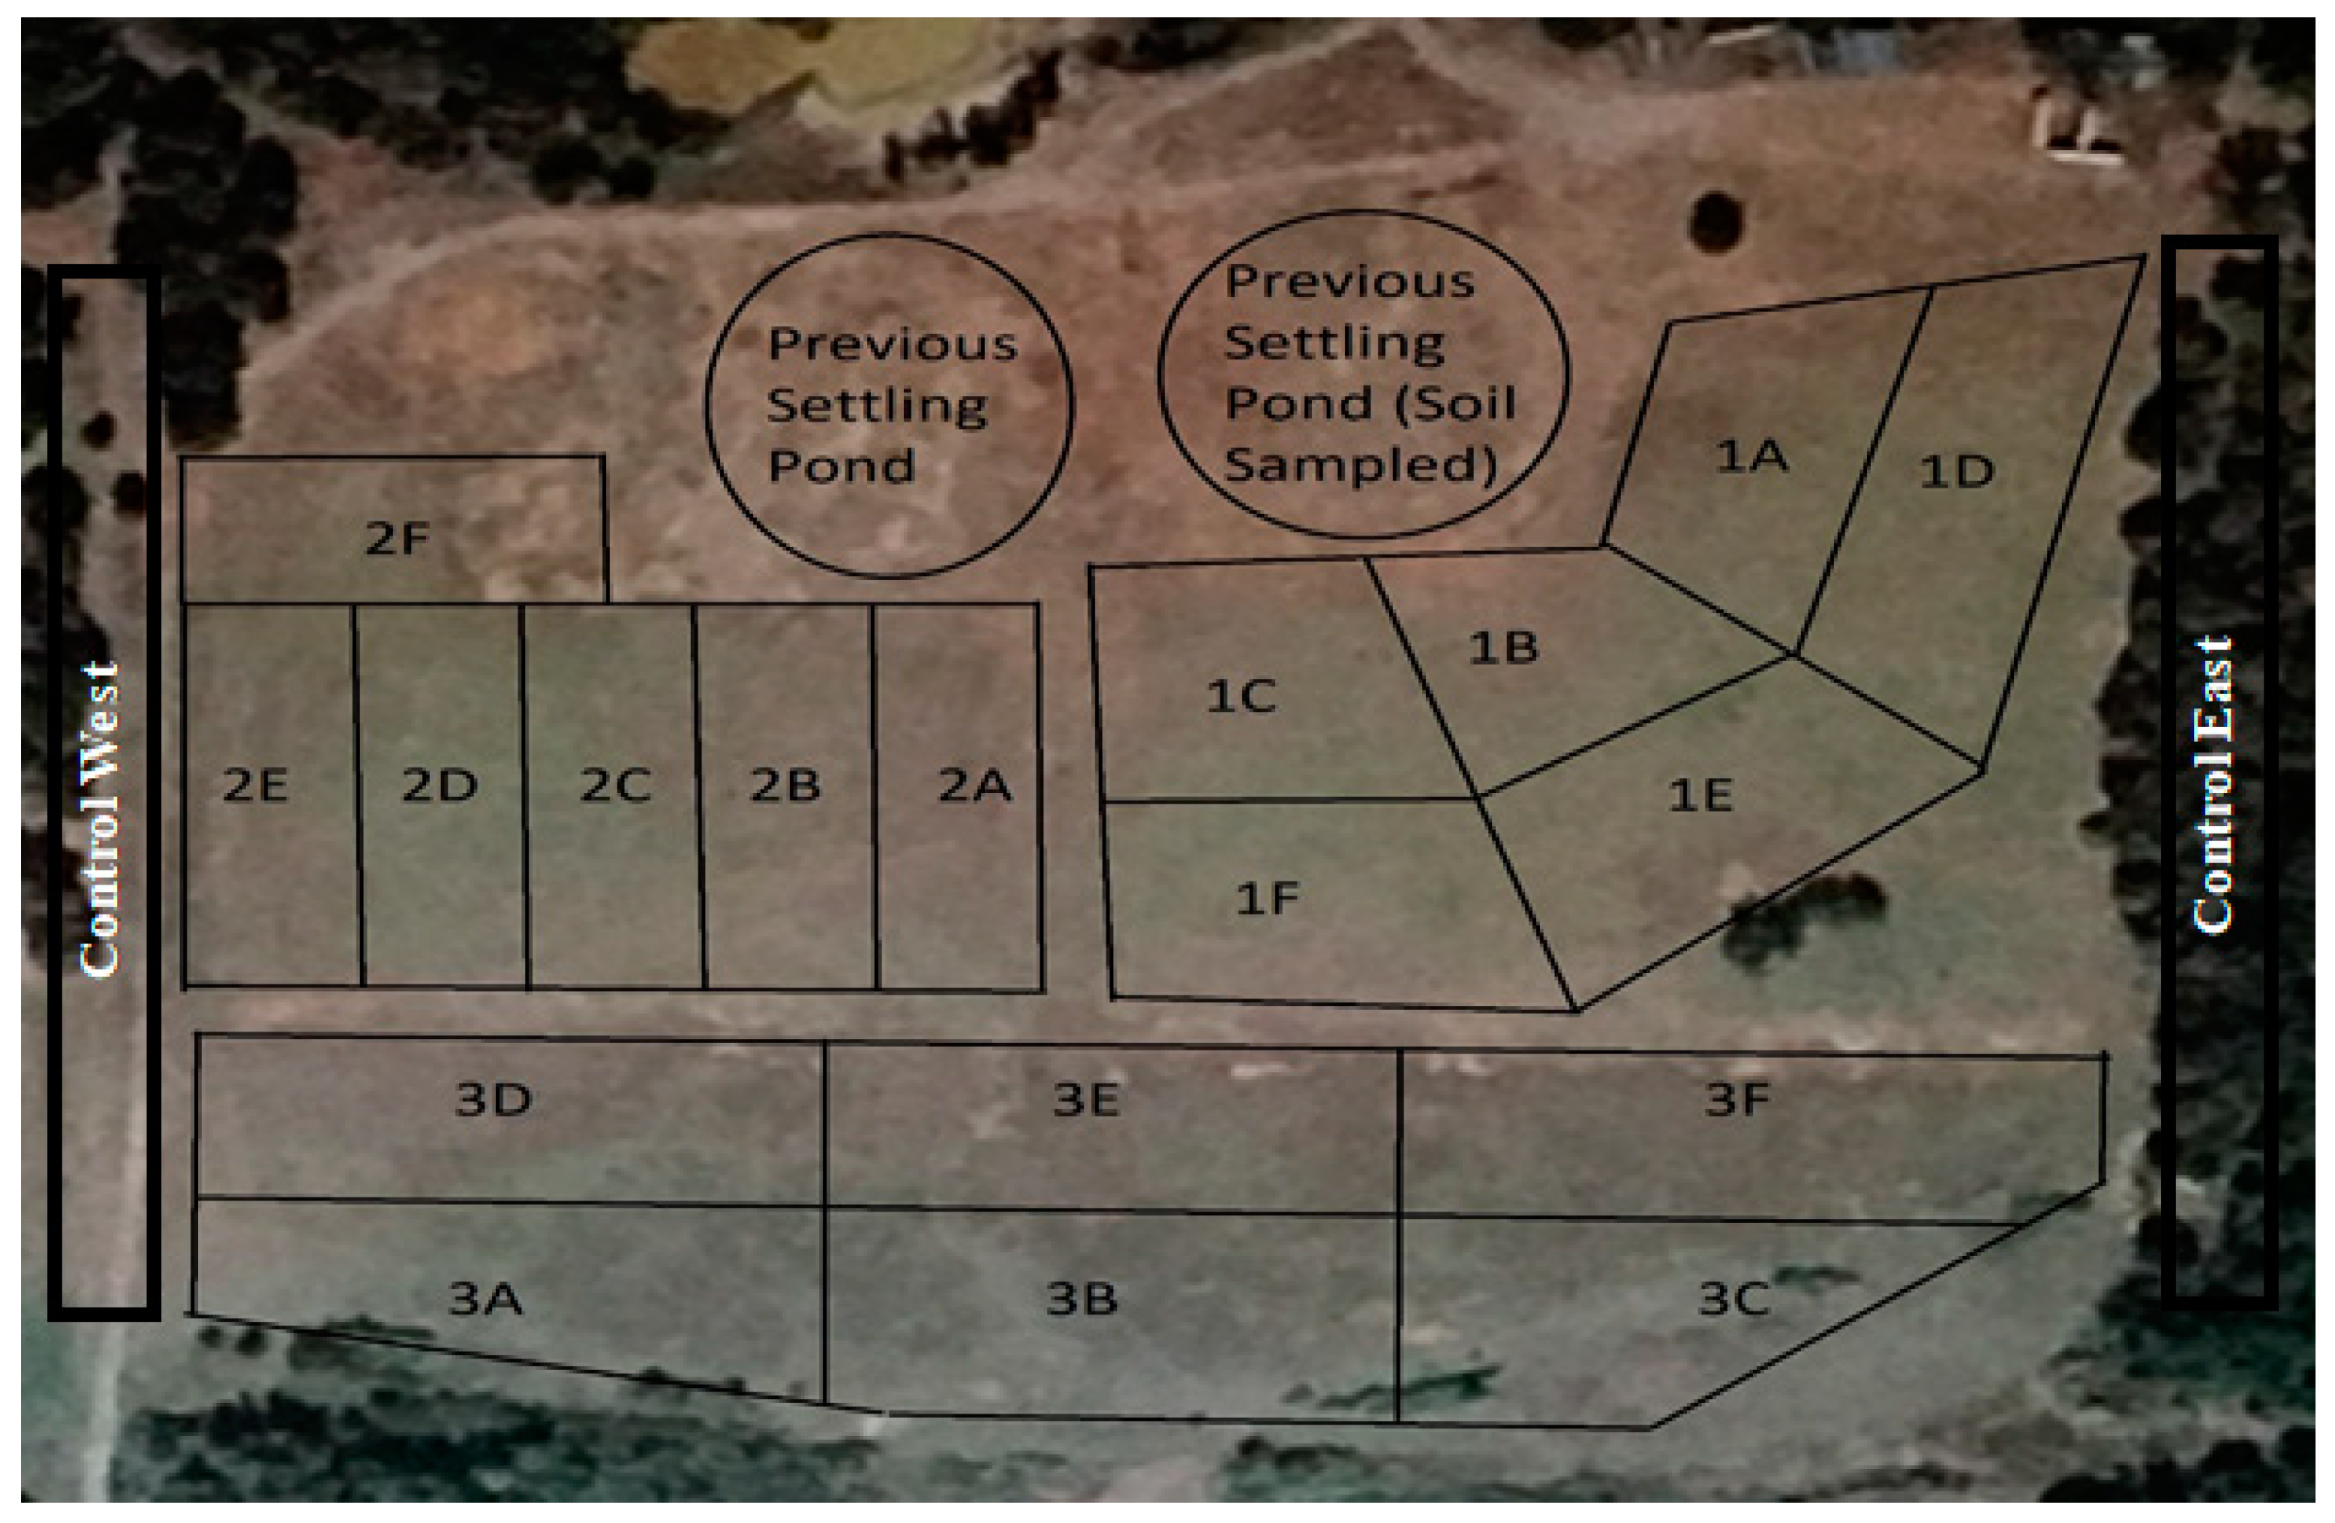
2.1. Land-Farm Profile
2.2. Soil Characteristics
3. Materials and Methods
4. Results and Discussion
4.1. Drilling Mud Results
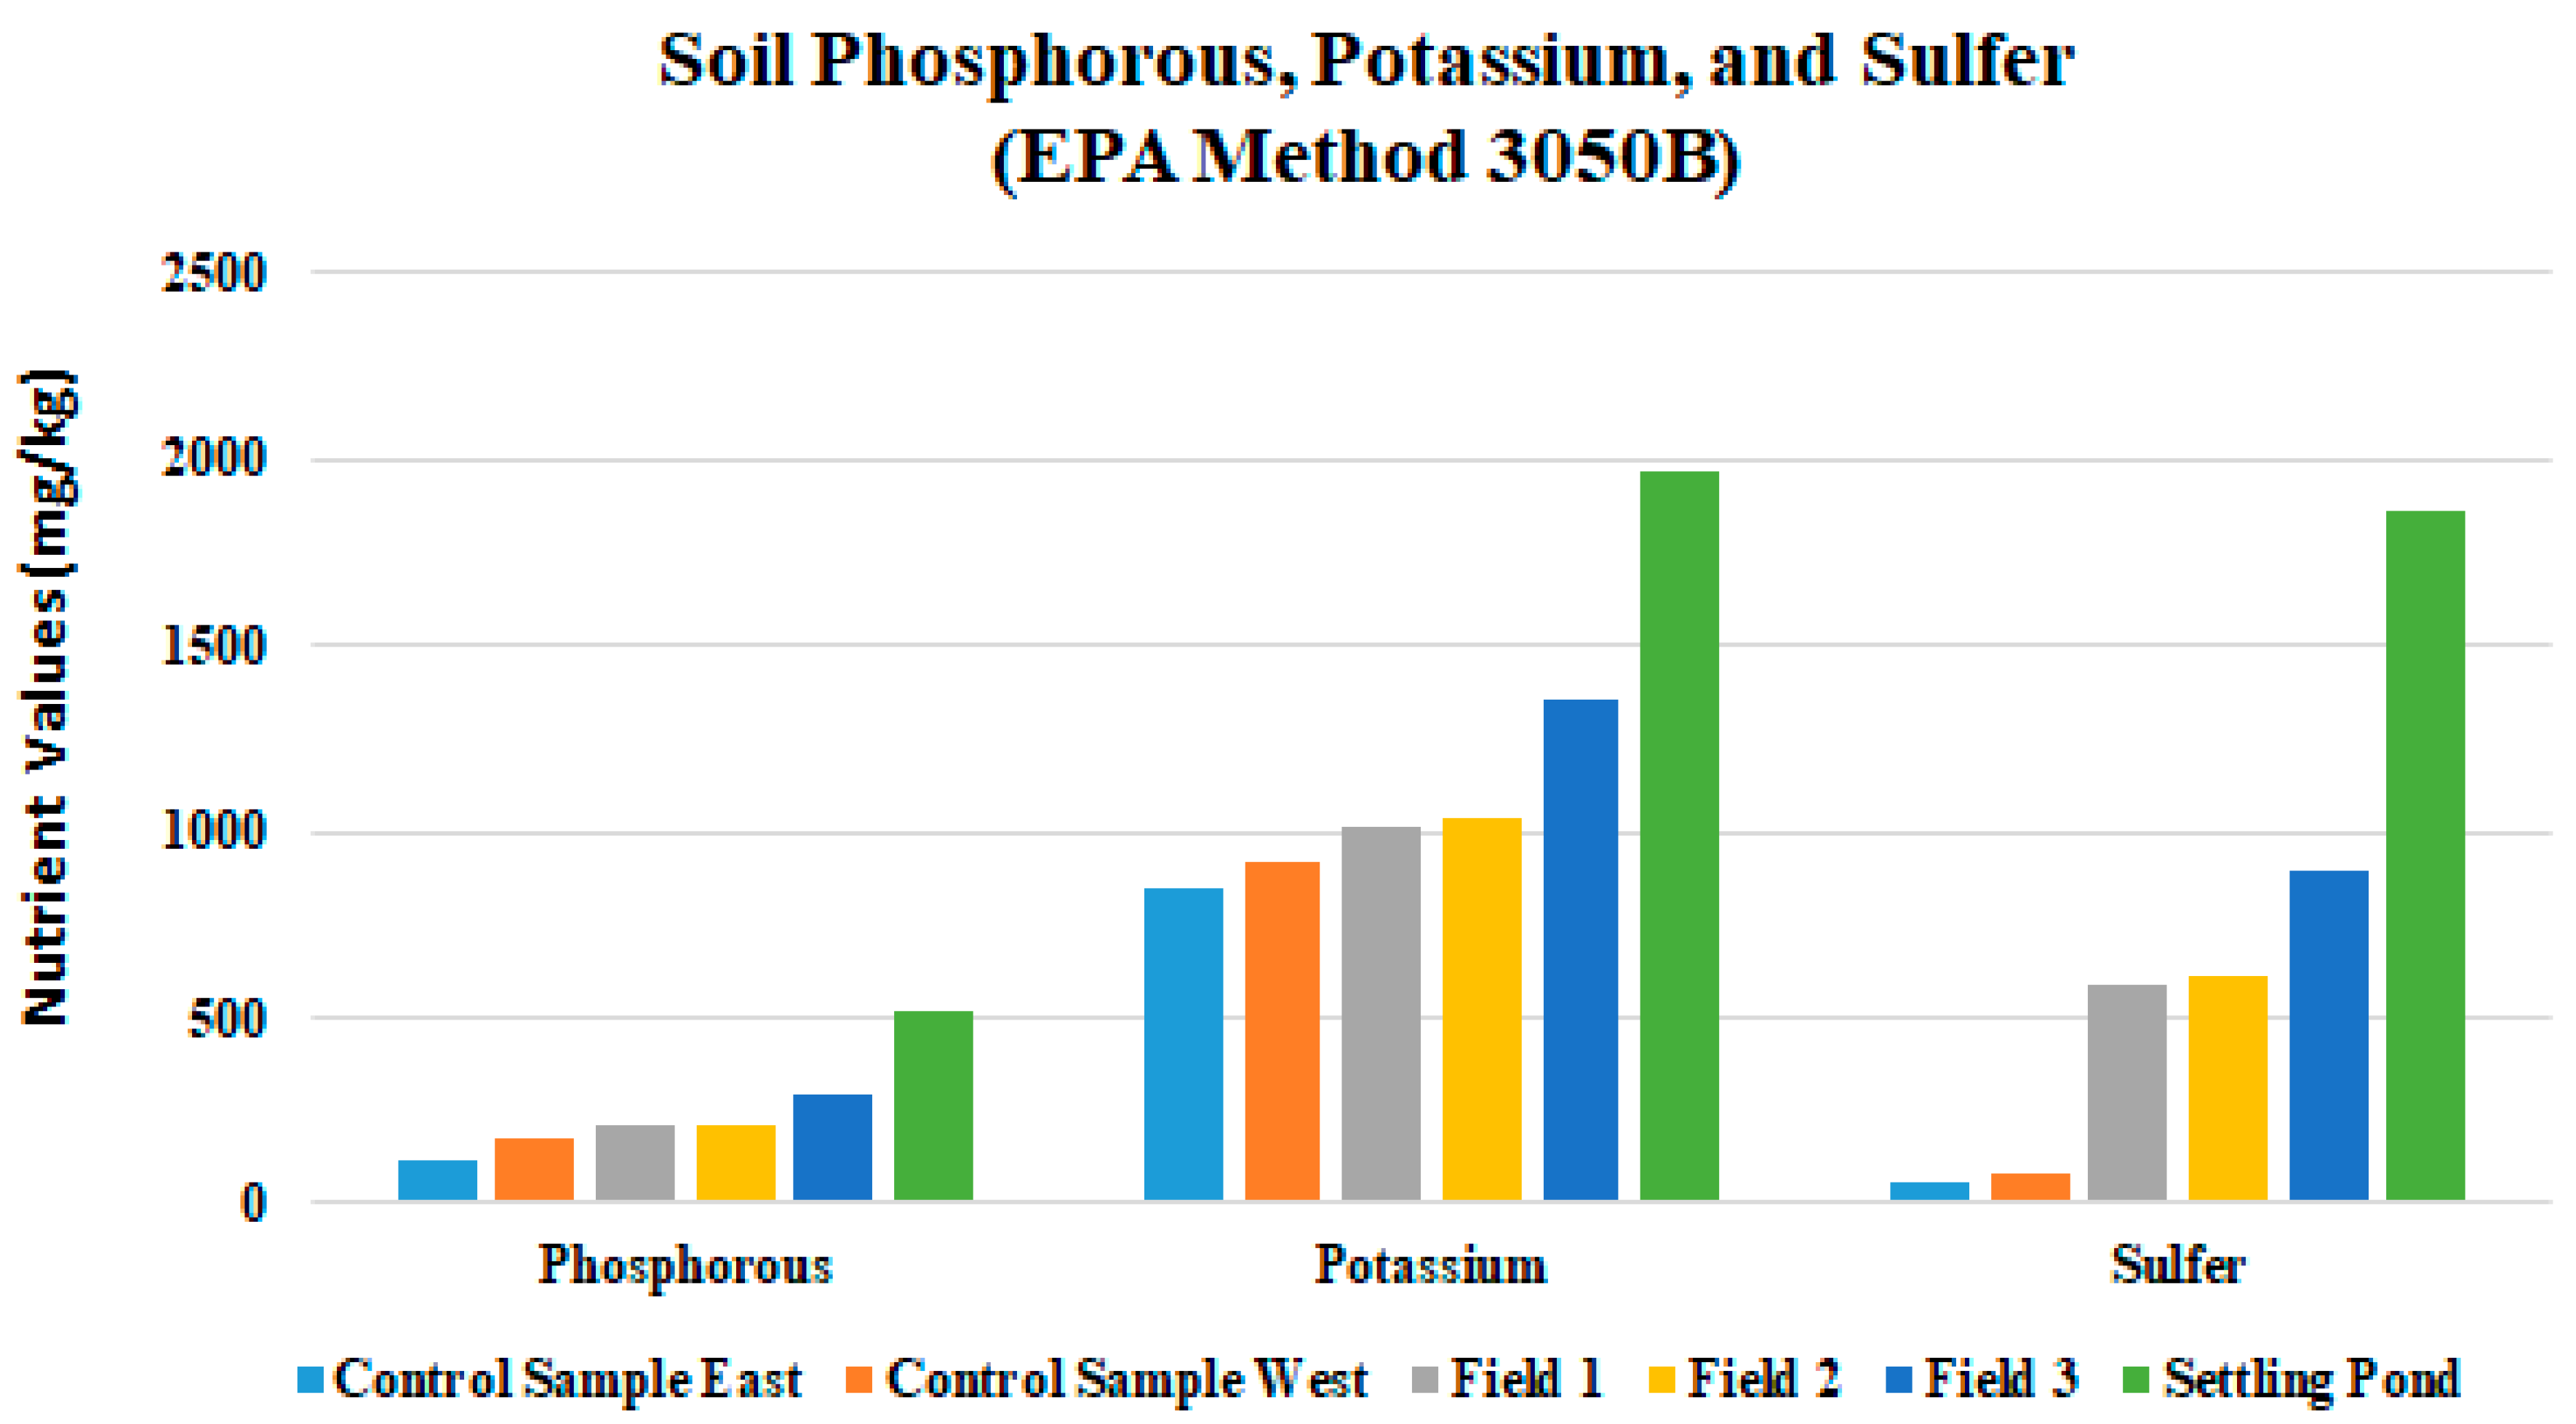
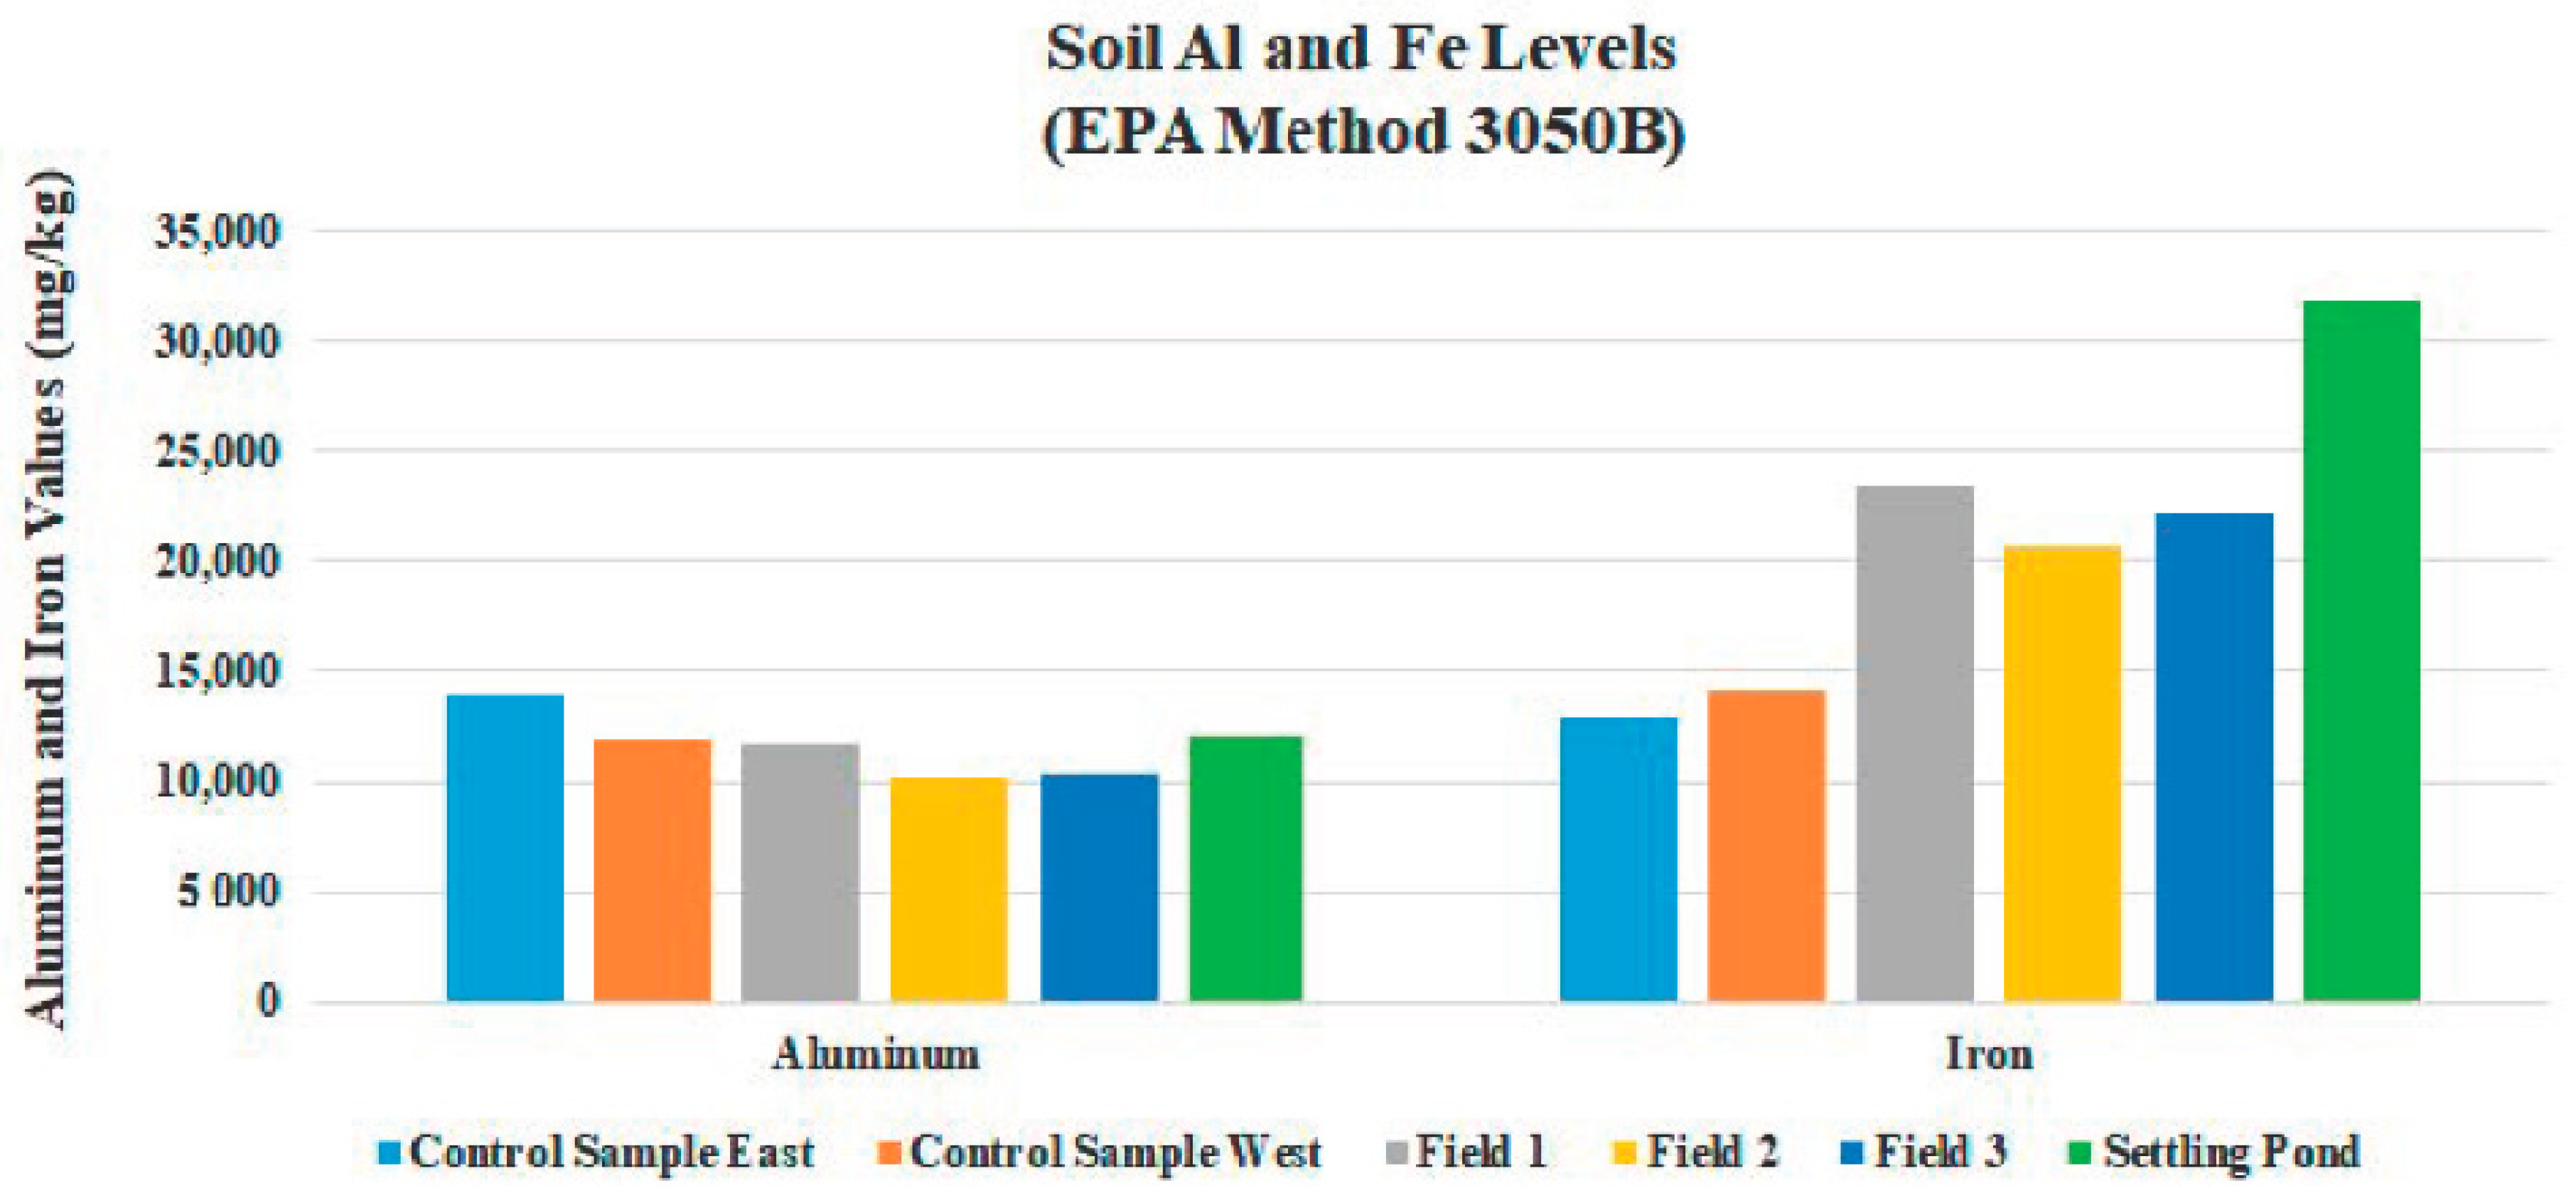
4.2. Soil Analysis
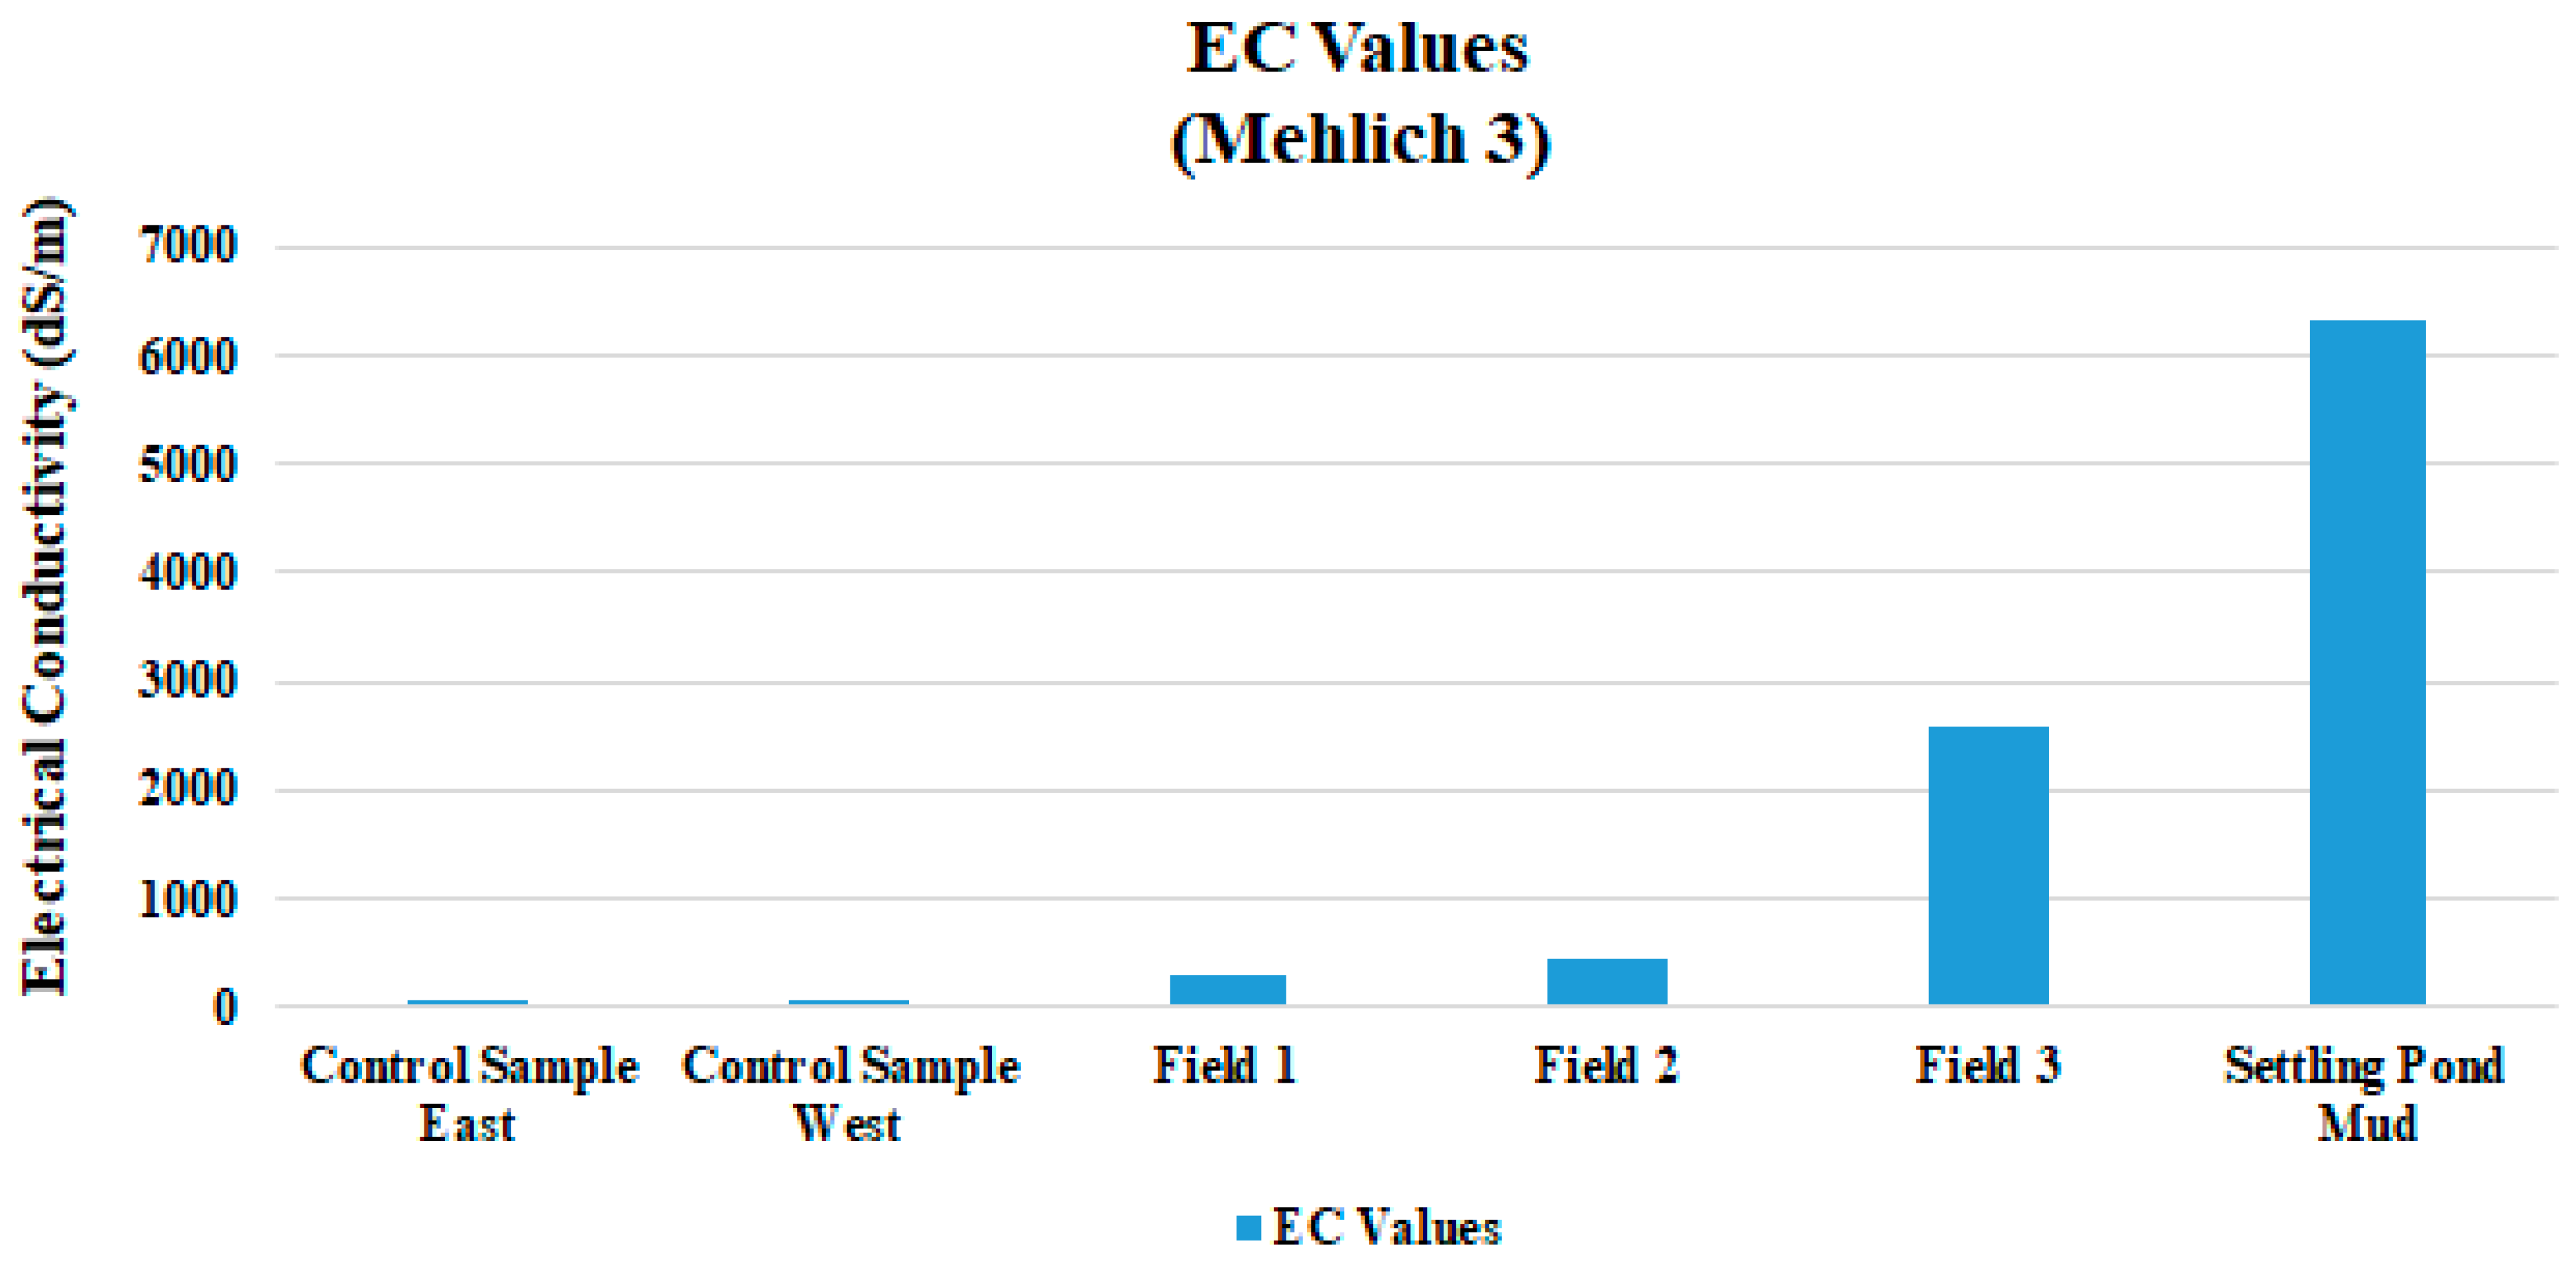
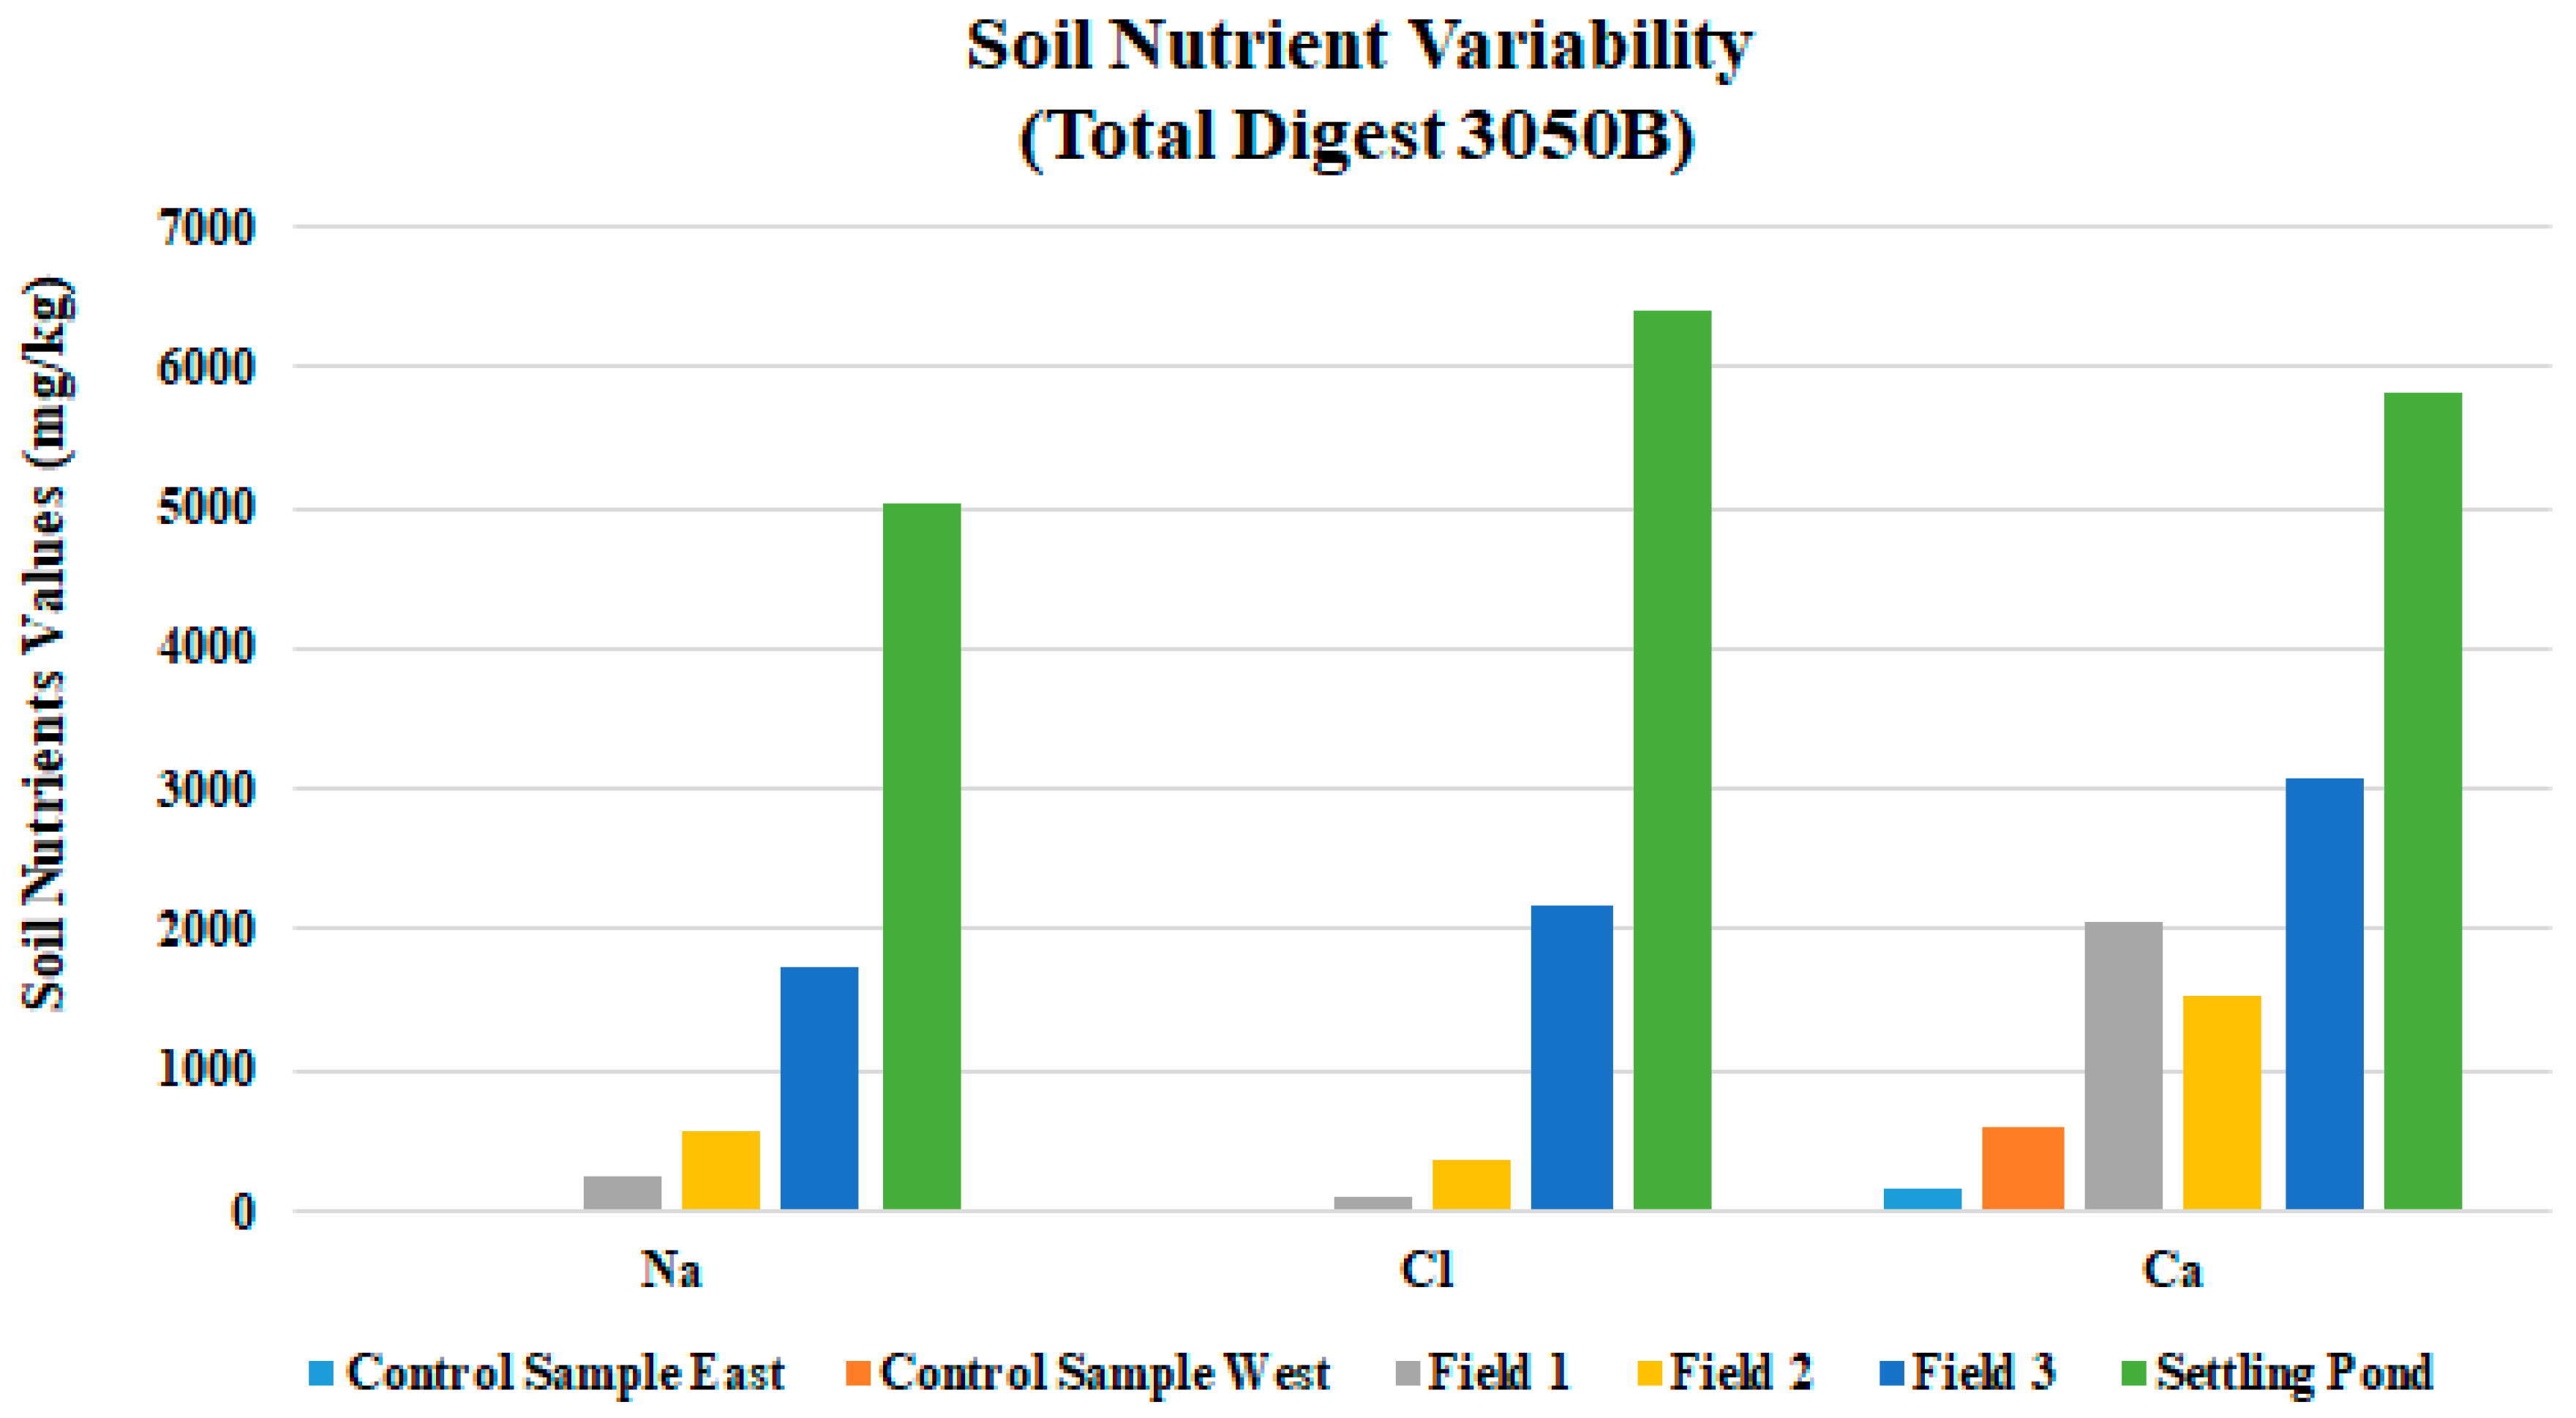
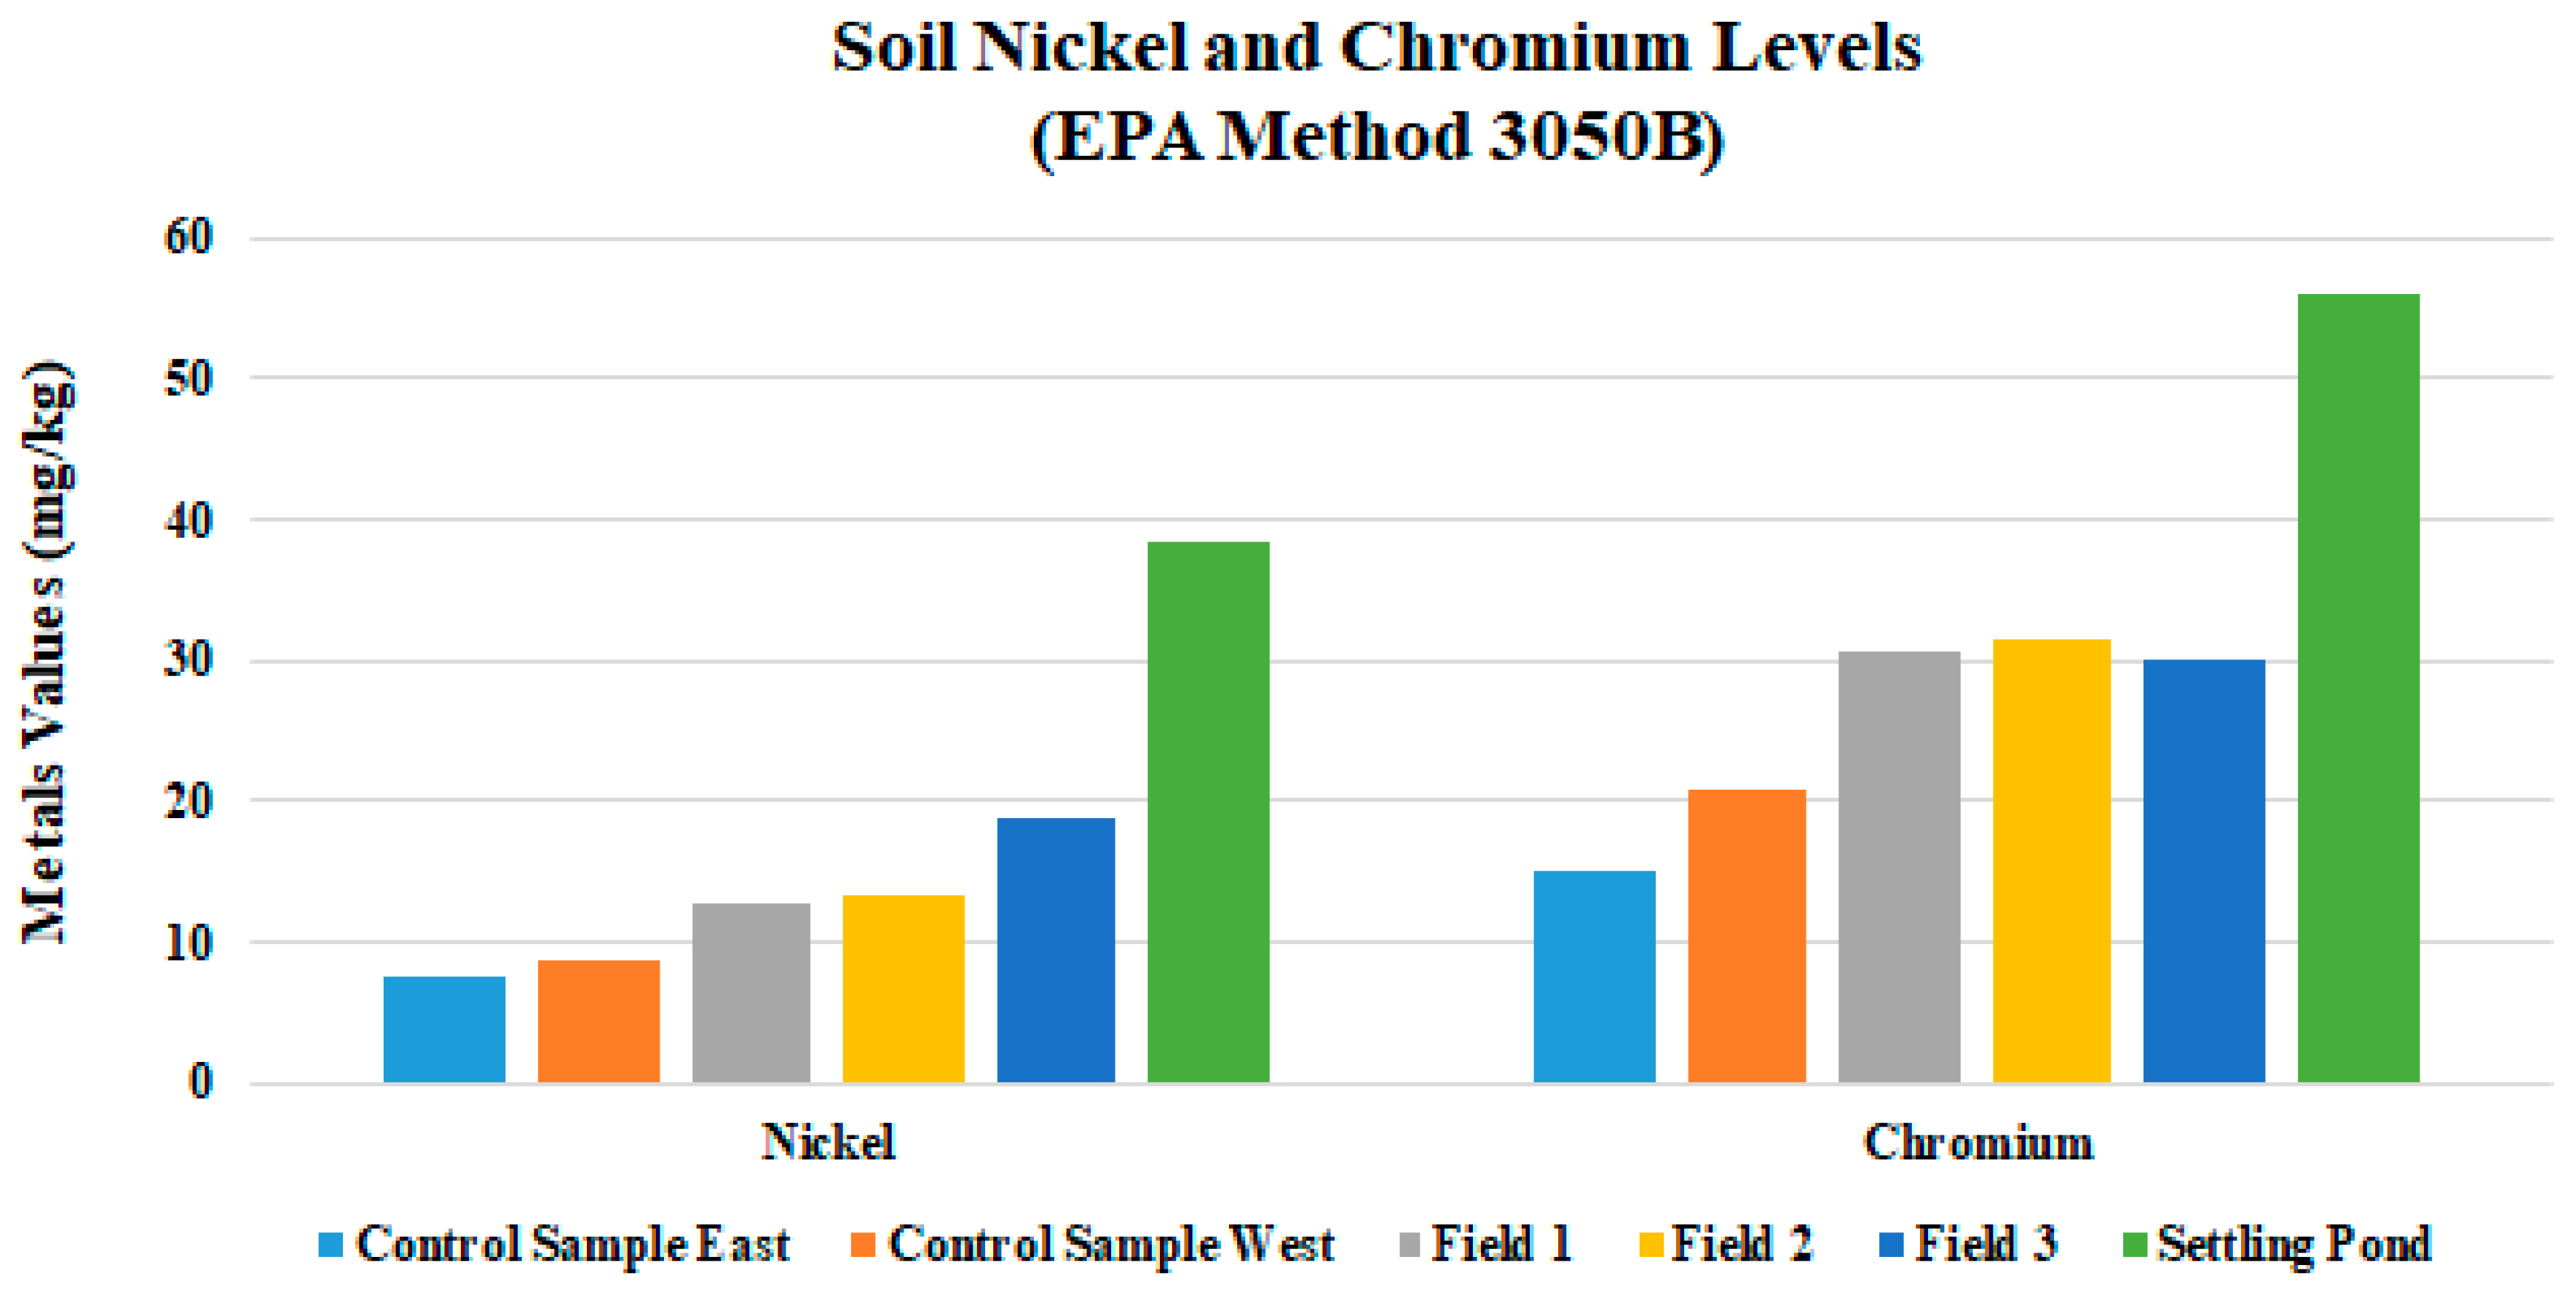
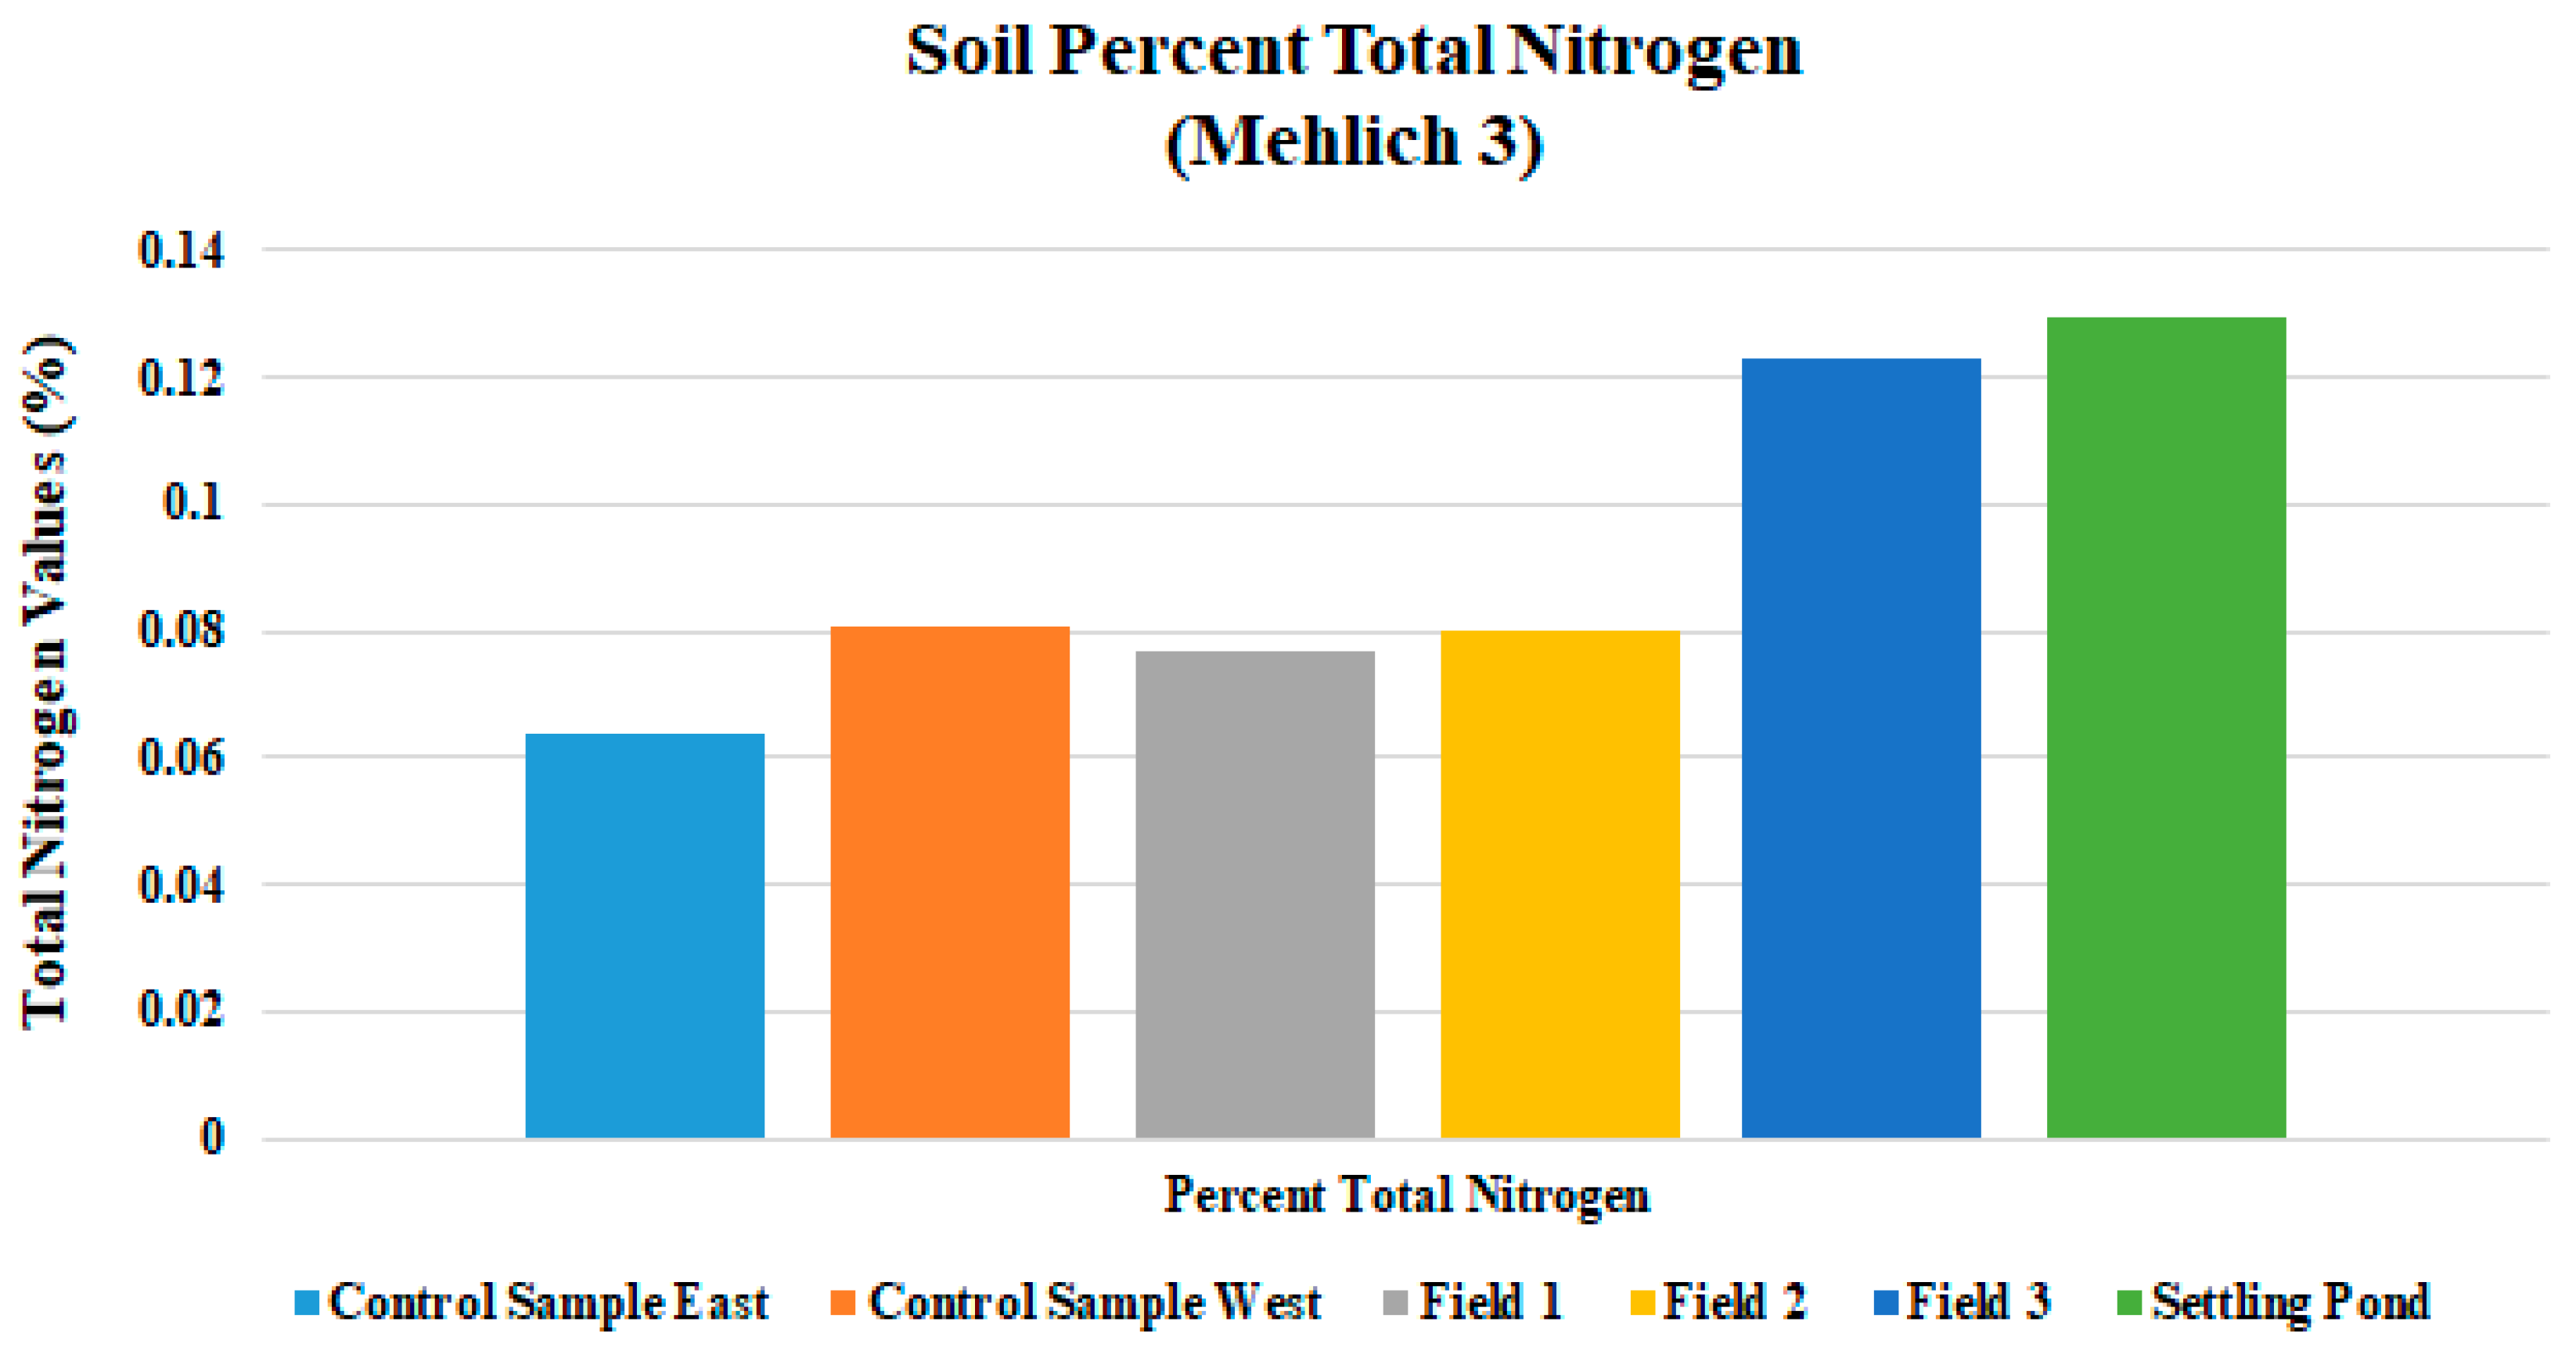
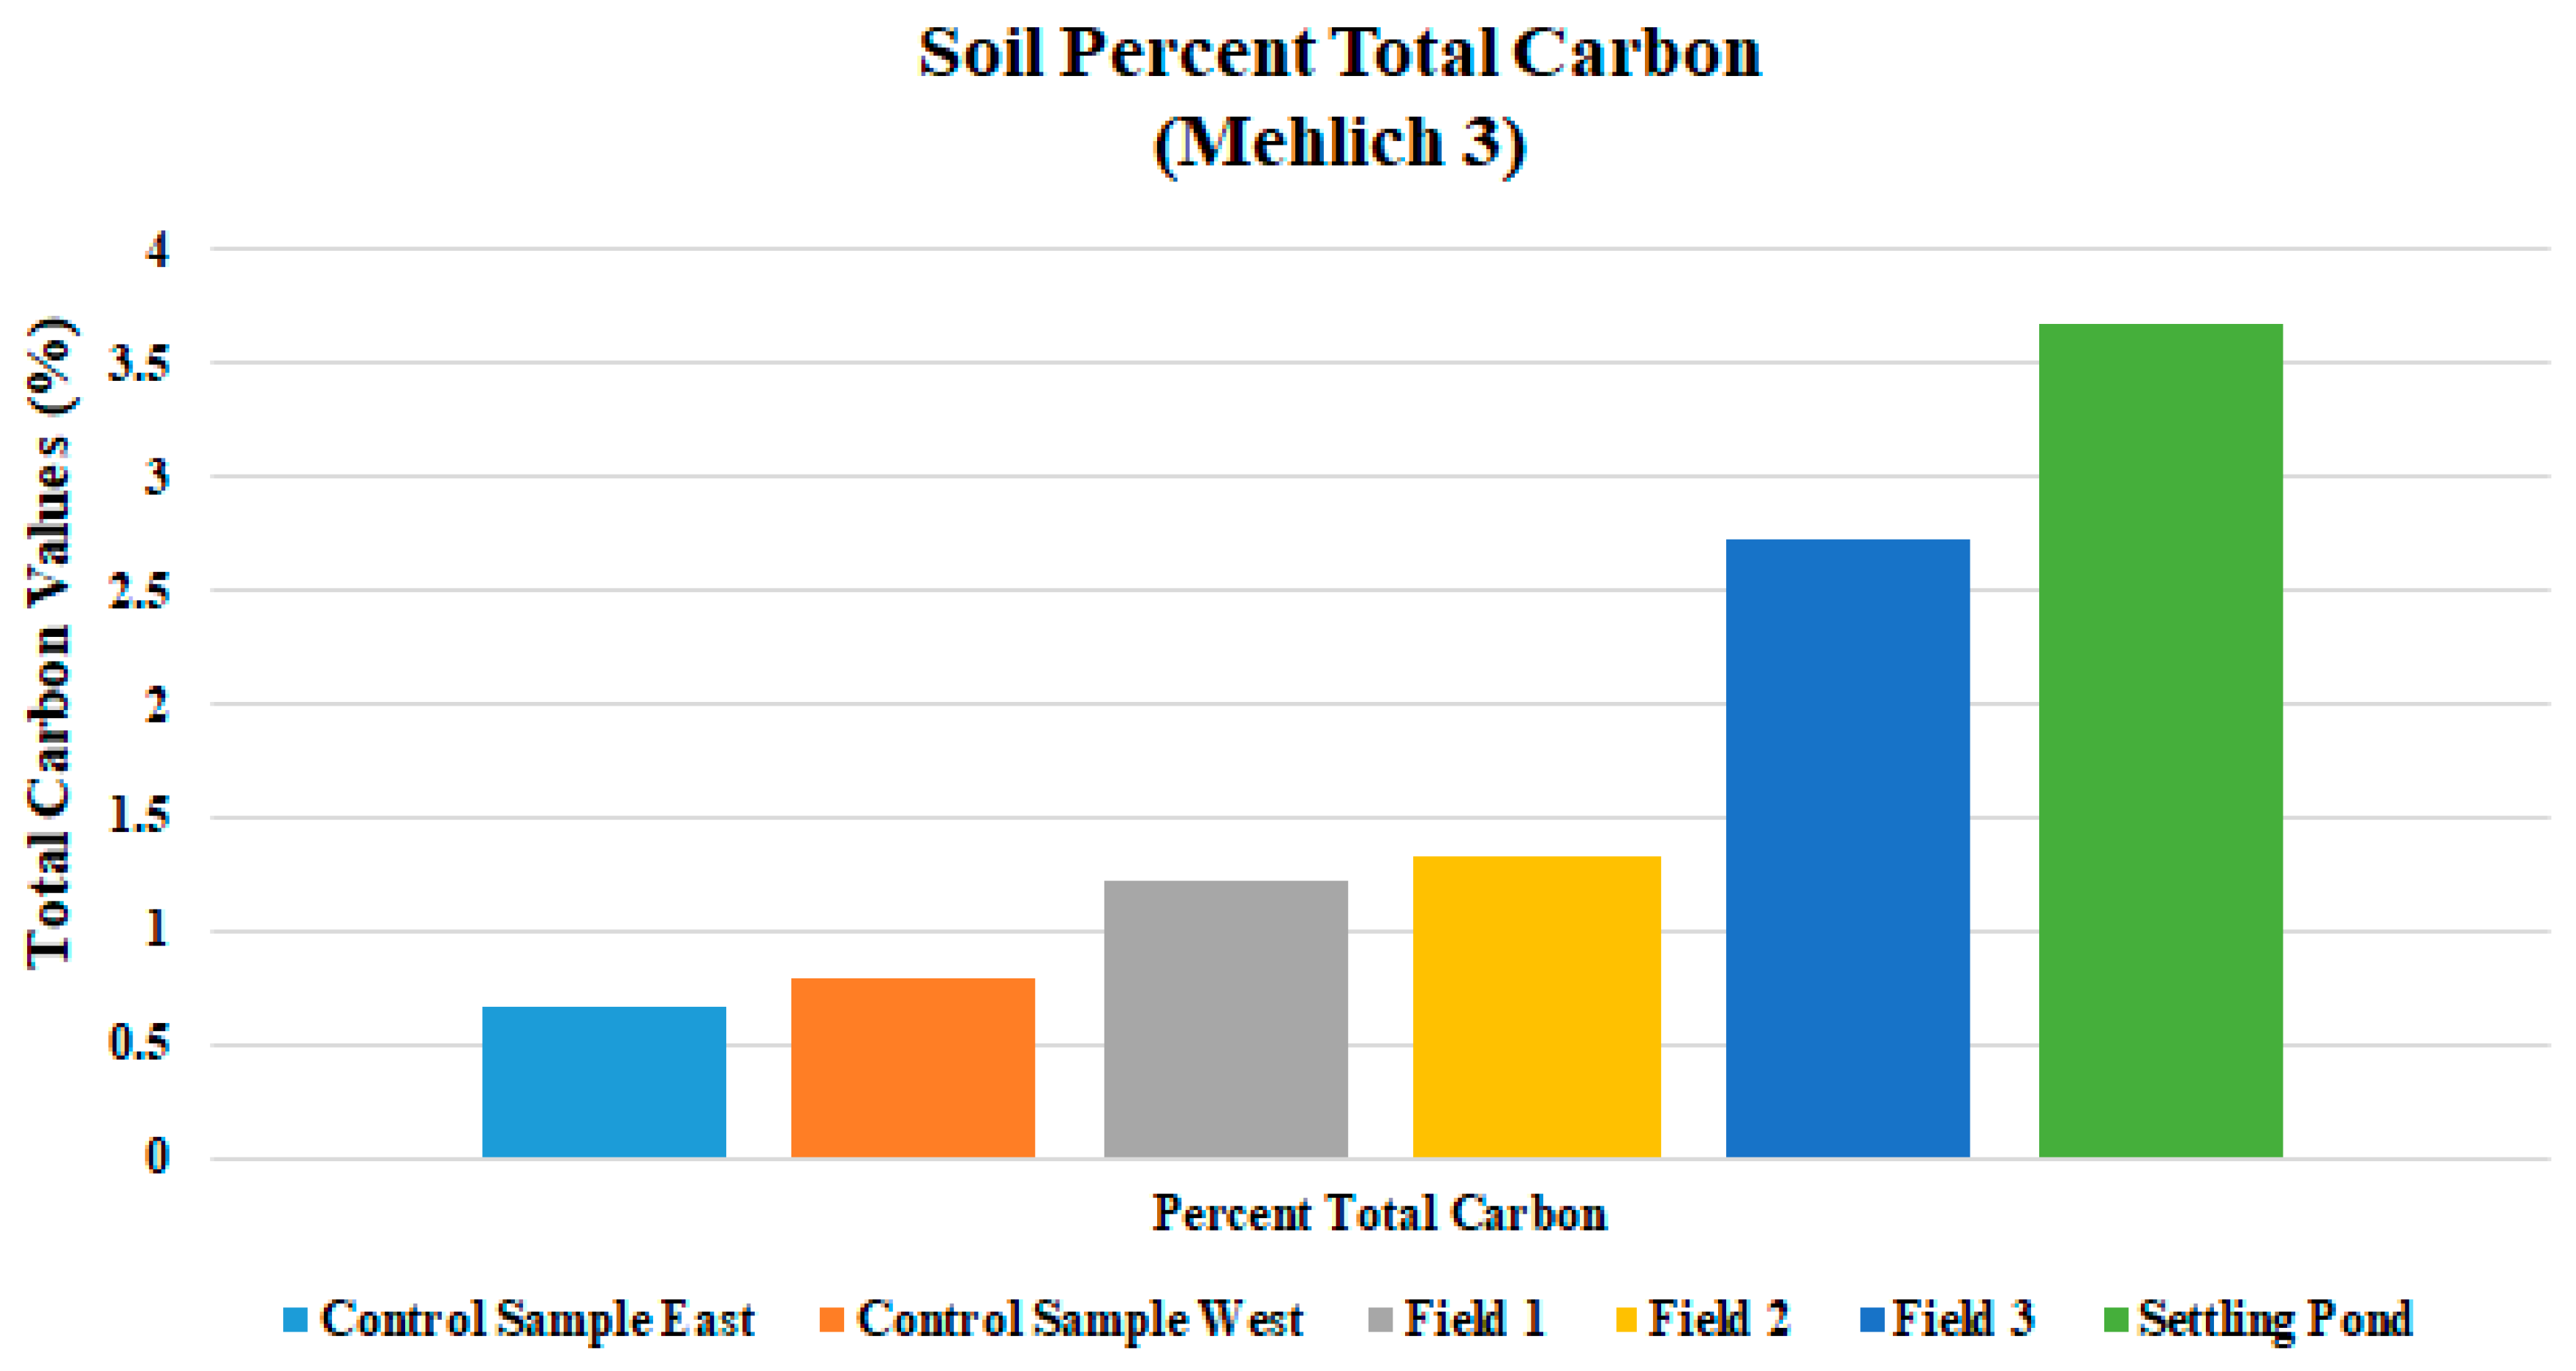
4.3. Field Variability
4.4. Contamination with Fluids
5. Conclusions
Author Contributions
Funding
Institutional Review Board Statement
Informed Consent Statement
Data Availability Statement
Conflicts of Interest
References
- Bauder, T.A.; Barbarick, K.A.; Ippolito, J.A.; Shanahan, J.F.; Ayers, P.D. Soil properties affecting wheat yields following drilling fluid application. J. Environ. Qual. 2005, 34, 1687–1696. [Google Scholar] [CrossRef] [PubMed]
- Pichtel, J. Oil and gas production wastewater: Soil contamination and pollution prevention. Appl. Environ. Soil Sci. 2016, 2016, 1–24. [Google Scholar] [CrossRef]
- Simpson, J.P. Drilling fluid principles and operations. In Farley Fisher (Project Officer) Congress Proctection, Environment Aspects Chemical Use in Well Drilling Operations; EPA 560/1-75-004; Office of Toxic Substances: Houston, TX, USA, 1975; pp. 463–472. [Google Scholar]
- Englehardt, F.R.; Ranier, F.; Ray, J.P.; Gillam, A.H. Drilling Wastes. 1988, pp. 343–345. Available online: https://www.spectrumanalytic.com/support/library/ff/Soil_Aluminum_and_test_interpretation.htm (accessed on 2 January 2020).
- Chen, J.; Jiang, Q.; Zong, J.; Chen, Y.; Chu, X.; Liu, J. Variation in the salt-tolerance of 13 genotypes of hybrid bermudagrass [Cynodon dactylon (L.) Pers. X C. ransvaalensis Burtt-Davy] and its relationship with shoot Na, K, and Cl ion concentrations. J. Hortic. Sci. Biotechnol. 2014, 89, 35–40. [Google Scholar] [CrossRef]
- Rodriguez, J.; Heo, J.; Park, J.; Lee, S.; Miranda, K. Inorganic pollutants in the water of Midland and Odessa, Permian Basin, west Texas. Air Soil Water Res. 2019, 12, 1178622119861089. [Google Scholar] [CrossRef]
- Vipulanandan, C.; Mohammed, A. Effect of drilling mud bentonite contents on the fluid loss and filter cake formation on a field clay soil formation compared to the API fluid loss method and characterized using Vipulanandan models. J. Pet. Sci. Eng. 2020, 189, 107029. [Google Scholar] [CrossRef]
- Miller, R.W.; Pearson, P. Effects of drilling fluid on soils and plants: II. Complete Drilling Fluid Mixtures. J. Environ. Qual. 1980, 9, 552–556. [Google Scholar] [CrossRef]
- Lamond, R.E.; Leikam, D.F. Chloride in Kansas: Plant, Soil, and Fertilizer Considerations; Kansas State University: Manhattan, KS, USA, 2002; Available online: http://www.ksre.ksu.edu/library/crpsl2/mf2570.pdf (accessed on 10 July 2020).
- Rodriguez, J.; Heo, J.; Kim, K. The Impact of hydraulic fracturing on groundwater quality in the Permian Basin, west Texas, USA. Water 2020, 12, 796. [Google Scholar] [CrossRef]
- Chen, J.B.; Yan, J.; Qian, Y.L.; Jiang, Y.Q.; Zhang, T.T.; Guo, H.L.; Guo, A.G.; Liu, J.X. Growth responses and ion regulation of four warm season turfgrasses to long-term salinity stress. Hort. Sci. 2009, 122, 620–625. [Google Scholar] [CrossRef]
- U.S. Army Corps of Engineers. Engineering and Design: Geotechnical Investigations. Eng. Man. 1110-1-1804; US Army Corps of Engineers: Washington, DC, USA, 2001. [Google Scholar]
- Zimmerman, P.K.; Robert, J.D. Oil-based drill cuttings treated by land farming. Oil Gas J. 1991, 32, 81–84. [Google Scholar]
- McFarland, M.L.; Ueckett, D.N.; Hons, F.M.; Hartman, S. Selective olacement burial of drilling fluid mixtures. J. Environ. Qual. 1992, 21, 140–144. [Google Scholar] [CrossRef]
- Nelson, R.; Heo, J. Monitoring environmental parameters with oil and gas developments in the Permian Basin, USA. Int. J. Environ. Res. Public Health 2020, 17, 4026. [Google Scholar] [CrossRef] [PubMed]
- Arkansas Department of Environmental Quality (ADEQ). Regulation No. 8: Administration. 2009. Available online: http://www.adeq.state.ar.us/regs/files/reg08_final_090228.pdf (accessed on 25 September 2019).
- Arkansas Department of Environmental Quality (ADEQ). Regulation No. 23: Hazardous Waste Management. 2012. Available online: http://www.adeq.state.ar.us/regs/files/reg23_final_120812 (accessed on 25 September 2019).
- Boulding, J.R. Description and Sampling of Contaminated Soils: A Field Guide, 2nd ed.; CRC Press: Boca Raton, FL, USA, 1994; pp. 31–78. [Google Scholar]
- Yoo, C.; Han, Y. Effect of drilling fluid on concrete-soil/rock interface shear strength in seawater drilling environment. Mar. Georesources Geotechnol. 2019, 37, 936–944. [Google Scholar] [CrossRef]
- Zvomuya, F.F.; Larney, P.; DeMaere, M.; Olson, A. Hydraulic properties of a sandy loam soil following spent drilling mud application on Native Prairie. Soil Sci. Soc. Am. J. 2009, 73, 1108–1112. [Google Scholar] [CrossRef]
- U.S. Geological Survey (USGS). Water Use in Arkansas. 1995. Available online: https://pubs.er.usgs.gov/publication/ofr99188 (accessed on 3 May 2020).
- United States Department of Agriculture (USDA). Soil Survey Staff—Natural Resources Conservation Service, Web Soil Survey. 2006. Available online: http://websoilsurvey.nrcs.usda.gov/ (accessed on 23 November 2019).
- Heo, J.; Yu, J.; Giardino, J.; Cho, H. Impacts of climate and land-cover changes on water resources in a humid subtropical watershed: A case study from east Texas, USA. Water Environ. J. 2015, 29, 51–60. [Google Scholar] [CrossRef]
- Pier, J. Western Fertilizer Handbook; Third Horticulture Edition; Waveland Press: New York, NY, USA, 1990; pp. 5–10, 37–40, 58–83. [Google Scholar]
- Bottomley, P.; Angle, S.; Weaver, R. Methods of Soil Analysis: Part 2—Microbiological and Biochemical Properties; Soil Science Society of America (SSSA): Madison, WI, USA, 1994; pp. 179–198. [Google Scholar]
- Wolf, D.C.; Brye, K.R.; Edward, G.E. Using soil amendments to increase bermuda grass growth in soil contaminated with hydraulic fracturing drilling fluid. Soil Sediment Contam. Int. J. 2015, 24, 846–864. [Google Scholar]
- Takaki, S.; Wolf, D.C. Plant growth in soil amended with drilling mud. Discovery 2011, 12, 75–80. [Google Scholar]
- Calabrese, E.J.; Kostecki, P.T.; Dragun, J. Contaminated Soils, Sediments and Water; Springer: Boston, MA, USA, 2005; pp. 181–184. [Google Scholar]
- McAlexander, B.L.; Krembs, F.J.; Mendoza, M. Treatability testing for weathered hydrocarbons in soils: Bioremediation, soil washing, chemical oxidation, and thermal desorption. Soil Sediment Contam. Int. J. 2015, 24, 882–897. [Google Scholar]
- Paul, E.A.; Clark, F.E. Soil Microbiology and Biochemistry, 3rd ed.; Academic Press: Cambridge, MA, USA, 2007; pp. 195–227. [Google Scholar]
- Kostecki, P.; Edward, J.; Calabrese, E. Petroleum Contaminated Soils; CRC Press: Boca Raton, FL, USA, 1989; pp. 35–47. [Google Scholar]
- Kostecki, P.T.; Calabrese, E.J. Hydrocarbon Contaminated Soils and Groundwater; CRC Press: Boca Raton, FL, USA, 1991; pp. 39–46. [Google Scholar]
- Bodek, I.; Lyman, W.J.; Reehl, W.F.; Rosenblatt, D.H. Environmental Inorganic Chemistry: Properties, Processes, and Estimation Methods; Pergamon Press: New York, NY, USA, 1988; pp. 1175–1206. [Google Scholar]
- Ikramuddin, B. Stratigraphic and Structural Analysis of Middle Atoka Formation in Aetna Gas Field, Franklin, Johnson and Logan Counties, Arkansas, University of Arkansas. 2015. Available online: https://scholarworks.uark.edu/cgi/viewcontent.cgi?article=2395&context=etd (accessed on 30 November 2019).


| Land-Farm Description | Field 1 | Field 2 | Field 3 |
|---|---|---|---|
| Location | Franklin County, AR (35°20′19.15″ N, 93° 56′46.34″ W) | ||
| Surface area (hectare) | 2.4 | 2.0 | 2.8 |
| Levels of drilling fluids | Low-level | Medium-level | High-level |
| Vegetation cover | Largest | Intermediate | Non |
| Soil Characteristics | Field 1 | Field 2 | Field 3 |
|---|---|---|---|
| Sand (%) | 11.5 | 10.4 | 7.8 |
| Silt (%) | 60.7 | 63.1 | 65.7 |
| Clay (%) | 27.8 | 26.5 | 26.5 |
| Minerals formation | Shale, Siltstone, Sandstone, Phyllite, Slate | ||
| Bulk density | 0.59–1.17 Mg m−3 | ||
| P | K | Ca | Mg | S | Na | Fe | Mn | Zn | Cu | B | Cl | Al | Pb | Cr | Ni | Ba | C | N | pH | EC |
|---|---|---|---|---|---|---|---|---|---|---|---|---|---|---|---|---|---|---|---|---|
| Mehlich-3 (mg/kg) | % | s.u. dS/m | ||||||||||||||||||
| 3.3 | 289 | 5767 | 513 | 461 | 4980 | 649 | 99 | 10.4 | 11 | 4.7 | 6425 | N/A | N/A | N/A | N/A | N/A | 3.7 | 0.13 | 8.0 | 6420 |
| Total Elemental (mg/kg) | ||||||||||||||||||||
| 521 | 1958 | 17,825 | 4263 | 1823 | 5335 | 32,255 | 762 | 93 | 59 | 13 | N/A | 12,125 | 111 | 57 | 38 | 1988 | N/A | N/A | N/A | N/A |
| Parameters | Field 1 | Field 2 | Field 3 | |||
|---|---|---|---|---|---|---|
| Mean | SD | Mean | SD | Mean | SD | |
| pH Units | 8.3 | ±0.3 | 8.2 | ±0.2 | 8 | ±0.3 |
| 1 Soil:2 Water Ratio | ||||||
| EC dS/m | 0.314 | 0.12 | 0.465 | 0.21 | 2.589 | 0.618 |
| Mehlich-3 Extractable Nutrient Levels | ||||||
| P | 4.1 | 0.7 | 3.5 | 0.2 | 3.9 | 0.2 |
| K | 188 | 20 | 186 | 15 | 186 | 26 |
| Ca | 2069 | 568 | 1526 | 275 | 3068 | 400 |
| Mg | 163 | 15 | 182 | 29 | 309 | 30 |
| S | 38.8 | 34.5 | 29.5 | 10.2 | 78.1 | 11.2 |
| Na | 260 | 82 | 563 | 167 | 1726 | 293 |
| Fe | 204 | 37 | 252 | 52 | 409 | 40 |
| Mn | 104 | 16 | 130 | 29 | 140 | 39 |
| Zn | 4.5 | 0.8 | 5.4 | 1.3 | 8.8 | 1 |
| Cu | 3.7 | 0.5 | 3.8 | 0.8 | 6.3 | 1 |
| B | 1.6 | 0.2 | 2.1 | 0.3 | 3.1 | 0.6 |
| Water Extractable | ||||||
| Cl | 98 | 45 | 380 | 234 | 2165 | 666 |
| Total C and N Levels | ||||||
| Total N % | 0.077 | 0.007 | 0.08 | 0.008 | 0.123 | 0.012 |
| Total C % | 1.231 | 0.173 | 1.328 | 0.233 | 2.726 | 0.304 |
| Parameters | Field 1 | Field 2 | Field 3 | |||
|---|---|---|---|---|---|---|
| Mean | SD | Mean | SD | Mean | SD | |
| S | 588 | 52 | 646 | 71 | 894 | 57 |
| Na | 351 | 97 | 608 | 165 | 1823 | 284 |
| Fe | 23,653 | 97 | 20,658 | 2007 | 22,274 | 1342 |
| Mn | 331 | 46 | 409 | 79 | 627 | 96 |
| Zn | 35.7 | 1.8 | 37.5 | 5.8 | 53.3 | 6 |
| Cu | 12.1 | 1 | 11.6 | 1.6 | 17.1 | 2.1 |
| B | 8.8 | 0.7 | 8.7 | 0.8 | 10.7 | 0.7 |
| Al | 11,881 | 1503 | 380 | 234 | 2165 | 666 |
| Cr | 30.9 | 3.9 | 31.5 | 7.7 | 30.2 | 2.8 |
| Ni | 12.9 | 0.3 | 13.3 | 1.4 | 18.8 | 1.9 |
| Ba | 2272 | 86 | 2416 | 174 | 2463 | 63 |
| Sample Description | Mehlich-3 | |||||||||||||||
|---|---|---|---|---|---|---|---|---|---|---|---|---|---|---|---|---|
| pH | EC | P | K | Ca | Mg | S | Na | Fe | Mn | Zn | Cu | B | Cl | %Total N | % Total C | |
| Units | ds/m | mg/kg | % | |||||||||||||
| 1A and 1A Duplicate | ||||||||||||||||
| Range | 0 | 0.34 | −0.5 | 20 | −24 | −5 | −4.5 | −32 | 4 | 5 | −0.1 | −0.1 | 0 | 11 | 0.03 | 0.052 |
| RPD | 0 | −11.6 | −11.8 | 10.3 | −1.6 | −3.3 | 35.6 | −8.4 | 2.3 | 5.1 | 2.5 | 2.7 | 0 | 12.3 | 4.1 | 4.4 |
| 3D and 3D Duplicate | ||||||||||||||||
| Range | 0.1 | 0.36 | 0.2 | 6 | 316 | 0 | 1 | −140 | 37 | 9 | 0.6 | 0.3 | 0.1 | 382 | 0.0175 | 0.526 |
| RPD | 1.3 | 12.1 | 5.1 | 1.9 | 10.6 | 0 | 1.35 | −7 | 9.3 | 5.7 | −7 | 5.3 | 3.6 | 13.5 | 14.8 | 20 |
| EPA Method 3050B | ||||||||||||||||
| P | K | Ca | Mg | S | Na | Fe | Mn | Zn | Cu | B | Al | Cr | Ni | Ba | ||
| 1A and 1A Duplicate | ||||||||||||||||
| Range | −24.7 | −15.55 | −274 | −56 | −41 | −48 | −1202 | −27 | 3 | −0.6 | −0.2 | −771 | −3.4 | −0.3 | 117 | |
| RPD | −10.7 | −1.53 | −12.8 | −5.4 | −7.5 | −10.7 | −4.7 | −8.6 | 8.5 | −4.9 | −2 | −6.21 | −9.4 | 2.3 | −5.4 | |
| 3D and 3D Duplicate | ||||||||||||||||
| Range | −12 | −4 | 39 | 41 | 94 | −48 | 952 | 9 | 4 | −0.6 | −0.2 | −220 | 3.9 | −0.2 | 68 | |
| RPD | −4.38 | −0.3 | −0.8 | 2.3 | 10.8 | −2.7 | 4.5 | 1.4 | 8 | −3.8 | −2 | −2.26 | 14 | −1.2 | 2.8 | |
Publisher’s Note: MDPI stays neutral with regard to jurisdictional claims in published maps and institutional affiliations. |
© 2021 by the authors. Licensee MDPI, Basel, Switzerland. This article is an open access article distributed under the terms and conditions of the Creative Commons Attribution (CC BY) license (http://creativecommons.org/licenses/by/4.0/).
Share and Cite
Swigart, J.; Heo, J.; Wolf, D. Soil Contamination Assessments from Drilling Fluids and Produced Water Using Combined Field and Laboratory Investigations: A Case Study of Arkansas, USA. Int. J. Environ. Res. Public Health 2021, 18, 2421. https://doi.org/10.3390/ijerph18052421
Swigart J, Heo J, Wolf D. Soil Contamination Assessments from Drilling Fluids and Produced Water Using Combined Field and Laboratory Investigations: A Case Study of Arkansas, USA. International Journal of Environmental Research and Public Health. 2021; 18(5):2421. https://doi.org/10.3390/ijerph18052421
Chicago/Turabian StyleSwigart, Joshua, Joonghyeok Heo, and Duane Wolf. 2021. "Soil Contamination Assessments from Drilling Fluids and Produced Water Using Combined Field and Laboratory Investigations: A Case Study of Arkansas, USA" International Journal of Environmental Research and Public Health 18, no. 5: 2421. https://doi.org/10.3390/ijerph18052421
APA StyleSwigart, J., Heo, J., & Wolf, D. (2021). Soil Contamination Assessments from Drilling Fluids and Produced Water Using Combined Field and Laboratory Investigations: A Case Study of Arkansas, USA. International Journal of Environmental Research and Public Health, 18(5), 2421. https://doi.org/10.3390/ijerph18052421