
Health Risk Assessment for Exposure to Nitrate in Drinking Water in Central Java, Indonesia

 , , ,
, , ,
Abstract

1. Introduction
2. Methods
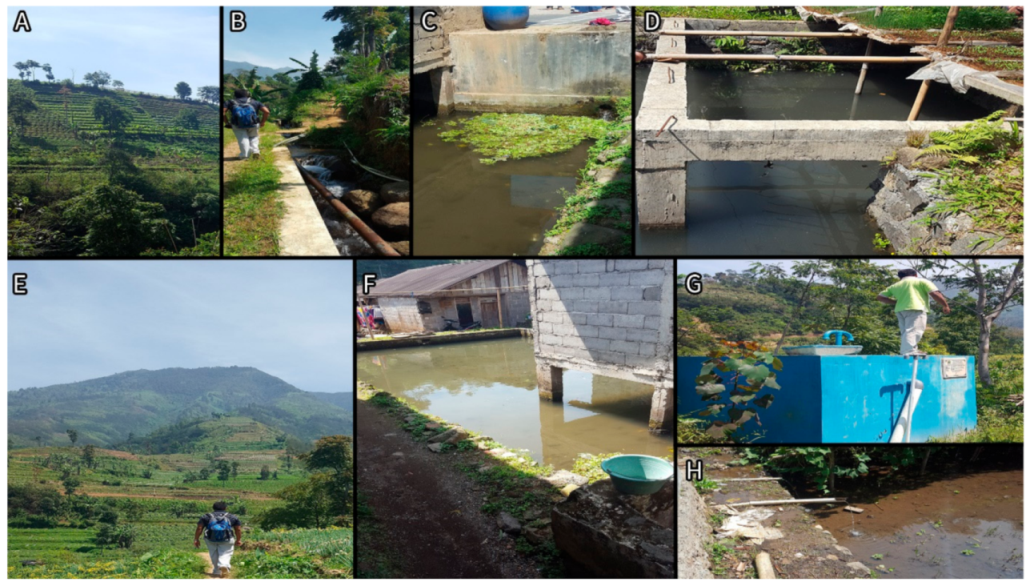
2.1. Study Area
2.2. Sampling Procedure
2.3. Quality Control
2.4. Statistical Analysis
2.5. Ethics
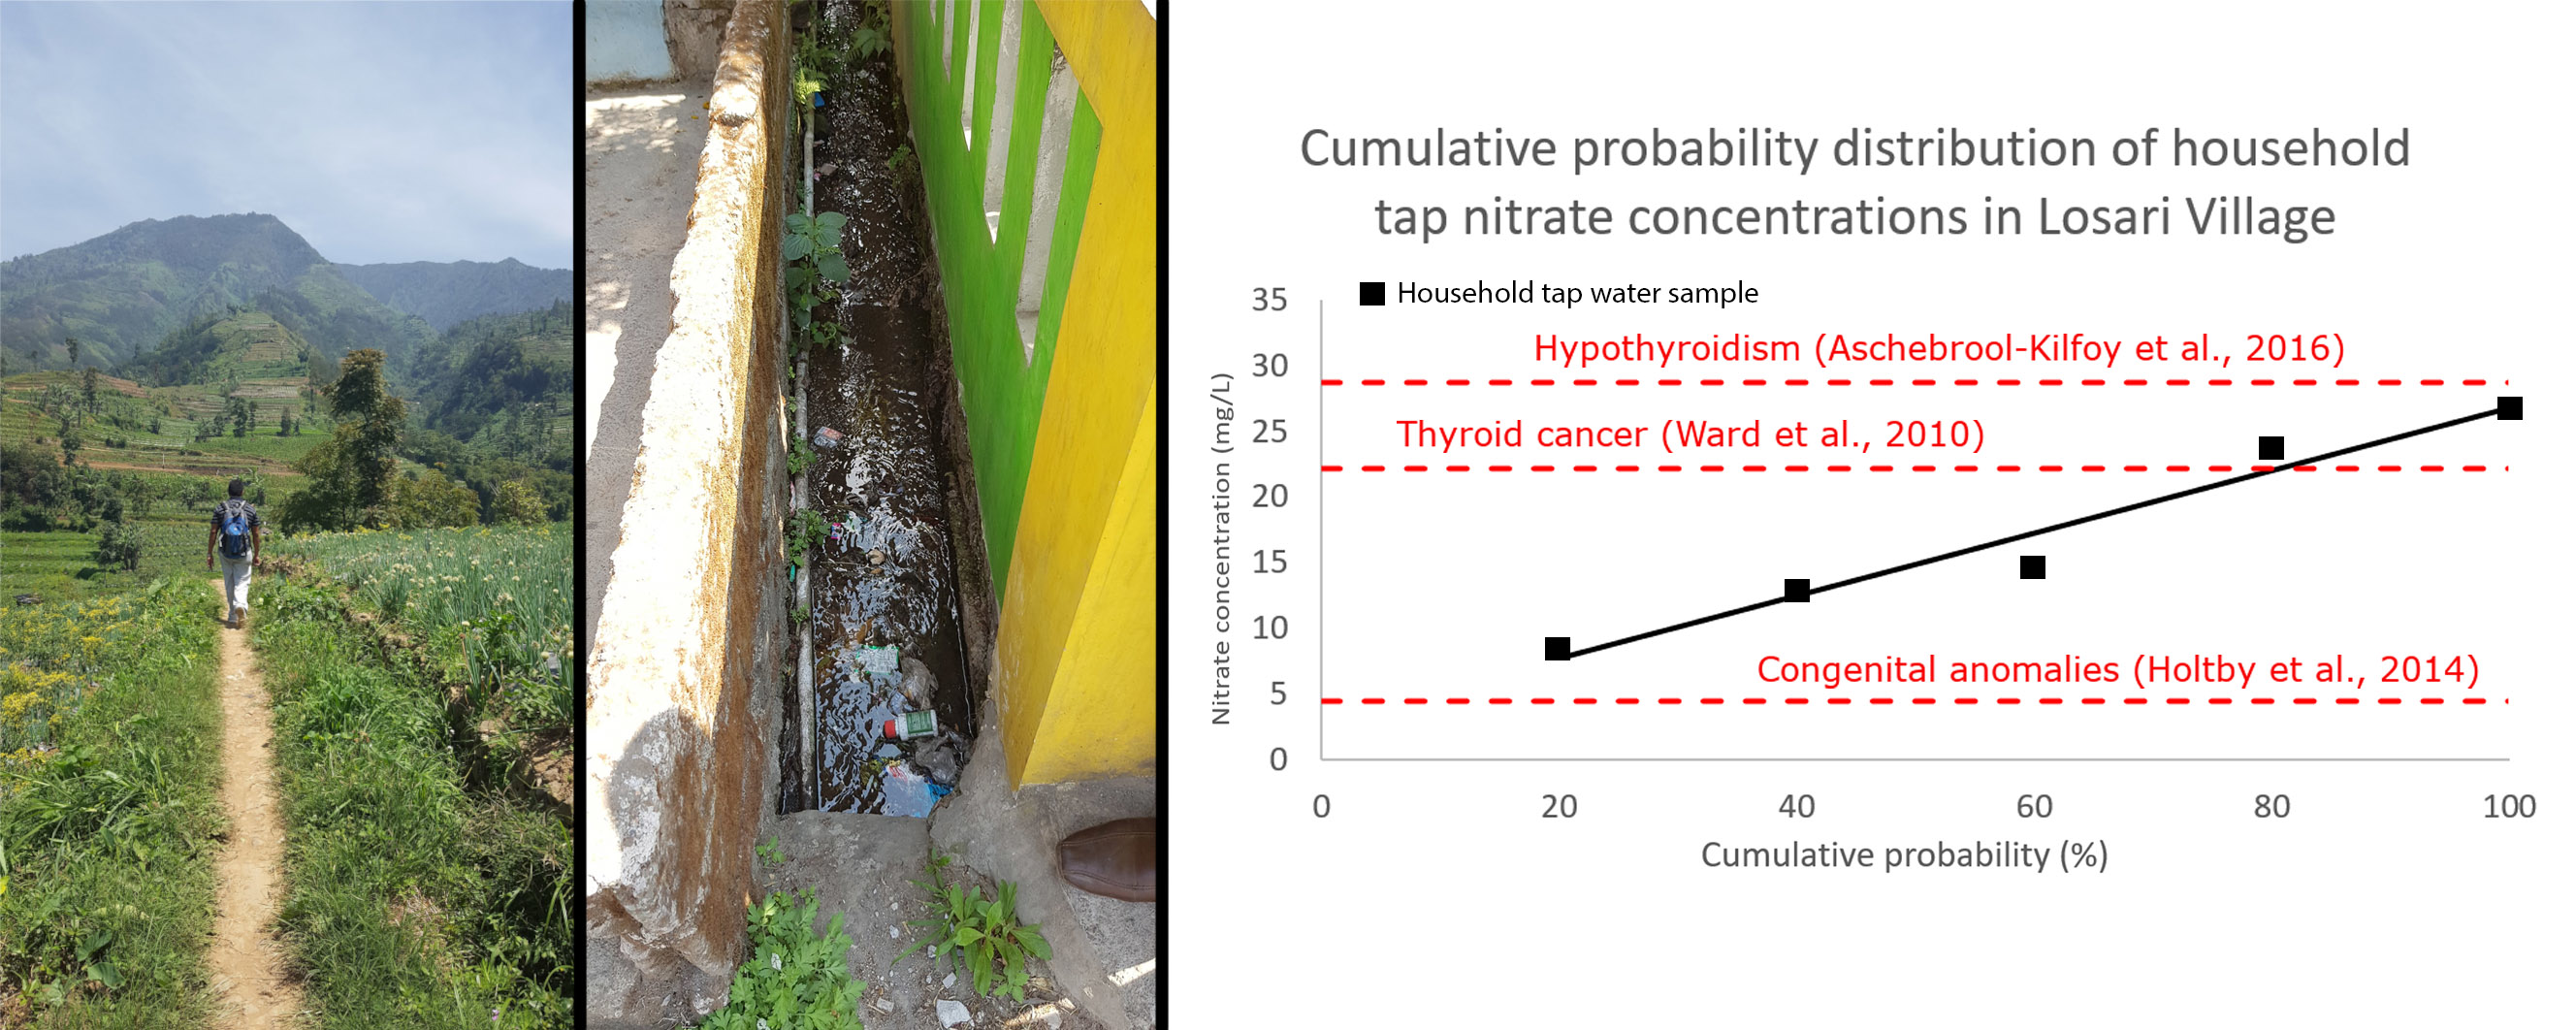
3. Results
4. Discussion
5. Conclusions
Supplementary Materials
Author Contributions
Funding
Institutional Review Board Statement
Informed Consent Statement
Data Availability Statement
Acknowledgments
Conflicts of Interest
References
- Ward, M.H.; Jones, R.R.; Brender, J.D.; de Kok, T.B.; Weyer, P.J.; Nolan, B.T.; Villanueva, C.M.; van Breda, S.G. Drinking Water Nitrate and Human Health: An Updated Review. Int. J. Environ. Res. Public Health 2018, 15, 1557. [Google Scholar] [CrossRef] [PubMed]
- Mirvish, S.S. Role of N-nitroso compounds (NOC) and N-nitrosation in etiology of gastric, esophageal, nasopharyngeal and bladder cancer and contribution to cancer of known exposures to NOC. Cancer Lett. 1995, 93, 17–48. [Google Scholar] [CrossRef]
- Espejo-Herrera, N.; Gracia-Lavedan, E.; Boldo, E.; Aragones, N.; Perez-Gomez, B.; Pollan, M.; Molina, A.J.; Fernández, T.; Martín, V.; La Vecchia, C.; et al. Colorectal cancer risk and nitrate exposure through drinking water and diet. Int. J. Cancer 2016, 139, 334–346. [Google Scholar] [CrossRef] [PubMed]
- Brender, J.D.; Weyer, P.J.; Romitti, P.A.; Mohanty, B.P.; Shinde, M.U.; Vuong, A.M.; Sharkey, J.R.; Dwivedi, D.; Horel, S.A.; Kantamneni, J.; et al. Prenatal Nitrate Intake from Drinking Water and Selected Birth Defects in Offspring of Participants in the National Birth Defects Prevention Study. Environ. Health Perspect. 2013, 121, 1083–1089. [Google Scholar] [CrossRef] [PubMed]
- Holtby, C.E.; Guernsey, J.R.; Allen, A.C.; VanLeeuwen, J.A.; Allen, V.M.; Gordon, R.J. A Population-Based Case-Control Study of Drinking-Water Nitrate and Congenital Anomalies Using Geographic Information Systems (GIS) to Develop Individual-Level Exposure Estimates. Int. J. Environ. Res. Public Health 2014, 11, 1803–1823. [Google Scholar] [CrossRef] [PubMed]
- Ward, M.H.; Kilfoy, B.A.; Weyer, P.J.; Anderson, K.E.; Folsom, A.R.; Cerhan, J.R. Nitrate Intake and the Risk of Thyroid Cancer and Thyroid Disease. Epidemiology 2010, 21, 389–395. [Google Scholar] [CrossRef] [PubMed]
- Aschebrook-Kilfoy, B.; Heltshe, S.L.; Nuckols, J.R.; Sabra, M.M.; Shuldiner, A.R.; Mitchell, B.D.; Airola, M.; Holford, T.R.; Zhang, Y.; Ward, M.H. Modeled nitrate levels in well water supplies and prevalence of abnormal thyroid conditions among the Old Order Amish in Pennsylvania. Environ. Health 2012, 11, 6. [Google Scholar] [CrossRef] [PubMed]
- Komarulzaman, A.; Smits, J.; de Jong, E. Clean water, sanitation and diarrhoea in Indonesia: Effects of household and community factors. Glob. Public Health 2016, 12, 1141–1155. [Google Scholar] [CrossRef] [PubMed]
- World Bank, World Development Indicators. People Practicing Open Defecation (% of Population) [open defecation percent of population.xls]. 2019. Available online: https://data.worldbank.org/indicator/SH.STA.ODFC.ZS (accessed on 14 February 2021).
- Gray, D.J.; Kurscheid, J.M.; Park, M.J.; Laksono, B.; Wang, D.; Clements, A.C.; Hadisaputro, S.; Sadler, R.; Stewart, D.E. Impact of the “BALatrine” Intervention on Soil-Transmitted Helminth Infections in Central Java, Indonesia: A Pilot Study. Trop. Med. Infect. Dis. 2019, 4, 141. [Google Scholar] [CrossRef] [PubMed]
- Templeton, M.R.; Hammoud, A.S.; Butler, A.P.; Braun, L.; Foucher, J.A.; Grossmann, J.; Boukari, M.; Serigne Faye, S.; Jourda, J.P. Nitrate Pollution of Groundwater by Pit Latrines in Developing Countries. AIMS Environ. Sci. 2015, 2, 302–313. [Google Scholar] [CrossRef]
- Fathmawati, F.; Fachiroh, J.; Sutomo, A.H.; Putra, D.P.E. Origin and distribution of nitrate in water well of settlement areas in Yogyakarta, Indonesia. Environ. Monit. Assess. 2018, 190, 628. [Google Scholar] [CrossRef] [PubMed]
- Taufiq, A.; Effendi, A.J.; Iskandar, I.; Hosono, T.; Hutasoit, L.M. Controlling factors and driving mechanisms of nitrate contamination in groundwater system of Bandung Basin, Indonesia, deducted by combined use of stable isotope ratios, CFC age dating, and socioeconomic parameters. Water Res. 2018, 148, 292–305. [Google Scholar] [CrossRef] [PubMed]
- Sadler, R.; Maetam, B.; Edokpolo, B.; Connell, D.; Yu, J.; Stewart, D.; Park, M.J.; Gray, D.; Laksono, B. Health risk assessment for exposure to nitrate in drinking water from village wells in Semarang, Indonesia. Environ. Pollut. 2016, 216, 738–745. [Google Scholar] [CrossRef] [PubMed]
- Fathmawati Fachiroh, J.; Gravitiani, E.; Husodo, S.; Husodo, A. Nitrate in drinking water and risk of colorectal cancer in Yogyakarta, Indonesia. J. Toxicol. Environ. Health Part A 2017, 80, 120–128. [Google Scholar] [CrossRef] [PubMed]
- CLIMATE-DATA.ORG. 2019. Available online: https://en.climate-data.org/asia/indonesia/wonosobo/wonosobo-329020/ (accessed on 18 December 2019).
- H4H Hydration Calculator. 2015. Available online: http://h4hinitiative.com/tools/hydration-calculator (accessed on 1 July 2015).
- Wonosobo. Badan Pusat Statistik Kabupaten Wonosobo. Kecamatan Kertek Dalam Angka 2018. Available online: https://wonosobokab.bps.go.id/publication/2018/09/26/98bf3c87e8b10f2c6b391fbe/kecamatan-kertek-dalam-angka-2018.html (accessed on 14 February 2021).
- Wonosobo. Badan Pusat Statistik Kabupaten Wonosobo. Kecamatan Garung Dalam Angka 2018. Available online: https://wonosobokab.bps.go.id/publication/2018/09/26/49fad166578c8f1e714439a7/kecamatan-garung-dalam-angka-2018.html (accessed on 14 February 2021).
- Word Health Organization. Regional Office for South-East Asia. Birth Defects in South-East Asia: A Public Health Challenge: Situation Analysis. 2013. Available online: https://apps.who.int/iris/handle/10665/204821 (accessed on 30 December 2020).
- Khairina, D.; Suzanna, E.; Triana, D.; Kadir, A.; Widyastuti, T.H.; Sulistyowati, L.S.; Rosalina, I.; Palupi, N.; Lubis, E.M.; Hamzah, A.; et al. Profile of Colorectal Cancer in 14 Provinces in Indonesia. J. Glob. Oncol. 2018, 4. [Google Scholar] [CrossRef]
- Smith, G.D.; Wetselaar, R.; Fox, J.J.; Hidayati, D.; Yogaswara, H. Ingestion of Nitrate from Well Water by Village People in Indonesia. A J. Hum. Environ. 2000, 29, 525–527. [Google Scholar] [CrossRef]
- Hadipuro, W. Indonesia’s Water Supply Regulatory Framework: Between Commercialisation and Public Service? Water Altern. 2016, 3, 475–491. [Google Scholar]
- Asian Development Bank. Indonesia: Country Water Assessment; Asian Development Bank: Mandaluyong City, Philippines, 2016. [Google Scholar]


| Characteristic | Village | |
| Losari | Topengan | |
| Number of households | 270 | 193 |
| Number of households with improved latrine installed | 7 | 1 |
| Distance to district centre | 14.6 km | 9 km |
| Distance between villages | 23.4 km | |
| Proportion of adults that are farmers | 63.0% | 43.3% |
| Territory/Region containing village *,† | ||
| Desa Candimulyo | Desa Sitiharjo | |
| Total area (hectares) | 413 ha | 351 ha |
| Area of land used for farming | n/a | 329 ha |
| Total population | 5779 | 3730 |
| Infant males (0–4 years) | 270 | 157 |
| Infant females (0–4 years) | 285 | 164 |
| Adult males (20+ years old) | 1809 | 1204 |
| Adult females (20+ years old) | 1904 | 1016 |
| Sub-Population | Recommended Water Intake (L) * | Estimated Weight † | Nitrate Intake Unit | Nitrate Intake | |||
|---|---|---|---|---|---|---|---|
| Losari | Topengan | ||||||
| CPEXP50 | CPEXP95 | CPEXP50 | CPEXP95 | ||||
| Infants (birth) | 0.78 | 3.36 | mg/day | 11.47 | 20.27 | 5.07 | 7.89 |
| mg/kg. body weight/day | 3.41 | 6.03 | 1.51 | 2.35 | |||
| Infants (3 months) | 1.181 | 5.76 | mg/day | 17.37 | 30.69 | 7.68 | 11.94 |
| mg/kg. body weight/day | 3.02 | 5.33 | 1.33 | 2.07 | |||
| Adult males | 3.7 | 59 | mg/day | 54.43 | 96.16 | 24.05 | 37.41 |
| mg/kg. body weight/day | 0.92 | 1.63 | 0.41 | 0.63 | |||
| Adult non-pregnant females | 3.4 | 53 | mg/day | 50.01 | 88.37 | 22.10 | 34.37 |
| mg/kg. body weight/day | 0.94 | 1.67 | 0.42 | 0.65 | |||
| Pregnant females (end of 1st trimester) | 3.7 | 48.5 | mg/day | 54.43 | 96.16 | 24.05 | 37.41 |
| mg/kg. body weight/day | 1.12 | 1.98 | 0.50 | 0.77 | |||
Publisher’s Note: MDPI stays neutral with regard to jurisdictional claims in published maps and institutional affiliations. |
© 2021 by the authors. Licensee MDPI, Basel, Switzerland. This article is an open access article distributed under the terms and conditions of the Creative Commons Attribution (CC BY) license (http://creativecommons.org/licenses/by/4.0/).
Share and Cite
Lowe, C.; Kurscheid, J.; Lal, A.; Sadler, R.; Kelly, M.; Stewart, D.; Laksono, B.; Amaral, S.; Gray, D. Health Risk Assessment for Exposure to Nitrate in Drinking Water in Central Java, Indonesia. Int. J. Environ. Res. Public Health 2021, 18, 2368. https://doi.org/10.3390/ijerph18052368
Lowe C, Kurscheid J, Lal A, Sadler R, Kelly M, Stewart D, Laksono B, Amaral S, Gray D. Health Risk Assessment for Exposure to Nitrate in Drinking Water in Central Java, Indonesia. International Journal of Environmental Research and Public Health. 2021; 18(5):2368. https://doi.org/10.3390/ijerph18052368
Chicago/Turabian StyleLowe, Callum, Johanna Kurscheid, Aparna Lal, Ross Sadler, Matthew Kelly, Donald Stewart, Budi Laksono, Salvador Amaral, and Darren Gray. 2021. "Health Risk Assessment for Exposure to Nitrate in Drinking Water in Central Java, Indonesia" International Journal of Environmental Research and Public Health 18, no. 5: 2368. https://doi.org/10.3390/ijerph18052368
APA StyleLowe, C., Kurscheid, J., Lal, A., Sadler, R., Kelly, M., Stewart, D., Laksono, B., Amaral, S., & Gray, D. (2021). Health Risk Assessment for Exposure to Nitrate in Drinking Water in Central Java, Indonesia. International Journal of Environmental Research and Public Health, 18(5), 2368. https://doi.org/10.3390/ijerph18052368