Abstract
Objective To assess the incidence and risk factors of hyperuricemia among Chinese adults in 2017–2018. Methods: A total of 2,015,847 adults (mean age 41.2 ± 12.7, 53.1% men) with serum uric acid concentrations assayed on at least two separate days in routine health examinations during 2017–2018 were analyzed. Hyperuricemia was defined as fasting serum urate concentration >420 μmol/L in men and >360 μmol/L in women. The overall and sex-specific incidence rate were stratified according to age, urban population size, geographical region, annual average temperature and certain diseases. Logistic regression analyses were performed to explore risk factors associated with hyperuricemia. Results: 225,240 adults were newly diagnosed with hyperuricemia. The age- and sex-standardized incidence rate per 100 person-years was 11.1 (95%CI: 11.0–11.1) (15.2 for men and 6.80 for women). The risk of hyperuricemia was positively associated with younger age, being male, larger urban population size, higher annual temperature, higher body mass index, lower estimate glomerular filtration rate, hypertension, dyslipidemia and fat liver. Conclusions: The incidence of hyperuricemia was substantial and exhibited a rising trend among younger adults, especially among men. Socioeconomic and geographic variation in incidence were observed. The risk of hyperuricemia was associated with estimate glomerular filtration rate, fat liver and metabolic factors.
1. Introduction
The prevalence of hyperuricemia has been increasing worldwide, including China [,,]. In the United States, it increased from 18.2% in 1988–1994 [] to 21.4% in 2007–2008 []. It is noteworthy that, in China, it increased from 1.4% to 9.9% for men and 1.3% to 7.0% for women from the 1980s [] to 2009–2010 []. Furthermore, hyperuricemia has already become one of the most common metabolic diseases in China []. Accumulating evidence suggests that people with hyperuricemia may have a higher future risk of gout [], chronic kidney disease [], hypertension [], cardiovascular disease [,], and mortality [], via mechanisms such as monosodium urate crystal deposition [,], endothelial dysfunction [,], intracellular and mitochondrial oxidative stress [] and stimulation of the intracellular renin angiotensin system, etc. [], which could pose a serious problem for public health.
However, given the rapidly increasing prevalence and accompanied serious health threats, the epidemiology of hyperuricemia has not been given special attention it deserves []. Nationwide Chinese data on the epidemiological of hyperuricemia is still limited, especially about the incidence.
Recently, an increasing number of the Chinese population have visited health examination centers, which provides an unique opportunity to understand the status of hyperuricemia in China. We thus estimated the incidence of hyperuricemia based on the health examination data of 2,015,847 Chinese adults from 30 provinces, who attended health examinations during 2017–2018.
2. Methods
2.1. Study Design and Study Population
This study was conducted using data from adults who participated in the routine health examination in Meinian health-screening centers which cover almost all provinces in mainland China (except Tibet). Those health screening centers equipped with professional and experienced medical teams provided comprehensive health examinations to participants. Moreover, unified standard examination protocol was established in each health examination center to ensure the stability of results.
From 1 January 2017 to 31 December 2018, 2,538,685 adults aged ≥ 18 years with at least two times serum uric acid examinations were included. Participants with missing value or outliers in age, sex and serum uric acid concentrations were excluded. Participants with hyperuricemia at first examination were excluded, leaving a total of 2,015,847 participants for the analysis.
This study has been approved by the Institutional Review Board of Peking University Health Science Center (ID of the approval: IRB00001052-19077). Individual informed consent was waived, as only anonymized data were used in this study.
2.2. Assessment of Uric Acid and Hyperuricemia
The procedures of health examination with authority-approved methods and instruments were used in all centers. All laboratories meet the standards of requirements of external quality assessment for clinical laboratories []. Blood samples were drawn by venipuncture after 8–12 h of overnight fasting to measure serum uric acid. Serum uric acid was measured using automatic biochemical analyzer using uric acid commercial kit according to the manufacturer’s instruction. Hyperuricemia has been defined as a fasting serum urate concentration >420 μmol/L in men and >360 μmol/L in women.
2.3. Assessment of Other Factors
Demographic data and clinical histories were obtained by trained health professionals through face to face interviews. Participants were categorized into six geographic regions: Northern, Eastern, South-Central, Northeast, Northwest, Southwest []. Urban population size were categorized into: more than five million, one to five million, less than one million []. The annual average temperature for each province was obtained from the National Meteorological Information Center and was categorized into tertile (tertile1: 3–13 °C; tertile 2: 14–16 °C; tertile 3: 17–25 °C) (http://data.cma.cn, accessed on 28 February 2021).
Anthropometric data such as height, weight, and blood pressure were measured according to standard methods. Hypertension was defined as systolic blood pressure ≥140 mmHg and/or diastolic blood pressure ≥90 mmHg and/or self-reported history of hypertension and/or use of antihypertensive treatment []. Body mass index (BMI) was calculated as weight (kg)/height (m)2. BMI were categorized into <18.5 kg/m2, 18.5 kg/m2 ≤ BMI < 24 kg/m2, 24 kg/m2 ≤ BMI < 28 kg/m2, and ≥28 kg/m2 respectively [].
Blood biochemical indexes such as triglycerides (TG), total cholesterol (TC), high-density lipoprotein cholesterol (HDL-C), low-density lipoprotein cholesterol (LDL-C) and serum creatinine were measured using automatic biochemistry analyzer in each center. Dyslipidemia was defined as serum TC concentration of ≥6.2 mmol/L and/or TG ≥ 2.3 mmol/L and/or LDL-C ≥ 4.1 mmol/L and/or HDL-C < 1.0 mmol/L and/or self-reported dyslipidemia []. Estimate glomerular filtration rate (eGFR) was predicted by the Chronic Kidney Disease Epidemiology Collaboration equation and were categorized into <60, 60–89, ≥90 mL/min per 1.73 m2 []. Fat liver disease was detected by ultrasonography performed by experienced technicians. All laboratories meet the standards of requirements of external quality assessment for clinical laboratories [].
2.4. Data Analysis
Incidence of hyperuricemia per 100 person-years was using the number of participants newly diagnosed with hyperuricemia as the numerator and accumulated person-years of total population as the denominator.
Characteristics of the participants are presented as n (%) for categorical variables. Age- and sex- standardized incidence rates with 95% CI weighted by the standard population of 2010 China Population Sampling Census were calculated. The overall and sex-specific incidence rate were stratified according to age, urban population size, geographical region, annual average temperature, BMI, eGFR, hypertension, dyslipidemia and fat liver. Pearson’s χ2 analysis was applied to the comparison of rates. Unadjusted and multivariable logistic regression analyses (adjusting for age, sex, urban population size, geographical region, annual average temperature, BMI, eGFR, hypertension, dyslipidemia and fat liver) were conducted to investigate risk factors for hyperuricemia. Analyses were conducted using SAS, version 9.3 (SAS Institute, Inc., Cary, NC, USA). Figure was drawn using R version 4.0 (http://www.r-project.org/, accessed on 28 February 2021). p < 0.05 was considered statistically significant.
3. Results
Characteristics of the participants were presented in Table 1. The average age was 41.9 ± 13.0 years for men and was 40.4 ± 12.2 years for women. The proportion of men was 53.1%.

Table 1.
Baseline characteristics of participants.
Age- and sex-standardized incidence of hyperuricemia per 100 person-years was 11.1 (95%CI: 11.0–11.1) for total population. Age-standardized incidence rates per 100 person-years were 15.2 (15.2–15.3) for men, 6.80 (6.74–6.87) for women. The prevalence was higher in cities with larger urban population size (more than five million: 11.5 vs. less than one million: 10.7), and cities with higher annual average temperature (17–25 °C: 11.9 vs. 3–13℃: 10.6). In addition, it was higher in Southwest (14.2) and lower in Northwest (8.64). Besides, it was higher among participants with BMI ≥ 28.0 kg/m2 (18.6), eGFR < 60 mL/min per 1.73 m2 (17.9), hypertension (13.7), dyslipidemia (12.3) and fat liver disease (16.6) relative to their counterparts. Similar trends were applicable to both men and women (Table 2).
Table 2.
Incidence of hyperuricemia among Chinese health examination adults during 2017–2018.
When it comes to provinces, hyperuricemia was highest in Qinghai among men (25.7) and was highest in Yunnan among women (11.9) (Table S2).
In multivariable-adjusted models, younger age (≥60 vs. 18–39 years: OR 0.63,95% CI 0.61–0.64), being male (OR 2.20, 95% CI 2.18–2.23), larger urban population size (more than five vs less than one million: OR 1.11, 95% CI 1.09–1.12), higher annual temperature (17–25℃ vs 3–13℃: OR 1.17, 95% CI 1.14–1.20), higher body mass index (≥28 vs. <18.5 kg/m2: OR 2.95, 95% CI 2.85–3.06), lower estimate glomerular filtration rate (≥90 vs. <60 mL/min per 1.73 m2: OR 0.45, 95% CI 0.43–0.48), hypertension (OR 1.15,95% CI 1.13–1.16), dyslipidemia (OR 1.19, 95% CI 1.17–1.20) and fat liver (OR 1.55, 95% CI 1.53–1.57) were associated with higher risk of hyperuricemia. Similar associations were found both among men and women. (Table 3)
Table 3.
Odds ratios (95%CIs) for associations between risk factors and hyperuricemia.
Incidence rates per 100 person-years for men were highest in age 18–22 years (20.8) then gradually decreased and reached the bottom in age 63–67 years (10.7) then gradually increased. Incidence rates per 100 person-years for women were 8.92 in age 18–22 years then gradually decreased and reached the bottom in age 38–42 years (4.34) then gradually increased and reached the peak in age ≥78 years (14.1) (Figure 1, Table S1).
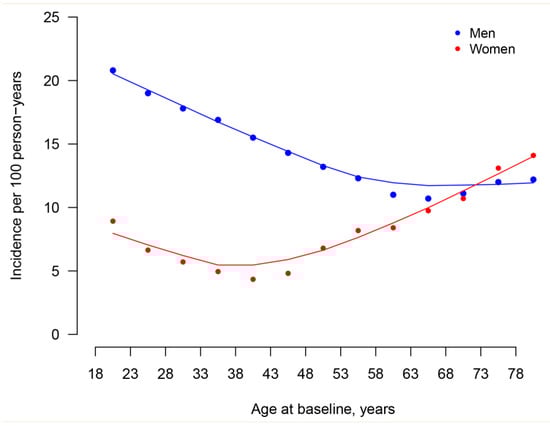
Figure 1.
Sex-Specific incidence of hyperuricemia by different age during 2017–2018. Y-axis indicates incidence per 100 person-years.
4. Discussion
In our study, the incidence rates per 100 person-years of hyperuricemia was 15.2 among men and 6.80 among women. Higher incidence was observed among younger adult, men and in regions with larger urban population size or higher annual average temperature. Higher BMI, lower eGFR, hypertension, dyslipidemia and fat liver were associated with the risk of hyperuricemia.
Plenty of previous studies have focused on the prevalence of hyperuricemia [,,,,,]. The prevalence was reported to be 21.4% in United States during 2007–2008 [] and 11.9% in Italy during 2009 []. In China, the prevalence of hyperuricemia was reported to be 19.4% for men and 7.9% for women during 2000–2014 [] and 21.6% for men and 8.6% for women during 1995–2009 [] in two meta-analysis studies. Additionally, Song et al. reported the prevalence was 6.4% in 2010 in a nationally representative sample of Chinese middle-aged and older adults []. Besides, Liu et al. reported the prevalence was 8.4% in 2009–2010 in a nationally representative sample of Chinese adult ≥ 18 years old []. However, previous researches on the incidence of hyperuricemia remains sparse. The incidence rate was reported to be 4.9 per 100 person-years among South Korean men during 2002–2009 [] and 3.6–4.9% in Fukushima Prefecture during 2008–2012 []. To the best of our knowledge, there are no studies reporting on the nationwide incidence rate in China and it was reported to be 11.1 per 100 person-years in our study. Data from previous studies was scattered across different provinces of China. It was reported that the incidence rate was 4.96 per 100 person-years during 2007–2015 in Shandong [] and it was 6.9 per 100 person-years in Zhejiang during 2011–2016 []. In our study, the incidence rates per 100 person-years were 10.3 in Shandong and 8.5 in Zhejiang, respectively, during 2017–2018, which was higher than previous reports.
In our study, the incidence was higher among men relative to women, which was in line with previous studies [,]. Sex hormones and different lifestyle between men and women may explain the observed sex-difference [,]. Several studies illustrated that the prevalence of hyperuricemia increased with age [,,]. However, an inverse trend was observed among men in Henan Rural Cohort Study [] and a “U” shape was found among men in Korea []. In our study, we found that the incidence of hyperuricemia has a trend toward onset at younger age, especially among men. The incidence was highest in youngest age group (age 18–22 years) among men. That is probably due to changing lifestyles accompanied by social economic development such as dining out frequently, adopting unhealthy diets, and increasing social activities involving heavy consumption of alcohol. The incidence also exhibited a trend towards onset at younger age among women, while not as distinctly as for men, and rose greatly after menopause, which may be interpreted as a protective effect of estrogen []. A similar trend was found in the study by Cao et al. [].
Further, consistent with previous studies, lower eGFR, obesity, hypertension, dyslipidemia, and fatty liver disease were associated with the risk of hyperuricemia in present study [,,,,,]. As serum uric acid is predominantly cleared by the kidneys, decreased eGFR may be associated with increased serum uric acid levels []. Additionally, hyperuricemia is related with endothelial dysfunction [,], intracellular and mitochondrial oxidative stress [], vascular smooth muscle cell proliferation [], hepatocyte lipid accumulation [], and stimulation of the intracellular renin angiotensin system, etc. [], thus hyperuricemia may closely associated with diseases such as obesity, hypertension, dyslipidemia and fatty liver disease which share many similar pathogenic mechanisms [,,,,,,].
The prevalence of hyperuricemia was higher in cities with larger urban populations. As suggested in previous studies, rapid economic development may be associated with unhealthy lifestyles in developing countries []. In addition, the prevalence was higher among provinces with higher annual average temperatures. This is probably a result of accelerated metabolism under higher temperatures [].
The provinces with the highest hyperuricemia incidence were Qinghai for men and Yunnan for women. Qinghai and Yunnan are both located on a plateau, and residents at high altitude under hypoxic conditions are known to develop adaptive polycythemia []. Besides, lactate generated with hypoxia will compete with the excretion of urate in the proximal tubules. In addition, the hypoxia-related increase in hematocrit leads to a decrease in renal plasma flow [] eventually lead to increasing in uric acid concentration.
Several limitations of this study need to be addressed. First, this was a study based on a health examination population, which may not be generalizable to all Chinese, although the prevalence rates were weighted by the standard population of China to improve the representativeness. Second, information on medical history of hyperuricemia and lifestyle were not available in this study. Nevertheless, the strengths of this study are also worthy of mention. To the best of our knowledge, this is first study to investigate the nationwide incidence rate of hyperuricemia in China. Furthermore, this investigation was based on 2,015,847 Chinese adults covering almost all geographic areas in China, which differ in socioeconomic and geographic features, providing sufficient power to examine the incidence of hyperuricemia at multiple levels.
In conclusion, the incidence of hyperuricemia remains substantial and exhibited a rising trend among younger age groups, especially among men. The incidence was higher in cities with larger urban population size or higher annual average temperature. Besides, higher BMI, lower eGFR, hypertension, dyslipidemia and fat liver disease were all associated with the risk of hyperuricemia. Despite the limitations mentioned before, this study provides valuable information for the prevention of hyperuricemia and on hyperuricemia’s epidemiology and etiology.
Supplementary Materials
The following are available online at https://www.mdpi.com/1660-4601/18/5/2360/s1, Table S1: Incidence of hyperuricemia by age groups; Table S2: Incidence of hyperuricemia by province.
Author Contributions
Y.N., L.L. and R.S. contributed to the study design. R.S. drafted the manuscript. Y.M., Z.Z. and R.S. analyzed the data. C.J. provided statistical guidance and support. X.G., J.W., and J.L. reviewed and revised the manuscript. L.L. and Y.N. are the guarantors. All authors approved the final manuscript. All authors agree to be accountable for all aspects of the work in ensuring that questions related to the accuracy or integrity of any part of the work are appropriately investigated and resolved. The corresponding author attests that all listed authors meet authorship criteria and that no others meeting the criteria have been omitted. All authors have read and agreed to the published version of the manuscript.
Funding
This work was supported by grants from the National Key R&D Program of China (2020YFC2003400), and the National Natural Science Foundation of China (91846303). The funders had no role in the study design, data collection, data analysis and interpretation, writing of the report, or the decision to submit the article for publication.
Institutional Review Board Statement
This study has been approved by the Institutional Review Board of Peking University Health Science Center (ID of the approval: IRB00001052-19077).
Informed Consent Statement
Individual informed consent was waived, as only anonymized data were used in this study.
Data Availability Statement
All data used to support the findings of this study may be released upon application to the Meinian Institute of Health (Beijing, China), which can be contacted through Prof. Yi Ning (email: Yi.Ning@MeinianResearch.com).
Conflicts of Interest
The authors declare no conflict of interest.
References
- Burt, V.L.; Harris, T. The third National Health and Nutrition Examination Survey: Contributing data on aging and health. Gerontologist 1994, 34, 486–490. [Google Scholar] [CrossRef]
- Zhu, Y.; Pandya, B.J.; Choi, H.K. Prevalence of gout and hyperuricemia in the US general population: The National Health and Nutrition Examination Survey 2007-2008. Arthritis Rheum. 2011, 63, 3136–3141. [Google Scholar] [CrossRef]
- Trifirò, G.; Morabito, P.; Cavagna, L.; Ferrajolo, C.; Pecchioli, S.; Simonetti, M.; Bianchini, E.; Medea, G.; Cricelli, C.; Caputi, A.P.; et al. Epidemiology of gout and hyperuricaemia in Italy during the years 2005–2009: A nationwide population-based study. Ann. Rheum. Dis. 2012, 72, 694–700. [Google Scholar] [CrossRef]
- Fang, Q.; You, K.; Lin, Q.S.; Wen, Q.C.; Chen, H.Z.; Zhuang, H.Z.; Han, Q.Q.; Yu, Z.F.; Tong, Z.H.; Zhong, G.S.; et al. The investigation of Chinese people’s blood uric acid and its relationship with hyperlipidemia. Chin. J. Intern. Med. 1983, 22, 434–438. [Google Scholar]
- Liu, H.; Zhang, X.-M.; Wang, Y.-L.; Liu, B.-C. Prevalence of hyperuricemia among Chinese adults: A national cross-sectional survey using multistage, stratified sampling. J. Nephrol. 2014, 27, 653–658. [Google Scholar] [CrossRef] [PubMed]
- Multidisciplinary Expert Task Force on Hyperuricemia Related Diseases. Chinese Multidisciplinary Expert Consensus on the Diagnosis and Treatment of Hyperuricemia and Related Diseases. Chin. Med. J. 2017, 130, 2473–2488.
- Duskin-Bitan, H.; Cohen, E.; Goldberg, E.; Shochat, T.; Levi, A.; Garty, M.; Krause, I. The degree of asymptomatic hyperuricemia and the risk of gout. A retrospective analysis of a large cohort. Clin. Rheumatol. 2014, 33, 549–553. [Google Scholar] [CrossRef]
- Chonchol, M.; Shlipak, M.G.; Katz, R.; Sarnak, M.J.; Newman, A.B.; Siscovick, D.S.; Kestenbaum, B.; Carney, J.K.; Fried, L.F. Relationship of Uric Acid with Progression of Kidney Disease. Am. J. Kidney Dis. 2007, 50, 239–247. [Google Scholar] [CrossRef] [PubMed]
- Sundstrom, J.; Sullivan, L.; D’Agostino, R.B.; Levy, D.; Kannel, W.B.; Vasan, R.S. Relations of Serum Uric Acid to Longitudinal Blood Pressure Tracking and Hypertension Incidence. Hypertension 2005, 45, 28–33. [Google Scholar] [CrossRef]
- Bos, M.J.; Koudstaal, P.J.; Hofman, A.; Witteman, J.C.; Breteler, M.M. Uric acid is a risk factor for myocardial infarction and stroke: The Rotterdam study. Stroke 2006, 37, 1503–1507. [Google Scholar] [CrossRef] [PubMed]
- Li, S.; Cheng, J.; Cui, L.; Gurol, M.E.; Bhatt, D.L.; Fonarow, G.C.; Benjamin, E.J.; Xing, A.; Xia, Y.; Wu, S.; et al. Cohort Study of Repeated Measurements of Serum Urate and Risk of Incident Atrial Fibrillation. J. Am. Hear. Assoc. 2019, 8, e012020. [Google Scholar] [CrossRef]
- Li, S.; Cui, L.; Cheng, J.; Shu, R.; Chen, S.; Nguyen, U.-S.; Misra, D.; Wu, S.; Gao, X. Repeated measurements of serum urate and mortality: A prospective cohort study of 152,358 individuals over 8 years of follow-up. Arthritis Res. 2020, 22, 1–10. [Google Scholar] [CrossRef]
- Neogi, T. Clinical practice. Gout. N. Engl. J. Med. 2011, 364, 443–452. [Google Scholar] [CrossRef] [PubMed]
- Perez-Ruiz, F.; Dalbeth, N.; Bardin, T. A Review of Uric Acid, Crystal Deposition Disease, and Gout. Adv. Ther. 2015, 32, 31–41. [Google Scholar] [CrossRef] [PubMed]
- Puddu, P.E.; Puddu, G.M.; Cravero, E.; Vizioli, L.; Muscari, A. The relationships among hyperuricemia, endothelial dysfunction, and cardiovascular diseases: Molecular mechanisms and clinical implications. J. Cardiol. 2012, 59, 235–242. [Google Scholar] [CrossRef]
- Sánchez-Lozada, L.G.; Lanaspa, M.A.; Cristóbal-García, M.; García-Arroyo, F.; Soto, V.; Cruz-Robles, D.; Nakagawa, T.; Yu, M.A.; Kang, D.-H.; Johnson, R.J. Uric Acid-Induced Endothelial Dysfunction Is Associated with Mitochondrial Alterations and Decreased Intracellular ATP Concentrations. Nephron 2013, 121, e71–e78. [Google Scholar] [CrossRef]
- Corry, D.B.; Eslami, P.; Yamamoto, K.; Nyby, M.D.; Makino, H.; Tuck, M.L. Uric acid stimulates vascular smooth muscle cell proliferation and oxidative stress via the vascular renin–angiotensin system. J. Hypertens. 2008, 26, 269–275. [Google Scholar] [CrossRef] [PubMed]
- Mazzali, M.; Hughes, J.; Kim, Y.-G.; Jefferson, J.A.; Kang, D.-H.; Gordon, K.L.; Lan, H.Y.; Kivlighn, S.; Johnson, R.J. Elevated Uric Acid Increases Blood Pressure in the Rat by a Novel Crystal-Independent Mechanism. Hypertens 2001, 38, 1101–1106. [Google Scholar] [CrossRef] [PubMed]
- China National Standardizing Committee. National Standards of the People’s Republic of China. GB/T 20470-2006. Requirements of External Quality Assessment for Clinical Laboratories; China Standard Press: Beijing, China, 2006. [Google Scholar]
- Tabulation on the 2010 Population Census of the People’s Republic of China. In Population Census Office under the State Council; China Statistics Press: Beijing, China, 2012. Available online: http://www.stats.gov.cn/english/statisticaldata/censusdata/rkpc2010/indexch.htm (accessed on 28 February 2021).
- Qi, W.; Liu, S.H.; Jin, H.R. Applicability of the new standard of city-size classification in China. Prog. Geogr. 2016, 35, 47–56. [Google Scholar]
- Joint Committee for Guideline Revision 2018 Chinese Guidelines for Prevention and Treatment of Hypertension-A report of the Revision Committee of Chinese Guidelines for Prevention and Treatment of Hypertension. J. Geriatr. Cardiol. 2019, 16, 182–241.
- Writing Committee of Expert Consensus on Overweight/Obesity Medical Nutrition Therapy in China. Expert consensus on overweight/obesity medical nutrition therapy in China. Chin. J. Diabetes Mellit. 2016, 8, 525–540.
- Joint Committee for Developing. Chinese guidelines on Prevention and Treatment of Dyslipidemia in Adults. Chinese Guidelines for Prevention and Treatment of dyslipidemia in Adults. Chin. Circ. J. 2016, 31, 937–953. [Google Scholar]
- Levey, A.S.; Stevens, L.A.; Schmid, C.H.; Zhang, Y.L.; Castro, A.F., 3rd; Feldman, H.I.; Kusek, J.W.; Eggers, P.; Van Lente, F.; Greene, T.; et al. A new equation to estimate glomerular filtration rate. Ann. Intern. Med. 2009, 150, 604–612. [Google Scholar] [CrossRef]
- Liu, R.; Han, C.; Wu, D.; Xia, X.; Gu, J.; Guan, H.; Shan, Z.; Teng, W. Prevalence of Hyperuricemia and Gout in Mainland China from 2000 to 2014: A Systematic Review and Meta-Analysis. BioMed Res. Int. 2015, 2015, 1–12. [Google Scholar] [CrossRef]
- Liu, B.; Wang, T.; Zhao, H.; Yue, W.; Yu, H.; Liu, C.; Yin, J.; Jia, R.; Nie, H. The prevalence of hyperuricemia in China: A meta-analysis. BMC Public Health 2011, 11, 832–841. [Google Scholar]
- Song, P.; Wang, H.; Xia, W.; Chang, X.; Wang, M.; An, L. Prevalence and correlates of hyperuricemia in the middle-aged and older adults in China. Sci. Rep. 2018, 8, 1–9. [Google Scholar] [CrossRef] [PubMed]
- Ryu, S.; Chang, Y.; Zhang, Y.; Kim, S.-G.; Cho, J.; Son, H.J.; Shin, H.; Guallar, E. A Cohort Study of Hyperuricemia in Middle-aged South Korean Men. Am. J. Epidemiol. 2011, 175, 133–143. [Google Scholar] [CrossRef] [PubMed]
- Hashimoto, S.; The Fukushima Health Management Survey Group; Nagai, M.; Ohira, T.; Fukuma, S.; Hosoya, M.; Yasumura, S.; Satoh, H.; Suzuki, H.; Sakai, A.; et al. Influence of post-disaster evacuation on incidence of hyperuricemia in residents of Fukushima Prefecture: The Fukushima Health Management Survey. Clin. Exp. Nephrol. 2020, 24, 1025–1032. [Google Scholar] [CrossRef]
- Cao, J.; Wang, C.; Zhang, G.; Ji, X.; Liu, Y.; Sun, X.; Yuan, Z.; Jiang, Z.; Xue, F. Incidence and Simple Prediction Model of Hyperuricemia for Urban Han Chinese Adults: A Prospective Cohort Study. Int. J. Environ. Res. Public Health 2017, 14, 67. [Google Scholar] [CrossRef] [PubMed]
- Ni, Q.; Lu, X.; Chen, C.; Du, H.; Zhang, R. Risk factors for the development of hyperuricemia: A STROBE-compliant cross-sectional and longitudinal study. Medicine 2019, 98, e17597. [Google Scholar] [CrossRef] [PubMed]
- Nicholls, A.; Snaith, M.L.; Scott, J.T. Effect of Oestrogen Therapy on Plasma and Urinary Levels of Uric Acid. BMJ 1973, 1, 449–451. [Google Scholar] [CrossRef]
- Choi, H.K.; McCormick, N.; Lu, N.; Rai, S.K.; Yokose, C.; Zhang, Y. Population Impact Attributable to Modifiable Risk Factors for Hyperuricemia. Arthritis Rheumatol. 2020, 72, 157–165. [Google Scholar] [CrossRef]
- Dong, X.; Zhang, H.; Wang, F.; Liu, X.; Yang, K.; Tu, R.; Wei, M.; Wang, L.; Mao, Z.; Zhang, G.; et al. Epidemiology and prevalence of hyperuricemia among men and women in Chinese rural population: The Henan Rural Cohort Study. Mod. Rheumatol. 2020, 30, 910–920. [Google Scholar] [CrossRef]
- Kim, Y.; Kang, J.; Kim, G.-T. Prevalence of hyperuricemia and its associated factors in the general Korean population: An analysis of a population-based nationally representative sample. Clin. Rheumatol. 2018, 37, 2529–2538. [Google Scholar] [CrossRef]
- Zhang, L.; Wang, F.; Wang, L.; Wang, W.; Liu, B.; Liu, J.; Chen, M.; He, Q.; Liao, Y.; Yu, X.; et al. Prevalence of chronic kidney disease in China: A cross-sectional survey. Lancet 2012, 379, 815–822. [Google Scholar] [CrossRef]
- Lin, W.-Y.; Liu, C.-S.; Li, T.-C.; Lin, T.; Chen, W.; Chen, C.-C.; Li, C.-I.; Lin, C.-C. In addition to insulin resistance and obesity, hyperuricemia is strongly associated with metabolic syndrome using different definitions in Chinese populations: A population-based study (Taichung Community Health Study). Ann. Rheum. Dis. 2007, 67, 432–433. [Google Scholar] [CrossRef]
- Zhang, W.; Sun, K.; Yang, Y.; Zhang, H.; Hu, F.B.; Hui, R. Plasma Uric Acid and Hypertension in a Chinese Community: Prospective Study and Metaanalysis. Clin. Chem. 2009, 55, 2026–2034. [Google Scholar] [CrossRef] [PubMed]
- Kuwabara, M.; Niwa, K.; Hisatome, I.; Nakagawa, T.; Roncal-Jimenez, C.A.; Andres-Hernando, A.; Bjornstad, P.; Jensen, T.; Sato, Y.; Milagres, T.; et al. Asymptomatic Hyperuricemia Without Comorbidities Predicts Cardiometabolic Diseases: Five-Year Japanese Cohort Study. Hypertension 2017, 69, 1036–1044. [Google Scholar] [CrossRef] [PubMed]
- Lipkowitz, M.S. Regulation of Uric Acid Excretion by the Kidney. Curr. Rheumatol. Rep. 2012, 14, 179–188. [Google Scholar] [CrossRef] [PubMed]
- Chen, S.; Chen, D.; Yang, H.; Wang, X.; Wang, J.; Xu, C. Uric acid induced hepatocytes lipid accumulation through regulation of miR-149-5p/FGF21 axis. BMC Gastroenterol. 2020, 20. [Google Scholar] [CrossRef] [PubMed]
- McCracken, E.; Monaghan, M.; Sreenivasan, S. Pathophysiology of the metabolic syndrome. Clin. Dermatol. 2018, 36, 14–20. [Google Scholar] [CrossRef] [PubMed]
- Kim, S.; Symons, M.; Popkin, B.M. Contrasting socioeconomic profiles related to healthier lifestyles in China and the United States. Am. J. Epidemiology 2004, 159, 184–191. [Google Scholar] [CrossRef] [PubMed]
- Taylor, N.A. Human Heat Adaptation. Compr. Physiol. 2014, 4, 325–365. [Google Scholar] [CrossRef] [PubMed]
- Denman, A.M.; Szur, L.; Ansell, B.M. Hyperuricaemia in Polycythaemia Vera. Ann. Rheum. Dis. 1966, 25, 340–344. [Google Scholar] [CrossRef] [PubMed]
- Arestegui, A.H.; Fuquay, R.; Sirota, J.; Swenson, E.R.; Schoene, R.B.; Jefferson, J.A.; Chen, W.; Yu, X.-Q.; Kelly, J.P.; Johnson, R.J.; et al. High Altitude Renal Syndrome (HARS). J. Am. Soc. Nephrol. 2011, 22, 1963–1968. [Google Scholar] [CrossRef]
Publisher’s Note: MDPI stays neutral with regard to jurisdictional claims in published maps and institutional affiliations. |
© 2021 by the authors. Licensee MDPI, Basel, Switzerland. This article is an open access article distributed under the terms and conditions of the Creative Commons Attribution (CC BY) license (http://creativecommons.org/licenses/by/4.0/).