
Air Pollution Health Risk Assessment (AP-HRA), Principles and Applications


Abstract
1. Introduction
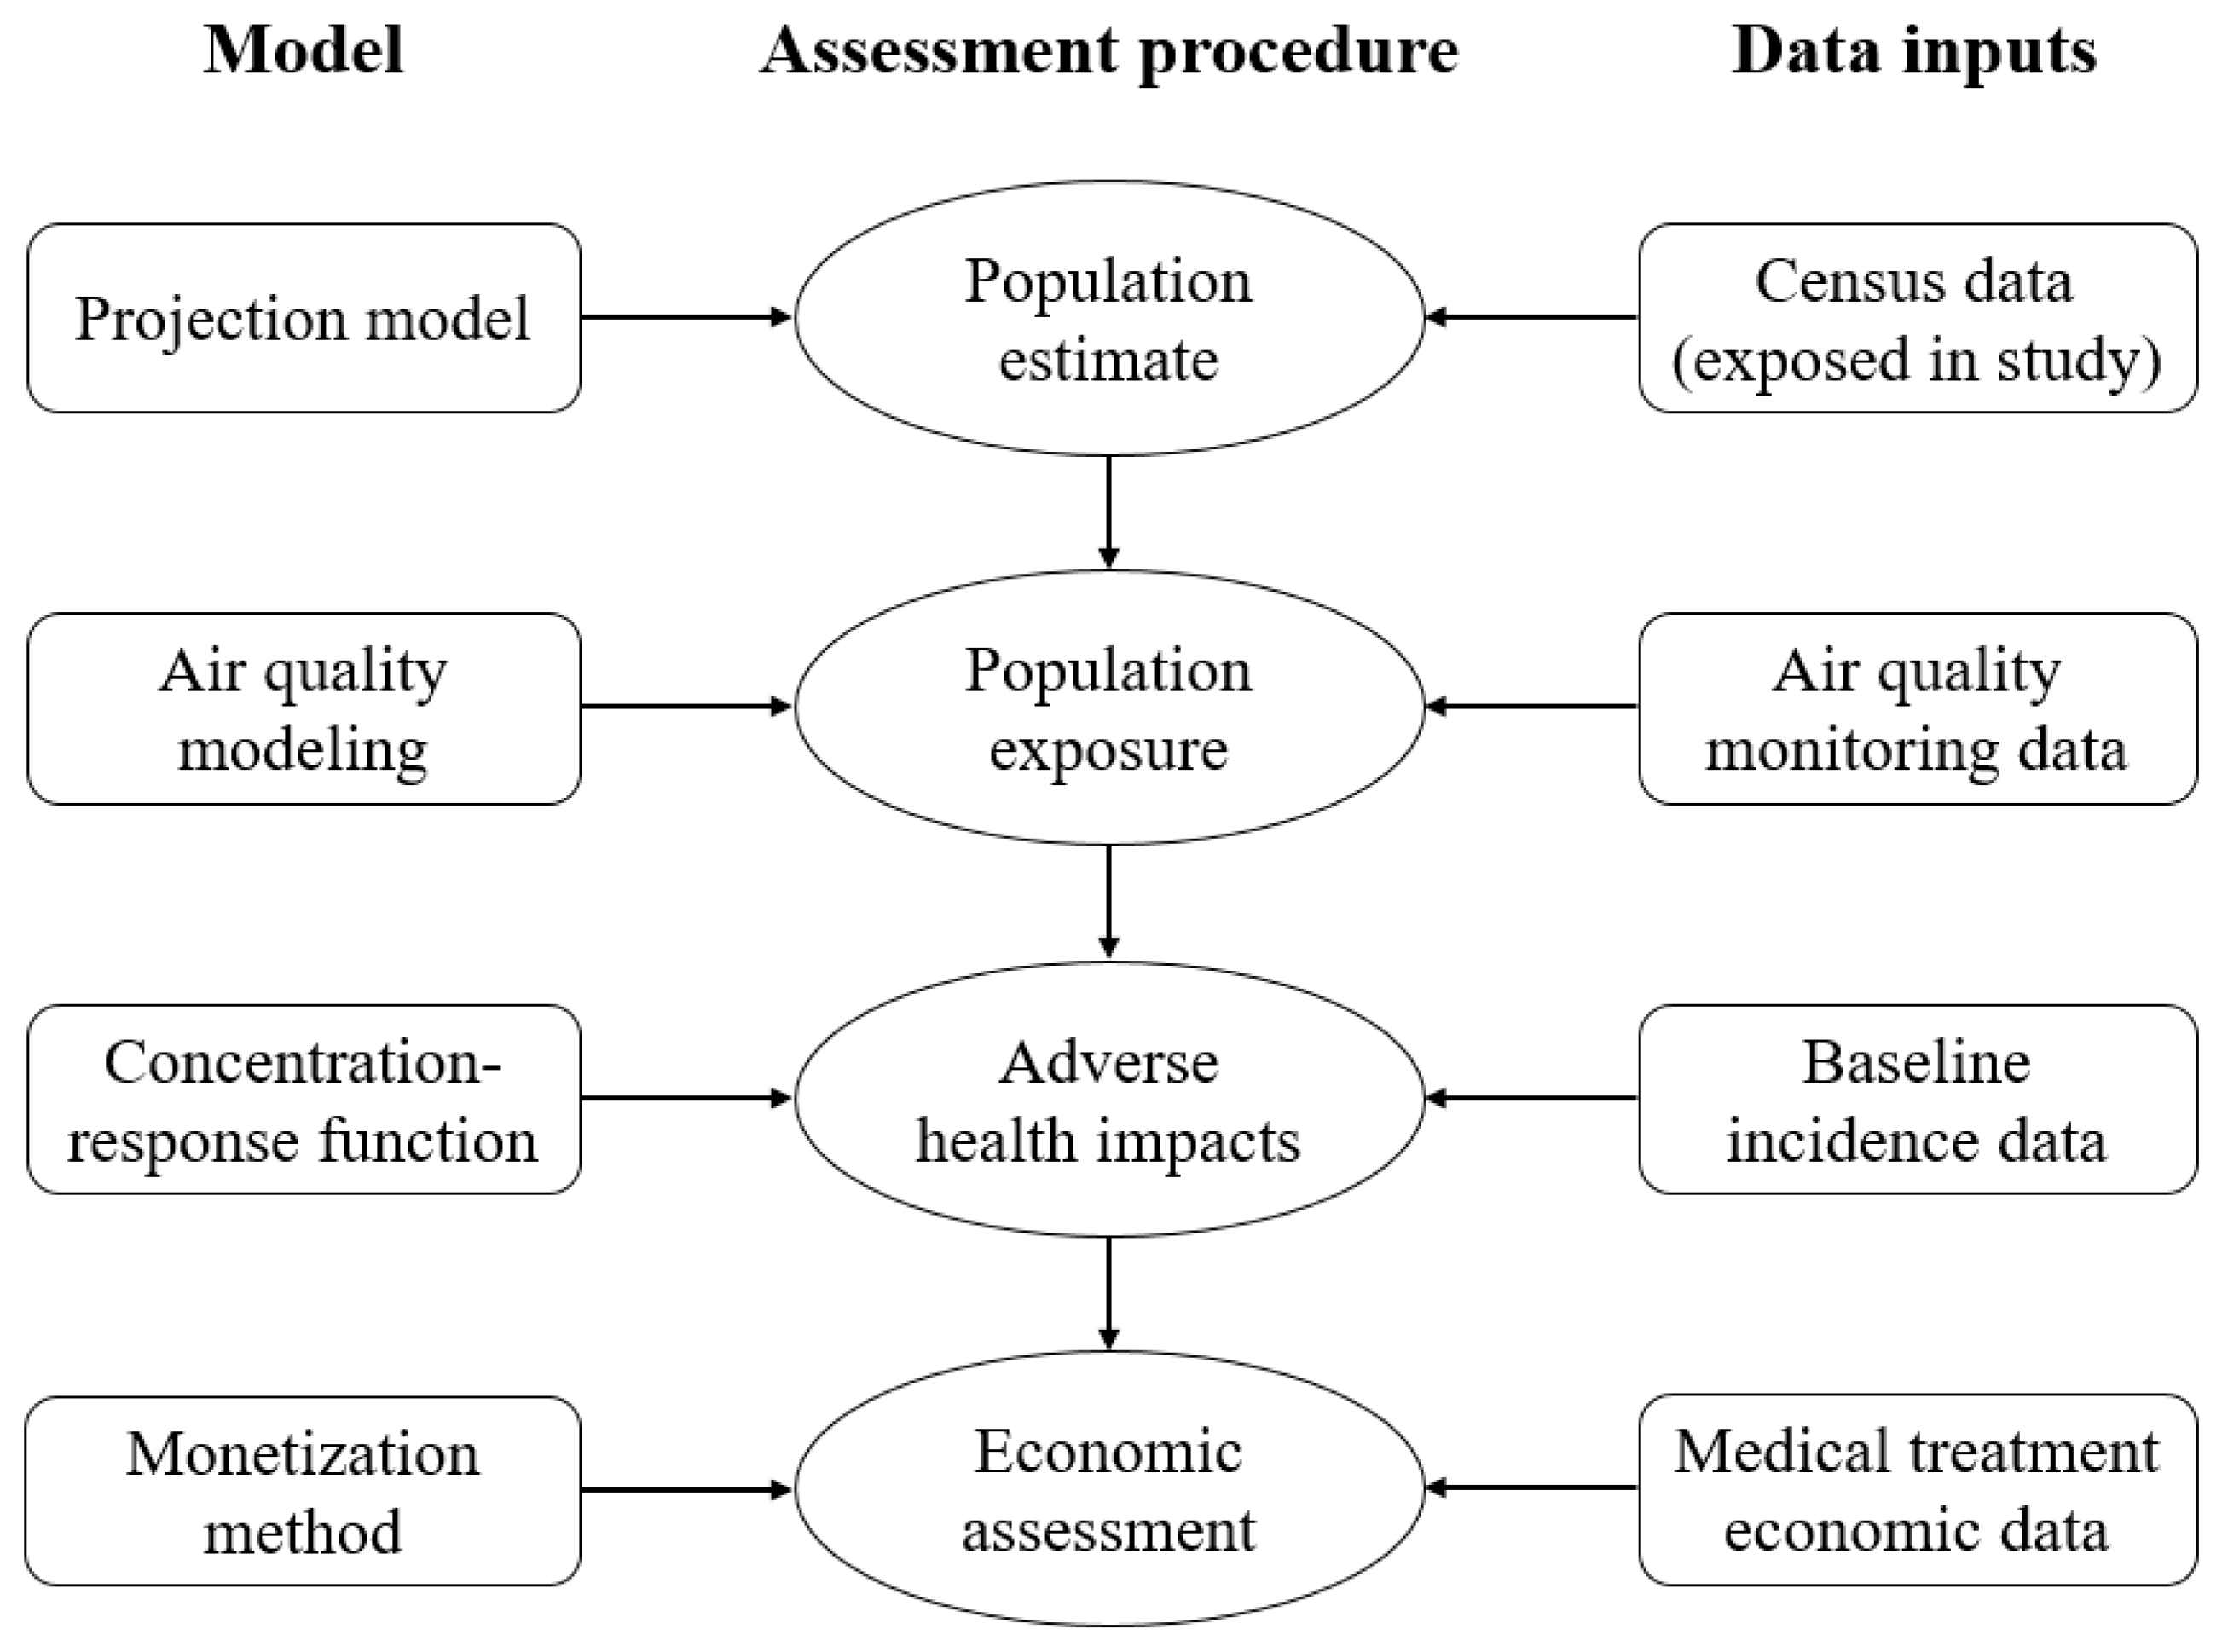
2. Methodological Approaches Used in the AP-HRAs
2.1. Population Estimates
2.2. Population Exposure to Air Pollution
- The Global Model of Ambient Particulates model (GMAPS) which was developed by the World Bank to estimate the ambient concentration of PM10 on the city-level and used in the previous Global Burden of Disease (GBD) studies [71];
- The global–regional chemistry transport model TM5, as well as the source receptor (SR) relationship, developed from TM5 which have been widely applied to evaluate the response of ambient air quality indicators to changes in emissions of various pollutants from the certain source in different control strategy scenarios [72,73,74];
2.3. Health Impact
- For short-term exposure:
- Mortality
- Hospital admissions or emergency department visits caused by respiratory diseases
- Hospital admissions or emergency department visits caused by cardiovascular diseases
- Days of restricted activity
- Absence from work or school
- Other acute symptoms
- For long-term exposure:
- Mortality caused by cardiovascular and respiratory disease
- Lung cancer
- Chronic incidence caused by respiratory or cardiovascular disease
- Decline in physiologic functions
- Intrauterine growth restriction
2.3.1. Concentration-Response Functions (CRFs)
2.3.2. Relative Risk (RR)
- Logarithm model:
- Power model:
2.3.3. Result Integration
- 1.
- Mortality and morbidity:
- 2.
- Disability-Adjusted Life Year (DALY)
2.4. Economic Assessment
3. AP-HRA Tools
4. Discussions
5. Conclusions
Author Contributions
Funding
Institutional Review Board Statement
Informed Consent Statement
Data Availability Statement
Acknowledgments
Conflicts of Interest
References
- Adar, S.D.; Filigrana, P.A.; Clements, N.; Peel, J.L. Ambient Coarse Particulate Matter and Human Health: A Systematic Review and Meta-Analysis. Curr. Environ. Health Rep. 2014, 1, 258–274. [Google Scholar] [CrossRef] [PubMed]
- Amann, M.; Bertok, I.; Borken-Kleefeld, J.; Cofala, J.; Hettelingh, J.-P.; Heyes, C.; Holland, M.; Kiesewetter, G.; Klimont, Z.; Rafaj, P.; et al. Policy Scenarios for the Revision of the Thematic Strategy on Air Pollution; TSAP Report #10; TSAP: Laxenburg, Austria, 2013. [Google Scholar]
- Amann, M.; Bertok, I.; Borken-Kleefeld, J.; Cofala, J.; Heyes, C.; Höglund-Isaksson, L.; Klimont, Z.; Nguyen, B.; Posch, M.; Rafaj, P.; et al. Cost-effective control of air quality and greenhouse gases in Europe: Modeling and policy applications. Environ. Model. Softw. 2011, 26, 1489–1501. [Google Scholar] [CrossRef]
- Anenberg, S.C.; Talgo, K.; Arunachalam, S.; Dolwick, P.; Jang, C.; West, J.J. Impacts of global, regional, and sectoral black carbon emission reductions on surface air quality and human mortality. Atmos. Chem. Phys. Discuss. 2011, 11, 7253–7267. [Google Scholar] [CrossRef]
- Anenberg, S.C.; Belova, A.; Brandt, J.; Fann, N.; Greco, S.; Guttikunda, S.; Heroux, M.-E.; Hurley, F.; Krzyzanowski, M.; Medina, S.; et al. Survey of Ambient Air Pollution Health Risk Assessment Tools. Risk Anal. 2016, 36, 1718–1736. [Google Scholar] [CrossRef] [PubMed]
- Anenberg, S.C.; Henze, D.K.; Lacey, F.; Irfan, A.; Kinney, P.; Kleiman, G.; Pillarisetti, A. Air pollution-related health and climate benefits of clean cookstove programs in Mozambique. Environ. Res. Lett. 2017, 12, 025006. [Google Scholar] [CrossRef]
- Anenberg, S.C.; West, J.J.; Yu, H.; Chin, M.; Schulz, M.; Bergmann, D.; Bey, I.; Bian, H.; Diehl, T.; Fiore, A.; et al. Impacts of intercontinental transport of anthropogenic fine particulate matter on human mortality. Air Qual. Atmos. Health 2014, 7, 369–379. [Google Scholar] [CrossRef]
- Anenberg, S.C.; West, J.J.; Fiore, A.M.; Jaffe, D.A.; Prather, M.J.; Bergmann, D.; Cuvelier, K.; Dentener, F.J.; Duncan, B.N.; Gauss, M.; et al. Intercontinental Impacts of Ozone Pollution on Human Mortality. Environ. Sci. Technol. 2009, 43, 6482–6487. [Google Scholar] [CrossRef]
- Apte, J.S.; Marshall, J.D.; Cohen, A.J.; Brauer, M. Addressing Global Mortality from Ambient PM2.5. Environ. Sci. Technol. 2015, 49, 8057–8066. [Google Scholar] [CrossRef]
- Pope, C.A.; Burnett, R.T.; Turner, M.C.; Cohen, A.; Krewski, D.; Jerrett, M.; Gapstur, S.M.; Thun, M.J. Lung Cancer and Cardiovascular Disease Mortality Associated with Ambient Air Pollution and Cigarette Smoke: Shape of the Exposure–Response Relationships. Environ. Health Perspect. 2011, 119, 1616–1621. [Google Scholar] [CrossRef]
- Santamouris, M. Energy and Climate in the Urban Built Environment. In Energy and Climate in the Urban Built Environment; Routledge: New York, NY, USA, 2013; pp. 137–144. [Google Scholar]
- Committee of the Environmental and Occupational Health Assembly of the American Thoracic Society. Health effects of outdoor air pollution. Am. J. Respir. Crit. Care Med. 1996, 153, 3–50. [Google Scholar] [CrossRef]
- Beelen, R.; Hoek, G.; Vienneau, D.; Eeftens, M.; Dimakopoulou, K.; Pedeli, X.; Tsai, M.-Y.; Künzli, N.; Schikowski, T.; Marcon, A.; et al. Development of NO2 and NOx land use regression models for estimating air pollution exposure in 36 study areas in Europe—The ESCAPE project. Atmos. Environ. 2013, 72, 10–23. [Google Scholar] [CrossRef]
- Bey, I.; Jacob, D.J.; Yantosca, R.M.; Logan, J.A.; Field, B.D.; Fiore, A.M.; Li, Q.; Liu, H.Y.; Mickley, L.J.; Schultz, M.G. Global modeling of tropospheric chemistry with assimilated meteorology: Model description and evaluation. J. Geophys. Res. Space Phys. 2001, 106, 23073–23095. [Google Scholar] [CrossRef]
- Billionnet, C.; Sherrill, D.; Annesi-Maesano, I. Estimating the Health Effects of Exposure to Multi-Pollutant Mixture. Ann. Epidemiol. 2012, 22, 126–141. [Google Scholar] [CrossRef]
- Boldo, E.; Linares, C.; Aragonés, N.; Lumbreras, J.; Borge, R.; De La Paz, D.; Pérez-Gómez, B.; Fernández-Navarro, P.; García-Pérez, J.; Pollán, M.; et al. Air quality modeling and mortality impact of fine particles reduction policies in Spain. Environ. Res. 2014, 128, 15–26. [Google Scholar] [CrossRef] [PubMed]
- Boldo, E.; Linares, C.; Lumbreras, J.; Borge, R.; Narros, A.; García-Pérez, J.; Fernández-Navarro, P.; Pérez-Gómez, B.; Aragonés, N.; Ramis, R. Health impact assessment of a reduction in ambient PM2.5 levels in Spain. Environ. Int. 2011, 37, 342–348. [Google Scholar] [CrossRef] [PubMed]
- Bonjour, S.; Adair-Rohani, H.; Wolf, J.; Bruce, N.G.; Mehta, S.; Prüss-Ustün, A.; Lahiff, M.; Rehfuess, E.A.; Mishra, V.; Smith, K.R. Solid Fuel Use for Household Cooking: Country and Regional Estimates for 1980–2010. Environ. Health Perspect. 2013, 121, 784–790. [Google Scholar] [CrossRef] [PubMed]
- Brandt, J.; Silver, J.D.; Christensen, J.H.; Andersen, M.S.; Bønløkke, J.H.; Sigsgaard, T.; Geels, C.; Gross, A.L.; Hansen, A.B.; Hansen, K.M.; et al. Contribution from the ten major emission sectors in Europe and Denmark to the health-cost externalities of air pollution using the EVA model system—An integrated modelling approach. Atmos. Chem. Phys. Discuss. 2013, 13, 7725–7746. [Google Scholar] [CrossRef]
- Brauer, M.; Amann, M.; Burnett, R.T.; Cohen, A.; Dentener, F.; Ezzati, M.; Henderson, S.B.; Krzyzanowski, M.; Martin, R.V.; Van Dingenen, R.; et al. Exposure Assessment for Estimation of the Global Burden of Disease Attributable to Outdoor Air Pollution. Environ. Sci. Technol. 2011, 46, 652–660. [Google Scholar] [CrossRef]
- Brauer, M.; Freedman, G.; Frostad, J.; Van Donkelaar, A.; Martin, R.V.; Dentener, F.; Van Dingenen, R.; Estep, K.; Amini, H.; Apte, J.S.; et al. Ambient Air Pollution Exposure Estimation for the Global Burden of Disease 2013. Environ. Sci. Technol. 2016, 50, 79–88. [Google Scholar] [CrossRef] [PubMed]
- Burnett, R.; Chen, H.; Szyszkowicz, M.; Fann, N.; Hubbell, B.; Pope, C.A.; Apte, J.S.; Brauer, M.; Cohen, A.; Weichenthal, S.; et al. Global estimates of mortality associated with long-term exposure to outdoor fine particulate matter. Proc. Natl. Acad. Sci. USA 2018, 115, 9592–9597. [Google Scholar] [CrossRef] [PubMed]
- Burnett, R.T.; Pope, C.A.; Ezzati, M.; Olives, C.; Lim, S.S.; Mehta, S.; Shin, H.H.; Singh, G.; Hubbell, B.; Brauer, M.; et al. An Integrated Risk Function for Estimating the Global Burden of Disease Attributable to Ambient Fine Particulate Matter Exposure. Environ. Health Perspect. 2014, 122, 397–403. [Google Scholar] [CrossRef] [PubMed]
- Chafe, Z.A.; Brauer, M.; Klimont, Z.; Van Dingenen, R.; Mehta, S.R.; Rao, S.; Riahi, K.; Dentener, F.; Smith, K.R. Household Cooking with Solid Fuels Contributes to Ambient PM 2.5 Air Pollution and the Burden of Disease. Environ. Health Perspect. 2014, 122, 1314–1320. [Google Scholar] [CrossRef]
- Chambliss, S.E.; Silva, R.; West, J.; Zeinali, M.; Minjares, R. Estimating source-attributable health impacts of ambient fine particulate matter exposure: Global premature mortality from surface transportation emissions in 2005. Environ. Res. Lett. 2014, 9, 104009. [Google Scholar] [CrossRef]
- Chanel, O.; Aphekom Group; Perez, L.; Künzli, N.; Medina, S. The hidden economic burden of air pollution-related morbidity: Evidence from the Aphekom project. Eur. J. Health Econ. 2015, 17, 1101–1115. [Google Scholar] [CrossRef]
- Chen, L.; Shi, M.; Gao, S.; Li, S.; Mao, J.; Zhang, H.; Sun, Y.; Bai, Z.; Wang, Z. Assessment of population exposure to PM2.5 for mortality in China and its public health benefit based on BenMAP. Environ. Pollut. 2017, 221, 311–317. [Google Scholar] [CrossRef] [PubMed]
- Chen, X.; Zhang, L.-W.; Huang, J.-J.; Song, F.-J.; Zhang, L.-P.; Qian, Z.-M.; Trevathan, E.; Mao, H.-J.; Han, B.; Vaughn, M.; et al. Long-term exposure to urban air pollution and lung cancer mortality: A 12-year cohort study in Northern China. Sci. Total. Environ. 2016, 571, 855–861. [Google Scholar] [CrossRef]
- Cheng, Z.; Jiang, J.; Fajardo, O.; Wang, S.; Hao, J. Characteristics and health impacts of particulate matter pollution in China (2001–2011). Atmos. Environ. 2013, 65, 186–194. [Google Scholar] [CrossRef]
- Cohen, A.J.; Brauer, M.; Burnett, R.; Anderson, H.R.; Frostad, J.; Estep, K.; Balakrishnan, K.; Brunekreef, B.; Dandona, L.; Dandona, R.; et al. Estimates and 25-year trends of the global burden of disease attributable to ambient air pollution: An analysis of data from the Global Burden of Diseases Study 2015. Lancet 2017, 389, 1907–1918. [Google Scholar] [CrossRef]
- Daniels, M.J.; Dominici, F.; Zeger, S.L.; Samet, J.M. The National Morbidity, Mortality, and Air Pollution Study. Part III: PM10 concentration-response curves and thresholds for the 20 largest US cities. Res. Rep. 2004, 94, 1–21. [Google Scholar]
- De Molnary, L.; Raduan, R.N.; Arone, I.D.; Grynberg, S.E.; Branco, O.E.; Jacomino, V.M.; Barreto, A.A. Study Description of the Externe Project and the Ecosense Tool Applied to Brazil; ExternE: Sao Paulo, Brazil, 2000. [Google Scholar]
- Dias, D.; Tchepel, O.; Carvalho, A.; Miranda, A.I.; Borrego, C. Particulate Matter and Health Risk under a Changing Climate: Assessment for Portugal. Sci. World J. 2012, 2012, 1–10. [Google Scholar] [CrossRef]
- Van Donkelaar, A.; Martin, R.V.; Brauer, M.; Kahn, R.; Levy, R.; Verduzco, C.; Villeneuve, P.J. Global Estimates of Ambient Fine Particulate Matter Concentrations from Satellite-Based Aerosol Optical Depth: Development and Application. Environ. Health Perspect. 2010, 118, 847–855. [Google Scholar] [CrossRef]
- EcoSenseWeb 2. 2018. Available online: http://ecosenseweb.ier.uni-stuttgart.de/ (accessed on 25 May 2020).
- Eeftens, M.; Beelen, R.; De Hoogh, K.; Bellander, T.; Cesaroni, G.; Cirach, M.; Declercq, C.; Dėdelė, A.; Dons, E.; De Nazelle, A.; et al. Development of Land Use Regression Models for PM2.5, PM2.5 Absorbance, PM10 and PMcoarse in 20 European Study Areas; Results of the ESCAPE Project. Environ. Sci. Technol. 2012, 46, 11195–11205. [Google Scholar] [CrossRef]
- Emmons, L.K.; Walters, S.; Hess, P.G.; Lamarque, J.; Pfister, G.G.; Fillmore, D.; Granier, C. Model Development Description and evaluation of the Model for Ozone and Related chemical Tracers, version 4 (MOZART-4). Geosci. Model Dev. 2010, 3, 43–67. [Google Scholar] [CrossRef]
- Environmental Protection Agenty. Regulatory Impact Analysis of the Final Revisions to the National Ambient Air Quality Standards for Ground-Level Ozone. 2015. Available online: https://www.epa.gov/naaqs/regulatory-impact-analysis-final-revisions-national-ambient-air-quality-standards-ground-level (accessed on 30 May 2020).
- Estarlich, M.; Ballester, F.; Aguilera, I.; Fernández-Somoano, A.; Lertxundi, A.; Llop, S.; Freire, C.; Tardon, A.; Basterrechea, M.; Sunyer, J.; et al. Residential Exposure to Outdoor Air Pollution during Pregnancy and Anthropometric Measures at Birth in a Multicenter Cohort in Spain. Environ. Health Perspect. 2011, 119, 1333–1338. [Google Scholar] [CrossRef]
- European Commission. ExternE: Externalities of Energy ExternE Externalities of Energy. In Reproduction; CIEMAT: Belgrade, Serbia, 2005; Volume EUR 21951. [Google Scholar]
- Fann, N.; Lamson, A.D.; Anenberg, S.C.; Wesson, K.; Risley, D.; Hubbell, B.J. Estimating the National Public Health Burden Associated with Exposure to Ambient PM2.5 and Ozone. Risk Anal. 2011, 32, 81–95. [Google Scholar] [CrossRef] [PubMed]
- Fann, N.; Nolte, C.G.; Dolwick, P.; Spero, T.L.; Brown, A.C.; Phillips, S.; Anenberg, S. The geographic distribution and economic value of climate change-related ozone health impacts in the United States in 2030. J. Air Waste Manag. Assoc. 2014, 65, 570–580. [Google Scholar] [CrossRef] [PubMed]
- Fiore, A.M.; Dentener, F.J.; Wild, O.; Cuvelier, C.; Schultz, M.G.; Hess, P.; Textor, C.; Schulz, M.; Doherty, R.M.; Horowitz, L.W.; et al. Multimodel estimates of intercontinental source-receptor relationships for ozone pollution. J. Geophys. Res. Space Phys. 2009, 114, 1–21. [Google Scholar] [CrossRef]
- Dentener, F.; Keating, T.; Akimoto, H. (Eds.) Hemispheric Transport of 2010 Part A: Ozone and Particulate Matter; United Nations, Economic Commission for Europe: Geneva, Switzerland, 2010. [Google Scholar]
- Farzaneh, H.; De Oliveira, J.A.P.; McLellan, B.; Ohgaki, H. Towards a Low Emission Transport System: Evaluating the Public Health and Environmental Benefits. Energies 2019, 12, 3747. [Google Scholar] [CrossRef]
- Farzaneh, H.; Xin, W. Environmental and Economic Impact Assessment of the Low Emission Development Strategies (LEDS) in Shanghai, China. APN Sci. Bull. 2020, 10, 26–33. [Google Scholar] [CrossRef]
- Farzaneh, H. Scenario Analysis of Low-Carbon Urban Energy System in Asian Cities. In Devising a Clean Energy Strategy for Asian Cities; Springer Nature: Singapore, 2018; pp. 3–15. [Google Scholar]
- Farzaneh, H. Climate Change Multiple Impact Assessment Models. In Energy Systems Modeling; Springer International Publishing: Singapore, 2019; pp. 107–129. [Google Scholar]
- Farzaneh, H. Multiple benefits assessment of the clean energy development in Asian Cities. Energy Procedia 2017, 136, 8–13. [Google Scholar] [CrossRef]
- Farzaneh, H. Development of a Bottom-up Technology Assessment Model for Assessing the Low Carbon Energy Scenarios in the Urban System. Energy Procedia 2017, 107, 321–326. [Google Scholar] [CrossRef]
- Farzaneh, H.; Zusman, E.; Chae, Y. Multiple benefits assessment of the utilization of high-efficiency heat only boilers in Ulaanbaatar, Mongolia. In Aligning Climate Change and Sustainable Development Policies in Asia; Springer Nature: Singapore, 2021; In press. [Google Scholar]
- Gao, T.; Wang, X.C.; Chen, R.; Ngo, H.H.; Guo, W. Disability adjusted life year (DALY): A useful tool for quantitative assessment of environmental pollution. Sci. Total Environ. 2015, 511, 268–287. [Google Scholar] [CrossRef]
- Ghozikali, M.G.; Mosaferi, M.; Safari, G.H.; Jaafari, J. Effect of exposure to O3, NO2, and SO2 on chronic obstructive pulmonary disease hospitalizations in Tabriz, Iran. Environ. Sci. Pollut. Res. 2014, 22, 2817–2823. [Google Scholar] [CrossRef]
- Gidhagen, L.; Johansson, H.; Omstedt, G. SIMAIR—Evaluation tool for meeting the EU directive on air pollution limits. Atmos. Environ. 2009, 43, 1029–1036. [Google Scholar] [CrossRef]
- Glorennec, P.; Monroux, F. Health Impact Assessment of PM10Exposure in the City of Caen, France. J. Toxicol. Environ. Health Part A 2007, 70, 359–364. [Google Scholar] [CrossRef] [PubMed]
- Guttikunda, S.K.; Goel, R. Health impacts of particulate pollution in a megacity—Delhi, India. Environ. Dev. 2013, 6, 8–20. [Google Scholar] [CrossRef]
- Guttikunda, S.K.; Jawahar, P. Application of SIM-air modeling tools to assess air quality in Indian cities. Atmos. Environ. 2012, 62, 551–561. [Google Scholar] [CrossRef]
- Guttikunda, S.K.; Khaliquzzaman, M. Health benefits of adapting cleaner brick manufacturing technologies in Dhaka, Bangladesh. Air Qual. Atmos. Health 2014, 7, 103–112. [Google Scholar] [CrossRef]
- Guttikunda, S.K.; Kopakka, R.V. Source emissions and health impacts of urban air pollution in Hyderabad, India. Air Qual. Atmos. Health 2014, 7, 195–207. [Google Scholar] [CrossRef]
- Guttikunda, S.K.; Lodoysamba, S.; Bulgansaikhan, B.; Dashdondog, B. Particulate pollution in Ulaanbaatar, Mongolia. Air Qual. Atmos. Health 2013, 6, 589–601. [Google Scholar] [CrossRef]
- Hansen, C.; Luben, T.; Sacks, J.D.; Olshan, A.; Jeffay, S.; Strader, L.; Perreault, S.D. The Effect of Ambient Air Pollution on Sperm Quality. Environ. Health Perspect. 2010, 118, 203–209. [Google Scholar] [CrossRef]
- HAPIT. Household Air Pollution (HAP) Tool. Available online: https://householdenergy.shinyapps.io/hapit3/ (accessed on 17 December 2020).
- World Health Organization Office for Europe. Review of Evidence on Health Aspects of Air Pollution-REVIHAAP Project; Technical Report; USA, 2013; Available online: http://www.euro.who.int/pubrequest (accessed on 11 September 2020).
- Hoek, G.; Beelen, R.; De Hoogh, K.; Vienneau, D.; Gulliver, J.; Fischer, P.; Briggs, D. A review of land-use regression models to assess spatial variation of outdoor air pollution. Atmos. Environ. 2008, 42, 7561–7578. [Google Scholar] [CrossRef]
- Hoek, G.; Krishnan, R.M.; Beelen, R.; Peters, A.; Ostro, B.; Brunekreef, B.; Kaufman, J.D. Long-term air pollution exposure and cardio- respiratory mortality: A review. Environ. Health 2013, 12, 43. [Google Scholar] [CrossRef] [PubMed]
- Hou, L.; Zhang, K.; Luthin, M.A.; Baccarelli, A.A. Public Health Impact and Economic Costs of Volkswagen’s Lack of Compliance with the United States’ Emission Standards. Int. J. Environ. Res. Public Health 2016, 13, 891. [Google Scholar] [CrossRef]
- Hou, Q.; An, X.; Tao, Y.; Sun, Z. Assessment of resident’s exposure level and health economic costs of PM10 in Beijing from 2008 to 2012. Sci. Total Environ. 2016, 563, 557–565. [Google Scholar] [CrossRef] [PubMed]
- Hou, Q.; An, X.; Wang, Y.; Tao, Y.; Sun, Z. An assessment of China’s PM10-related health economic losses in 2009. Sci. Total Environ. 2012, 435–436, 61–65. [Google Scholar] [CrossRef]
- Huang, D.; Andersson, H.; Zhang, S. Willingness to pay to reduce health risks related to air quality: Evidence from a choice experiment survey in Beijing. J. Environ. Plan. Manag. 2017, 61, 2207–2229. [Google Scholar] [CrossRef]
- Hubbell, B.J.; Hallberg, A.; McCubbin, D.R.; Post, E. Health-Related Benefits of Attaining the 8-Hr Ozone Standard. Environ. Health Perspect. 2005, 113, 73–82. [Google Scholar] [CrossRef]
- Katsouyanni, K.; Touloumi, G.; Spix, C.; Schwartz, J.; Balducci, F.; Medina, S.; Rossi, G.; Wojtyniak, B.; Sunyer, J.; Bacharova, L.; et al. Short term effects of ambient sulphur dioxide and particulate matter on mortality in 12 European cities: Results from time series data from the APHEA project. BMJ 1997, 314, 1658. [Google Scholar] [CrossRef]
- Kheirbek, I.; Wheeler, K.; Walters, S.; Kass, D.; Matte, T. PM2.5 and ozone health impacts and disparities in New York City: Sensitivity to spatial and temporal resolution. Air Qual. Atmos. Health 2013, 6, 473–486. [Google Scholar] [CrossRef]
- Kiesewetter, G.; Borken-Kleefeld, J.; Schöpp, W.; Heyes, C.; Bertok, I.; Thunis, P.; Bessagnet, B.; Terrenoire, E.; Amann, M. Modelling Compliance with NO2 and PM10 Air Quality Limit Values in the GAINS Model Version 1.0 The Authors. 2013. Available online: http://gains.iiasa.ac.at/TSAP (accessed on 4 November 2020).
- Kim, D.; Kim, J.; Jeong, J.; Choi, M. Estimation of health benefits from air quality improvement using the MODIS AOD dataset in Seoul, Korea. Environ. Res. 2019, 173, 452–461. [Google Scholar] [CrossRef]
- Esplugues, A.; Ballester, F.; Lacasaña, M. Exposure to ambient air pollution and prenatal and early childhood health effects. Eur. J. Epidemiol. 2005, 20, 183–199. [Google Scholar] [CrossRef]
- Lelieveld, J.; Evans, J.S.; Fnais, M.; Giannadaki, D.; Pozzer, A. The contribution of outdoor air pollution sources to premature mortality on a global scale. Nat. Cell Biol. 2015, 525, 367–371. [Google Scholar] [CrossRef]
- Liao, J.; Ye, W.; Clasen, T. Modeling the Impact of Indoor Air Purifier on Air Pollution Exposure Reduction and Associated Health Benefits in Urban Delhi Households. ISEE Conf. Abstr. 2018, 2018. [Google Scholar] [CrossRef]
- Lim, S.S.; Vos, T.; Flaxman, A.D.; Danaei, G.; Shibuya, K.; Adair-Rohani, H.; AlMazroa, M.A.; Amann, M.; Anderson, H.R.; Andrews, K.G.; et al. A comparative risk assessment of burden of disease and injury attributable to 67 risk factors and risk factor clusters in 21 regions, 1990–2010: A systematic analysis for the Global Burden of Disease Study 2010. Lancet 2012, 380, 2224–2260. [Google Scholar] [CrossRef]
- Liu, C.; Chen, R.; Sera, F.; Vicedo-Cabrera, A.M.; Guo, Y.; Tong, S.; Coelho, M.S.Z.S.; Saldiva, P.H.N.; Lavigne, E.; Matus, P.; et al. Ambient Particulate Air Pollution and Daily Mortality in 652 Cities. N. Engl. J. Med. 2019, 381, 705–715. [Google Scholar] [CrossRef] [PubMed]
- Maji, K.J.; Dikshit, A.K.; Deshpande, A. Disability-adjusted life years and economic cost assessment of the health effects related to PM2.5 and PM10 pollution in Mumbai and Delhi, in India from 1991 to 2015. Environ. Sci. Pollut. Res. 2016, 24, 4709–4730. [Google Scholar] [CrossRef]
- Ezzati, M.; Lopez, A.D.; Rodgers, A.A.; Murray, C.J. Comparative Quantification of Health Risks: Global and Regional Burden of Disease Attributable to Selected Major Risk Factors; World Health Organization: Geneva, Switzerland, 2004; Volume 2. [Google Scholar]
- McCubbin, D.; Sovacool, B.K. The Hidden Factors That Make Wind Energy Cheaper than Natural Gas in the United States. Electr. J. 2011, 24, 84–95. [Google Scholar] [CrossRef]
- Medina, S.; Ballester, F.; Chanel, O.; Declercq, C.; Pascal, M. Quantifying the health impacts of outdoor air pollution: Useful estimations for public health action. J. Epidemiol. Community Health 2013, 67, 480–483. [Google Scholar] [CrossRef] [PubMed]
- Mills, N.L.; Donaldson, K.; Hadoke, P.W.; Boon, N.A.; MacNee, W.; Cassee, F.R.; Sandström, T.; Blomberg, A.; Newby, D.E. Adverse cardiovascular effects of air pollution. Nat. Clin. Pract. Neurol. 2008, 6, 36–44. [Google Scholar] [CrossRef]
- Mirasgedis, S.; Hontou, V.; Georgopoulou, E.; Sarafidis, Y.; Gakis, N.; Lalas, D.; Loukatos, A.; Gargoulas, N.; Mentzis, A.; Economidis, D.; et al. Environmental damage costs from airborne pollution of industrial activities in the greater Athens, Greece area and the resulting benefits from the introduction of BAT. Environ. Impact Assess. Rev. 2008, 28, 39–56. [Google Scholar] [CrossRef]
- Mohammadi, A.; Azhdarpoor, A.; Shahsavani, A.; Tabatabaee, H. Investigating the Health Effects of Exposure to Criteria Pollutants Using AirQ2.2.3 in Shiraz, Iran. Aerosol Air Qual. Res. 2016, 16, 1034–1043. [Google Scholar] [CrossRef]
- Nafstad, P.; Håheim, L.L.; Oftedal, B.; Gram, F.; Holme, I.; Hjermann, I.; Leren, P. Lung cancer and air pollution: A 27 year follow up of 16,209 Norwegian men. Thorax 2003, 58, 1071–1076. [Google Scholar] [CrossRef] [PubMed]
- Nawahda, A. Reductions of PM2.5 Air Concentrations and Possible Effects on Premature Mortality in Japan. Water Air Soil Pollut. 2013, 224, 1–7. [Google Scholar] [CrossRef]
- Olawepo, J.O.; Chen, L.-W.A. Health Benefits from Upgrading Public Buses for Cleaner Air: A Case Study of Clark County, Nevada and the United States. Int. J. Environ. Res. Public Health 2019, 16, 720. [Google Scholar] [CrossRef]
- Olsson, D.; Mogren, I.; Forsberg, B. Air pollution exposure in early pregnancy and adverse pregnancy outcomes: A register-based cohort study. BMJ Open 2013, 3, e001955. [Google Scholar] [CrossRef]
- Ostro, B.; Prüss-üstün, A.; Campbell-lendrum, D.; Corvalán, C.; Woodward, A. Outdoor air pollution: Assessing the environmental burden of disease at national and local levels. In Protection of the Human Environment; World Health Organization: Geneva, Switzerland, 2004; (Issue Environmental Burden of Disease Series, No. 5). [Google Scholar]
- Paciorek, C.J.; Liu, Y. Assessment and statistical modeling of the relationship between remotely sensed aerosol optical depth and PM2.5 in the eastern United States. Res. Rep. 2012, 167, 5–83. [Google Scholar]
- Oliveira, J.A.; Doll, C.N.; Siri, J.; Dreyfus, M.; Farzaneh, H.; Capon, A. Urban governance and the systems ap-proaches to health-environment Co-benefits in cities. Cadernos de Saúde Pública 2015, 31, 25–38. [Google Scholar] [CrossRef]
- Pascal, M.; Corso, M.; Chanel, O.; Declercq, C.; Badaloni, C.; Cesaroni, G.; Henschel, S.; Meister, K.; Haluza, D.; Martin-Olmedo, P.; et al. Assessing the public health impacts of urban air pollution in 25 European cities: Results of the Aphekom project. Sci. Total Environ. 2013, 449, 390–400. [Google Scholar] [CrossRef]
- Patankar, A.; Trivedi, P. Monetary burden of health impacts of air pollution in Mumbai, India: Implications for public health policy. Public Health 2011, 125, 157–164. [Google Scholar] [CrossRef]
- Pennell, K.G.; Thompson, M.; Rice, J.W.; Senier, L.; Brown, P.; Suuberg, E. Bridging Research and Environmental Regulatory Processes: The Role of Knowledge Brokers. Environ. Sci. Technol. 2013, 47, 11985–11992. [Google Scholar] [CrossRef]
- Perera, F.; Cooley, D.; Berberian, A.; Mills, D.; Kinney, P. Co-Benefits to Children’s Health of the U.S. Regional Greenhouse Gas Initiative. Environ. Health Perspect. 2020, 128, 077006. [Google Scholar] [CrossRef] [PubMed]
- Perez, L.; Declercq, C.; Iñiguez, C.; Aguilera, I.; Badaloni, C.; Ballester, F.; Bouland, C.; Chanel, O.; Cirarda, F.B.; Forastiere, F.; et al. Chronic burden of near-roadway traffic pollution in 10 European cities (APHEKOM network). Eur. Respir. J. 2013, 42, 594–605. [Google Scholar] [CrossRef] [PubMed]
- Pillarisetti, A.; Mehta, S.; Smith, K.R. HAPIT, the Household Air Pollution Intervention Tool, to Evaluate the Health Benefits and Cost-Effectiveness of Clean Cooking Interventions. In Broken Pumps and Promises; Springer International Publishing: New York, NY, USA, 2016; pp. 147–169. [Google Scholar] [CrossRef]
- Pillarisetti, A.; Jamison, D.T.; Smith, K.R.; Mock, C.N.; Nugent, R.; Kobusingye, O. Household Energy Interventions and Health and Finances in Haryana, India: An Extended Cost-Effectiveness Analysis. In Disease Control Priorities, Third Edition: Injury Prevention and Environmental Health; The World Bank: New York, NY, USA, 2017; Volume 7, pp. 223–237. [Google Scholar] [CrossRef]
- Pope, C.A.; Burnett, R.T.; Krewski, D.; Jerrett, M.; Shi, Y.; Calle, E.E.; Thun, M.J. Cardiovascular Mortality and Exposure to Airborne Fine Particulate Matter and Cigarette Smoke. Circulation 2009, 120, 941–948. [Google Scholar] [CrossRef]
- Pope, C.A.; Burnett, R.T.; Thun, M.J.; Calle, E.E.; Krewski, D.; Ito, K.; Thurston, G.D. Lung cancer, cardiopulmonary mortality, and long-term exposure to fine particulate air pollution. J. Am. Med. Assoc. 2002, 287, 1132–1141. [Google Scholar] [CrossRef]
- Power, M.C.; Weisskopf, M.G.; Alexeeff, S.E.; Coull, B.A.; Spiro, A.; Schwartz, J. Traffic-Related Air Pollution and Cognitive Function in a Cohort of Older Men. Environ. Health Perspect. 2011, 119, 682–687. [Google Scholar] [CrossRef]
- Prüss-üstün, A.; Prüss-üstün, A.; Campbell-lendrum, D.; Corvalán, C.; Woodward, A. Assessing the Environmental Burden of Disease at National and Local Levels; WHO: Geneva, Switzerland, 2003. [Google Scholar]
- Ranft, U.; Schikowski, T.; Sugiri, D.; Krutmann, J.; Krämer, U. Long-term exposure to traffic-related particulate matter impairs cognitive function in the elderly. Environ. Res. 2009, 109, 1004–1011. [Google Scholar] [CrossRef]
- Chen, R.; Kan, H.; Chen, B.; Huang, W.; Bai, Z.; Song, G.; Pan, G. Association of Particulate Air Pollution With Daily Mortality: The China Air Pollution and Health Effects Study. Am. J. Epidemiol. 2012, 175, 1173–1181. [Google Scholar] [CrossRef]
- Rodgers, M.; Coit, D.; Felder, F.; Carlton, A. Assessing the effects of power grid expansion on human health externalities. Socio-Econ. Plan. Sci. 2019, 66, 92–104. [Google Scholar] [CrossRef]
- Sacks, J.D.; Lloyd, J.M.; Zhu, Y.; Anderton, J.; Jang, C.J.; Hubbell, B.; Fann, N.; Lloyd, J.; Mathews, J.C.; Rickman, E.; et al. Environ Model Softw. In Environmental Modelling & Software: With Environment Data News; NIH Public Access: Geneva, Switzerland; WHO: Geneva, Switzerland, 2018; Volume 104. Available online: http://www.epa.gov/benmap (accessed on 23 September 2020).
- Sacks, J.D.; Fann, N.; Gumy, S.; Kim, I.; Ruggeri, G.; Mudu, P. Quantifying the Public Health Benefits of Reducing Air Pollution: Critically Assessing the Features and Capabilities of WHO’s AirQ+ and U.S. EPA’s Environmental Benefits Mapping and Analysis Program—Community Edition (BenMAP—CE). Atmosphere 2020, 11, 516. [Google Scholar] [CrossRef]
- Schmid, D.; Korkmaz, P.; Blesl, M.; Fahl, U.; Friedrich, R. Analyzing transformation pathways to a sustainable European energy system—Internalization of health damage costs caused by air pollution. Energy Strat. Rev. 2019, 26, 100417. [Google Scholar] [CrossRef]
- Schwartz, J. Assessing Confounding, Effect Modification, and Thresholds in the Association between Ambient Particles and Daily Deaths. Environ. Health Perspect. 2000, 1081, 563–568. [Google Scholar] [CrossRef] [PubMed]
- Schwartz, J.; Dockery, D.W.; Neas, L.M. Is Daily Mortality Associated Specifically with Fine Particles? J. Air Waste Manag. Assoc. 1996, 46, 927–939. [Google Scholar] [CrossRef] [PubMed]
- Schwartz, J.; Laden, F.; Zanobetti, A. The concentration-response relation between PM(2.5) and daily deaths. Environ. Health Perspect. 2002, 110, 1025–1029. [Google Scholar] [CrossRef]
- Shindell, D.; Faluvegi, G.; Walsh, M.; Anenberg, S.C.; Van Dingenen, R.; Muller, N.Z.; Austin, J.; Koch, D.; Milly, G. Climate, health, agricultural and economic impacts of tighter vehicle-emission standards. Nat. Clim. Chang. 2011, 1, 59–66. [Google Scholar] [CrossRef]
- SimAir. Simple Interactive Models for Better Air Quality (SIM-Air). 2020. Available online: https://urbanemissions.info/tools/sim-air/ (accessed on 25 November 2020).
- Simpson, D. Transboundary Acidification, Eutrophication and Ground Level Ozone in Europe. 2003. Available online: https://www.emep.int/publ/reports/2003/emep_report_1_part1_2003.pdf (accessed on 25 November 2020).
- Solazzo, E.; Riccio, A.; Van Dingenen, R.; Valentini, L.; Galmarini, S. Evaluation and uncertainty estimation of the impact of air quality modelling on crop yields and premature deaths using a multi-model ensemble. Sci. Total Environ. 2018, 633, 1437–1452. [Google Scholar] [CrossRef]
- Spadaro, J.V.; Rabl, A.; Jourdaint, E.; Coussy, P. External costs of air pollution: Case study and results for transport between Paris and Lyon. Int. J. Veh. Des. 1998, 20, 274. [Google Scholar] [CrossRef]
- Thomas, D.C.; Witte, J.S.; Greenland, S. Dissecting Effects of Complex Mixtures. Epidemiology 2007, 18, 186–190. [Google Scholar] [CrossRef]
- United Nations Department of Economic and Social Affairs. World Population Prospects; Data Booklet: Laxenburg, Austria, 2019. [Google Scholar]
- United States. Environmental Protection Agency. Final Rule for Control of Air Pollution From New Motor Vehicles: Tier 2 Motor Vehicle Emissions Standards and Gasoline Sulfur Control Requirements. 2000. Available online: https://www.epa.gov/regulations-emissions-vehicles-and-engines/final-rule-control-air-pollution-new-motor-vehicles-tier (accessed on 25 November 2020).
- United States. Environmental Protection Agency. User’s Manual for the Co—Benefits Risk Assessment (COBRA) Screening Model. 2020. Available online: https://www.epa.gov/statelocalenergy/users-manual-co-benefits-risk-assessment-cobra-screening-model (accessed on 25 November 2020).
- Viana, M.; Fann, N.; Tobias, A.; Querol, X.; Rojas-Rueda, D.; Plaza, A.; Aynos, G.; Condé, J.A.; Fernandez, L.; Fernandez, C. Environmental and Health Benefits from Designating the Marmara Sea and the Turkish Straits as an Emission Control Area (ECA). Environ. Sci. Technol. 2015, 49, 3304–3313. [Google Scholar] [CrossRef]
- Likhvar, V.N.; Pascal, M.; Markakis, K.; Colette, A.; Hauglustaine, D.; Valari, M.; Klimont, Z.; Medina, S.; Kinney, P. A multi-scale health impact assessment of air pollution over the 21st century. Sci. Total. Environ. 2015, 514, 439–449. [Google Scholar] [CrossRef]
- Vineis, P.; Husgafvel-Pursiainen, K. Air pollution and cancer: Biomarker studies in human populations. Carcinogenesis 2005, 26, 1846–1855. [Google Scholar] [CrossRef] [PubMed]
- Wagner, F.; Heyes, C.; Klimont, Z.; Schoepp, W. The GAINS Optimization Module: Identifying Cost-Effective Measures for Improving Air Quality and Short-Term Climate Forcing; International Institute for Applied Systems Analysis: Laxenburg, Austria, 2013. [Google Scholar]
- Weichenthal, S.; Villeneuve, P.J.; Burnett, R.T.; Van Donkelaar, A.; Martin, R.V.; Jones, R.R.; Dellavalle, C.T.; Sandler, D.P.; Ward, M.H.; Hoppin, J.A. Long-Term Exposure to Fine Particulate Matter: Association with Nonaccidental and Cardiovascular Mortality in the Agricultural Health Study Cohort. Environ. Health Perspect. 2014, 122, 609–615. [Google Scholar] [CrossRef]
- West, J.J.; Smith, S.J.; Silva, R.A.; Naik, V.; Zhang, Y.; Adelman, Z.; Fry, M.M.; Anenberg, S.C.; Horowitz, L.W.; Lamarque, J.-F. Co-benefits of mitigating global greenhouse gas emissions for future air quality and human health. Nat. Clim. Chang. 2013, 3, 885–889. [Google Scholar] [CrossRef] [PubMed]
- World Health Organization. Burden of Disease from Urban Outdoor Air Pollution for 2008. Available online: https://www.who.int/phe/health_topics/outdoorair/databases/burden_disease/en/ (accessed on 25 November 2020).
- World Health Organization. WHO Expert Meeting Methods and Tools for Assessing the Health Risks of Air Pollution at Local, National and International Level. 2014. Available online: https://www.euro.who.int/en/health-topics/environment-and-health/air-quality/publications/2014/who-expert-meeting-methods-and-tools-for-assessing-the-health-risks-of-air-pollution-at-local,-national-and-international-level (accessed on 25 November 2020).
- World Health Organization. Ambient air Pollution: A Global assessment of Exposure and Burden of Disease. 2016. Available online: https://apps.who.int/iris/bitstream/handle/10665/250141/9789241511353-eng.pdf?sequence=1&isAllowed=y (accessed on 25 November 2020).
- World Health Organization. Health Risks of Air Pollution in Europe—HRAPIE Project. New Emerging Risks to Health From Air Pollution—Results from the Survey of Experts. 2017. Available online: https://www.euro.who.int/en/health-topics/environment-and-health/air-quality/publications/2013/health-risks-of-air-pollution-in-europe-hrapie-project.-new-emerging-risks-to-health-from-air-pollution-results-from-the-survey-of-experts (accessed on 25 November 2020).
- World Health Organization. Burden of Disease from Ambient Air Pollution for 2016 Description of Method; WHO: Geneva, Switzerland, 2018. [Google Scholar]
- World Health Organization. Air Pollution. Available online: https://www.who.int/health-topics/air-pollution#tab=tab_1 (accessed on 25 November 2020).
- World Health Organization. Global Health Estimates: Life Expectancy and Leading Causes of Death and Disability. 2019. Available online: https://www.who.int/data/gho/data/themes/mortality-and-global-health-estimates (accessed on 25 November 2020).
- World Health Organization. Health Risk Assessment of Air Pollution. General Principles (2016). 2017. Available online: https://www.euro.who.int/en/publications/abstracts/health-risk-assessment-of-air-pollution.-general-principles-2016 (accessed on 25 November 2020).
- World Health Organization Regional Office for Europe. Health Aspects of Air Pollution with Particulate Matter, Ozone and Nitrogen Dioxide; World Health Organization: Geneva, Switzerland, 2003. [Google Scholar]
- World Health Organization Regional Office for Europe. Air Quality Guidelines_Global Update 2005; World Health Organization: Geneva, Switzerland, 2005. [Google Scholar]
- World Health Organization Regional Office for Europe. Health Risk Assessment of air pollution_General Principles; World Health Organization: Geneva, Switzerland, 2016. [Google Scholar]
- Xie, Y.; Dai, H.; Zhang, Y.; Wu, Y.; Hanaoka, T.; Masui, T. Comparison of health and economic impacts of PM2.5 and ozone pollution in China. Environ. Int. 2019, 130, 104881. [Google Scholar] [CrossRef]
- Xu, X.; Ha, S.U.; Basnet, R. A Review of Epidemiological Research on Adverse Neurological Effects of Exposure to Ambient Air Pollution. Front. Public Health 2016, 4, 157. [Google Scholar] [CrossRef] [PubMed]
- Yin, P.; Brauer, M.; Cohen, A.; Burnett, R.T.; Liu, J.; Liu, Y.; Liang, R.; Wang, W.; Qi, J.; Wang, L.; et al. Long-term Fine Particulate Matter Exposure and Nonaccidental and Cause-specific Mortality in a Large National Cohort of Chinese Men. Environ. Health Perspect. 2017, 125, 117002. [Google Scholar] [CrossRef] [PubMed]
- Zanobetti, A.; Schwartz, J. The Effect of Fine and Coarse Particulate Air Pollution on Mortality: A National Analysis. Environ. Health Perspect. 2009, 117, 898–903. [Google Scholar] [CrossRef]
- Zhang, M.; Song, Y.; Cai, X.; Zhou, J. Economic assessment of the health effects related to particulate matter pollution in 111 Chinese cities by using economic burden of disease analysis. J. Environ. Manag. 2008, 88, 947–954. [Google Scholar] [CrossRef] [PubMed]


| Purpose of the Study | Region | Health Impacts | Ref |
|---|---|---|---|
| Evaluating the mortality impact of fine particles reduction policies and Air quality modeling in Spain. | Spain | All-cause deaths | [48] |
| Assessing the geographical spread and economic benefit of the ozone health consequences associated with climate change in the United States in 2030 | USA | Mortality and morbidity impacts related to ozone | [49] |
| Reductions of PM2.5 Air Concentrations and Premature Mortality in Japan | Japan | Mortality | [50] |
| Assessing the health-related benefits of attaining the ozone level standard | USA | Mortalities, emergency department admissions, hospitalization, restricted activity day, and school absences | [51] |
| Estimation of the national public health burden associated with exposure to atmospheric PM2.5 and ozone | USA | Reduced life years and life expectancy; and mortalities | [52] |
| Evaluation of air quality in six Indian cities to create a knowledge base for multi-pollutant pollution, dispersion modeling of ambient particulate concentrations | India | Premature mortality | [53] |
| Evaluation of the health-related economic externalities of air emissions from particular emission sources or industries that can be used to help emission reduction policy-making. | Europe | Mortality and morbidity | [54] |
| Using multi-sectoral emissions inventory to estimate health impacts in terms of premature mortality and morbidity in Delhi | Delhi, India | Premature mortality and morbidity effects | [55] |
| Health benefits from the adaptation of cleaner brick processing technologies | Dhaka, Bangladesh, | Mortality and morbidity, health cost savings | [56] |
| Study the linkages between indoor and outdoor PM in Ulaanbaatar, Mongolia | Ulaanbaatar, Mongolia | Premature deaths | [57] |
| Estimation of the citywide morbidity and mortality attributable to ambient fine particulate matter (PM2.5) and ozone in New York City | New York City, USA | Health impacts and disparities | [35] |
| Assessment of the intercontinental impact of ozone emissions on human mortality | Northern Hemisphere, North America, East Asia, South Asia, and Europe | Premature mortality | [58] |
| Estimation of the mortality impacts of 20% of anthropogenic primary PM2.5 and PM2.5 precursor emission decreases in each of the four major industrial regions (North America, Europe, East Asia, and South Asia) | Europe, East Asia, and South Asia, North America, | Premature mortality | [59] |
| Evaluation of the external health costs of air emissions in Europe and the contribution of international shipping activities | Europe | Health-related cost of Air pollution | [54] |
| Calculation of premature deaths from cardiopulmonary and lung cancer due to PM2.5 levels and the effect of reductions in black carbon emissions on surface air quality and human mortality | Global | Mortality | [60] |
| Estimation of premature air pollution-related mortalities prevented, ozone-related yield reductions of large food crops avoided and health damage avoided | Global | Mortalities, Morbidities and avoided Ozone-related reduction of yield of major food crops. | [61] |
| Estimating the global and national health burden of atmospheric PM2.5 pollution due to surface transport emissions. | Global | Mortality | [62] |
| Pollutant | Indicator | Interim Target-1 | Interim Target-2 | Interim Target-3 | Air Quality Guideline (AQG) | |
|---|---|---|---|---|---|---|
| PM2.5 | annual mean | 10 μg/m3 | 35 | 25 | 15 | 10 |
| 24-h mean | 25 μg/m3 | 75 | 50 | 37.5 | 25 | |
| PM10 | annual mean | 20 μg/m3 | 70 | 50 | 30 | 20 |
| 24-h mean | 50 μg/m3 | 150 | 100 | 75 | 50 | |
| O3 | 8-h mean | 100 μg/m3- | 160 | - | - | 100 |
| NO2 | annual mean | 40 μg/m3 | - | - | - | - |
| 1-h mean | 200 μg/m3 | - | - | - | - | |
| SO2 | 24-h mean | 20 μg/m3 | 125 | 50 | - | 20 |
| 10-min mean | 500 μg/m3 | - | - | - | 500 | |
| Category | Methodology | Advantage | Disadvantages |
|---|---|---|---|
| Short-term exposure | Time-series studies: using the statistical model to estimate the influence of temporal (usually daily) changes of air pollutant concentrations on daily health incidence in the population exposed. |
|
|
| Case-crossover studies: studying the risk of an acute health case after momentary exposure. |
|
| |
| Panel studies: assessing the respiratory diseases associated with air pollution among susceptible subgroups. |
|
| |
| Long-term exposure | Cohort studies: examining the risk of health endpoints attributed to long-term pollution exposure. |
|
|
| Functional Form | Formula of CRFs | |
|---|---|---|
| Linear function | ||
| Log-linear function | ||
| Logistic function |
| Tool | Developer | Study Area | Reference |
|---|---|---|---|
| Environmental Benefits Mapping and Analysis Program—Community Edition (BenMap-CE) | The United States Environmental Protection Agency (EPA) | USA, Turkey, Spain | [46,48,109,110] |
| Greenhouse gas—Air pollution Interactions and Synergies (GAINS) model | International Institute for Applied Systems Analysis (IIASA) | Europe | [47,111,112] |
| CO-Benefits Risk Assessment (COBRA) Health Impacts Screening and Mapping Tool | The United States Environmental Protection Agency (EPA) | USA | [113,114,115] |
| Air Quality (Air Q+) | World Health Organization (WHO) | Iran, Italy | [116,117,118,119] |
| Air Q+ and BenMAP-CE | EPA and WHO | USA | [120] |
| The Simple Interactive Model for better Air quality (SIM-air) | Urban Emissions | India, Europe | [53,121,122] |
| Household Air Pollution Intervention Tool (HAPIT) | Household Energy, Climate, and Health Research Group at the University of California, Berkeley | India | [123,124,125] |
| Ecosense | Institute of Energy Economics and Rational Energy Use (IER), University of Stuttgart | Greece France, Brazil | [126,127,128] |
| TM5- FASST | JRC Ispra (Italy) | China, Multinational study | [30,129] |
| Aphekom | French Institute of Public Health Surveillance | 25 European cities, 10 European cities | [130,131,132] |
| Characteristic | AIRQ2.2 | BenMAP-CE | COBRA | HAPIT | SIM-Air | GAINS | EcoSense |
|---|---|---|---|---|---|---|---|
| Health Impacts | |||||||
| Mortality (cases) | √ | √ | √ | √ | √ | √ | √ |
| Disability-adjusted life years (DALY) | √ | √ | √ | √ | √ | √ | |
| Morbidity (cases) | √ | √ | √ | √ | √ | √ | |
| Economic Impacts | √ | √ | √ | √ | √ | ||
| Pollutants: | |||||||
| PM2.5 | √ | √ | √ | √ | √ | √ | √ |
| PM10 | √ | √ | √ | √ | √ | ||
| Ozone | √ | √ | √ | √ | |||
| NO2 | √ | √ | √ | √ | √ | ||
| SO2 | √ | √ | √ | √ | √ | ||
| CO | √ | √ | √ | √ | |||
| Other | Black smoke | VOC | CO2, VOC, CH4, N2O | Hydrocarbons, dioxins and heavy metals | |||
| Spatial Resolution | |||||||
| Regional | √ | √ | √ | √ | √ | ||
| National | √ | √ | √ | √ | |||
| City-level | √ | √ | √ | √ | |||
| Household/Indoor | √ | √ | √ | √ | |||
| Tool | Strength | Weakness | Opportunities | Threats |
|---|---|---|---|---|
| AirQ+ |
| Evidence-based health outcome relationships are not strong, especially with the air pollutants like NO2, BC (Black Carbon), and long-term ozone exposure. | There is an opportunity to refine further the spatial resolution in the analysis carried out with AirQ+ and integrate new user-friendly features like additional explanations for input data and components to calculate economic impacts and DALYs. | Often unrefined spatial resolution in the analysis is carried out with AirQ+, which may cover a whole country or city’s spatial domain [120]. |
| COBRA |
|
| Currently, COBRA has baseline data, which is only appropriate for the USA. There is an opportunity to add baseline data to make it suitable for regional or global HIA studies. The tool needs to continue to evolve and integrate the functionality and improve the sophistication of analysis. |
|
| BenMAP—CE | Merging the CFRs with basic pooling strategies (e.g., random effects and fixed effects) to construct a new function that can adequately consider the diverse demographics data. |
| Incorporating new features into the tool, such as the estimate of the health impacts due to the exposure to multiple pollutants [120]. | Spatial shifts in city-wide environmental concentrations, diverse sets of individual activity patterns, and indoor ambient air pollution differences [142]. |
| HAPIT |
|
| To decrease the uncertainty in the results, information about the baseline and intervention PM2.5 exposure levels should be included for the developing countries where solid fuel is mostly used. | Background diseases and economic characteristics of a population are assumed to remain relatively unchanged in HAPIT. This presumption will hold for a short life-span. Therefore, for long-term interventions, such as shifting from fossil fuel to renewable energy or electricity, the forecasts will have to be periodically updated. |
| GAINS | Compressive Transport models and atmospheric chemistry to simulate complex physical and chemical reactions [140]. |
|
| Other models that focus on emission estimation or health impact assessment separately can provide more precise results and, if combined, would be a better alternative option than GAINS. |
| ECOSENSE |
| Considering a simple linear source-receptor model for assessing the atmospheric chemistry interactions that perform a nonlinear behavior in nature [107,128]). | Validation of the meteorological models used in the EcoSense tool to make it more appropriate for the developing countries by reviewing the meteorological databases and concentration-response functions. |
|
| SIM-AIR | Multiple benefits (Environmental—health—economic) assessment of the climate change action plans, considering interactions between emissions, dispersion of pollution, impacts, and options for management [53,137]. | Uncertainty in spatial analysis resolution matching the project (mainly urban areas). | For the study of pollution inventories and health effects, the database of concentration-response functions and emission sources is included in the tools that can be modified with relevant data from cities. | Recognizing the uncertainty of inventories is important and needs to be adjusted carefully as per the local data. |
Publisher’s Note: MDPI stays neutral with regard to jurisdictional claims in published maps and institutional affiliations. |
© 2021 by the authors. Licensee MDPI, Basel, Switzerland. This article is an open access article distributed under the terms and conditions of the Creative Commons Attribution (CC BY) license (http://creativecommons.org/licenses/by/4.0/).
Share and Cite
Hassan Bhat, T.; Jiawen, G.; Farzaneh, H. Air Pollution Health Risk Assessment (AP-HRA), Principles and Applications. Int. J. Environ. Res. Public Health 2021, 18, 1935. https://doi.org/10.3390/ijerph18041935
Hassan Bhat T, Jiawen G, Farzaneh H. Air Pollution Health Risk Assessment (AP-HRA), Principles and Applications. International Journal of Environmental Research and Public Health. 2021; 18(4):1935. https://doi.org/10.3390/ijerph18041935
Chicago/Turabian StyleHassan Bhat, Tavoos, Guo Jiawen, and Hooman Farzaneh. 2021. "Air Pollution Health Risk Assessment (AP-HRA), Principles and Applications" International Journal of Environmental Research and Public Health 18, no. 4: 1935. https://doi.org/10.3390/ijerph18041935
APA StyleHassan Bhat, T., Jiawen, G., & Farzaneh, H. (2021). Air Pollution Health Risk Assessment (AP-HRA), Principles and Applications. International Journal of Environmental Research and Public Health, 18(4), 1935. https://doi.org/10.3390/ijerph18041935