1. Introduction
Schools are the places where children spend most of their time during their childhood other than their homes. Children are more vulnerable to adverse indoor environmental quality (IEQ) due to having a more rapid breathing rate when compared to adults, and also to their still-growing body and still-developing organs. Teachers, parents, school officials, and researchers are becoming more aware of the importance of classroom indoor air quality (IAQ) and thermal comfort (TC) especially as it pertains to children. Absenteeism rates (or attendance rates), is one of the major issues with which parents and school officials are concerned. Previous studies recognized this issue and suggested more consistent and well-designed research studies to investigate the association between absenteeism and classroom IAQ/TC. This is because “strong study design, including the best available measurements of exposure and human outcomes, are both feasible and necessary for good IEQ research” [
1,
2].
Previous researchers sought to associate the school absenteeism with IAQ and TC [
3,
4,
5]. Few included multiple environmental factors of classroom IAQ and TC, and even fewer considered the contribution from seasonal variations.
Heating and non-heating seasons were based on the operation status of Heating, Ventilation, and Air-conditioning (HVAC) systems, and the building indoor conditions were majorly influenced by the principle differences of the system operating in heating season comparing to the system of non-heating seasons, according to the ASHRAE Handbook of Fundamentals [
6]. First, the characteristics of the primary air from the diffusers were different, such as volumetric flow rates (due to different heating and non-heating load calculation), supply air velocity, set-points for supply air temperature, etc. Second, air diffusion patterns from diffusers were different, for rooms with a ceiling supply, the supply air dropped quickly to the floor during non-heating and remains at (or rises to) ceiling level for a longer period during the heating season. Third, the directions of natural convection between the mixing zones and stagnant zones (if any) were different as hot air rises and cool air sinks. Finally, the general room air flow patterns are also influenced by the temperature of the exterior surface and infiltration (or exfiltration).
Thus, to examine the different influence between IAQ/TC of classroom with illness-related absenteeism (IRA) between heating and non-heating seasons, the research team performed this study in the Midwestern United States. The research team hypothesized that classroom IAQ and TC might influence the students’ IRA, and the seasonal variation (between heating or non-heating) of such influences should clearly be observed. Since the “seasons” defined in this study was from the different operation modes of HVAC system, a naturally ventilated classroom without HVAC system was not discussed.
2. Materials and Methods
Schools districts of the Midwest United States, were included in the study. Various IAQ and TC metrics of classrooms were collected from the participating schools. Measurement campaigns, were carried out three times per year, two consecutive days per classroom visit, for each classroom for classroom IAQ and TC factors. The daily IRA and demographic data of students were also collected. A Negative Binomial (NB) statistical model was structured to estimate the association between independent (classroom IAQ and TC factors) and dependent (students’ IRA) variables.
2.1. Classroom Selection and Student Data
The research team reached out the school districts from two Midwest metropolitan areas to participant this study during the 2015–2016 school year. The biggest school district of each area was invited, if declined, the second biggest district was invited. In each school district, data was collected from 3rd and 5th grade classrooms of elementary school. Up to three classrooms of each grade. All engaged schools were located in Climate Zone 5A, which was defined as “Cold climate zone” by the Department of Energy [
7].
The school districts provided daily absence counts associated with the students in the selected classrooms and the clarification (reason) for the absence. The absence related to the illness (IRA, based on the reason, despite the kinds of illness) were used in this study. The IRA indicated the total count of absence during a certain period. Demographic information of students was also collected to better describe the population of the students in the participating schools.
2.2. Environmental Data
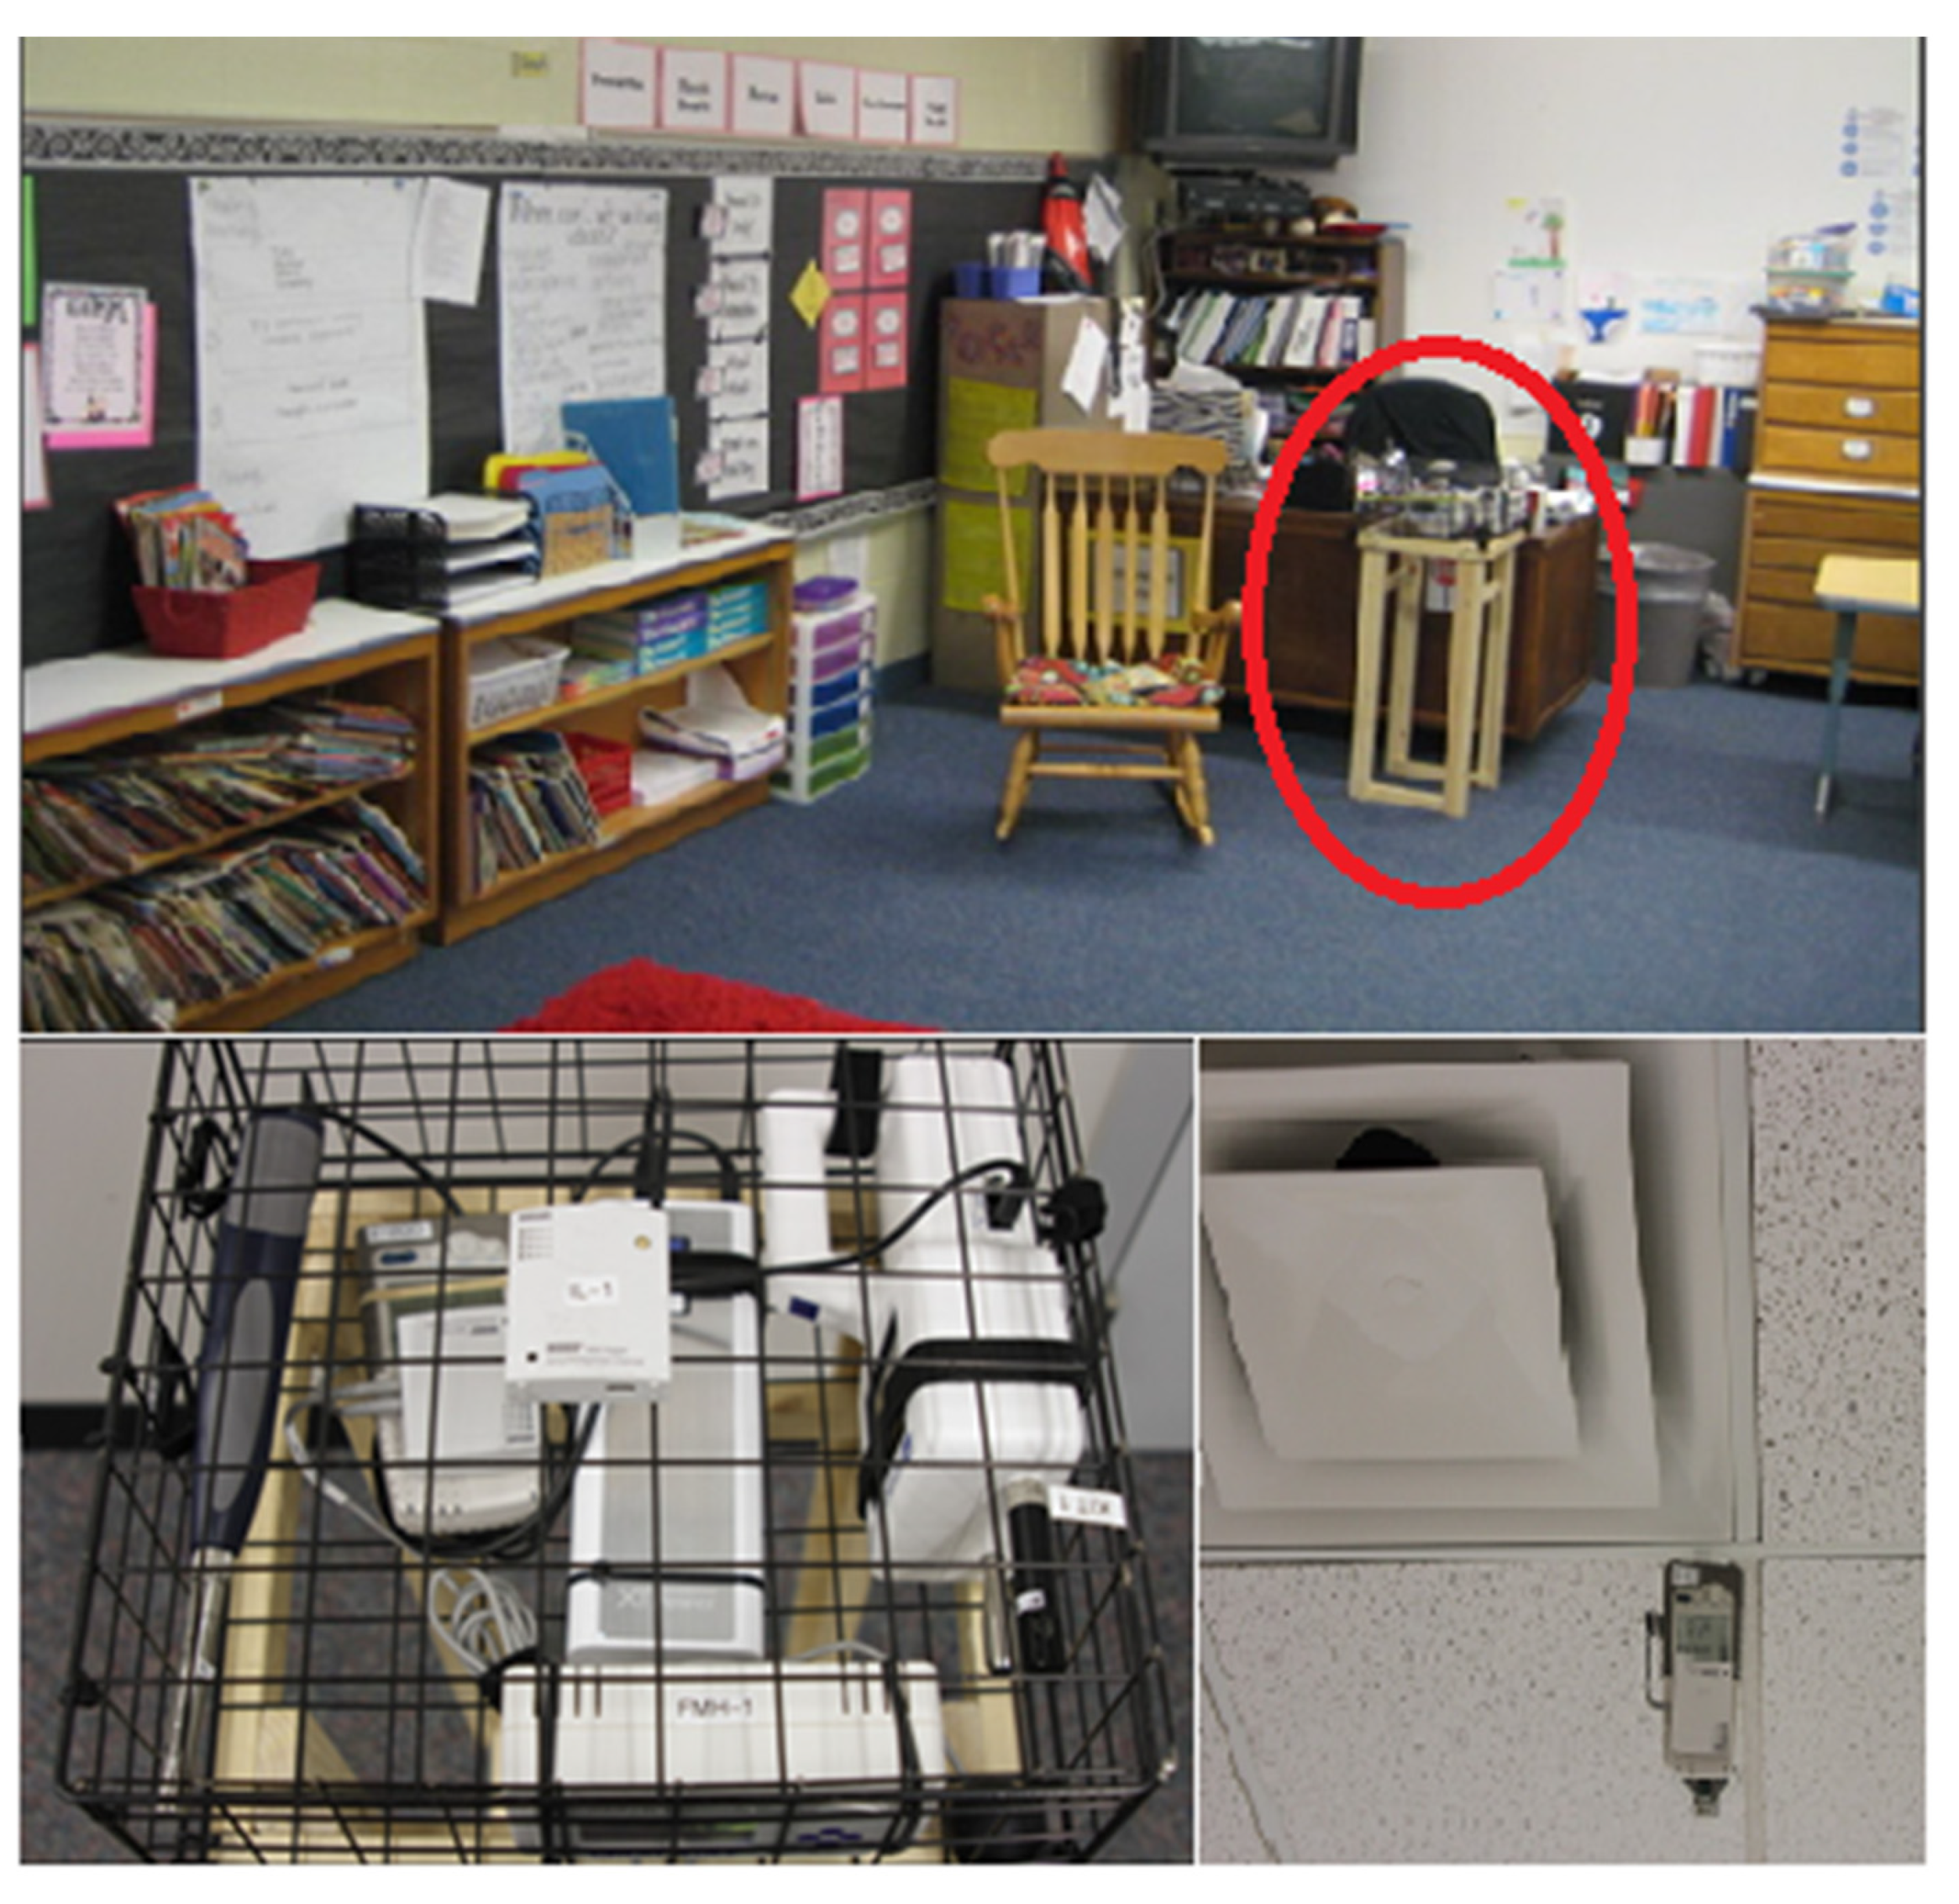
In each of the classrooms, a list of IAQ and TC data was collected. The list included measurements of the concentration of indoor carbon dioxide (CO2), formaldehyde (HCHO), the count of particulate matter (PN) with aerosol diameters ranging from 0.3 μm to 2.5 μm, air temperature (T), relative humidity (RH), and globe temperature (GT). Various measurement meters were used to collect different environmental data. Custom-built hanging kits and a special housing were used for each classroom to ensure the sensors safely hung from the ceiling and to provide a secure place for sensors at breathing height. The housings were tested for barriers to air movement and to ensure they were out of reach of the students. Four absorption infrared CO2 m (the Telaire 7001 by GE Sensing), which had a display resolution of 1 ppm with accuracy of 50 ppm or 5% of the reading (whichever is greater) and detecting range of 0–5000 ppm, were deployed to each classroom. The four CO2 m were attached to different locations to represent the supply, return, room averaged, and outdoor concentration of carbon dioxide. The formaldehyde monitor was placed in the special housing (the FM 801 by ShinYei/GrayWolf) and utilized photometric technology and continuously reported the formaldehyde (HCHO) concentration every 30 min. The formaldehyde monitor had a resolution of 1 ppb, tested a 10% accuracy at 40, 80, and 160 ppb, with a range from 10 ppb to 1000 ppb. The optical particle counter (the Handheld 3016 by Lighthouse Worldwide Solutions) had six measuring channels, ranging from 0.3 micrometers (μm) to 10 micrometers. The six channels are 0.3, 0.5, 1.0, 2.5, 5.0, and 10.0 μm. The particulate matters were grouped into PN2.5 (with particles had a diameter less than 2.5 μm). T and RH were collected by the sensors installed inside of the HOBO data logger (the HOBO U12-012 by Onset). The temperature sensor had a resolution of 0.03 °C, an accuracy of 0.35 °C from 0 °C to 50 °C. The humidity sensor had a resolution of 0.05% RH, with an accuracy typically 2.5% from 10% to 90% RH, to a maximum of 3.5% RH including hysteresis at 25 °C. In total four HOBO data logger were implied to each of the classroom and placed as the same manner as the four CO2 m. The GT used a thermocouple (the TMC6-HD by Onset), which had an accuracy of 0.25 °C within 0 °C to 50 °C, and a resolution of 0.03 °C at 20 °C and placed inside of a black coated globe (with diameter 40 mm) and connected to the HOBO data logger, was placed to the special housing for each classroom.
The data measurement logged data from each classroom for approximately two days, starting from approximately 7:00 a.m. On day one, and ending at approximately 5:30 p.m. on day two. The measurement was repeated three times during the academic year. For the details of the measurement of environmental data, please referring to the
Figure 1 and the previous published article by the research team [
8].
2.3. Heating and Non-Heating Seasons
The heating and non-heating seasons were defined based on the operation status of the HVAC system in each classroom. When the HVAC system was providing heating to the classroom, the days were defined as the heating season. Otherwise, the days were defined as the non-heating season. The heating degree days (HDDs) were calculated based on local weather data and the fact that the school districts sought to maintain an average indoor temperature of 21 °C. The calculated HDDs were used to determine the operation model of HVAC system. Then the heating season was refined based on the measured temperature data. In total, three data loggers were deployed to measure the air temperature at different locations of each classroom. Two of the loggers were attached to the supply air diffuser and return air grill, accordingly. Thus, the temperature difference between the supply and return air was used to confirm the operation status of the HVAC system.
2.4. Data Collection and Analysis
The research team collected the continuous data from the two-day period in the occupied measurement plan. However, the research team had chosen the data during the occupied hours only as to develop the analytical model. The occupied hours were defined as the time between the start time of the first class and the end time of the last class of each school day. Thus, the averaged values presented in this paper should better represent the actual exposure that the students and teachers were experienced during their school days.
The research team estimated the ventilation rate (VR) based on the indoor CO2 concentration, converted the PN to the mass concentration of particulate matter (PM), converted the RH to absolute humidity (AH).
The equilibrium CO2 analysis approach, which adopted from the ASTM D 6245—12 Standard was used in this study to estimate the indoor ventilation rate. The equilibrium indoor CO2 concentration was defined as the 95th percentile of the 15-min moving averaged CO2 concentration during the occupied hours. The estimation used the 0.0043 L/s per 3rd and 5th grade students and 0.0051 L/s per adult, and used the actual number of students in each classroom which provided by the school districts plus one adult (teacher) per classroom.
In addition, in this study, the optical counts of particulate matter, PN2.5, were converted into mass concentration, PM2.5 (mass concentration of particles that had a diameter less than 2.5 μm) by using sphere mass calculation equation, and by using the centroid of the distribution of each of the six size channels as the mass mean diameters [
9]. The conversion used the 1.65 g/cm
3 as the assumed averaged density of PM2.5, which was adopted from reference [
10].
The research team used SPSS (IBM SPSS Statistics 22, Armonk, NY, USA) to perform the data analysis. First, the descriptive statistics were generated for all IAQ and TC metrics from participating schools. The descriptive statistics and paired sample
T test were reported on the primary outcome variable (Illness-related absenteeism—IRA) during both heating and non-heating seasons. The daily IRA are count data and highly skewed [
11]. The normality test was performed on the daily IRA and confirmed the non-normality of the distribution. Thus, a negative binomial (NB) model was selected. Poisson regression was also considered during the analysis process, as it is a usual way to analyze this type of count data. However, over-dispersion of the data distribution suggested the final selection of the NB model.
The results of the negative binomial model used the incidence rate ratios (IRR) to estimate the effects. IRR can suggest that for a one-unit increase of the IAQ or TC variables, the IRA is expected to increase (or decrease if the IRR is less than 1) by a factor of IRR. Ordinary least squares regression and Poisson regression were used to validate the results of the NB model.
3. Results
In total, 85 classrooms, from 21 elementary of two Midwestern United States school districts (District A and B) were participated in this study. Eleven elementary schools in District A and ten elementary schools in District B were engaged. All engaged classrooms were mechanically ventilated with no operable exterior windows or exterior doors. The descriptive statistics are contained in
Table 1.
3.1. Environmental Data
Table 2 presents the descriptive information of the IAQ and TC that were directly collected from each of the classrooms. All the variables are averaged through the occupied hours for each visit and grouped by different seasons (heating or non-heating). Mean, 25th, 50th, 75th, and 95th percentiles were included to indicate the distribution of each variable. Extreme cases, which are defined as outliers and detected based on the interquartile range rule, are excluded from the model.
3.2. Model Results
The results of the NB model are shown in
Table 3. The IRR was reported for the association of IAQ and TC factors with IRA. The IRR is described as the relative difference between the incidence rates of events. An IRR value of less than 1.000 indicated the decreased IRA was associated with a multiple-unit increase of IAQ and TC factors, vice versa.
The count of indoor particles, PN2.5 to be more exact, was associated with IRA only during the non-heating season. The predicted increase of the IRA is 3% for each additional 1,000,000-counts/L increase of PN2.5. The association between PM2.5 and IRA had similar trend, but only marginally significant on statistical analysis.
Indoor CO2 concentration was significantly associated with IRA during the heating season only, with a 100 ppm increase in the CO2 concentration, the expected increase of IRA is 3%.
4. Discussion
The IAQ and TC conditions of 85 classrooms were collected from schools of the Midwestern United States. The interested variables, which averaged during the occupied hours, were compared to the IRA of students from the third and fifth grades.
4.1. Primary Findings
In this study, the results indicated that to potentially reduce the IRA in the elementary classrooms by controlling the classroom IAQ and TC, the targeting environmental factors in the heating season were different than those in the non-heating season. On the other word, the operating mode of HVAC systems might significantly influence the IRA of elementary students.
4.1.1. Ventilation Rate and Indoor CO2 Concentration
The ventilation rate (estimated based on the indoor CO
2 concentration) was significantly associated with student absenteeism in several previous studies. Shendell [
4] reported annually averaged absenteeism of 434 U.S. classrooms in 22 schools in the states of Washington and Idaho in the U.S. The relative decrease in absenteeism was 2.1–7.6% when associated with a 1 L/s·person increase of VR. Another comprehensive study which continuously measured the VR of the classroom for a two-year period also reported a 1–1.5% relative decrease of IRA with each additional 1 L/s·person VR [
12]. A UK study of 60 naturally ventilated classrooms reported a 100 ppm increase of indoor CO
2 concentrations, when compared to outdoors, and was associated with 0.2% decrease of annual attendance [
5]. A 100-ppm difference in CO
2 concentration can be translated to VR, which is about 0.48 L/s·person.
Compared to the findings this study, only the heating season showed a significant association which a 3% increase in absenteeism was expected with every additional 100 ppm of CO2 concentration. In the meantime, the VR did not show a similar association with IRA as the CO2 concentration during the heating season. This new evidence may suggest that, even the indoor ventilation rate was usually estimated based on the indoor CO2 concentration, these two factors were not necessary tell the same story. The estimated ventilation rate in this study was based on the equilibrium CO2 concentration, which represented the near-peak steady-state condition of CO2. Thus, the operational statuses of the HVAC systems and the seasons (i.e., whether it is heating or non-heating) might significantly affect the associations and conclusions from the previous studies based on the annual data (or the data from one season).
Noted that a greater VR is associated with increased academic performance, regardless of the seasons [
5,
13,
14]. Thus, the future studies that intent to understand the relation between classroom ventilation rate and academic performance, where considering the student absenteeism as mediator in between, might include the seasonal variation in their equation.
4.1.2. Indoor Particulate Matters
Many prior studies significantly associated the absenteeism of schools with particulate matters in ambient air [
15,
16,
17]. However, few studies had examined the association between absenteeism of schools and indoor particles. A longitudinal study associated the indoor particles with absenteeism in two daycare centers founded the reduced concentration of small particles was significantly associated with decreased absenteeism [
18].
In current study, PN2.5 was significantly associated with illness-related absenteeism during the non-heating season only, while the PM2.5, which calculated based on the PN2.5, shown only marginally significant association for the same season. The results firstly indicated that the indoor particles might adversely influence the student health (which represented by the illness-related absenteeism of students). However, the difference of associations to health between PN2.5 and PM2.5 potentially suggested that even a small level of mass concentration of indoor particles could significantly influence student health. This potentially suggested that controlling the pathogens infection process, which using the indoor particles as carrier, traveling from one student to another, and resulting a healthy student got disease and absence from school, is still a significant benefit of removing the indoor particles even the indoor particulate matters’ mass concentration is relatively low.
The VR is neither correlated with PN2.5 nor significantly associated with IRA, indicating that the association between PN2.5 and IRA might not be mediated by the association between VR and IRA.
4.2. Potential Findings-Air Temperature, Relative Humidity, Absolute Humidity, and Indoor Formaldehyde
Several marginally association were observed in this study between IAQ/TC variables with IRA. Significant associations might be observed in future studies if the sample size were increased or studies performed in other locations. Thus, the following discussion might be considered as the supplementary to previous significant finds.
The relative humidity (RH) is an environmental factor which considered as combination of the actual moisture content (or AH) and the air temperature (T). Both AH and T were marginally associated with IRA during non-heating season, however, the RH in the current study has a less significant association with IRA. In an early Canadian study, a statistically significant correlation was observed between school absenteeism and relative humidity [
19]. Other than this, there were other studies that either without a significant association between the humidity and absenteeism [
20] or, with the small sample size, failed to reach a more general finding [
21,
22]. The Canadian study recruited 12 schools located in a colder and drier climate zone with a longer winter comparing to the schools in this current study. This difference might indicate that the importance of classroom air temperature and humidity increase for locations with server cold and dry weather.
In this study, formaldehyde was innovated examined in elementary classroom and associated with illness-related absenteeism. Unfortunately, only marginal association was observed between indoor formaldehyde and IRA during non-heating season. Air temperature and moisture content were identified as influencing factors for the emission rate of formaldehyde [
23]; thus, the marginal association might be explained by the correlation among formaldehyde concentration, air temperature, relative humidity, and absolute humidity. Thus, future studies either with expanded sample size or with causal path analysis between formaldehyde and student health were required for formaldehyde-health research.
4.3. Strengths, Limitations, and Other Thinkings
The strengths of this study are a wide variety of IAQ and TC factors from these elementary classrooms, student absenteeism data grouped based on “sickness vs. non-sickness”, a relatively large number of classrooms in the Midwestern United States, repeated (three-times) measurements of the IAQ and TC factors, and the seasonal data of heating and non-heating. The findings could potentially apply to many other similar classrooms in the same climate region. Unlike many previous studies, their discussion and conclusion were depended on the subjective data from the occupants’ surveys based on the perceived IAQ and TC conditions. Our study collected many objective data with the scientific grade and “state of the art” instruments. About the detailed discussion of the environmental data itself (IAQ and TC factors), please refer to the previous published article by the research team.
However, the research team also recognized that there are some limitations in the study. Firstly, the current study only included classrooms at the elementary level. We understood that these elementary classrooms followed a more predictable schedule and a constant class-enrollment when compared to those in secondary education classrooms. Thus, the current conclusions about the adverse association of IAQ and TC conditions and student’s absenteeism may only apply to the elementary classrooms. As in any observational study, we are not allowed to make any causality statement. In addition, the findings presented in this paper were only applicable to the classrooms of similar demographics and similar climate regions with comparable ranges of IAQ and TC conditions.
Another limitation was that, due to the privacy nature of the student’s data, the absenteeism data provided by the school districts were very restricted. The school districts only provided the research team with the daily absence count and primarily two types of absenteeism (sickness or non-sickness), The research team has no ability to further access the students’ absenteeism data, such as the diagnosis of the illness or the structure of the student’s family.
Although the key objective of this paper is to address the difference between heating and non-heating seasons associated the IAQ and TC factors and their associations with the IRA of the students, the demographic data were also collected to describe the student populations at the schools. In this paper, the research team did not include this in the model yet since we do not expect that the demographic data within the same school would vary much among heating and non-heating seasons within the same academic year.
The intention of the study is to include as many IAQ and TC variables as possible and to repeat the measurements during heating and non-heating seasons as much as possible. However, due to the limitations of budget and time resources, the occupied measurements were implemented three times in the academic year, with continuous measurement over each two-day visit for each classroom. With 255 classroom visits over the duration of the study, the research team attempted to capture the anticipated seasonal variation for the closest approximation possible. A longer-duration (such as week-long) and continuous sampling (even daily—365 days) were desirable for this type of classroom environmental monitoring in the future.
5. Conclusions
Based on this study, during non-heating season, a 3% increase of illness-related absenteeism was estimated with 1,000,000-counts/L increase of particles that had a diameter less than 2.5 μm (PN2.5); during the heating season, a 3% increase of illness-related absenteeism were expected with 100 ppm increase of room averaged CO2 concentration; and these results suggested that the indoor air quality and thermal condition factors could associated with absenteeism related to illness differently between heating and non-heating seasons.
In the studied classrooms, majority (around 80%) were under-ventilated (by 6.5 L/s·person as compared to the suggested value from the ASHRAE Standard 62.1-2010), absenteeism were associated to the elevated CO2 concentration in the heating session but not in the non-heating season. Therefore, it is suggested to carried out an experimental study to validate the causal relationships between the classroom indoor air quality/thermal conditions the absenteeism of the students in a more controlled setting, the impacts from CO2 concentrations and concentrations of indoor fine particle should firstly be considered. In addition, since the associations of indoor air quality and thermal comfort factors with illness-related absenteeism in elementary classrooms differs with heating and non-heating seasons, the seasonal (multiple) visits are suggested in all future studies.
Author Contributions
Formal analysis, S.D.; writing—original draft preparation, S.D.; writing—review and editing, J.L.; visualization, B.Z.; project administration, J.L.; funding acquisition, J.L. and S.D. All authors have read and agreed to the published version of the manuscript.
Funding
This research was mainly supported by the United States Environmental Protection Agency under grant NO. R835633; and was partially supported by supported by Yunnan Fundamental Research Projects (grant NO. 202001AU070034). The minor funding source was used in the data analysis and visualization.
Institutional Review Board Statement
Not applicable.
Informed Consent Statement
Not applicable.
Acknowledgments
The authors want to give their deepest appreciation to the students from the University of Nebraska-Lincoln involved for their excellent work on data collection: Laura Brill, Michael Kuhlenengel, Maz Alriyami, Sultan Alruzaiqi, Jay Bliefnick, Brenna Boyd, Madeline Davidson, Nick Garaycochea, Arpan Guha, Grady Henrichs, Ian Hough, Joonhee Lee, Mycah Suddarth, Tyler Apgar, Jordan Blayney, Anna Catton, Sarah Drummey, Zhangwei Liu, Brooke Scherer, Jennifer Solheim, and Trevor Steinkruger. The authors wish to thank James Bovaird and Houston Lester for the advice on the statistical analysis. The authors wish to thank Kelly Johnson for proofreading the manuscript. The authors wish to thank Lily Wang and Clarence Waters for their excellent work on project management and community outreach. The authors also thank the school districts, schools, teachers, administrative staff, custodians, and students who made this study possible. The minor funding source was used in the data analysis and visualization.
Conflicts of Interest
The authors declare no conflict of interest.
References
- Mendell, M.J.; Heath, G.A. Do indoor pollutants and thermal conditions in schools influence student performance? A critical review of the literature. Indoor Air 2005, 15, 27–52. [Google Scholar] [CrossRef] [PubMed]
- Daisey, J.M.; Angell, W.J.; Apte, M.G. Indoor air quality, ventilation and health symptoms in schools: An analysis of existing information. Indoor Air 2003, 13, 53–64. [Google Scholar] [CrossRef] [PubMed]
- Mendell, M.J.; Eliseeva, E.A.; Davies, M.M.; Spears, M.; Lobscheid, A.; Fisk, W.J.; Apte, M.G. Association of classroom ventilation with reduced illness absence: A prospective study in California elementary schools. Indoor Air 2013, 23, 515–528. [Google Scholar] [CrossRef] [PubMed]
- Shendell, D.G.; Prill, R.; Fisk, W.J.; Apte, M.G.; Blake, D.; Faulkner, D. Associations between classroom CO2 concentrations and student attendance in Washington and Idaho. Indoor Air 2004, 14, 333–341. [Google Scholar] [CrossRef] [PubMed]
- Gaihre, S.; Semple, S.; Miller, J.; Fielding, S.; Turner, S. Classroom carbon dioxide concentration, school attendance, and educational attainment. J. Sch. Health 2014, 84, 569–574. [Google Scholar] [CrossRef] [PubMed]
- ASHRAE ASHRAE Handbook-Fundamentals. ASHRAE Handbook-Fundamentals; ASHRAE: Atlanta, GA, USA, 2009; Volume 21.1–21.67. [Google Scholar]
- Thornton, B.A.; Wang, W.; Lane, M.D.; Rosenberg, M.I.; Liu, B. Technical Support. Document: 50% Energy Savings Design Technology Packages for Medium Office Buildings; Pacific Northwest National Laboratory: RIchland, WA, USA, 2009. [Google Scholar]
- Deng, S.; Lau, J. Seasonal variations of indoor air quality and thermal conditions and their correlations in 220 classrooms in the Midwestern United States. Build. Environ. 2019, 157, 79–88. [Google Scholar] [CrossRef]
- Heinsohn, R.J.; Cimbala, J.M. Indoor Air Quality Engineering; CRC Press: Boca Raton, FL, USA, 2003. [Google Scholar]
- Tittarelli, A.; Borgini, A.; Bertoldi, M.; Desaeger, E.; Ruprecht, A.; Stefanoni, R.; Tagliabue, G.; Contiero, P.; Crosignani, P. Estimation of particle mass concentration in ambient air using a particle counter. Atmos. Environ. 2008, 42, 8543–8548. [Google Scholar] [CrossRef]
- Gardner, W.; Mulvey, E.P.; Shaw, E.C. Regression analyses of counts and rates: Poisson, overdispersed poisson, and negative binomial models. Psychol. Bull. 1995, 118, 392–404. [Google Scholar] [CrossRef] [PubMed]
- Mendell, M.J.; Eliseeva, E.A.; Davies, M.M.; Lobscheid, A. Do classroom ventilation rates in California elementary schools influence standardized test scores? Results from a prospective study. Indoor Air 2016, 26, 546–557. [Google Scholar] [CrossRef] [PubMed]
- Allen, J.G.; MacNaughton, P.; Satish, U.; Santanam, S.; Vallarino, J.; Spengler, J.D. Associations of Cognitive Function Scores with Carbon Dioxide, Ventilation, and Volatile Organic Compound Exposures in Office Workers: A Controlled Exposure Study of Green and Conventional Office Environments. Environ. Health Perspect. 2016, 124, 805–812. [Google Scholar] [CrossRef] [PubMed]
- Wargocki, P.; Wyon, D. The Effects of Outdoor Air Supply Rate and Supply Air Filter Condition in Classrooms on the Performance of Schoolwork by Children (RP-1257). HVAC&R Res. 2007, 13, 165–191. [Google Scholar]
- Gilliland, F.D.; Berhane, K.; Rappaport, E.B.; Thomas, D.C.; Avol, E.; Gauderman, W.J.; London, S.J.; Margolis, H.G.; McConnell, R.; Islam, K.T. The effects of ambient air pollution on school absenteeism due to respiratory illnesses. Epidemiology 2001, 12, 43–54. [Google Scholar] [CrossRef]
- Chen, L.; Jennison, B.L.; Yang, W.; Omaye, S.T. Elementary school absenteeism and air pollution. Inhal. Toxicol. 2000, 12, 997–1016. [Google Scholar] [PubMed]
- Park, H.; Lee, B.; Ha, E.-H.; Lee, J.-T.; Kim, H.; Hong, Y.-C. Association of air pollution with school absenteeism due to illness. Arch. Pediatr. Adolesc. Med. 2002, 156, 1235–1239. [Google Scholar] [CrossRef]
- Rosén, K.G.; Richardson, G. Would removing indoor air particulates in children’s environments reduce rate of absenteeism—A hypothesis. Sci. Total Environ. 1999, 234, 87–93. [Google Scholar] [CrossRef]
- Green, G.H. The effect of indoor relative humidity on absenteeism and colds in schools. ASHRAE Trans. 1974, 80, 131–141. [Google Scholar]
- Haverinen-Shaughnessy, U.; Shaughnessy, R.J. Effects of classroom ventilation rate and temperature on students’ test scores. PLoS ONE 2015, 10, e0136165. [Google Scholar] [CrossRef] [PubMed]
- Salleh, N.M.; Kamaruzzaman, S.N.; Sulaiman, R.; Darus, F.M. Associate Between Indoor Relative Humidity and Absenteeism at Refurbished Pre-Schools in Malaysia. Adv. Sci. Lett. 2013, 19, 2999–3003. [Google Scholar] [CrossRef]
- Iwashita, G.; Koga, T. Indoor Air Quality and Thermal Environment in Classrooms of An Elementary School During Summer Season Before/After Installing Air Conditioner. J. Environ. Eng. Trans. AIJ 2009, 74, 877–882. [Google Scholar] [CrossRef]
- Arundel, A.V.; Sterling, E.M.; Biggin, J.H.; Sterling, T.D. Indirect health effects of relative humidity in indoor environments. Environ. Health Perspect. 1986, 65, 351–361. [Google Scholar] [PubMed]
| Publisher’s Note: MDPI stays neutral with regard to jurisdictional claims in published maps and institutional affiliations. |
© 2021 by the authors. Licensee MDPI, Basel, Switzerland. This article is an open access article distributed under the terms and conditions of the Creative Commons Attribution (CC BY) license (http://creativecommons.org/licenses/by/4.0/).


