Pain Characteristics and Quality of Life in Older People at High Risk of Future Hospitalization

 ,
,  ,
,  , , and
Abstract
1. Introduction
2. Materials and Methods
2.1. Study Population
2.2. Ethical Considerations
2.3. Measures
2.3.1. Sociodemographic Factors
2.3.2. Pain Characteristics
2.3.3. Functional Status
2.3.4. Social Networks
2.3.5. Quality of Life (QoL)
2.4. Statistical Analysis
3. Results
3.1. Participant Characteristics: Social Demographics, Functional Status, and Social Network
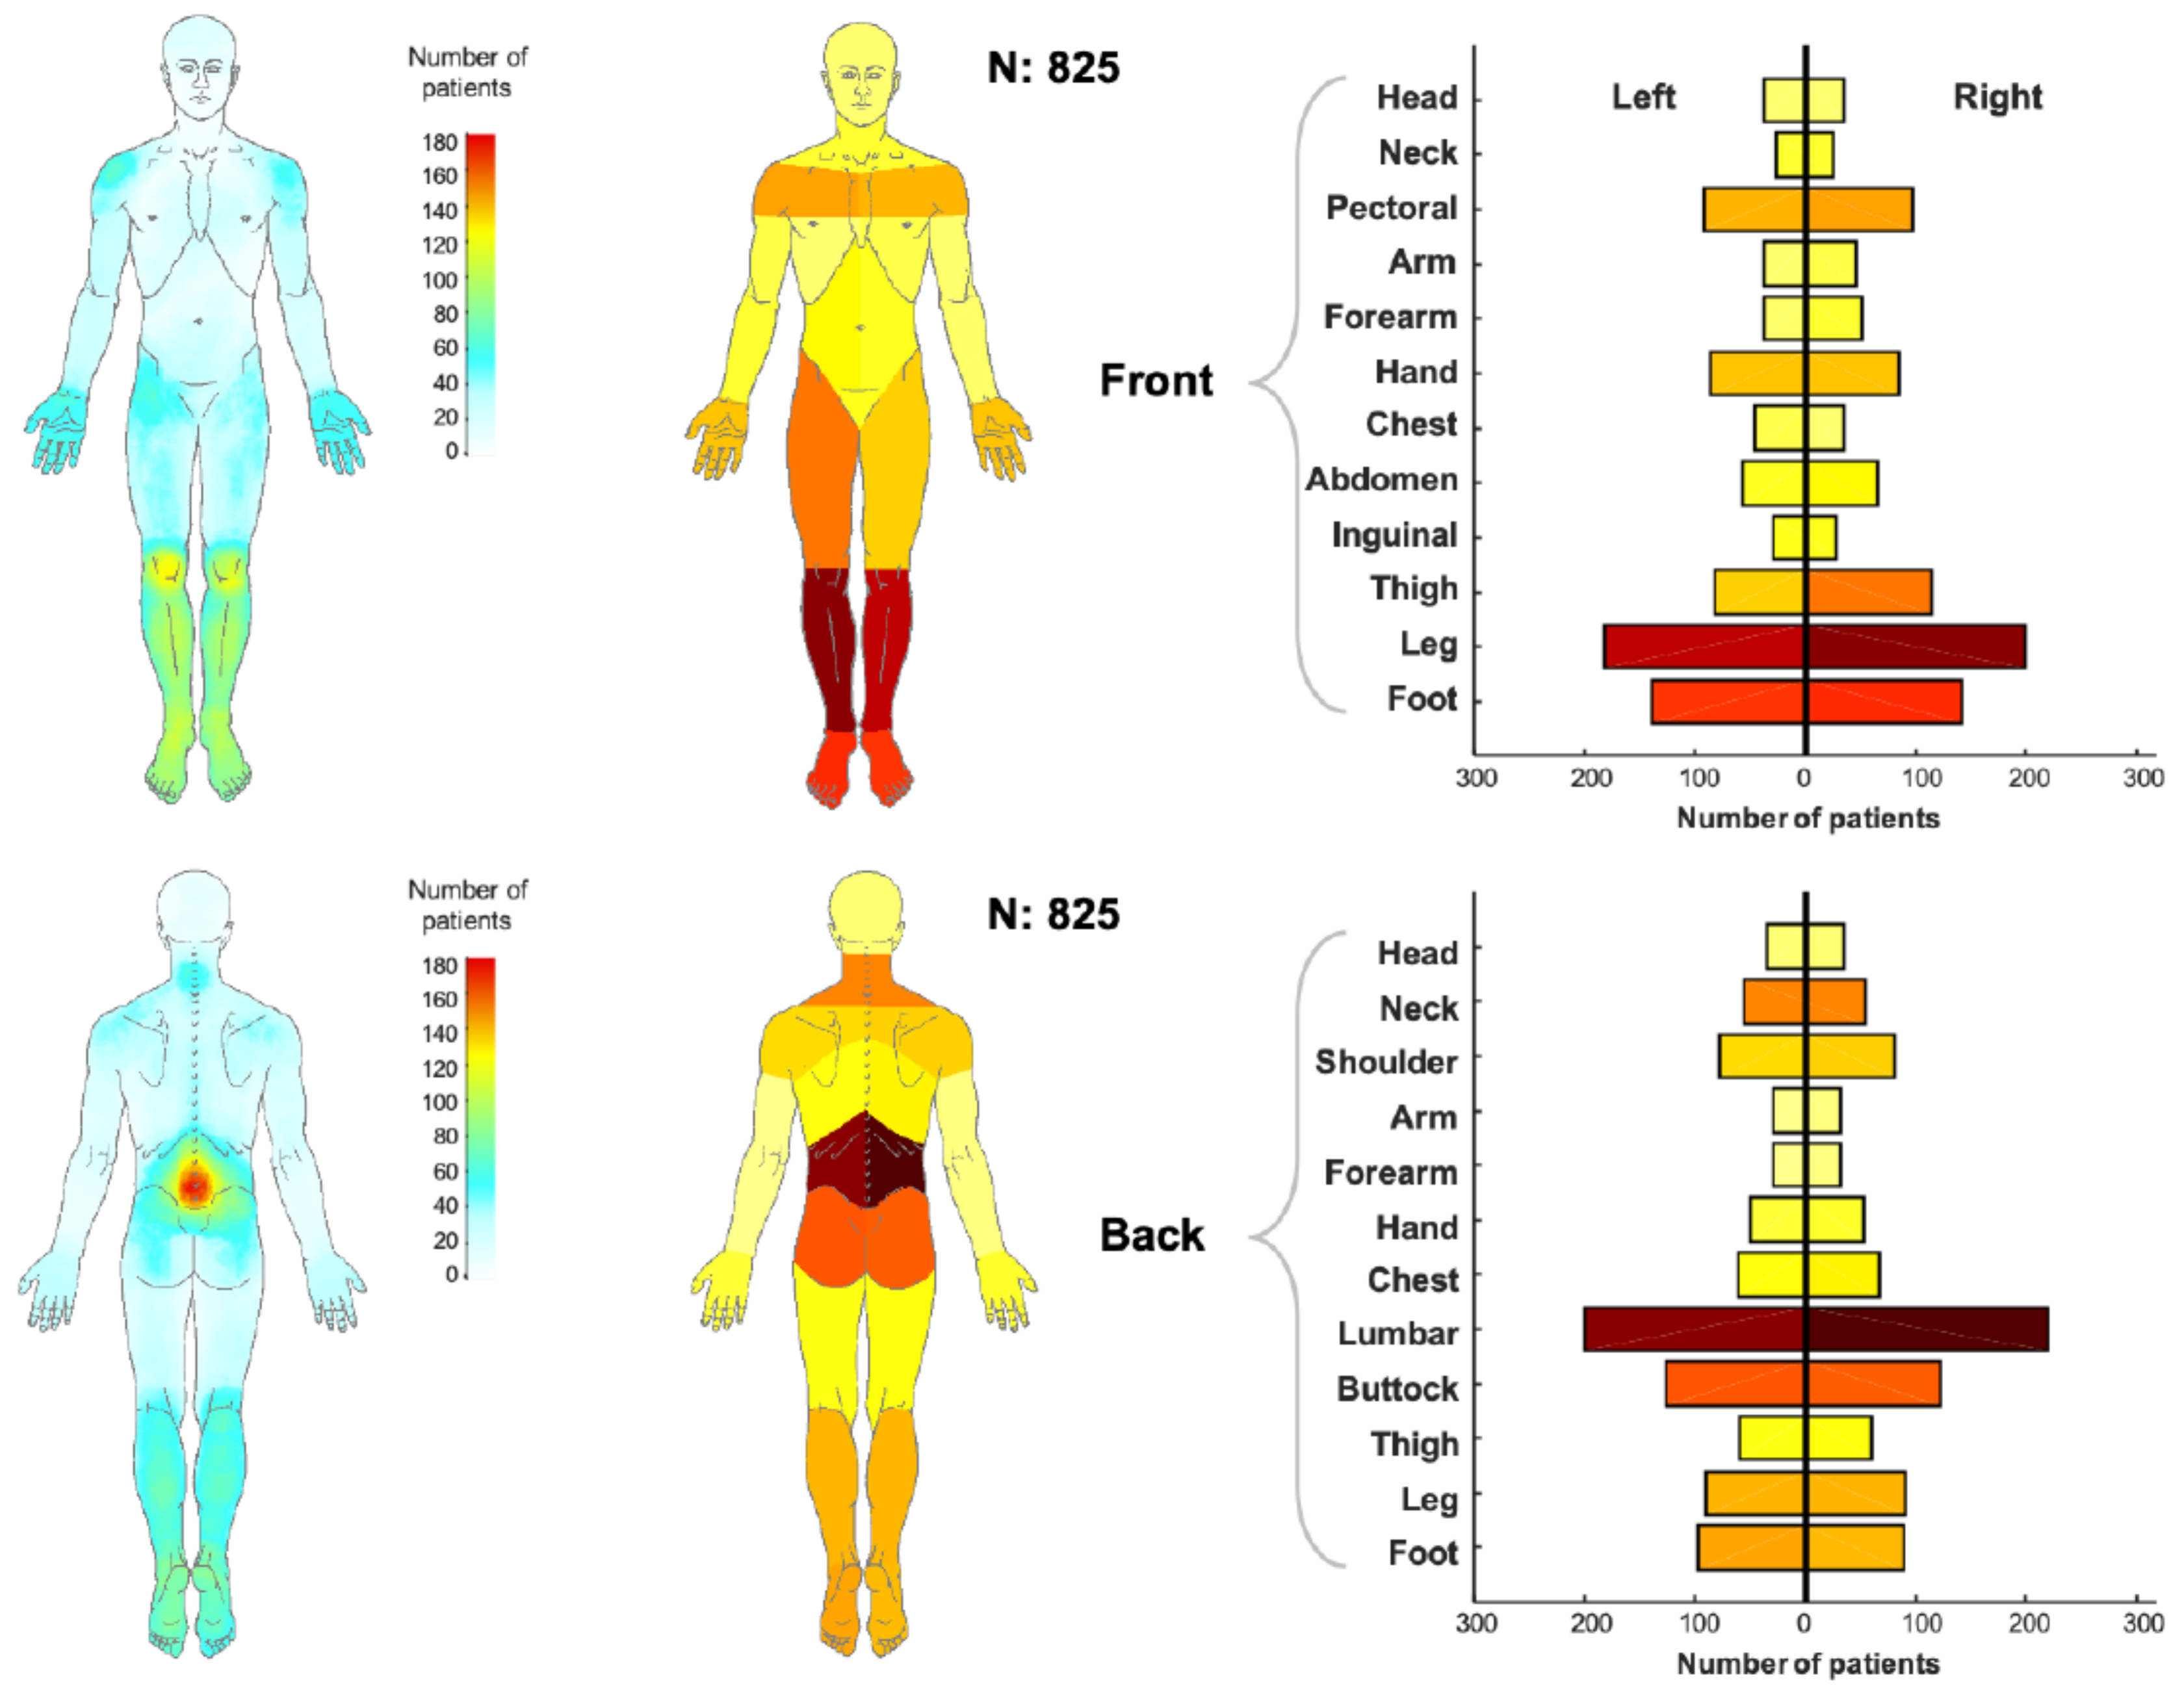
3.2. Pain Characteristics
Pain Location
3.3. QoL and MLR Models
4. Discussion
Strengths and Limitations
5. Conclusions
Supplementary Materials
Author Contributions
Funding
Institutional Review Board Statement
Informed Consent Statement
Data Availability Statement
Acknowledgments
Conflicts of Interest
References
- Abdulla, A.; Adams, N.; Bone, M.; Elliott, A.M.; Gaffin, J.; Jones, D.; Knaggs, R.; Martin, D.; Sampson, L.; Schofield, P.; et al. Guidance on the management of pain in older people. Age Ageing 2013, 42 (Suppl. 1), i1–57. [Google Scholar] [CrossRef]
- Disease, G.B.D.; Injury, I.; Prevalence, C. Global, regional, and national incidence, prevalence, and years lived with disability for 354 diseases and injuries for 195 countries and territories, 1990–2017: A systematic analysis for the Global Burden of Disease Study 2017. Lancet 2018, 392, 1789–1858. [Google Scholar] [CrossRef]
- Henschke, N.; Kamper, S.J.; Maher, C.G. The Epidemiology and Economic Consequences of Pain. Mayo Clin. Proc. 2015, 90, 139–147. [Google Scholar] [CrossRef]
- Dragioti, E.; Larsson, B.; Bernfort, L.; Levin, L.A.; Gerdle, B. Prevalence of different pain categories based on pain spreading on the bodies of older adults in Sweden: A descriptive-level and multilevel association with demographics, comorbidities, medications, and certain lifestyle factors (PainS65+). J. Pain Res. 2016, 9, 1131–1141. [Google Scholar] [CrossRef]
- Roy, R. Chronic Pain Loss and Suffering; Univerversity of Toronto Press: Toronto, ON, Canada, 2004; p. 27. [Google Scholar]
- Schofield, P. The Assessment of Pain in Older People: UK National Guidelines. Age Ageing 2018, 47, i1–i22. [Google Scholar] [CrossRef]
- Croft, P. The question is not “have you got it”? But “how much of it have you got”? Pain 2009, 141, 6–7. [Google Scholar] [CrossRef]
- Dragioti, E.; Larsson, B.; Bernfort, L.; Levin, L.A.; Gerdle, B. A cross-sectional study of factors associated with the number of anatomical pain sites in an actual elderly general population: Results from the PainS65+ cohort. J. Pain Res. 2017, 10, 2009–2019. [Google Scholar] [CrossRef]
- Otones Reyes, P.; Garcia Perea, E.; Pedraz Marcos, A. Chronic Pain and Frailty in Community-Dwelling Older Adults: A Systematic Review. Pain Manag. Nurs. Off. J. Am. Soc. Pain Manag. Nurses 2019, 20, 309–315. [Google Scholar] [CrossRef]
- Miro, J.; Paredes, S.; Rull, M.; Queral, R.; Miralles, R.; Nieto, R.; Huguet, A.; Baos, J. Pain in older adults: A prevalence study in the Mediterranean region of Catalonia. Eur. J. Pain (Lond. Engl.) 2007, 11, 83–92. [Google Scholar] [CrossRef]
- Deng, L.X.; Patel, K.; Miaskowski, C.; Maravilla, I.; Schear, S.; Garrigues, S.; Thompson, N.; Auerbach, A.D.; Ritchie, C.S. Prevalence and Characteristics of Moderate to Severe Pain among Hospitalized Older Adults. J. Am. Geriatr. Soc. 2018, 66, 1744–1751. [Google Scholar] [CrossRef] [PubMed]
- Corsi, N.; Roberto, A.; Cortesi, L.; Nobili, A.; Mannucci, P.M.; Corli, O.; Investigators, R. Prevalence, characteristics and treatment of chronic pain in elderly patients hospitalized in internal medicine wards. Eur. J. Intern. Med. 2018, 55, 35–39. [Google Scholar] [CrossRef] [PubMed]
- Marcusson, J.; Nord, M.; Johansson, M.M.; Alwin, J.; Levin, L.A.; Dannapfel, P.; Thomas, K.; Poksinska, B.; Sverker, A.; Olaison, A.; et al. Proactive healthcare for frail elderly persons: Study protocol for a prospective controlled primary care intervention in Sweden. BMJ Open 2019, 9, e027847. [Google Scholar] [CrossRef] [PubMed]
- Marcusson, J.; Nord, M.; Dong, H.J.; Lyth, J. Clinically useful prediction of hospital admissions in an older population. BMC Geriatr. 2020, 20, 95. [Google Scholar] [CrossRef]
- Andrews, J.S.; Cenzer, I.S.; Yelin, E.; Covinsky, K.E. Pain as a risk factor for disability or death. J. Am. Geriatr. Soc. 2013, 61, 583–589. [Google Scholar] [CrossRef] [PubMed]
- O’Sullivan, K.; Kennedy, N.; Purtill, H.; Hannigan, A. Understanding pain among older persons: Part 1—The development of novel pain profiles and their association with disability and quality of life. Age Ageing 2017, 46, 46–51. [Google Scholar] [CrossRef]
- Östsam. Östgötarnas Åldrande 2010–2030 [Ageing of the Population in the County of Östergötland]; Östsam: Linköping, Sweden, 2012. [Google Scholar]
- Treede, R.-D.; Rief, W.; Barke, A.; Aziz, Q.; Bennett, M.I.; Benoliel, R.; Cohen, M.; Evers, S.; Finnerup, N.B.; First, M.B.; et al. Chronic pain as a symptom or a disease: The IASP Classification of Chronic Pain for the International Classification of Diseases (ICD-11). Pain 2019, 160, 19–27. [Google Scholar] [CrossRef]
- Carlsson, A.M. Assessment of chronic pain. I. Aspects of the reliability and validity of the visual analogue scale. Pain 1983, 16, 87–101. [Google Scholar] [CrossRef]
- Barbero, M.; Moresi, F.; Leoni, D.; Gatti, R.; Egloff, M.; Falla, D. Test-retest reliability of pain extent and pain location using a novel method for pain drawing analysis. Eur. J. Pain (Lond. Engl.) 2015, 19, 1129–1138. [Google Scholar] [CrossRef]
- Falla, D.; Peolsson, A.; Peterson, G.; Ludvigsson, M.L.; Soldini, E.; Schneebeli, A.; Barbero, M. Perceived pain extent is associated with disability, depression and self-efficacy in individuals with whiplash-associated disorders. Eur. J. Pain 2016, 20, 1490–1501. [Google Scholar] [CrossRef]
- Lofqvist, C.; Nygren, C.; Szeman, Z.; Iwarsson, S. Assistive devices among very old people in five European countries. Scand. J. Occup. Ther. 2005, 12, 181–192. [Google Scholar] [CrossRef]
- Leijon, M.E.; Stark-Ekman, D.; Nilsen, P.; Ekberg, K.; Walter, L.; Ståhle, A.; Bendtsen, P. Is there a demand for physical activity interventions provided by the health care sector? Findings from a population survey. BMC Public Health 2010, 10, 34. [Google Scholar] [CrossRef]
- Sonn, U.; Asberg, K.H. Assessment of activities of daily living in the elderly. A study of a population of 76-year-olds in Gothenburg, Sweden. Scand. J. Rehabil. Med. 1991, 23, 193–202. [Google Scholar] [PubMed]
- Sonn, U. Longitudinal studies of dependence in daily life activities among elderly persons. Scand. J. Rehabil. Med. Suppl. 1996, 34, 1–35. [Google Scholar] [PubMed]
- The EuroQol Group. EuroQol—A new facility for the measurement of health-related quality of life. Health Policy (Amst. Neth.) 1990, 16, 199–208. [Google Scholar] [CrossRef]
- Dolan, P. Modeling valuations for EuroQol health states. Med. Care 1997, 35, 1095–1108. [Google Scholar] [CrossRef]
- Hays, R.D.; Morales, L.S. The RAND-36 measure of health-related quality of life. Ann. Med. 2001, 33, 350–357. [Google Scholar] [CrossRef]
- Lawton, M.P. The Philadelphia Geriatric Center Morale Scale: A revision. J. Gerontol. 1975, 30, 85–89. [Google Scholar] [CrossRef]
- Niklasson, J.; Conradsson, M.; Hornsten, C.; Nyqvist, F.; Padyab, M.; Nygren, B.; Olofsson, B.; Lovheim, H.; Gustafson, Y. Psychometric properties and feasibility of the Swedish version of the Philadelphia Geriatric Center Morale Scale. Qual. Life Res. Int. J. Qual. Life Asp. Treat. Care Rehabil. 2015, 24, 2795–2805. [Google Scholar] [CrossRef]
- Kobau, R.; Sniezek, J.; Zack, M.M.; Lucas, R.E.; Burns, A. Well-Being Assessment: An Evaluation of Well-Being Scales for Public Health and Population Estimates of Well-Being among US Adults. Appl. Psychol. Health Well-Being 2010, 2, 272–297. [Google Scholar] [CrossRef]
- Smith, G. Step away from stepwise. J. Big Data 2018, 5, 32. [Google Scholar] [CrossRef]
- Chowdhury, M.Z.I.; Turin, T.C. Variable selection strategies and its importance in clinical prediction modelling. Fam. Med. Community Health 2020, 8, e000262. [Google Scholar] [CrossRef] [PubMed]
- Fleiss, J.L.; Levin, B.; Paik, M.C. Statistical Methods for Rates and Proportions, 3rd ed.; Wiley-Interscience: Hoboken, NJ, USA, 2003. [Google Scholar] [CrossRef]
- Wettstein, M.; Eich, W.; Bieber, C.; Tesarz, J. Pain Intensity, Disability, and Quality of Life in Patients with Chronic Low Back Pain: Does Age Matter? Pain Med. 2018, 20, 464–475. [Google Scholar] [CrossRef] [PubMed]
- Prince, M.J.; Wu, F.; Guo, Y.; Gutierrez Robledo, L.M.; O’Donnell, M.; Sullivan, R.; Yusuf, S. The burden of disease in older people and implications for health policy and practice. Lancet 2015, 385, 549–562. [Google Scholar] [CrossRef]
- Clark, P.; Denova-Gutierrez, E.; Razo, C.; Rios-Blancas, M.J.; Lozano, R. The burden of musculoskeletal disorders in Mexico at national and state level, 1990-2016: Estimates from the global burden of disease study 2016. Osteoporos. Int. 2018, 29, 2745–2760. [Google Scholar] [CrossRef] [PubMed]
- Van Blijswijk, S.C.E.; Chan, O.Y.A.; van Houwelingen, A.H.; Gussekloo, J.; den Elzen, W.P.J.; Blom, J.W. Self-Reported Hindering Health Complaints of Community-Dwelling Older Persons: A Cross-Sectional Study. PLoS ONE 2015, 10, e0142416. [Google Scholar] [CrossRef]
- Karadag Arli, S.; Bakan, A.B.; Varol, E.; Aslan, G. Investigation of pain and life satisfaction in older adults. Geriatr. Gerontol. Int. 2018, 18, 5–11. [Google Scholar] [CrossRef]
- Ris, I.; Barbero, M.; Falla, D.; Larsen, M.H.; Kraft, M.N.; Søgaard, K.; Juul-Kristensen, B. Pain extent is more strongly associated with disability, psychological factors, and neck muscle function in people with non-traumatic versus traumatic chronic neck pain: A cross sectional study. Eur. J. Phys. Rehabil. Med. 2019, 55, 71–78. [Google Scholar] [CrossRef]
- Willett, M.J.; Siebertz, M.; Petzke, F.; Erlenwein, J.; Rushton, A.; Soldini, E.; Barbero, M.; Falla, D. The Extent of Pain Is Associated With Signs of Central Sensitization in Patients With Hip Osteoarthritis. Pain Pract. Off. J. World Inst. Pain 2020, 20, 277–288. [Google Scholar] [CrossRef]
- McCarthy, L.H.; Bigal, M.E.; Katz, M.; Derby, C.; Lipton, R.B. Chronic pain and obesity in elderly people: Results from the Einstein aging study. J. Am. Geriatr. Soc. 2009, 57, 115–119. [Google Scholar] [CrossRef]
- Guerriero, F.; Reid, M.C. Linking Persistent Pain and Frailty in Older Adults. Pain Med. 2020, 21, 61–66. [Google Scholar] [CrossRef]
- Patel, K.; Turk, D. (131) Evaluation of pain intensity ratings among older adults with and without dementia: Findings from the National Health and Aging Trends Study. J. Pain 2016, 17, S8. [Google Scholar] [CrossRef]
- Stamm, T.A.; Pieber, K.; Crevenna, R.; Dorner, T.E. Impairment in the activities of daily living in older adults with and without osteoporosis, osteoarthritis and chronic back pain: A secondary analysis of population-based health survey data. BMC Musculoskelet. Disord. 2016, 17, 139. [Google Scholar] [CrossRef] [PubMed]
- Abbott, J.H.; Foster, M.; Hamilton, L.; Ravenwood, M.; Tan, N. Validity of pain drawings for predicting psychological status outcome in patients with recurrent or chronic low back pain. J. Man. Manip. Ther. 2015, 23, 12–19. [Google Scholar] [CrossRef] [PubMed]
- Ahacic, K.; Kareholt, I. Prevalence of musculoskeletal pain in the general Swedish population from 1968 to 2002: Age, period, and cohort patterns. Pain 2010, 151, 206–214. [Google Scholar] [CrossRef]
- Yang, Y. Social Inequalities in Happiness in the United States, 1972 to 2004: An Age-Period-Cohort Analysis. Am. Sociol. Rev. 2008, 73, 204–226. [Google Scholar] [CrossRef]
- Stone, A.A.; Schwartz, J.E.; Broderick, J.E.; Deaton, A. A snapshot of the age distribution of psychological well-being in the United States. Proc. Natl. Acad. Sci. USA 2010, 107, 9985. [Google Scholar] [CrossRef]
- Ardelt, M. Wisdom and life satisfaction in old age. J. Gerontol. B Psychol. Sci. Soc. Sci. 1997, 52B, P15–P27. [Google Scholar] [CrossRef]
- Jakobsson, U.; Hallberg, I.R. Loneliness, fear, and quality of life among elderly in Sweden: A gender perspective. Aging Clin. Exp. Res. 2005, 17, 494–501. [Google Scholar] [CrossRef]
- Lu, C.; Yuan, L.; Lin, W.; Zhou, Y.; Pan, S. Depression and resilience mediates the effect of family function on quality of life of the elderly. Arch. Gerontol. Geriatr. 2017, 71, 34–42. [Google Scholar] [CrossRef]
- Andreasen, J.; Lund, H.; Aadahl, M.; Sørensen, E.E. The experience of daily life of acutely admitted frail elderly patients one week after discharge from the hospital. Int. J. Qual. Stud. Health Well-Being 2015, 10, 27370. [Google Scholar] [CrossRef]
- Borg, C.; Hallberg, I.R.; Blomqvist, K. Life satisfaction among older people (65+) with reduced self-care capacity: The relationship to social, health and financial aspects. J. Clin. Nurs. 2006, 15, 607–618. [Google Scholar] [CrossRef] [PubMed]
- Cruder, C.; Falla, D.; Mangili, F.; Azzimonti, L.; Araujo, L.S.; Williamon, A.; Barbero, M. Profiling the Location and Extent of Musicians’ Pain Using Digital Pain Drawings. Pain Pract. 2018, 18, 53–66. [Google Scholar] [CrossRef] [PubMed]


| Total, n (%) | Range | |
|---|---|---|
| Age (years), mean ± SD | 84.2 ± 5.6 | 75–104 |
| Gender, male, n (%) | 430 (52.1) | |
| Marital status (n = 814), n (%) | ||
| Married/co-habited | 399 (49.2) | |
| Unmarried/widow/widower | 412 (50.8) | |
| Living situation (n = 814), n (%) | ||
| Living alone | 413 (50.7) | |
| Living with partners | 389 (47.2) | |
| Living with children | 12 (1.5) | |
| Housing, n (%) | ||
| Own house/apartment | 750 (91.9) | |
| Sheltered accommodation/nursing home | 66 (8.1) | |
| Education levels (n = 797), n (%) | ||
| Less than 9 years of school | 341 (42.8) | |
| 9 years of school | 79 (9.9) | |
| Secondary school | 245 (30.7) | |
| University/college | 132 (16.6) | |
| Use any type of assistive technology, n (%) | 549 (68.5) | |
| Number of assistive technologies (n = 801), median (IQR) | 1 (0–3) | 0–6 |
| ADL-staircase score (n = 807), median (IQR) | 13 (11–17) | 10–30 |
| Physical activity (n = 579) a, median (IQR) | 2 (1–3) | 1–4 |
| Inactivity, n (%) | 214 (37) | |
| Low activity, n (%) | 106 (18.3) | |
| Moderate activity, n (%) | 218 (37.7) | |
| High activity, n (%) | 41 (7.1) | |
| Having relatives nearby (n = 803), n (%) | 623 (75.5) | |
| Number of close relationships (n = 766), median (IQR) | 6 (3–10) | 0–67 |
| None | 4 (0.5) | |
| 1–2 | 132 (16) | |
| 3–5 | 232 (28.1) | |
| ≥6 | 398 (48.2) | |
| Frequency of feeling lonely (n = 720) a, median (IQR) | 3 (2–4) | 1–4 |
| No, never/wish to be self, n (%) | 280 (33.9) | |
| Yes, seldom, n (%) | 168 (20.4) | |
| Yes, sometimes, n (%) | 200 (24.2) | |
| Yes, often, n (%) | 72 (8.7) | |
| Frequency of feeling worried (n = 725) a | 3 (2–4) | 1–4 |
| No, never, n (%) | 183 (25.2) | |
| Yes, seldom, n (%), n (%) | 196 (27) | |
| Yes, sometimes, n (%) | 258 (35.6) | |
| Yes, often, n (%) | 88 (12.1) | |
| EQ-5D index (n = 755), median (IQR) | 0.66 (0.36–0.73) | −0.594–1 |
| RAND-36 physical functioning (n = 802), median (IQR) | 35 (15–60) | 0–100 |
| PGCMS-subscale (n = 745), median (IQR) | 1 (0–2) | 0–5 |
| SWLS scale (n = 657), mean ± SD | 16.8 ± 4.5 | 5–25 |
| Total, n (%) | Min–Max | |
|---|---|---|
| Pain frequency (n = 782) | ||
| Never | 76 (9.7) | |
| Occasionally | 264 (33.8) | |
| Everyday | 272 (34.8) | |
| Several times per day | 65 (8.3) | |
| Constant | 105 (13.4) | |
| Pain duration (n = 562), months, median (IQR) | 17 (9–36) | 0–99 |
| Less than three months | 63 (11.2) | |
| Three months or longer | 499 (88.8) | |
| Pain intensity (n = 704), VAS pain-7d, median (IQR) | 40 (21–61) | 0–100 |
| 0–30, none to mild pain | 276 (33.5) | |
| 31–69, moderate pain | 316 (38.3) | |
| 70–100, severe pain | 112 (13.6) | |
| Pain extent (n = 825), percentage, median (IQR) | 1.93 (0.61–4.77) | 0–64.40 |
| DV | EQ-5D Index | RAND-36PF | PGCMS-Subscale | SWLS | |
|---|---|---|---|---|---|
| IV | |||||
| VAS pain-7d | −0.003 (0.001) c | −0.19 (0.05) a | EXCL | EXCL | |
| Pain frequency | −0.05(0.02) b | EXCL | EXCL | −0.59 (0.25) a | |
| Pain extent | −0.005 (0.002) b | EXCL | −0.03 (0.01) b | EXCL | |
| Age | EXCL | EXCL | EXCL | 0.15 (0.05) b | |
| Gender (reference: male) | EXCL | −5.71 (2.27) a | EXCL | EXCL | |
| Education level | EXCL | EXCL | 0.14 (0.06) a | EXCL | |
| Living situation (reference: living alone) | |||||
| Living with partners | EXCL | EXCL | EXCL | 1.62 (0.68) a | |
| Living with children | EXCL | EXCL | EXCL | EXCL | |
| Number of used assistive technologies | EXCL | −3.61 (1.11) b | EXCL | EXCL | |
| Physical activity level | EXCL | 8.83 (1.22) c | 0.25 (0.07) c | 1.16 (0.26) c | |
| ADL-staircase | −0.03 (0.003) c | −2.01 (0.31) c | EXCL | EXCL | |
| Having relatives nearby | EXCL | EXCL | EXCL | 2.13 (0.62) b | |
| Frequency of feeling lonely | −0.05 (0.01) b | EXCL | -0.20 (0.07) b | −0.72 (0.33) a | |
| Frequency of feeling worried | −0.06 (0.01) c | EXCL | −0.33 (0.075) c | −0.85 (0.28) b | |
| Constant | 1.48 (0.06) c | 70.15 (6.17) c | 1.68 (0.30) c | 4.90 (4.45) | |
| R2 | 0.57 | 0.59 | 0.23 | 0.30 | |
Publisher’s Note: MDPI stays neutral with regard to jurisdictional claims in published maps and institutional affiliations. |
© 2021 by the authors. Licensee MDPI, Basel, Switzerland. This article is an open access article distributed under the terms and conditions of the Creative Commons Attribution (CC BY) license (http://creativecommons.org/licenses/by/4.0/).
Share and Cite
Johansson, M.M.; Barbero, M.; Peolsson, A.; Falla, D.; Cescon, C.; Folli, A.; Dong, H.-J. Pain Characteristics and Quality of Life in Older People at High Risk of Future Hospitalization. Int. J. Environ. Res. Public Health 2021, 18, 958. https://doi.org/10.3390/ijerph18030958
Johansson MM, Barbero M, Peolsson A, Falla D, Cescon C, Folli A, Dong H-J. Pain Characteristics and Quality of Life in Older People at High Risk of Future Hospitalization. International Journal of Environmental Research and Public Health. 2021; 18(3):958. https://doi.org/10.3390/ijerph18030958
Chicago/Turabian StyleJohansson, Maria M, Marco Barbero, Anneli Peolsson, Deborah Falla, Corrado Cescon, Anna Folli, and Huan-Ji Dong. 2021. "Pain Characteristics and Quality of Life in Older People at High Risk of Future Hospitalization" International Journal of Environmental Research and Public Health 18, no. 3: 958. https://doi.org/10.3390/ijerph18030958
APA StyleJohansson, M. M., Barbero, M., Peolsson, A., Falla, D., Cescon, C., Folli, A., & Dong, H.-J. (2021). Pain Characteristics and Quality of Life in Older People at High Risk of Future Hospitalization. International Journal of Environmental Research and Public Health, 18(3), 958. https://doi.org/10.3390/ijerph18030958