
IgM and IgG Profiles Reveal Peculiar Features of Humoral Immunity Response to SARS-CoV-2 Infection

 ,
,  , , , ,
  ,
,  ,
, 
Abstract
1. Introduction
2. Materials and Methods
2.1. Study Design and Participants
2.2. Data Collection
2.3. Definitions
2.4. Molecular Assays
2.5. Detection of Anti-SARS-CoV-2 IgG and IgM
2.6. Statistical Analysis
2.7. Ethical Aspects
3. Results
4. Discussion
5. Conclusions
Author Contributions
Funding
Institutional Review Board Statement
Informed Consent Statement
Data Availability Statement
Conflicts of Interest
References
- Astuti, I. Severe Acute Respiratory Syndrome Coronavirus 2 (SARS-CoV-2): An overview of viral structure and host response. Diabetes Metab. Syndr. 2020, 14, 407–412. [Google Scholar] [CrossRef] [PubMed]
- Naqvi, A.A.T.; Fatima, K.; Mohammad, T.; Fatima, U.; Singh, I.K.; Singh, A.; Atif, S.M.; Hariprasad, G.; Hasan, G.M.; Hassan, M.I. Insights into SARS-CoV-2 genome, structure, evolution, pathogenesis and therapies: Structural genomics approach. Biochim. Biophys. Acta Mol. Basis Dis. 2020, 1866, 165878. [Google Scholar] [CrossRef] [PubMed]
- Wang, D.; Hu, B.; Hu, C.; Zhu, F.; Liu, X.; Zhang, J.; Wang, B.; Xiang, H.; Cheng, Z.; Xiong, Y.; et al. Clinical Characteristics of 138 Hospitalized Patients With 2019 Novel Coronavirus–Infected Pneumonia in Wuhan, China. JAMA 2020, 323, 1061–1069. [Google Scholar] [CrossRef] [PubMed]
- Lippi, G.; Sanchis-Gomar, F.; Henry, B.M. COVID-19: Unravelling the clinical progression of nature’s virtually perfect biological weapon. Ann. Transl. Med. 2020, 8, 693. [Google Scholar] [CrossRef] [PubMed]
- Dos Santos, W.G. Natural history of COVID-19 and current knowledge on treatment therapeutic options. Biomed. Pharmacother. 2020, 129, 110493. [Google Scholar] [CrossRef]
- Chan, K.W.; Wong, V.T.; Tang, S.C.W. COVID-19: An update on the epidemiological, clinical, preventive and therapeutic evidence and guidelines of integrative Chinese–Western medicine for the management of 2019 novel coronavirus disease. Am. J. Chin. Med. 2020, 48, 737–762. [Google Scholar] [CrossRef] [PubMed]
- Kong, W.H.; Li, Y.; Peng, M.W.; Kong, D.G.; Yang, X.B.; Wang, L.; Liu, M.Q. SARS-CoV-2 detection in patients with influenza-like illness. Nat. Microbiol. 2020, 5, 675–678. [Google Scholar] [CrossRef]
- Alifano, M.; Alifano, P.; Forgez, P.; Iannelli, A. Renin-angiotensin system at the heart of COVID-19 pandemic. Biochimie 2020, 174, 30–33. [Google Scholar] [CrossRef]
- Calcagnile, M.; Forgez, P.; Iannelli, A.; Bucci, C.; Alifano, M.; Alifano, P. Molecular docking simulation reveals ACE2 polymorphisms that may increase the affinity of ACE2 with the SARS-CoV-2 Spike protein. Biochimie 2020, 180, 143–148. [Google Scholar] [CrossRef]
- Debnath, M.; Banerjee, M.; Berk, M. Genetic gateways to COVID-19 infection: Implications for risk, severity, and outcomes. FASEB J. 2020, 34, 8787–8795. [Google Scholar] [CrossRef]
- Devaux, C.A.; Rolain, J.M.; Raoult, D. ACE2 receptor polymorphism: Susceptibility to SARS-CoV-2, hypertension, multi-organ failure, and COVID-19 disease outcome. J. Microbiol. Immunol. Infect. 2020, 53, 425–435. [Google Scholar] [CrossRef] [PubMed]
- Godri Pollitt, K.J.; Peccia, J.; Ko, A.I.; Kaminski, N.; Dela Cruz, C.S.; Nebert, D.W.; Reichardt, J.K.V.; Thompson, D.C.; Vasiliou, V. COVID-19 vulnerability: The potential impact of genetic susceptibility and airborne transmission. Hum. Genom. 2020, 14, 17. [Google Scholar] [CrossRef] [PubMed]
- Zhu, N.; Zhang, D.; Wang, W.; Li, X.; Yang, B.; Song, J.; Zhao, X.; Huang, B.; Shi, W.; Lu, R.; et al. A Novel Coronavirus from Patients with Pneumonia in China, 2019. N. Engl. J. Med. 2020, 382, 727–733. [Google Scholar] [CrossRef] [PubMed]
- National Health Commission; State Administration of Traditional Chinese Medicine. Diagnosis and Treatment Protocol for Novel Coronavirus Pneumonia (Trial Version 7). Chin. Med. J. 2020, 133, 1087–1095. [Google Scholar] [CrossRef]
- Paradiso, A.V.; De Summa, S.; Loconsole, D.; Procacci, V.; Sallustio, A.; Centrone, F.; Silvestris, N.; Cafagna, V.; De Palma, G.; Tufaro, A.; et al. Clinical meanings of rapid serological assay in patients tested for SARS-Co2 RT-PCR. medRxiv 2020. [Google Scholar] [CrossRef]
- Wölfel, R.; Corman, V.M.; Guggemos, W.; Seilmaier, M.; Zange, S.; Müller, M.A.; Niemeyer, D.; Jones, T.C.; Vollmar, P.; Rothe, C.; et al. Virological assessment of hospitalized patients with COVID-2019. Nature 2020, 581, 465–469. [Google Scholar] [CrossRef]
- Edridge, A.W.; Kaczorowska, J.M.; Hoste, A.C.; Bakker, M.; Klein, M.; Jebbink, M.F.; Matser, A.; Kinsella, C.M.; Rueda, P.; Prins, M.; et al. Human coronavirus reinfection dynamics: Lessons for SARS-CoV-2. medRxiv 2020. [Google Scholar] [CrossRef]
- Liu, W.; Fontanet, A.; Zhang, P.H.; Zhan, L.; Xin, Z.T.; Baril, L.; Tang, F.; Lv, H.; Cao, W.C. Two-year prospective study of the humoral immune response of patients with severe acute respiratory syndrome. J. Infect. Dis. 2006, 193, 792–795. [Google Scholar] [CrossRef]
- Mo, H.; Zeng, G.; Ren, X.; Li, H.; Ke, C.; Tan, Y.; Cai, C.; Lai, K.; Chen, R.; Chan-Yeung, M.; et al. Longitudinal profile of antibodies against SARS-coronavirus in SARS patients and their clinical significance. Respirology 2006, 11, 49–53. [Google Scholar] [CrossRef]
- Huang, A.T.; Garcia-Carreras, B.; Hitchings, M.D.T.; Yang, B.; Katzelnick, L.C.; Rattigan, S.M.; Borgert, B.A.; Moreno, C.A.; Solomon, B.D.; Rodriguez-Barraquer, I.; et al. A systematic review of antibody mediated immunity to coronaviruses: Antibody kinetics, correlates of protection, and association of antibody responses with severity of disease. medRxiv 2020. [Google Scholar] [CrossRef]
- Callow, K.A.; Parry, H.F.; Sergeant, M.; Tyrrell, D.A. The time course of the immune response to experimental coronavirus infection of man. Epidemiol. Infect. 1990, 105, 435–446. [Google Scholar] [CrossRef] [PubMed]
- Wang, Y.; He, Y.; Tong, J.; Qin, Y.; Xie, T.; Li, J.; Li, J.; Xiang, J.; Cui, Y.; Higgs, E.S.; et al. Characterization of an Asymptomatic Cohort of Severe Acute Respiratory Syndrome Coronavirus 2 (SARS-CoV-2) Infected Individuals Outside of Wuhan, China. Clin. Infect. Dis. 2020, 71, 2132–2138. [Google Scholar] [CrossRef] [PubMed]
- Sanyaolu, A.; Okorie, C.; Marinkovic, A.; Patidar, R.; Younis, K.; Desai, P.; Hosein, Z.; Padda, I.; Mangat, J.; Altaf, M. Comorbidity and its Impact on Patients with COVID-19. SN Compr. Clin. Med. 2020, 2, 1069–1076. [Google Scholar] [CrossRef] [PubMed]
- Bauer, G. The variability of the serological response to SARS-corona virus-2: Potential resolution of ambiguity through determination of avidity (functional affinity). J. Med. Virol. 2020. [Google Scholar] [CrossRef] [PubMed]
- Guo, L.; Ren, L.; Yang, S.; Xiao, M.; Chang, D.; Yang, F.; Dela Cruz, C.S.; Wang, Y.; Wu, C.; Xiao, Y.; et al. Profiling early humoral response to diagnose novel coronavirus disease (COVID-19). Clin. Infect. Dis. 2020, 71, 778–785. [Google Scholar] [CrossRef]
- Long, Q.X.; Tang, X.J.; Shi, Q.L.; Li, Q.; Deng, H.J.; Yuan, J.; Hu, J.L.; Xu, W.; Zhang, Y.; Lv, F.J.; et al. Clinical and immunological assessment of asymptomatic SARS-CoV-2 infections. Nat. Med. 2020, 26, 1200–1204. [Google Scholar] [CrossRef]
- Zhao, J.; Yuan, Q.; Wang, H.; Liu, W.; Liao, X.; Su, Y.; Wang, X.; Yuan, J.; Li, T.; Li, J.; et al. Antibody responses to SARS-CoV-2 in patients of novel coronavirus disease 2019. Clin. Infect. Dis. 2020, 71, 2027–2034. [Google Scholar] [CrossRef]
- Long, Q.X.; Liu, B.Z.; Deng, H.J.; Wu, G.C.; Deng, K.; Chen, Y.K.; Liao, P.; Qiu, J.F.; Lin, Y.; Cai, Y.F.; et al. Antibody responses to SARS-CoV-2 in patients with COVID-19. Nat. Med. 2020, 26, 845–848. [Google Scholar] [CrossRef]
- Seow, J.; Graham, C.; Merrick, B.; Acors, S.; Steel, K.J.; Hemmings, O.; O’Bryne, A.; Kouphou, N.; Pickering, S.; Galao, R.P.; et al. Longitudinal evaluation and decline of antibody responses in SARS-CoV-2 infection. medRxiv 2020. [Google Scholar] [CrossRef]
- Wang, X.; Guo, X.; Xin, Q.; Pan, Y.; Hu, Y.; Li, J.; Chu, Y.; Feng, Y.; Wang, Q. Neutralizing antibodies responses to SARS-CoV-2 in COVID-19 inpatients and convalescent patients. Clin. Infect. Dis. 2020. [Google Scholar] [CrossRef]
- Kissler, S.M.; Tedijanto, C.; Goldstein, E.; Grad, Y.H.; Lipsitch, M. Projecting the transmission dynamics of SARS-CoV-2 through the postpandemic period. Science 2020, 368, 860–868. [Google Scholar] [CrossRef] [PubMed]
- Wu, L.P.; Wang, N.C.; Chang, Y.H.; Tian, X.Y.; Na, D.Y.; Zhang, L.Y.; Zheng, L.; Lan, T.; Wang, L.F.; Liang, G.D. Duration of antibody responses after severe acute respiratory syndrome. Emerg. Infect. Dis. 2007, 13, 1562. [Google Scholar] [CrossRef] [PubMed]
- Payne, D.C.; Iblan, I.; Rha, B.; Alqasrawi, S.; Haddadin, A.; Al Nsour, M.; Alsanouri, T.; Ali, S.S.; Harcourt, J.; Miao, C.; et al. Persistence of antibodies against Middle East respiratory syndrome coronavirus. Emerg. Infect. Dis. 2016, 22, 1824. [Google Scholar] [CrossRef] [PubMed]
- Kellam, P.; Barclay, W. The dynamics of humoral immune responses following SARS-CoV-2 infection and the potential for reinfection. J. Gen. Virol. 2020, 101, 791–797. [Google Scholar] [CrossRef]
- Bonilla, F.A. Pharmacokinetics of immunoglobulin administered via intravenous or subcutaneous routes. Immunol. Allergy Clin. N. Am. 2008, 28, 803–819. [Google Scholar] [CrossRef]
- Lee, C.Y.P.; Lin, R.T.; Renia, L.; Ng, L.F. Serological Approaches for COVID-19: Epidemiologic Perspective on Surveillance and Control. Front. Immunol. 2020, 11, 879. [Google Scholar] [CrossRef]
- Fogo, A.B.; Kashgarian, M. Glomerular Diseases. In Diagnostic Atlas of Renal Pathology, 3rd ed.; Elsevier: Philadelphia, PA, USA, 2017; pp. 145–169. [Google Scholar]
- Bongiovanni, M.; Basile, F. Re-infection by COVID-19: A real threat for the future management of pandemia? Infect. Dis. 2020, 52, 581–582. [Google Scholar] [CrossRef]
- Duggan, N.M.; Ludy, S.M.; Shannon, B.C.; Reisner, A.T.; Wilcox, S.R. Is novel coronavirus 2019 reinfection possible? Interpreting dynamic SARS-CoV-2 test results through a case report. Am. J. Emerg. Med. 2020, 39, 256–e1. [Google Scholar] [CrossRef]
- Hoang, V.T.; Dao, T.L.; Gautret, P. Recurrence of positive SARS-CoV-2 in patients recovered from COVID-19. J. Med. Virol. 2020, 92, 2366–2367. [Google Scholar] [CrossRef]
- Batisse, D.; Benech, N.; Botelho-Nevers, E.; Bouiller, K.; Collarino, R.; Conrad, A.; Gallay, L.; Goehringer, F.; Gousseff, M.; Joseph, D.C.; et al. Clinical recurrences of COVID-19 symptoms after recovery: Viral relapse, reinfection or inflammatory rebound? J. Infect. 2020, 81, 816–846. [Google Scholar]
- Zhou, X.; Zhou, J.; Zhao, J. Recurrent pneumonia in a patient with new coronavirus infection after discharge from hospital for insufficient antibody production: A case report. BMC Infect. Dis. 2020, 20, 500. [Google Scholar] [CrossRef] [PubMed]
- Kang, H.; Wang, Y.; Tong, Z.; Liu, X. Retest positive for SARS-CoV-2 RNA of “recovered” patients with COVID-19: Persistence, sampling issues, or re-infection? J. Med. Virol. 2020, 92, 2263–2265. [Google Scholar] [CrossRef] [PubMed]
- Biswas, A.; Bhattacharjee, U.; Chakrabarti, A.K.; Tewari, D.N.; Banu, H.; Dutta, S. Emergence of Novel Coronavirus and COVID-19: Whether to stay or die out? Crit. Rev. Microbiol. 2020, 46, 182–193. [Google Scholar] [CrossRef] [PubMed]
- Racine, R.; Winslow, G.M. IgM in microbial infections: Taken for granted? Immunol. Lett. 2009, 125, 79–85. [Google Scholar] [CrossRef]
- Cooper, N.R.; Nemerow, G.R. Complement, viruses, and virus-infected cells. Springer Semin. Immunopathol. 1983, 6, 327–347. [Google Scholar] [CrossRef]
- Baumgarth, N.; Herman, O.C.; Jager, G.C.; Brown, L.E.; Herzenberg, L.A.; Chen, J. B-1 and B-2 cell–derived immunoglobulin M antibodies are nonredundant components of the protective response to influenza virus infection. J. Exp. Med. 2000, 192, 271–280. [Google Scholar] [CrossRef]
- Choi, Y.S.; Baumgarth, N. Dual role for B-1a cells in immunity to influenza virus infection. J. Exp. Med. 2008, 205, 3053–3064. [Google Scholar] [CrossRef]
- Harada, Y.; Muramatsu, M.; Shibata, T.; Honjo, T.; Kuroda, K. Unmutated immunoglobulin M can protect mice from death by influenza virus infection. J. Exp. Med. 2003, 197, 1779–1785. [Google Scholar] [CrossRef]
- Diamond, M.S.; Sitati, E.M.; Friend, L.D.; Higgs, S.; Shrestha, B.; Engle, M. A critical role for induced IgM in the protection against West Nile virus infection. J. Exp. Med. 2003, 198, 1853–1862. [Google Scholar] [CrossRef]
- Gobet, R.; Cerny, A.; Rüedi, E.; Hengartner, H.; Zinkernagel, R.M. The role of antibodies in natural and acquired resistance of mice to vesicular stomatitis virus. Pathobiology 1988, 56, 175–180. [Google Scholar] [CrossRef]
- Ochsenbein, A.F.; Fehr, T.; Lutz, C.; Suter, M.; Brombacher, F.; Hengartner, H.; Zinkernagel, R.M. Control of early viral and bacterial distribution and disease by natural antibodies. Science 1999, 286, 2156–2159. [Google Scholar] [CrossRef] [PubMed]
- Ochsenbein, A.F.; Pinschewer, D.D.; Odermatt, B.; Carroll, M.C.; Hengartner, H.; Zinkernagel, R.M. Protective T cell–independent antiviral antibody responses are dependent on complement. J. Exp. Med. 1999, 190, 1165–1174. [Google Scholar] [CrossRef] [PubMed]


| Variables | N (%) |
|---|---|
| Serological tests | 54 (100.0) |
| Positive | 42 (77.8) |
| Negative | 12 (22.2) |
| Multiple serological tests | 16 (29.6) |
| Sex | |
| Male | 29 (53.7) |
| Female | 25 (46.3) |
| Age | |
| <50 years | 17 (31.5) |
| ≥50 years | 37 (68.5) |
| Clinical status | |
| Critical | 9 (16.7) |
| Severe | 12 (22.2) |
| Mild | 12 (22.2) |
| Pauci-symptomatic | 7 (13.0) |
| Asymptomatic | 14 (25.9) |
| Subjects with comorbidities | 27 (50.0) |
| Recovered | 51 (94.4) |
| Died | 3 (5.6) |
| Patient ID | Age (Years) | Sex | Days from Symptom Onset | IgG (AU/mL) | IgM (AU/mL) | Clinical Status |
|---|---|---|---|---|---|---|
| #550 | 65 | M | 40 | 32.41 | NEG | Critical |
| #2145 | 66 | F | 19 | 29.89 | 1.56 | Critical |
| #2231 * | 66 | F | 13 | NEG | 5.65 | Critical |
| #2333 * | 69 | M | 16 | 24.66 | 2.12 | Critical |
| #2491 * | 62 | M | 12 | 4.50 | NEG | Critical |
| #2675 | 78 | M | 19 | 29.17 | NEG | Critical |
| #2776 | 85 | M | 26 | 12.48 | NEG | Critical |
| #4915 | 58 | M | 18 | 15.36 | 2.42 | Critical |
| #174 | 64 | F | 64 | NEG | NEG | Severe |
| #753 | 74 | M | 36 | 16.62 | 2.64 | Severe |
| #859 | 67 | M | 59 | 100.50 | 7.00 | Severe |
| #888 | 83 | F | 81 | 1.75 | NEG | Severe |
| #892 | 95 | F | 35 | 26.82 | NEG | Severe |
| #1099 | 67 | F | 39 | 16.69 | NEG | Severe |
| #2002 | 86 | F | 66 | 9.27 | NEG | Severe |
| #2362 | 85 | F | 71 | 1.68 | NEG | Severe |
| #2601 | 60 | M | 31 | 4.87 | NEG | Severe |
| #8 | 57 | M | 86 | 7.80 | NEG | Mild |
| #146 | 61 | M | 53 | 15.43 | NEG | Mild |
| #226 | 53 | M | 70 | 3.79 | NEG | Mild |
| #536 | 58 | M | 60 | NEG | NEG | Mild |
| #1513 | 36 | M | 42 | NEG | NEG | Mild |
| #1620 | 33 | M | 58 | NEG | NEG | Mild |
| #4089 | 52 | F | 25 | NEG | NEG | Mild |
| #4131 | 48 | M | 64 | NEG | NEG | Mild |
| #18 | 56 | M | 79 | 14.39 | 3.71 | Pauci-symptomatic |
| #676 | 32 | F | 57 | 13.23 | NEG | Pauci-symptomatic |
| #685 | 76 | F | 36 | 33.39 | NEG | Pauci-symptomatic |
| #894 | 89 | F | 35 | 8.78 | NEG | Pauci-symptomatic |
| #2699 | 33 | F | −2 | NEG | NEG | Pauci-symptomatic |
| #25 | 56 | F | 12.32 | NEG | Asymptomatic | |
| #152 | 50 | M | 3.18 | NEG | Asymptomatic | |
| #338 | 31 | M | NEG | NEG | Asymptomatic | |
| #863 | 66 | M | 3.40 | 1.24 | Asymptomatic | |
| #1002 | 27 | F | NEG | NEG | Asymptomatic | |
| #1756 | 56 | F | NEG | NEG | Asymptomatic | |
| #3500 | 72 | M | NEG | NEG | Asymptomatic | |
| #4936 | 30 | M | NEG | NEG | Asymptomatic |
| ID Patient | Age | Sex | IgG (AU/mL) | IgM (AU/mL) | Days between Symptom Onset and Serological Test | Days between Serological Tests | Trend | Clinical Status |
|---|---|---|---|---|---|---|---|---|
| #901 | 73 | M | 27.7 | NEG | 35 | Critical | ||
| 25.07 | - | 38 | 3 | IgG ↓ 10% | ||||
| #184 | 78 | M | 11.58 | 1.56 | 35 | Severe | ||
| 6.78 | 1.05 | 42 | 7 | IgG ↓ 41%, IgM ↓ 33% | ||||
| 7.44 | 3.49 | 55 | 13 | IgG ↑ 9%, IgM ↑ 232% | ||||
| #199 | 43 | M | 4.64 | - | 14 | Severe | ||
| 3.88 | 1.27 | 56 | 42 | IgG ↓ 16% | ||||
| #667 | 49 | M | 28.25 | NEG | 57 | Severe | ||
| 55.19 | 1.04 | 112 | 55 | IgG ↑ 95%, IgM + | ||||
| #572 | 55 | M | 24.23 | 1.02 | 52 | Mild | ||
| 23.76 | NEG | 118 | 66 | IgG =, IgM − | ||||
| #628 | 44 | M | 10.46 | NEG | 39 | Mild | ||
| 9.29 | NEG | 82 | 43 | IgG ↓ 12% | ||||
| 9.29 | NEG | 83 | 1 | IgG = | ||||
| #1107 | 92 | F | 7.84 | 1.9 | 74 | Mild | ||
| 3.18 | 1.45 | 93 | 19 | IgG ↓ 60%, IgM ↓ 25% | ||||
| #1618 | 72 | F | NEG | 2.78 | −12 | Mild | ||
| 4.27 | 2.88 | 18 | 30 | IgG +, IgM = | ||||
| #589 | 41 | M | NEG | NEG | −2 | Pauci-symptomatic | ||
| 6.07 | 3.23 | 58 | 60 | IgG and IgM + | ||||
| 5.49 | 3.25 | 61 | 3 | IgG ↓ 10%, IgM = | ||||
| 6.66 | 3.24 | 125 | 64 | IgG ↑ 18%, IgM = | ||||
| #834 | 39 | F | 6.01 | NEG | 71 | Pauci-symptomatic | ||
| 5.07 | NEG | 169 | 98 | IgG ↓ 15% | ||||
| #1059 | 34 | F | 4.45 | NEG | - | Asymptomatic | ||
| 3.29 | NEG | 20 | IgG ↓ 25% | |||||
| #1087 | 47 | F | 13.33 | - | - | Asymptomatic | ||
| 17.89 | NEG | 32 | IgG ↑ 34% | |||||
| #1342 | 30 | F | NEG | NEG | - | Asymptomatic | ||
| NEG | 2.18 | 3 | IgM + | |||||
| NEG | NEG | 7 | IgM − | |||||
| NEG | NEG | 68 | ||||||
| #1563 | 22 | F | 2.93 | NEG | - | Asymptomatic | ||
| 5.56 | NEG | 62 | IgG ↑ 47% | |||||
| #1781 | 58 | F | 4.10 | 1.11 | - | Asymptomatic | ||
| 4.51 | 1.49 | 58 | IgG ↑ 8%, IgM ↑ 25% | |||||
| #1796 | 52 | F | 1.39 | NEG | - | Asymptomatic | ||
| NEG | NEG | 102 | IgG − |
| COVID-19 Symptom Categories | Subjects with Comorbidities | Males | Subjects ≥ 50 Years Old | |||
|---|---|---|---|---|---|---|
| n | % | n | % | n | % | |
| A | 2 | 14.3 | 5 | 35.7 | 6 | 42.9 |
| B | 1 | 14.3 | 2 | 28.6 | 3 | 42.9 |
| C | 7 | 58.3 | 9 | 75.0 | 8 | 66.7 |
| D | 9 | 75.0 | 6 | 50.0 | 10 | 83.3 |
| E | 8 | 88.9 | 7 | 77.8 | 9 | 100.0 |
| p-value * | 0.0006 | 0.0933 | 0.0228 | |||
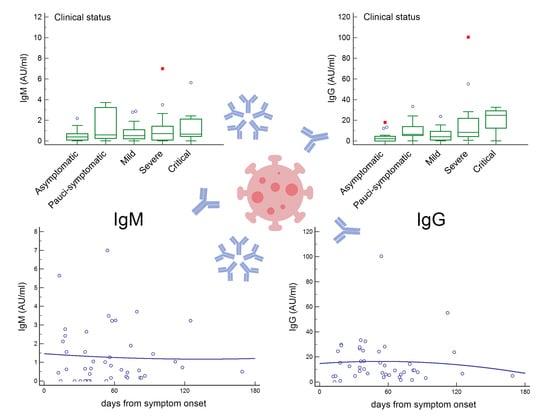
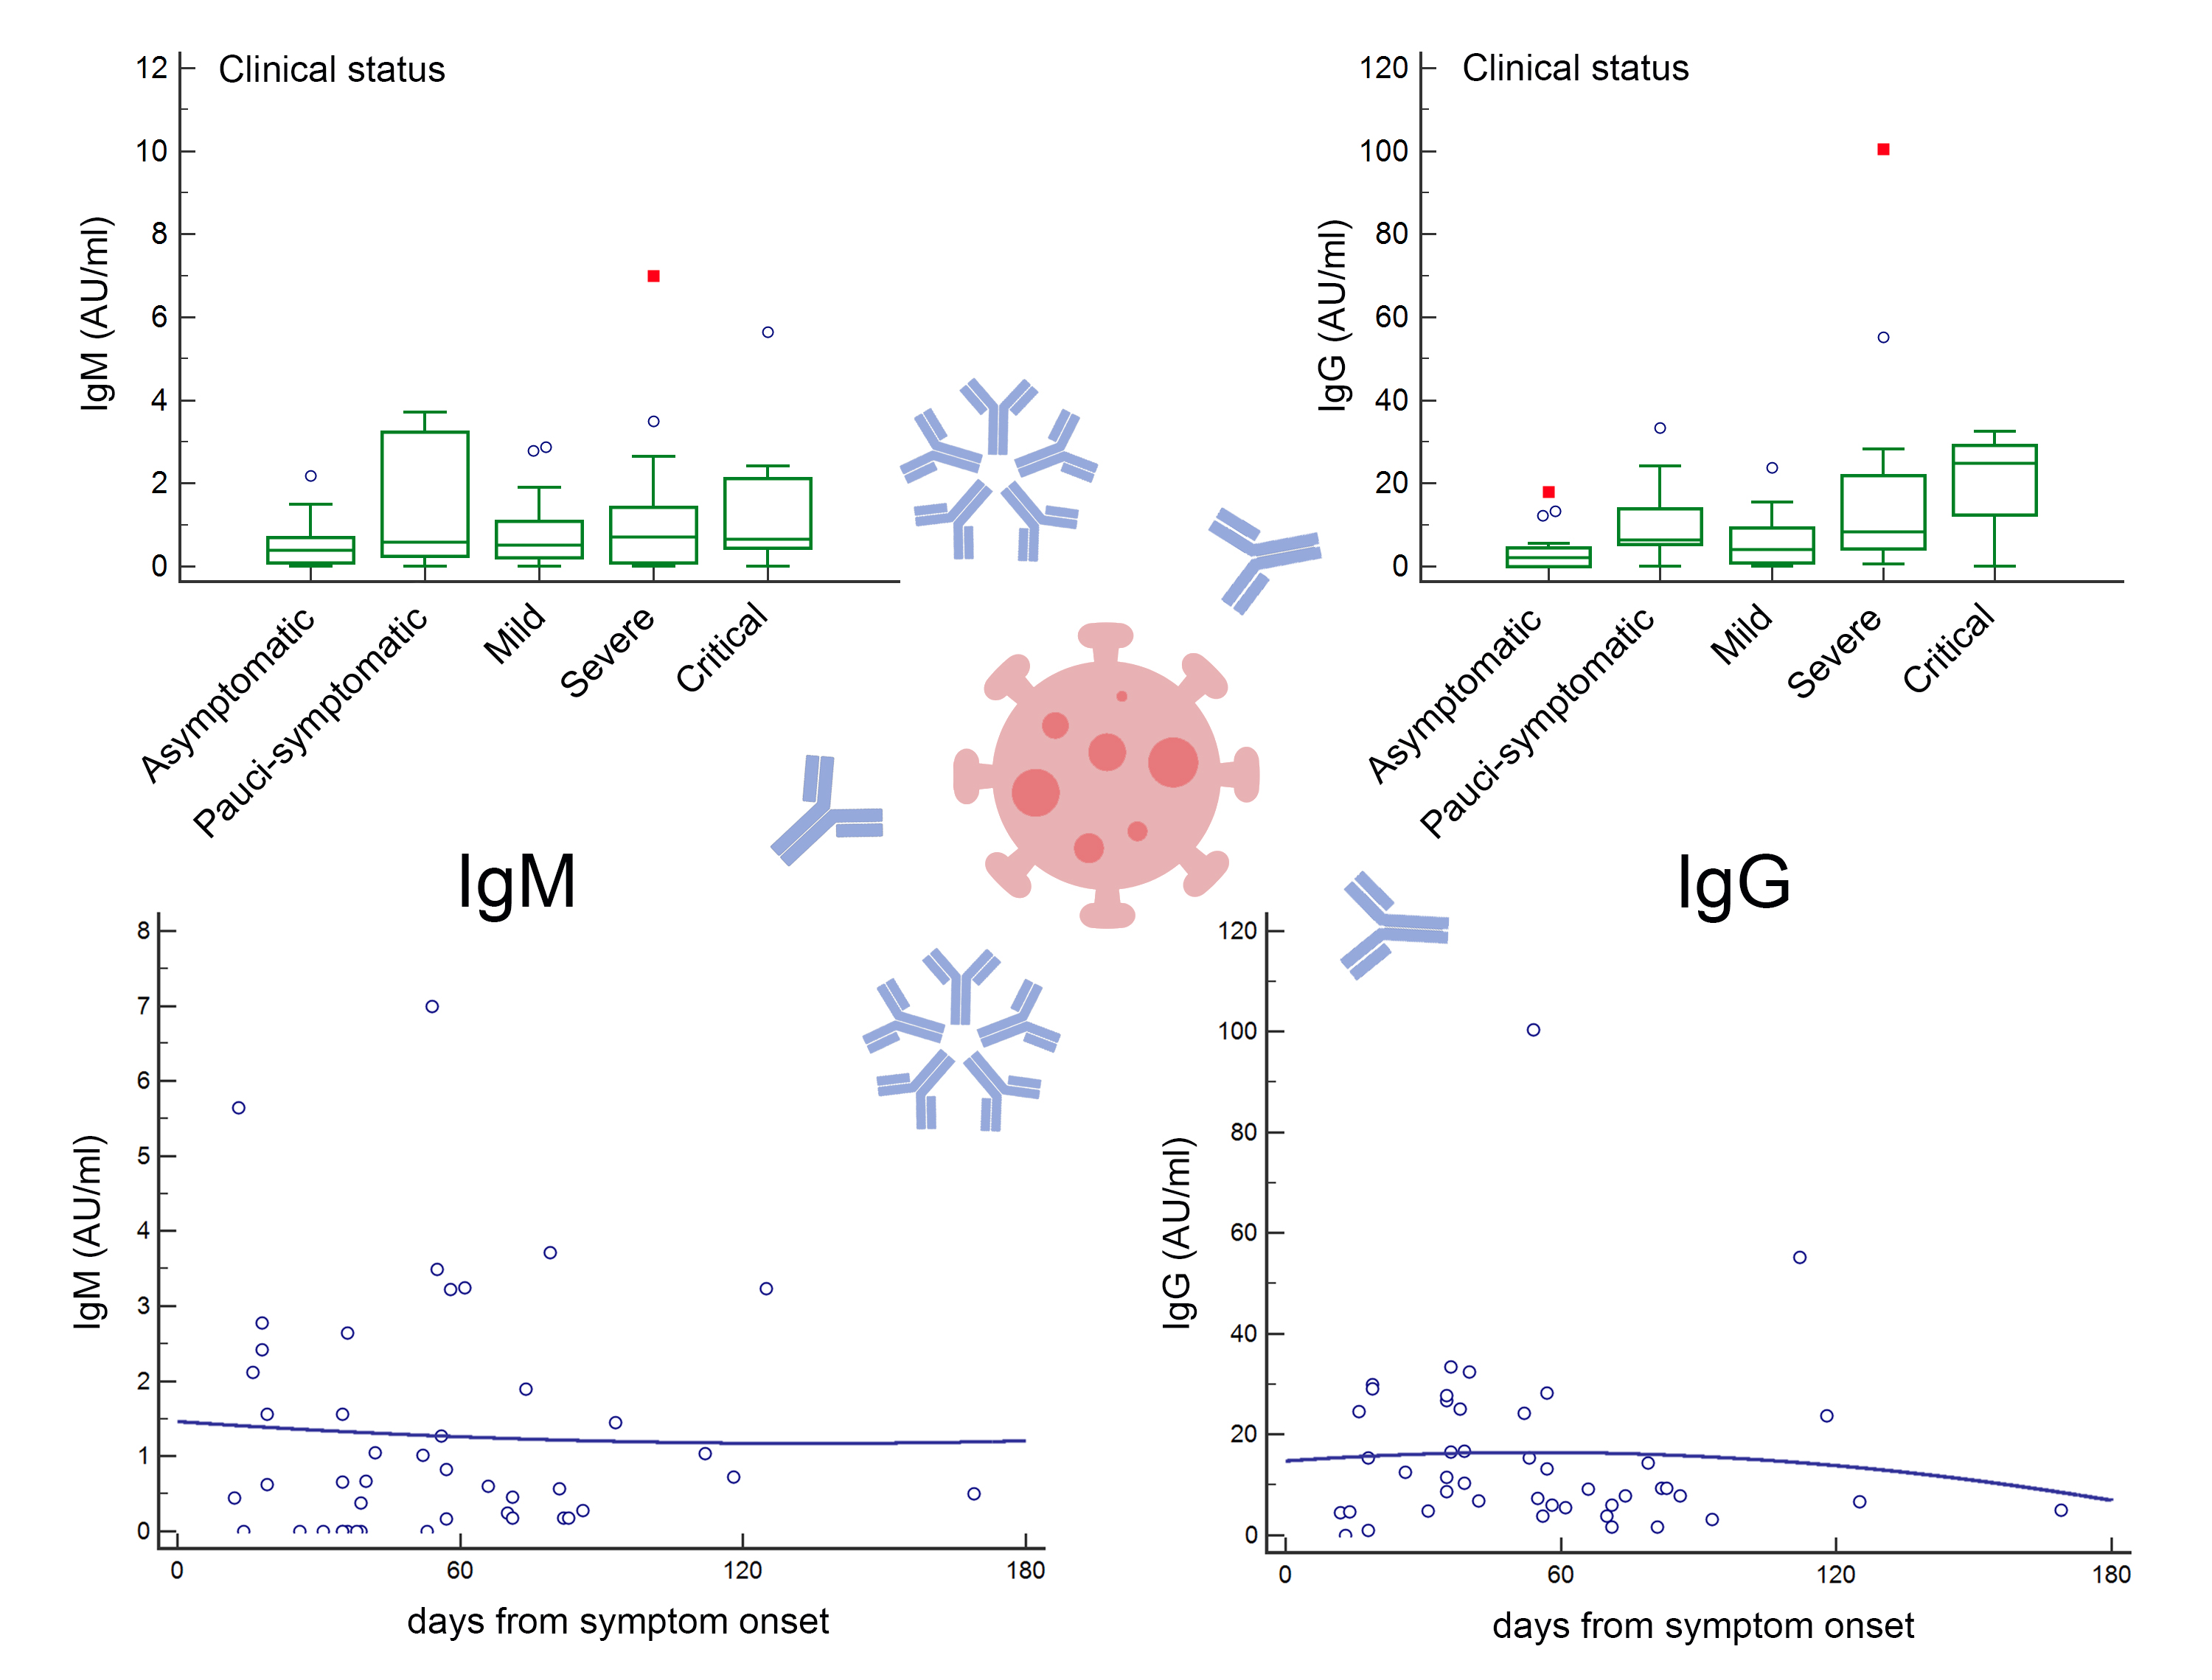
| Factor | Number of Tests | Mean IgM Titer ± SD (AU/mL) | Different (p < 0.05) from Factor * | Mean IgG Titer ± SD (AU/mL) | Different (p < 0.05) from Factor * |
|---|---|---|---|---|---|
| A | 22 | 0.53 ± 0.55 | - | 3.49 ± 4.94 | D, E |
| B | 12 | 1.38 ± 1.49 | - | 10.3 ± 9.85 | - |
| C | 16 | 0.84 ± 0.92 | - | 6.13 ± 6.59 | D |
| D | 16 | 1.29 ± 1.81 | - | 18.5 ± 26.0 | A, C |
| E | 10 | 1.41 ± 1.70 | - | 20.1 ± 11.4 | A |
Publisher’s Note: MDPI stays neutral with regard to jurisdictional claims in published maps and institutional affiliations. |
© 2021 by the authors. Licensee MDPI, Basel, Switzerland. This article is an open access article distributed under the terms and conditions of the Creative Commons Attribution (CC BY) license (http://creativecommons.org/licenses/by/4.0/).
Share and Cite
De Donno, A.; Lobreglio, G.; Panico, A.; Grassi, T.; Bagordo, F.; Bozzetti, M.P.; Massari, S.; Siculella, L.; Damiano, F.; Guerra, F.; et al. IgM and IgG Profiles Reveal Peculiar Features of Humoral Immunity Response to SARS-CoV-2 Infection. Int. J. Environ. Res. Public Health 2021, 18, 1318. https://doi.org/10.3390/ijerph18031318
De Donno A, Lobreglio G, Panico A, Grassi T, Bagordo F, Bozzetti MP, Massari S, Siculella L, Damiano F, Guerra F, et al. IgM and IgG Profiles Reveal Peculiar Features of Humoral Immunity Response to SARS-CoV-2 Infection. International Journal of Environmental Research and Public Health. 2021; 18(3):1318. https://doi.org/10.3390/ijerph18031318
Chicago/Turabian StyleDe Donno, Antonella, Giambattista Lobreglio, Alessandra Panico, Tiziana Grassi, Francesco Bagordo, Maria Pia Bozzetti, Serafina Massari, Luisa Siculella, Fabrizio Damiano, Francesco Guerra, and et al. 2021. "IgM and IgG Profiles Reveal Peculiar Features of Humoral Immunity Response to SARS-CoV-2 Infection" International Journal of Environmental Research and Public Health 18, no. 3: 1318. https://doi.org/10.3390/ijerph18031318
APA StyleDe Donno, A., Lobreglio, G., Panico, A., Grassi, T., Bagordo, F., Bozzetti, M. P., Massari, S., Siculella, L., Damiano, F., Guerra, F., Greco, M., Chicone, M., Lazzari, R., & Alifano, P. (2021). IgM and IgG Profiles Reveal Peculiar Features of Humoral Immunity Response to SARS-CoV-2 Infection. International Journal of Environmental Research and Public Health, 18(3), 1318. https://doi.org/10.3390/ijerph18031318