
Heterogeneous Urban Exposures and Prevalent Hypertension in the Helsinki Capital Region, Finland


 , ,
, ,  and
and
Abstract

1. Introduction
2. Materials and Methods
2.1. Exposure Assessment
2.1.1. Subjective Exposure Assessment
2.1.2. Objective Exposure Assessment
Estimation of Woodsmoke PM2.5
Estimation of Road-Traffic PM2.5
Estimation of Road-Traffic Noise
Estimation of Nature Spaces
2.2. Outcome Assessment
2.3. Covariates
2.4. Statistical Analysis
3. Results
3.1. Summaries and Correlation of Exposure Data
3.2. Associations between Environmental Exposures and Hypertension
4. Discussion
4.1. Woodsmoke Particulates and Antihypertensive Use
4.2. Road-Traffic Particulates and Antihypertensive Use
4.3. Nature Spaces and Antihypertensive Use
4.4. Sensitivity Analyses
4.5. Strengths and Weaknesses
5. Conclusions
Author Contributions
Funding
Institutional Review Board Statement
Informed Consent Statement
Conflicts of Interest
References
- Gruebner, O.; Rapp, M.A.; Adli, M.; Kluge, U.; Galea, S.; Heinz, A. Cities and Mental Health. Dtsch. Ärzteblatt Int. 2017, 114, 121–127. [Google Scholar] [CrossRef] [PubMed]
- Jackson, R.J. The Impact of the Built Environment on Health: An Emerging Field. Am. J. Public Health 2003, 93, 1382–1384. [Google Scholar] [CrossRef] [PubMed]
- UNEP. Air Pollution World’s Worst Environmental Health Risk; United Nations Environmental Programme Nairobi: Nairobi, Kenya, 2014. [Google Scholar]
- World Health Organization. Air Quality Guidelines for Europe, 2nd ed.; European Series, No. 91; World Health Organization Regional Office for Europe: Copenhagen, Denmark, 2000. [Google Scholar]
- Brook, R.D. Is Air Pollution a Cause of Cardiovascular Disease? Updated Review and Controversies. Rev. Environ. Health 2007, 2, 115–138. [Google Scholar] [CrossRef] [PubMed]
- Hadley, M.B.; Vedanthan, R.; Fuster, V. Air Pollution and Cardiovascular Disease: A Window of Opportunity. Nat. Rev. Cardiol. 2018, 15, 193–194. [Google Scholar] [CrossRef]
- Lee, B.-J.; Kim, B.; Lee, K. Air Pollution Exposure and Cardiovascular Disease. Toxicol. Res. 2014, 30, 71–75. [Google Scholar] [CrossRef]
- Lin, H.; Guo, Y.; Zheng, Y.; Di, Q.; Liu, T.; Xiao, J.; Li, X.; Zeng, W.; Cummings-Vaughn, L.A.; Howard, S.W.; et al. Long-Term Effects of Ambient PM2.5 on Hypertension and Blood Pressure and Attributable Risk Among Older Chinese Adults. Hypertension 2017, 69, 806–812. [Google Scholar] [CrossRef] [PubMed]
- Zanobetti, A.; Canner, M.J.; Stone, P.H.; Schwartz, J.; Sher, D.; Eagan-Bengston, E.; Gates, K.A.; Hartley, L.H.; Suh, H.; Gold, D.R. Ambient Pollution and Blood Pressure in Cardiac Rehabilitation Patients. Circulation 2004, 110, 2184–2189. [Google Scholar] [CrossRef] [PubMed]
- Huang, K.; Yang, X.; Liang, F.; Liu, F.; Li, J.; Xiao, Q.; Chen, J.; Liu, X.; Cao, J.; Shen, C.; et al. Long-Term Exposure to Fine Particulate Matter and Hypertension Incidence in China. Hypertension 2019, 73, 1195–1201. [Google Scholar] [CrossRef] [PubMed]
- Zhang, Z.; Laden, F.; Forman, J.P.; Hart, J.E. Long-Term Exposure to Particulate Matter and Self-Reported Hypertension: A Prospective Analysis in the Nurses’ Health Study. Environ. Health Perspect. 2016, 124, 1414–1420. [Google Scholar] [CrossRef] [PubMed]
- Liang, R.; Zhang, B.; Zhao, X.; Ruan, Y.; Lian, H.; Fan, Z. Effect of Exposure to pm 2.5 on Blood Pressure: A Systematic Review and Meta-Analysis. J. Hypertens 2014, 32, 2130–2141. [Google Scholar] [CrossRef]
- Chiu, H.-F.; Tsai, S.-S.; Yang, C.-Y. Short-Term Effects of Fine Particulate Air Pollution on Hospital Admissions for Hypertension: A Time-Stratified Case-Crossover Study in Taipei. J. Toxicol. Environ. Health 2017, 80, 258–265. [Google Scholar] [CrossRef] [PubMed]
- Fuks, K.B.; Weinmayr, G.; Basagaña, X.; Gruzieva, O.; Hampel, R.; Oftedal, B.; Sørensen, M.; Wolf, K.; Aamodt, G.; Aasvang, G.M.; et al. Long-term exposure to ambient air pollution and traffic noise and incident hypertension in seven cohorts of the European study of cohorts for air pollution effects (ESCAPE). Eur. Heart J. 2017, 38, 983–990. [Google Scholar] [CrossRef] [PubMed]
- Savolahti, M.; Karvosenoja, N.; Tissari, J.; Kupiainen, K.; Sippula, O.; Jokiniemi, J. Black Carbon and Fine Particle Emissions in Finnish Residential Wood Combustion: Emission Projections, Reduction Measures and the Impact of Combustion Practices. Atmos. Environ. 2016, 140, 495–505. [Google Scholar] [CrossRef]
- Kukkonen, J.; Kangas, L.; Kauhaniemi, M.; Sofiev, M.; Aarnio, M.; Jaakkola, J.J.K.; Kousa, A.; Karppinen, A. Modelling of the Urban Concentrations of PM 2.5 on a High Resolution for a Period of 35 Years, for the Assessment of Lifetime Exposure and Health Effects. Atmos. Chem. Phys. 2018, 18, 8041–8064. [Google Scholar] [CrossRef]
- Naeher, L.P.; Brauer, M.; Lipsett, M.; Zelikoff, J.T.; Simpson, C.D.; Koenig, J.Q.; Smith, K.R. Woodsmoke Health Effects: A Review. Inhal. Toxicol. 2007, 19, 67–106. [Google Scholar] [CrossRef]
- World Health Organization. Residential Heating with Wood and Coal: Health Impacts and Policy Options in Europe and North America; WHO Regional Office for Europe: Geneva, Switzerland, 2015. [Google Scholar]
- Zelikoff, J.; Chen, L.-C.; Cohen, M.D.; Schlesinger, R. The Toxicology of Inhaled Woodsmoke. J. Toxicol. Environ. Health B Crit. Rev. 2002, 5, 269–282. [Google Scholar] [CrossRef]
- Siponen, T.; Yli-Tuomi, T.; Tiittanen, P.; Taimisto, P.; Pekkanen, J.; Salonen, R.O.; Lanki, T. Wood Stove Use and Other Determinants of Personal and Indoor Exposures to Particulate Air Pollution and Ozone among Elderly Persons in a Northern Suburb. Indoor Air 2019, 29, 413–422. [Google Scholar] [CrossRef]
- Kim, E.; Larson, T.V.; Hopke, P.K.; Slaughter, C.; Sheppard, L.E.; Claiborn, C. Source Identification of PM2.5 in an Arid Northwest, U.S. City by Positive Matrix Factorization. Atmos. Res. 2003, 66, 291–305. [Google Scholar] [CrossRef]
- Davidson, C.I.; Phalen, R.F.; Solomon, P.A. Airborne Particulate Matter and Human Health: A Review. Aerosol Sci. Technol. 2005, 39, 737–749. [Google Scholar] [CrossRef]
- World Health Organization. Human Exposure Assessment: An Introduction. Contract No.: Environmental Health Criteria 214; Swedish Environmental Protection Agency and Karolinska Institute; World Health Organization: Geneva, Switzerland, 2000. [Google Scholar]
- World Health Organization. Burden of Disease from Environmental Noise: Quantification of Healthy Life Years Lost in Europe; World Health Organization: Geneva, Switzerland, 2011. [Google Scholar]
- MacNee, W.; Donaldson, K. Mechanism of Lung Injury Caused by PM10 and Ultrafine Particles with Special Reference to COPD. Eur. Respir. J. Suppl. 2003, 40, 47s–51s. [Google Scholar] [CrossRef]
- Schwarze, P.E.; Ovrevik, J.; Lag, M.; Refsnes, M.; Nafstad, P.; Hetland, R.B.; Dybing, E. Particulate Matter Properties and Health Effects: Consistency of Epidemiological and Toxicological Studies. Hum. Exp. Toxicol. 2006, 25, 559–579. [Google Scholar] [CrossRef] [PubMed]
- Pope, C.A.; Bhatnagar, A.; McCracken, J.P.; Abplanalp, W.; Conklin, D.J.; O’Toole, T. Exposure to Fine Particulate Air Pollution Is Associated With Endothelial Injury and Systemic Inflammation. Circ. Res. 2016, 119, 1204–1214. [Google Scholar] [CrossRef] [PubMed]
- Unosson, J.; Blomberg, A.; Sandstrom, T.; Muala, A.; Boman, C.; Nystrom, R.; Westerholm, R.; Mills, N.L.; Newby, D.E.; Langrish, J.P.; et al. Exposure to Wood Smoke Increases Arterial Stiffness and Decreases Heart Rate Variability in Humans. Part. Fibre Toxicol. 2013, 10, 20. [Google Scholar] [CrossRef] [PubMed]
- Brook, R.D.; Rajagopalan, S.; Pope, C.A., 3rd; Brook, J.R.; Bhatnagar, A.; Diez-Roux, A.V.; Holguin, F.; Hong, Y.; Luepker, R.V.; Mittleman, M.A.; et al. Particulate Matter Air Pollution and Cardiovascular Disease: An Update to the Scientific Statement from the American Heart Association. Circulation 2010, 121, 2331–2378. [Google Scholar] [CrossRef] [PubMed]
- Westman, J.C.; Walters, J.R. Noise and Stress: A Comprehensive Approach. Environ. Health Perspect. 1981, 41, 291–309. [Google Scholar] [CrossRef]
- Tétreault, L.-F.; Perron, S.; Smargiassi, A. Cardiovascular Health, Traffic-Related Air Pollution and Noise: Are Associations Mutually Confounded? a Systematic Review. Int. J. Public Health 2013, 58, 649–666. [Google Scholar] [CrossRef]
- Branas, C.C.; Cheney, R.A.; MacDonald, J.M.; Tam, V.W.; Jackson, T.D.; Ten Have, T.R. A Difference-In-Differences Analysis of Health, Safety, and Greening Vacant Urban Space. Am. J. Epidemiol. 2011, 174, 1296–1306. [Google Scholar] [CrossRef]
- de Keijzer, C.; Tonne, C.; Sabia, S.; Basagana, X.; Valentin, A.; Singh-Manoux, A.; Anto, J.M.; Alonso, J.; Nieuwenhuijsen, M.J.; Sunyer, J.; et al. Green and Blue Spaces and Physical Functioning in Older Adults: Longitudinal Analyses of the Whitehall II Study. Environ. Int. 2019, 122, 346–356. [Google Scholar] [CrossRef]
- Lee, A.C.K.; Jordan, H.C.; Horsley, J. Value of Urban Green Spaces in Promoting Healthy Living and Wellbeing: Prospects for Planning. Risk Manag. Healthc. Policy 2015, 8, 131–137. [Google Scholar] [CrossRef]
- Mukherjee, D.; Safraj, S.; Tayyab, M.; Shivashankar, R.; Patel, S.A.; Narayanan, G.; Ajay, V.S.; Ali, M.K.; Narayan, K.V.; Tandon, N.; et al. Park availability and major depression in individuals with chronic conditions: Is there an association in urban India? Health Place 2017, 47, 54–62. [Google Scholar] [CrossRef]
- Ojala, A.; Korpela, K.; Tyrväinen, L.; Tiittanen, P.; Lanki, T. Restorative Effects of Urban Green Environments and the Role of Urban-Nature Orientedness and Noise Sensitivity: A Field Experiment. Health Place 2019, 55, 59–70. [Google Scholar] [CrossRef] [PubMed]
- Astell-Burt, T.; Feng, X.; Kolt, G.S. Mental Health Benefits of Neighbourhood Green Space Are Stronger Among Physically Active Adults in Middle-To-Older Age: Evidence from 260,061 Australians. Prev. Med. 2013, 57, 601–606. [Google Scholar] [CrossRef] [PubMed]
- Gascon, M.; Triguero-Mas, M.; Martínez, D.; Dadvand, P.; Forns, J.; Plasència, A.; Nieuwenhuijsen, M.J. Mental Health Benefits of Long-Term Exposure to Residential Green and Blue Spaces: A Systematic Review. Int. J. Environ. Res. Public Health 2015, 12, 4354–4379. [Google Scholar] [CrossRef] [PubMed]
- Richardson, E.A.; Pearce, J.; Mitchell, R.; Kingham, S. Role of Physical Activity in the Relationship Between Urban Green Space and Health. Public Health 2013, 127, 318–324. [Google Scholar] [CrossRef] [PubMed]
- Lee, A.C.K.; Maheswaran, R. The Health Benefits of Urban Green Spaces: A Review of the Evidence. J. Public Health 2010, 33, 212–222. [Google Scholar] [CrossRef]
- Tamosiunas, A.; Grazuleviciene, R.; Luksiene, D.; Dedele, A.; Reklaitiene, R.; Baceviciene, M.; Vencloviene, J.; Bernotiene, G.; Radisauskas, R.; Malinauskiene, V.; et al. Accessibility and Use of Urban Green Spaces, and Cardiovascular Health: Findings from a Kaunas Cohort Study. Environ. Health 2014, 13, 20. [Google Scholar] [CrossRef]
- Moreira, T.C.L.; Polizel, J.L.; Santos, I.S.; Silva Filho, D.F.; Bensenor, I.; Lotufo, P.A.; Mauad, T. Green Spaces, Land Cover, Street Trees and Hypertension in the Megacity of São Paulo. Int. J. Environ. Res. Public Health 2020, 17, 725. [Google Scholar] [CrossRef]
- Lanki, T.; Siponen, T.; Ojala, A.; Korpela, K.; Pennanen, A.; Tiittanen, P.; Tsunetsugu, Y.; Kagawa, T.; Tyrvainen, L. Acute Effects of Visits to Urban Green Environments on Cardiovascular Physiology in Women: A Field Experiment. Environ. Res. 2017, 159, 176–185. [Google Scholar] [CrossRef]
- Twohig-Bennett, C.; Jones, A. The Health Benefits of the Great Outdoors: A Systematic Review and Meta-Analysis of Greenspace Exposure and Health Outcomes. Environ. Res. 2018, 166, 628–637. [Google Scholar] [CrossRef]
- Markevych, I.; Thiering, E.; Fuertes, E.; Sugiri, D.; Berdel, D.; Koletzko, S.; von Berg, A.; Bauer, C.-P.; Heinrich, J. A Cross-Sectional Analysis of the Effects of Residential Greenness on Blood Pressure in 10-Year Old Children: Results From the Giniplus and Lisaplus Studies. BMC Public Health 2014, 14, 477. [Google Scholar] [CrossRef]
- Okokon, E.O.; Yli-Tuomi, T.; Turunen, A.W.; Tiittanen, P.; Juutilainen, J.; Lanki, T. Traffic Noise, Noise Annoyance and Psychotropic Medication Use. Environ. Int. 2018, 119, 287–294. [Google Scholar] [CrossRef] [PubMed]
- Hannuniemi, H.; Salmi, J.; Rasila, T.; Wemberg, A.; Komppula, B.; Lovén, K.; Pietarila, H. Pääkaupunkiseudun Päästöjen Leviämismalliselvitys. Autoliikenteen, Energiantuotannon, Laivaliikenteen ja Lentoliikenteen Typenoksidi-, Pienhiukkas- ja Rikkidioksidipäästöjen Leviämismallinnus; Ilmatieteen Laitos, Asiantuntijapalvelut, Ilmanlaatu ja Energia: Helsinki, Finland, 2016; 47 sivua + 27 liitesivua. [Google Scholar]
- Kephalopoulos, S.; Paviotti, M.; Anfosso-Lédée, F. Common Noise Assessment Methods in Europe (CNOSSOS-EU). In EUR 25379 EN; Publications Office of the European Union: Luxembourg, 2012; 180p. [Google Scholar]
- Fuks, K.B.; Weinmayr, G.; Foraster, M.; Dratva, J.; Hampel, R.; Houthuijs, D.; Oftedal, B.; Oudin, A.; Panasevich, S.; Penell, J.; et al. Arterial Blood Pressure and Long-Term Exposure to Traffic-Related Air Pollution: An Analysis in the European Study of Cohorts for Air Pollution Effects (ESCAPE). Environ. Health Perspect. 2014, 122, 896–905. [Google Scholar] [CrossRef] [PubMed]
- Ministry of Education and Culture. The Finnish Educational System. Available online: https://minedu.fi/en/education-system (accessed on 9 June 2020).
- R Core Team. R: A Language and Environment for Statistical Computing; R Foundation for Statistical Computing: Vienna, Austria, 2017. [Google Scholar]
- McCracken, J.P.; Smith, K.R.; Díaz, A.; Mittleman, M.A.; Schwartz, J. Chimney Stove Intervention to Reduce Long-Term Wood Smoke Exposure Lowers Blood Pressure Among Guatemalan Women. Environ. Health Perspect. 2007, 115, 996–1001. [Google Scholar] [CrossRef] [PubMed]
- Allen, R.W.; Carlsten, C.; Karlen, B.; Leckie, S.; van Eeden, S.; Vedal, S.; Wong, I.; Brauer, M. An Air Filter Intervention Study of Endothelial Function among Healthy Adults in a Woodsmoke-impacted Community. Am. J. Respir. Crit. Care Med. 2011, 183, 1222–1230. [Google Scholar] [CrossRef]
- Clark, M.L.; Bazemore, H.; Reynolds, S.J.; Heiderscheidt, J.M.; Conway, S.; Bachand, A.M.; Volckens, J.; Peel, J.L. A Baseline Evaluation of Traditional Cook Stove Smoke Exposures and Indicators of Cardiovascular and Respiratory Health among Nicaraguan Women. Int. J. Occup. Environ. Health 2011, 17, 113–121. [Google Scholar] [CrossRef]
- Bølling, A.K.; Pagels, J.; Yttri, K.E.; Barregard, L.; Sallsten, G.; Schwarze, P.E.; Boman, C. Health Effects of Residential Wood Smoke Particles: The Importance of Combustion Conditions and Physicochemical Particle Properties. Part. Fibre Toxicol. 2009, 6, 29. [Google Scholar] [CrossRef]
- Kukkonen, J.; Karl, M.; Keuken, M.; Denier van der Gon, H.; Denby, B.; Singh, V.; Douros, J.; Manders, A.; Samaras, Z.; Moussiopoulos, N.; et al. Modelling the Dispersion of Particle Numbers in Five European Cities. Geosci. Model Dev. 2015, 8, 5873–5930. [Google Scholar] [CrossRef]
- Kukkonen, J.; Lopez-Aparicio, S.; Segersson, D.; Geels, C.; Kangas, L.; Kauhaniemi, M.; Maragkidou, A.; Jensen, A.; Assmuth, T.; Karppinen, A.; et al. The Influence of Residential Wood Combustion on the Concentrations of PM2.5 in Four Nordic Cities. Atmos. Chem. Phys. 2019, 20, 4333–4365. [Google Scholar] [CrossRef]
- Auchincloss, A.H.; Diez Roux, A.V.; Dvonch, J.T.; Brown, P.L.; Barr, R.G.; Daviglus, M.L.; Goff, D.C.; Kaufman, J.D.; O’Neill, M.S. Associations Between Recent Exposure to Ambient Fine Particulate Matter and Blood Pressure in the Multi-Ethnic Study of Atherosclerosis (MESA). Environ. Health Perspect. 2008, 116, 486–491. [Google Scholar] [CrossRef] [PubMed]
- Dvonch, J.T.; Kannan, S.; Schulz, A.J.; Keeler, G.J.; Mentz, G.; House, J.; Benjamin, A.; Max, P.; Bard, R.L.; Brook, R.D. Acute Effects of Ambient Particulate Matter on Blood Pressure. Hypertension 2009, 53, 853–859. [Google Scholar] [CrossRef]
- Pitchika, A.; Hampel, R.; Wolf, K.; Kraus, U.; Cyrys, J.; Babisch, W.; Peters, A.; Schneider, A. Long-Term Associations of Modeled and Self-Reported Measures of Exposure to Air Pollution and Noise at Residence on Prevalent Hypertension and Blood Pressure. Sci. Total Environ. 2017, 593–594, 337–346. [Google Scholar] [CrossRef] [PubMed]
- Huang, W.; Wang, L.; Li, J.; Liu, M.; Xu, H.; Liu, S.; Chen, J.; Zhang, Y.; Morishita, M.; Bard, R.L.; et al. Short-Term Blood Pressure Responses to Ambient Fine Particulate Matter Exposures at the Extremes of Global Air Pollution Concentrations. Am. J. Hypertens. 2018, 31, 590–599. [Google Scholar] [CrossRef] [PubMed]
- Kannan, S.; Dvonch, J.T.; Schulz, A.J.; Israel, B.A.; Mentz, G.; House, J.; Max, P.; Reyes, A.G. Exposure to Fine Particulate Matter and Acute Effects on Blood Pressure: Effect Modification by Measures of Obesity and Location. J. Epidemiol. Community Health 2010, 64, 68. [Google Scholar] [CrossRef] [PubMed]
- Hicken, M.T.; Timothy Dvonch, J.; Schulz, A.; Mentz, G.; Max, P. Fine Particulate Matter Air Pollution and Blood Pressure: The Modifying Role of Psychosocial Stress. Environ. Res. 2014, 133C, 195–203. [Google Scholar] [CrossRef] [PubMed]
- Yang, B.-Y.; Markevych, I.; Bloom, M.S.; Heinrich, J.; Guo, Y.; Morawska, L.; Dharmage, S.C.; Knibbs, L.D.; Jalaludin, B.; Jalava, P.; et al. Community Greenness, Blood Pressure, and Hypertension in Urban Dwellers: The 33 Communities Chinese Health Study. Environ. Int. 2019, 126, 727–734. [Google Scholar] [CrossRef]
- Jia, X.; Yu, Y.; Xia, W.; Masri, S.; Sami, M.; Hu, Z.; Yu, Z.; Wu, J. Cardiovascular Diseases in Middle Aged and Older Adults in China: The Joint Effects and Mediation of Different Types of Physical Exercise and Neighborhood Greenness and Walkability. Environ. Res. 2018, 167, 175–183. [Google Scholar] [CrossRef]

| Total N a | % | Not Using Antihypertensives | Used Antihypertensives in Preceding Week | |||
|---|---|---|---|---|---|---|
| n b | % | n | % | |||
| Sex | 5441 | 100 | ||||
| females | 3095 | 56.9 | 2330 | 57.7 | 765 | 54.4 |
| males | 2346 | 43.1 | 1706 | 42.3 | 640 | 45.6 |
| Age (years) c | 5441 | 56.6 | 49.6 | 15.0 | 66.3 | 11.8 |
| BMI (kg/m2) | 5441 | |||||
| 14–25 | 2667 | 49.0 | 2252 | 55.8 | 415 | 29.5 |
| 25.01–30 | 1949 | 35.8 | 1341 | 33.2 | 608 | 43.3 |
| >30 | 825 | 15.2 | 443 | 11.0 | 382 | 27.2 |
| Smoker | 5441 | |||||
| no | 4572 | 84.0 | 3384 | 83.8 | 1188 | 84.6 |
| yes | 869 | 16.0 | 652 | 16.2 | 217 | 15.4 |
| Passive smoker | 5441 | |||||
| no | 4493 | 82.6 | 3374 | 83.6 | 1119 | 79.6 |
| yes | 948 | 17.4 | 662 | 16.4 | 286 | 20.4 |
| Employment status | 5441 | |||||
| fulltime | 2880 | 52.9 | 2490 | 61.7 | 390 | 27.8 |
| part-time/student | 436 | 8.0 | 373 | 9.2 | 63 | 4.5 |
| retired/homemaker | 1868 | 34.3 | 971 | 24.1 | 897 | 63.8 |
| unemployed | 257 | 4.7 | 202 | 5.0 | 55 | 3.9 |
| Annual household income before tax | 5441 | |||||
| ≤€30,000 | 1384 | 25.4 | 913 | 22.6 | 471 | 33.5 |
| €30,001–€50,000 | 1376 | 25.3 | 1010 | 25.0 | 366 | 26.0 |
| €50,001–€70,000 | 961 | 17.7 | 707 | 17.5 | 254 | 18.1 |
| >€70,000 | 1720 | 31.6 | 1406 | 34.8 | 314 | 22.3 |
| Use of summer cottage | 5441 | |||||
| 0–13 days | 3573 | 65.7 | 2739 | 67.9 | 834 | 59.4 |
| 14 days–2 months | 1402 | 25.8 | 1026 | 25.4 | 376 | 26.8 |
| >2 months | 466 | 8.6 | 271 | 6.7 | 195 | 13.9 |
| Area-level mean income per €1000 | 5441 | 27.2 | 27.2 c | 5.7 d | 27.2 c | 5.8 d |
| Area-level unemployment rate (%) c | 5441 | 6.0 c | 6.0 | 1.6 d | 6.2 | 1.6 d |
| Wood-burning frequency | 5441 | |||||
| never | 4752 | 87.5 | 3523 | 87.3 | 1229 | 87.5 |
| 1–2 time/week | 350 | 6.4 | 256 | 6.3 | 94 | 6.7 |
| >2 time/week | 339 | 6.2 | 257 | 6.4 | 82 | 5.8 |
| % Coverage of green space within 1 km | 5441 | 32.1 c | 32.2 c | 15.0 d | 32.0 c | 14.1 d |
| % Coverage of blue space | 5441 | |||||
| 0–1 | 2968 | 54.5 | 2197 | 54.4 | 771 | 54.9 |
| 1.01–4 | 1267 | 23.3 | 937 | 23.2 | 330 | 23.5 |
| >4 | 1206 | 22.2 | 902 | 22.3 | 304 | 21.6 |
| Exposures | Mean (SD) | Minimum | Percentile | Maximum | Wood Smoke PM2.5 | Road-Traffic PM2.5 | Road-Traffic Noise | Coverage of Green within 1 km | Coverage of Blue Space | ||
|---|---|---|---|---|---|---|---|---|---|---|---|
| 25th | 50th | 75th | |||||||||
| Wood smoke PM2.5 [µg/m3] | 0.53 (0.21) | 0.07 | 0.37 | 0.52 | 0.67 | 1.12 | 1 | −0.26 a | 0.06 a | 0.15 a | −0.43 a |
| Road-traffic PM2.5 [µg/m3] | 0.58 (0.37) | 0.00 | 0.32 | 0.49 | 0.76 | 2.77 | 1 | 0.51 a | −0.3 a | −0.11 a | |
| Road-traffic noise [dB] b | 54.04 (54.91) | 29.97 | 51.02 | 50.02 | 55.92 | 75.40 | 1 | −0.12 a | −0.16 a | ||
| % coverage of green space within 1 km | 32.13 (14.77) | 3.27 | 21.96 | 30.70 | 40.67 | 94.37 | 1 | −0.34 a | |||
| % coverage of blue space | 4.56 (10.15) | 0.00 | 0.00 | 0.00 | 2.63 | 75.02 | 1 | ||||
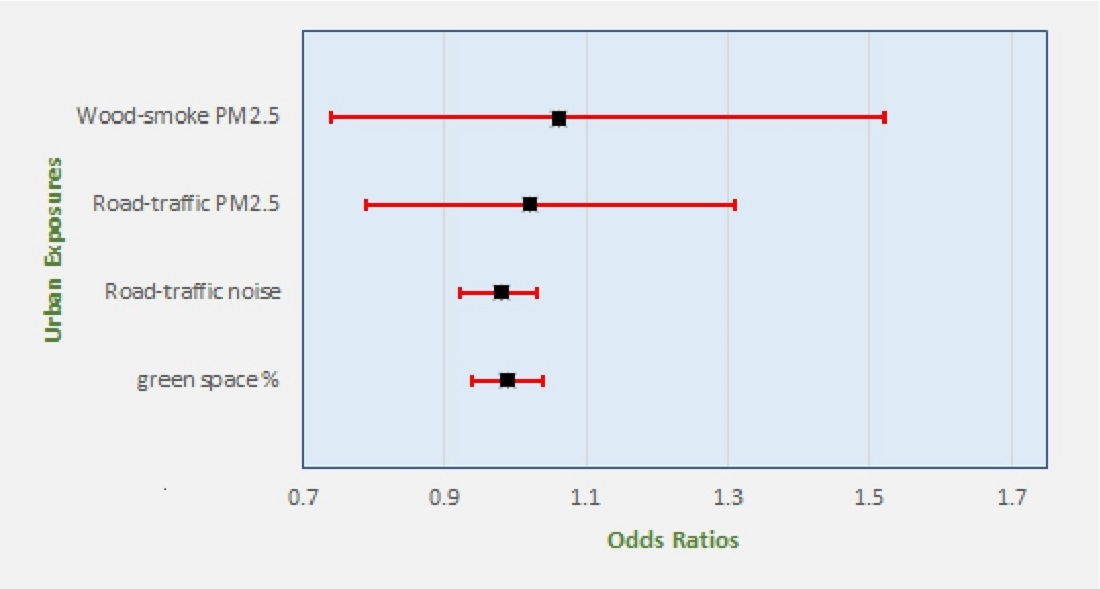
| Exposures | Crude Model a | Main Model b | Single-Exposure Model c |
|---|---|---|---|
| OR (95% CI) | OR (95% CI) | OR (95% CI) | |
| Wood-smoke PM2.5 | 1.06 (0.74–1.52) | 1.12 (0.78–1.57) | 1.10 (0.79–1.54) |
| Road-traffic PM2.5 | 1.02 (0.79–1.31) | 0.97 (0.76–1.26) | 0.92 (0.75–1.12) |
| Road-traffic noise d | 0.98 (0.92–1.03) | 0.98 (0.93–1.04) | 0.98 (0.93–1.03) |
| % coverage of green space within 1 km e | 0.99 (0.94–1.04) | 0.99 (0.94–1.04) | 0.98 (0.93–1.03) |
| Exposures | Sensitivity Model-1 a | Sensitivity Model-2 b | Sensitivity Model-3 c | Sensitivity Model-4 d | Sensitivity Model-5 e |
|---|---|---|---|---|---|
| OR (95% CI) | OR (95% CI) | OR (95% CI) | |||
| Wood-smoke PM2.5 | 1.05 (0.69–1.60) | 1.14 (0.79–1.65) | 1.13 (0.79–1.63) | 1.06 (0.73–1.54) | 1.15 (0.79–1.66) |
| Road-traffic PM2.5 | 0.96 (0.74–1.25) | 0.97 (0.75–1.25) | 0.99 (0.77–1.28) | 1.00 (0.77–1.30) | 1.03 (0.80–1.33) |
| Road-traffic noise f | 0.97 (0.92–1.03) | 0.98 (0.93–1.04) | 0.98 (0.93–1.04) | 0.97 (0.92–1.03) | 0.97 (0.92–1.03) |
| % Coverage of green space within 1 km g | 0.98 (0.93–1.04) | 0.99 (0.94–1.05) | - | 0.98 (0.93- 1.03) | 0.99 (0.94–1.04) |
| % Coverage of green space within 300 m g | 1.01 (0.96–1.06) | ||||
| % Coverage of blue space within 1 km | |||||
| 0–1 | 1 | - | - | - | - |
| 1.01–4 | 1.06 (0.84–1.33) | - | - | - | - |
| >4 | 1.03 (0.80–1.33) | - | - | - | - |
| Wood burning frequency | |||||
| never | - | 1 | - | - | - |
| 1–2 times/week | - | 1.03 (0.77–1.38) | - | - | - |
| >2 times/week | - | 0.85 (0.63–1.15) | - | - | - |
| Exposures | Crude Model a | Main Model b | Single-Exposure Model c |
|---|---|---|---|
| OR (95% CI) | OR (95% CI) | OR (95% CI) | |
| Wood smoke PM2.5 | 0.82 (0.58 1.16) | 0.84 (0.59 1.19) | 0.84 (0.61 1.17) |
| Road-traffic PM2.5 | 1.04 (0.82 1.32) | 0.99 (0.78 1.27) | 1.00 (0.82 1.21) |
| Road-traffic noise d | 0.98 (0.93 1.04) | 0.99 (0.94 1.04) | 0.99 (0.94 1.03) |
| % Coverage of green space within 1 km e | 0.98 (0.93 1.03) | 0.99 (0.94 1.04) | 0.98 (0.93 1.02) |
Publisher’s Note: MDPI stays neutral with regard to jurisdictional claims in published maps and institutional affiliations. |
© 2021 by the authors. Licensee MDPI, Basel, Switzerland. This article is an open access article distributed under the terms and conditions of the Creative Commons Attribution (CC BY) license (http://creativecommons.org/licenses/by/4.0/).
Share and Cite
Okokon, E.O.; Yli-Tuomi, T.; Siponen, T.; Tiittanen, P.; Turunen, A.W.; Kangas, L.; Karppinen, A.; Kukkonen, J.; Lanki, T. Heterogeneous Urban Exposures and Prevalent Hypertension in the Helsinki Capital Region, Finland. Int. J. Environ. Res. Public Health 2021, 18, 1196. https://doi.org/10.3390/ijerph18031196
Okokon EO, Yli-Tuomi T, Siponen T, Tiittanen P, Turunen AW, Kangas L, Karppinen A, Kukkonen J, Lanki T. Heterogeneous Urban Exposures and Prevalent Hypertension in the Helsinki Capital Region, Finland. International Journal of Environmental Research and Public Health. 2021; 18(3):1196. https://doi.org/10.3390/ijerph18031196
Chicago/Turabian StyleOkokon, Enembe O., Tarja Yli-Tuomi, Taina Siponen, Pekka Tiittanen, Anu W. Turunen, Leena Kangas, Ari Karppinen, Jaakko Kukkonen, and Timo Lanki. 2021. "Heterogeneous Urban Exposures and Prevalent Hypertension in the Helsinki Capital Region, Finland" International Journal of Environmental Research and Public Health 18, no. 3: 1196. https://doi.org/10.3390/ijerph18031196
APA StyleOkokon, E. O., Yli-Tuomi, T., Siponen, T., Tiittanen, P., Turunen, A. W., Kangas, L., Karppinen, A., Kukkonen, J., & Lanki, T. (2021). Heterogeneous Urban Exposures and Prevalent Hypertension in the Helsinki Capital Region, Finland. International Journal of Environmental Research and Public Health, 18(3), 1196. https://doi.org/10.3390/ijerph18031196