
Public Perception of SARS-CoV-2 Vaccinations on Social Media: Questionnaire and Sentiment Analysis


Abstract
1. Introduction
1.1. Coronavirus Disease 2019 in the UK and Vaccination Uptake
1.2. Anti-Vaccination Movement
1.3. Social Media and Vaccine Hesitancy
1.4. Sentiment Analysis and Data Mining
1.5. Sentiment Analysis of Vaccine Hesitance
1.6. Research Involving Questionnaires
1.7. Aims and Objectives
- Whether negative opinion regarding COVID-19 vaccines exists on Twitter.
- Whether lexicon-based (PYTHON/VADER) and machine learning (Microsoft Azure) approaches to sentiment classification yield different sentiment results.
- Whether low levels of concern about COVID-19 vaccines lead to high acceptance of the vaccine.
- Whether public opinion towards COVID-19 vaccinations becomes more positive over time.
2. Materials and Methods
2.1. Data Collection
2.2. Sentiment Data Analysis—Machine Learning Approach (MLP)
2.3. Sentiment Data Analysis—Lexicon-Based Approach
2.4. Statistical Analysis
2.5. Questionnaire
3. Results
3.1. Python Sentiment Analysis
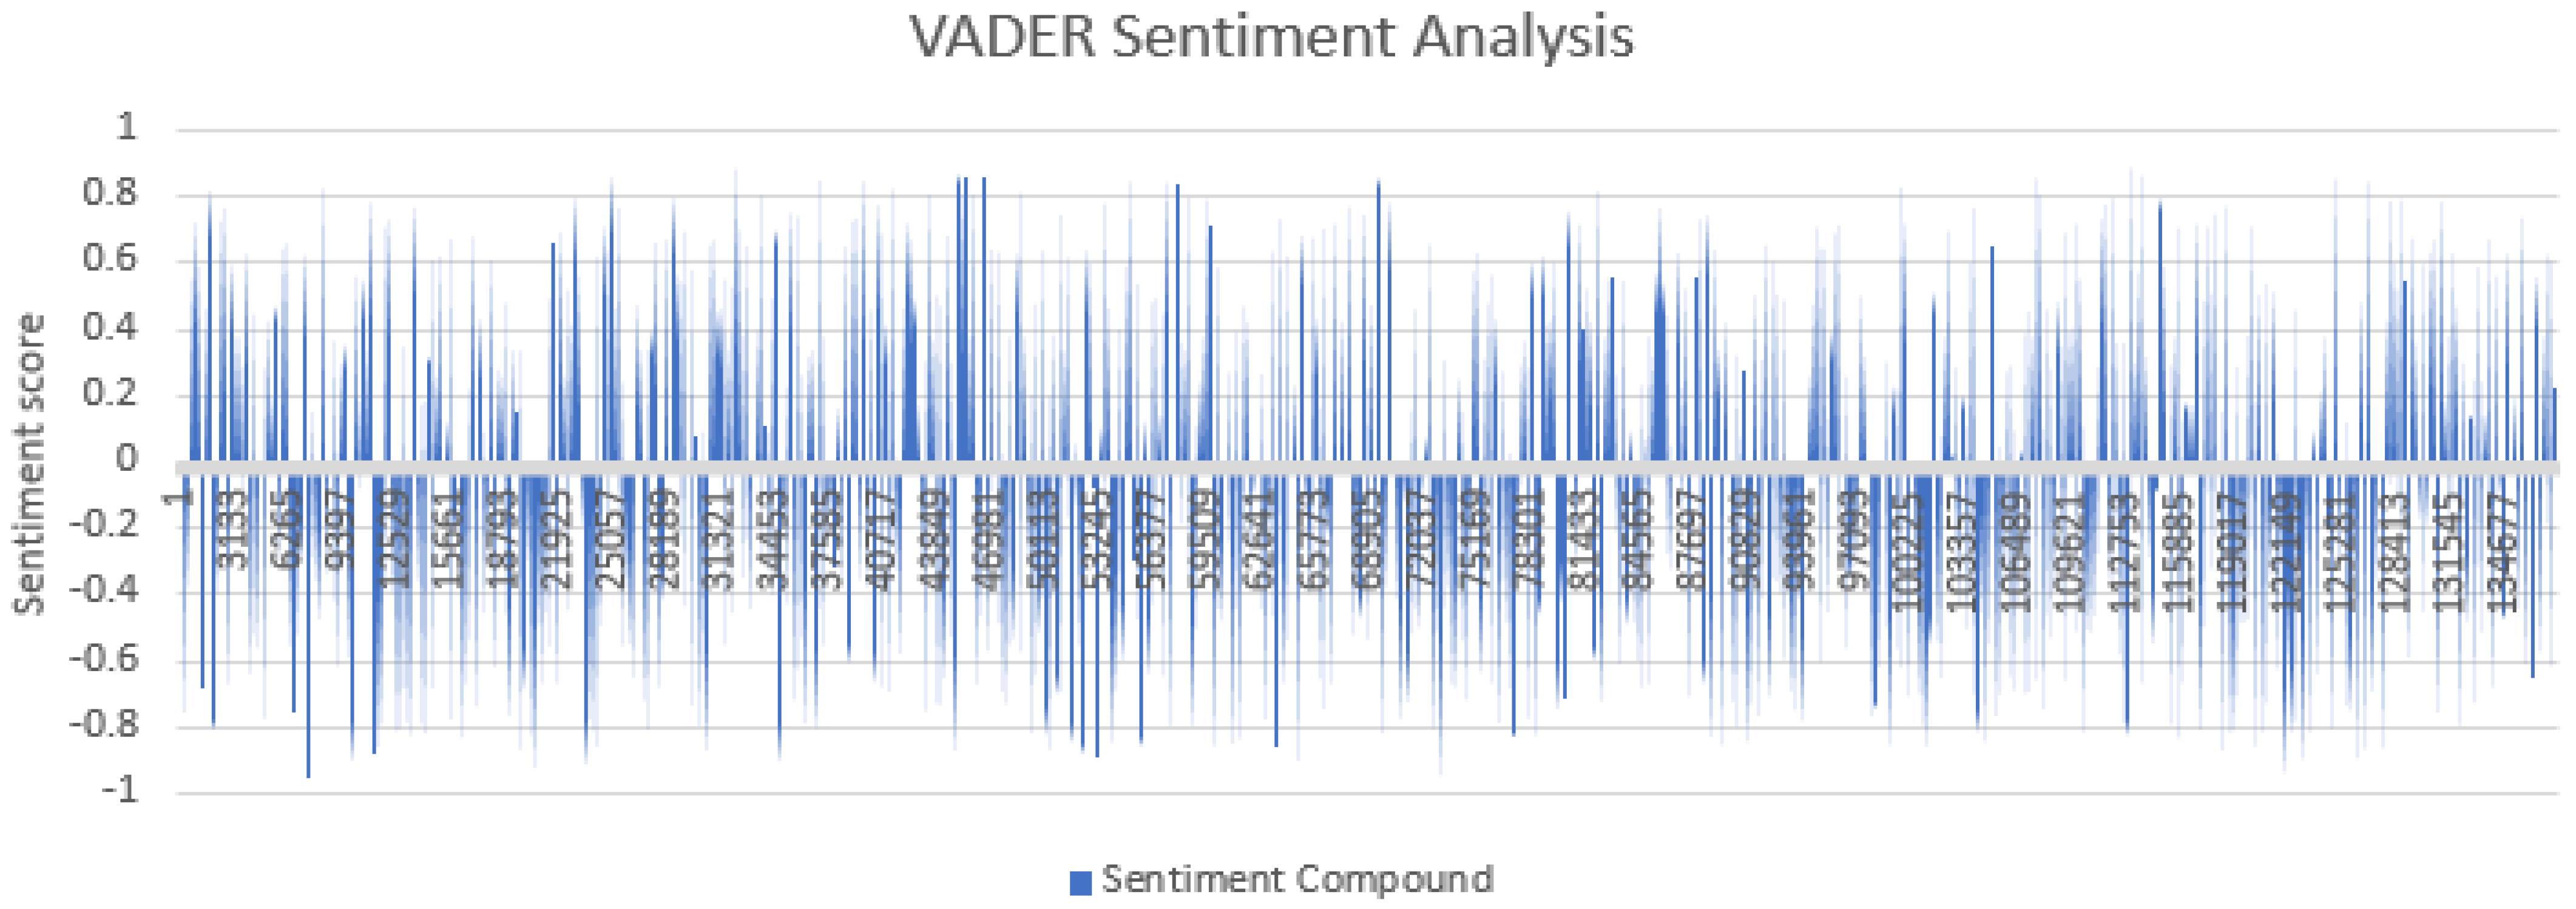
3.1.1. Tweet Sentiment Scores
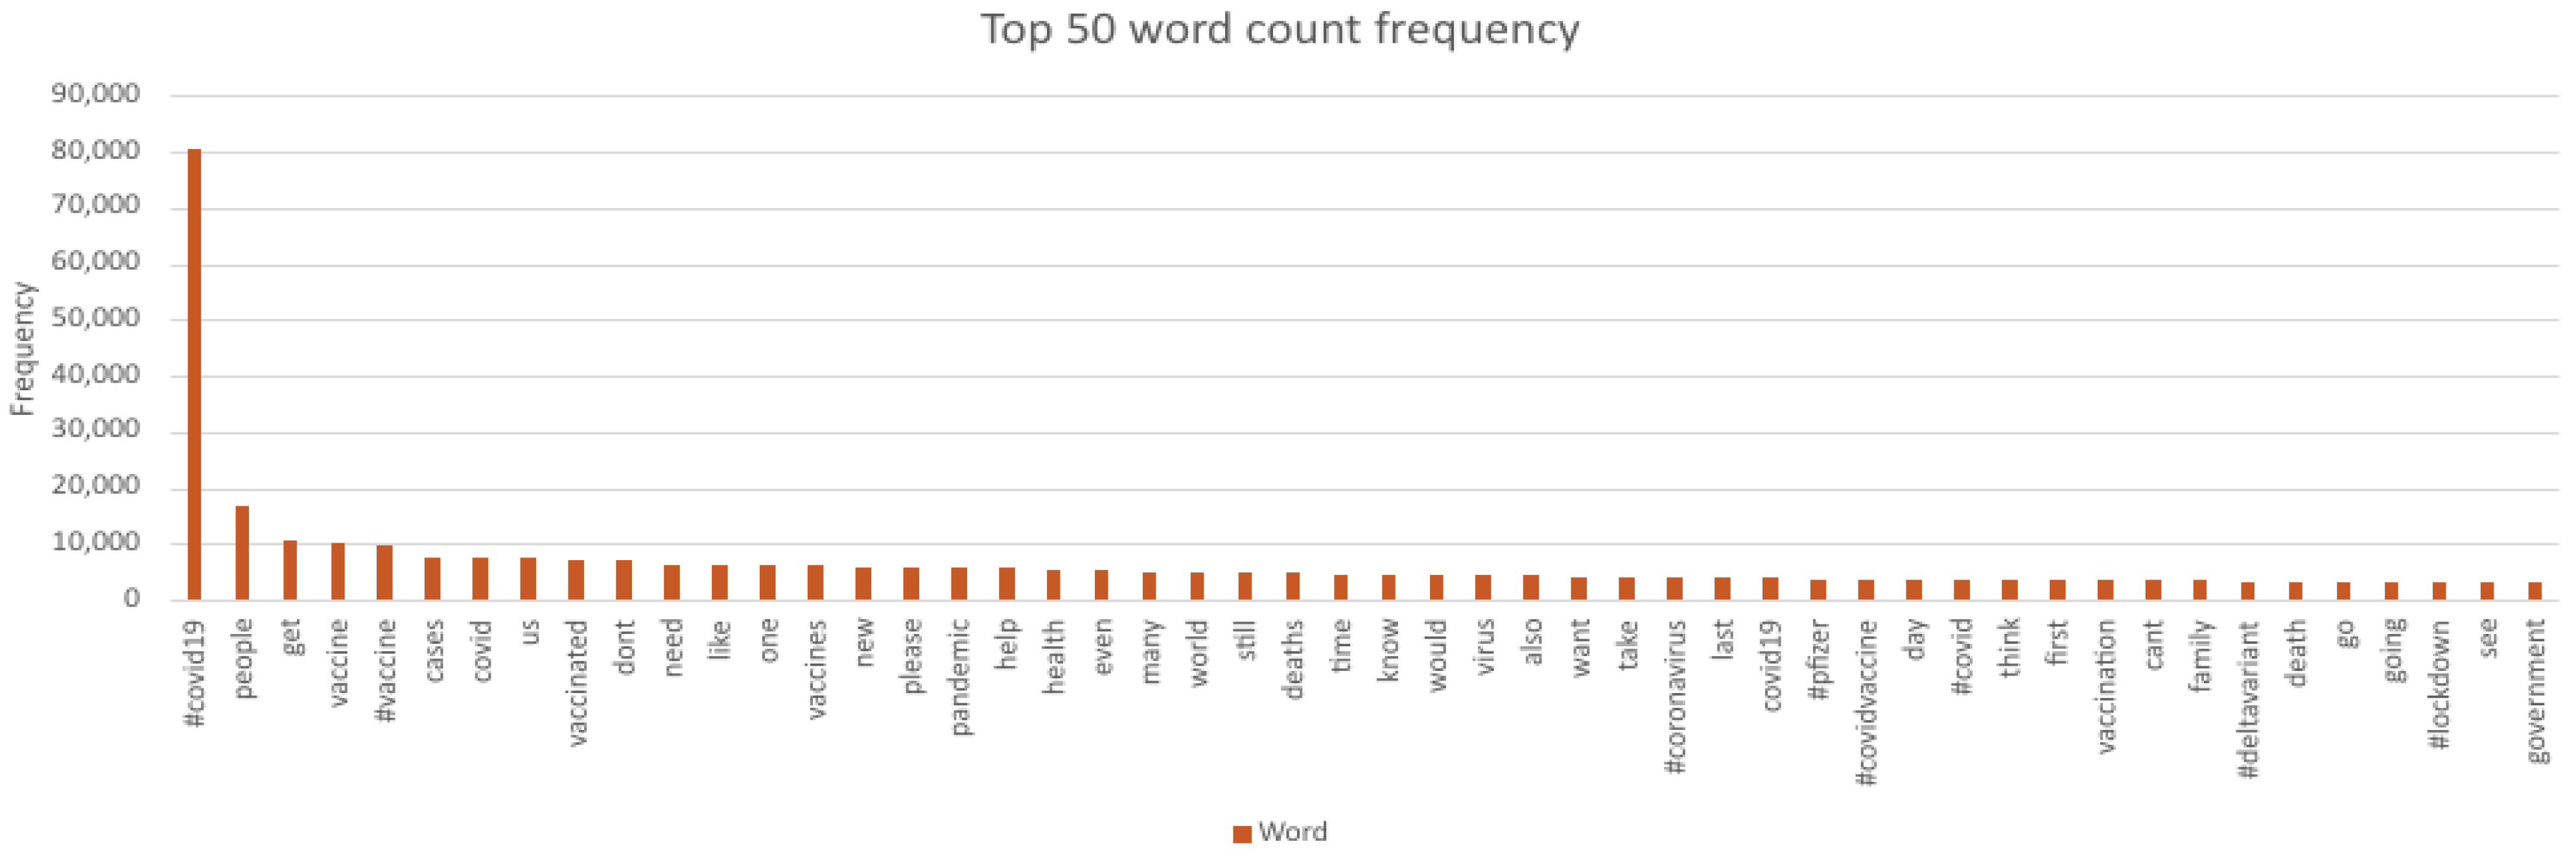
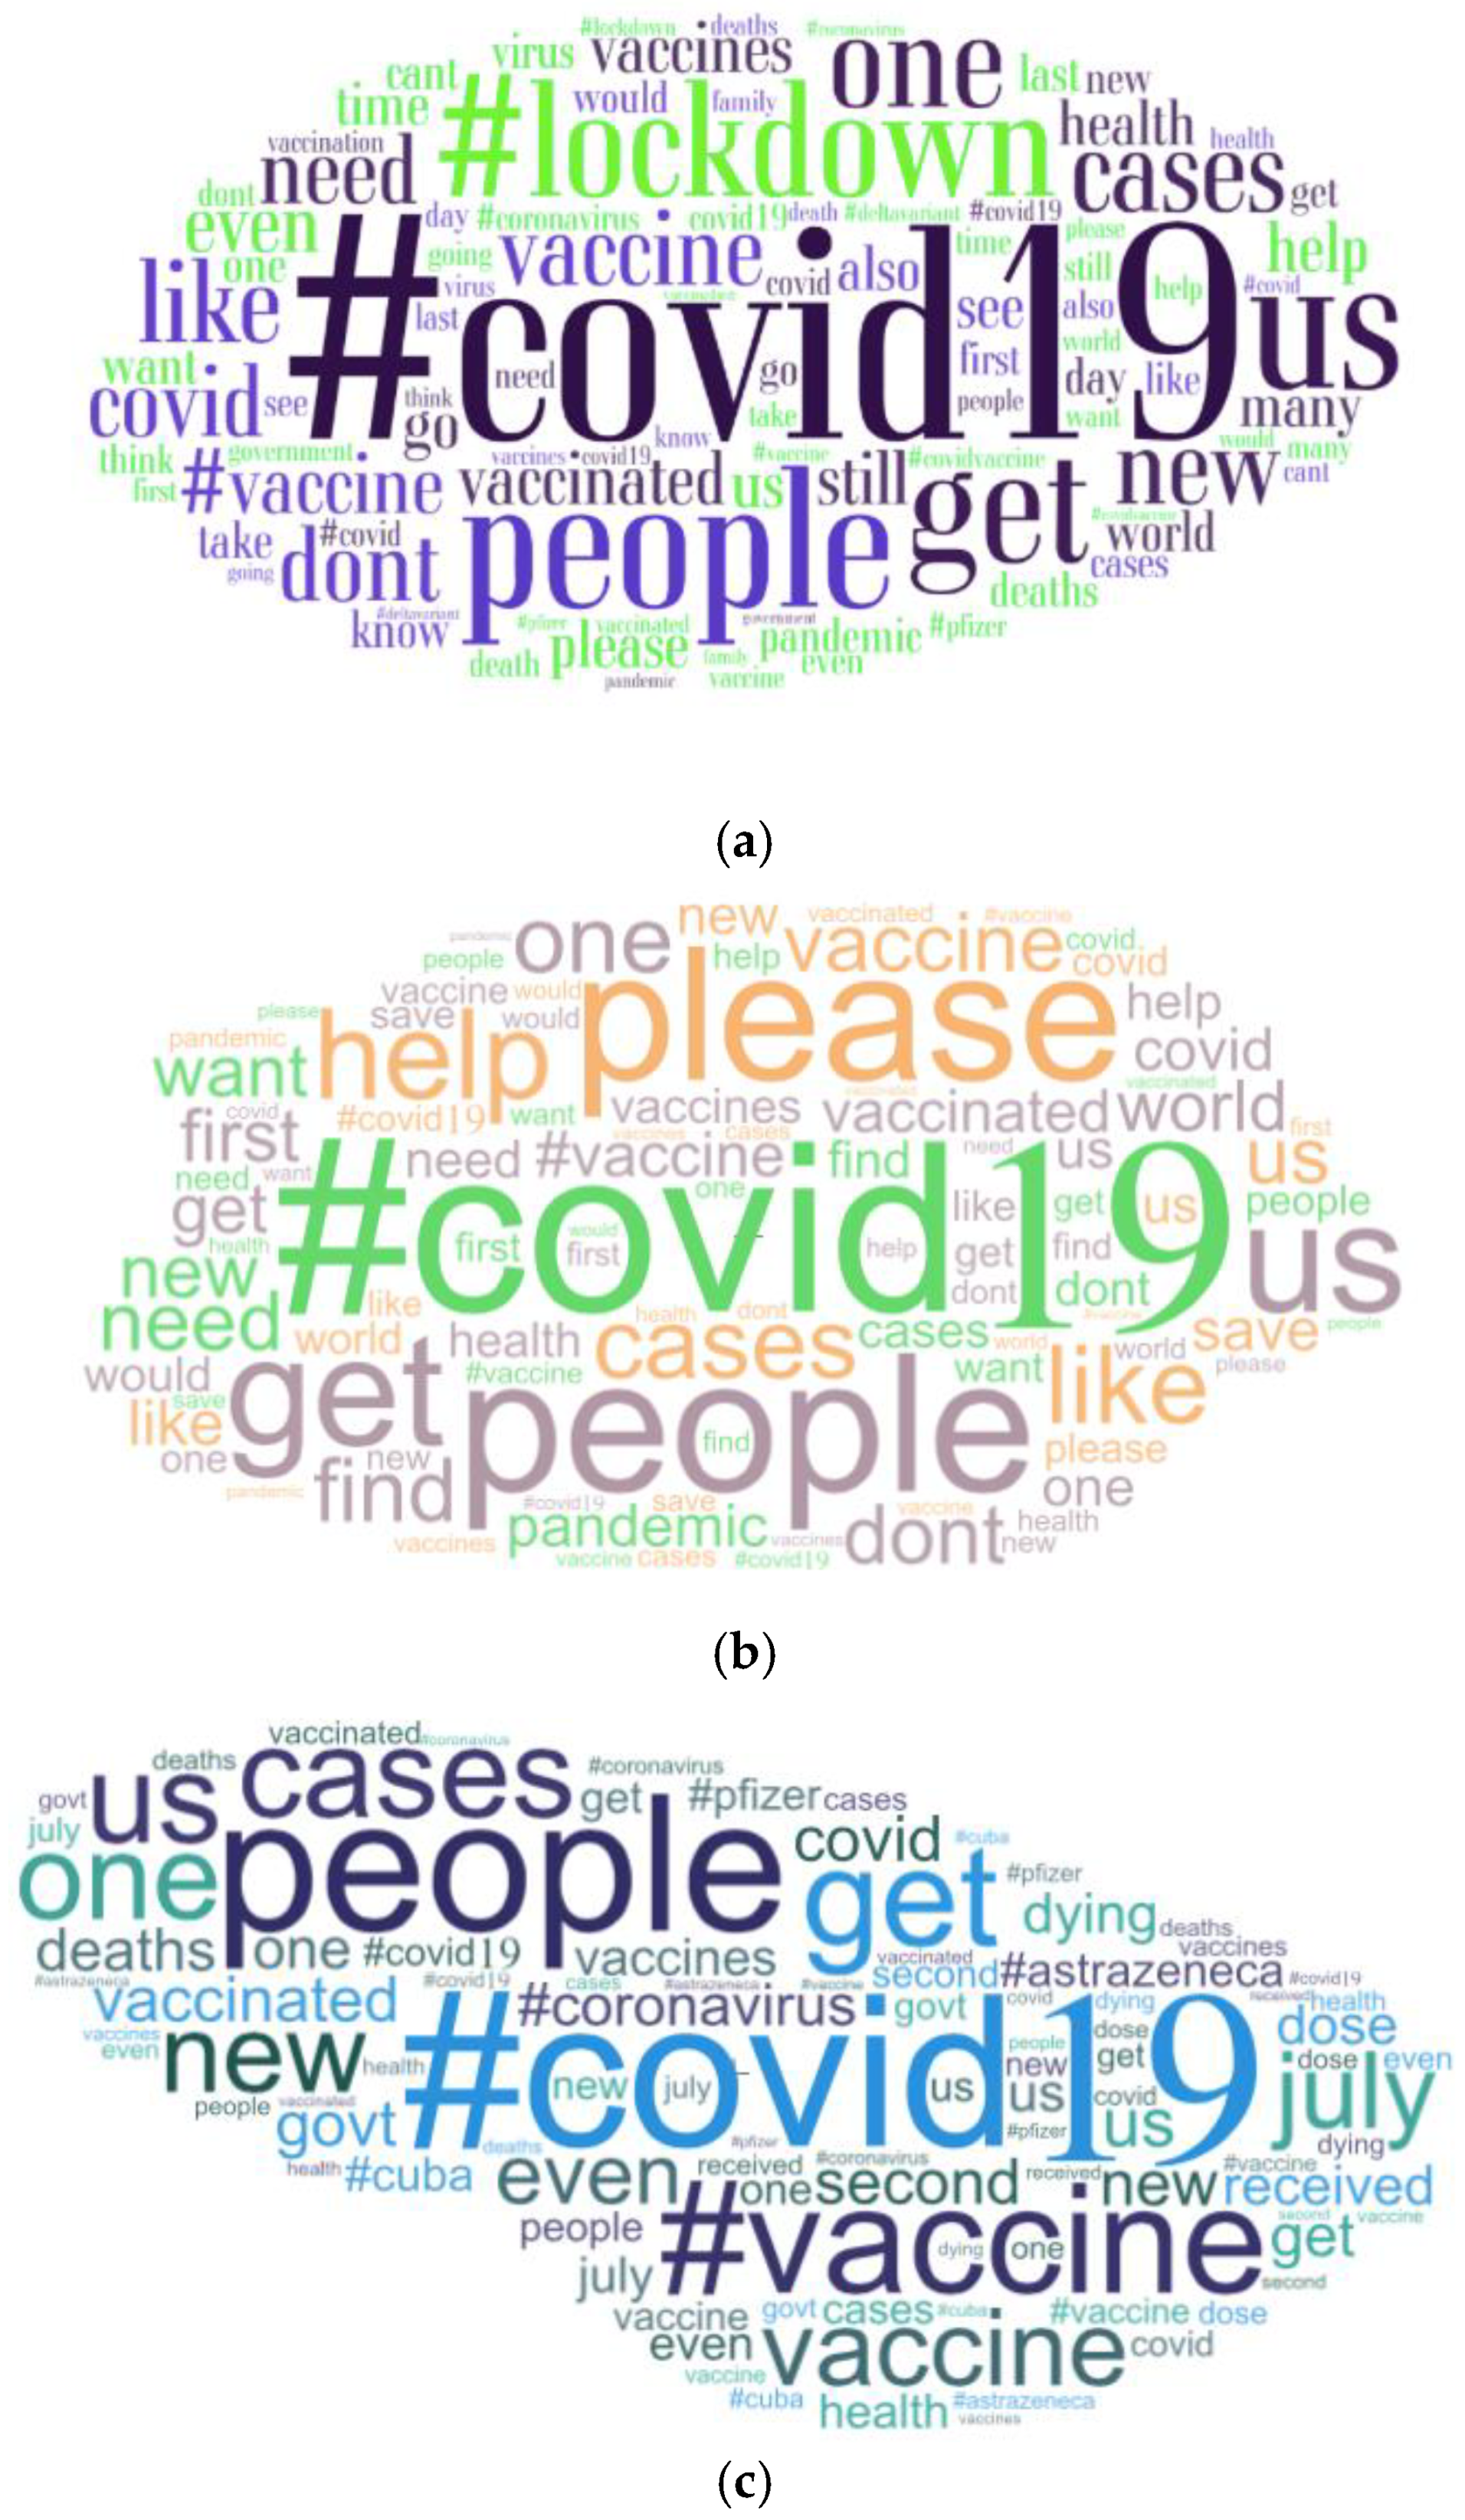
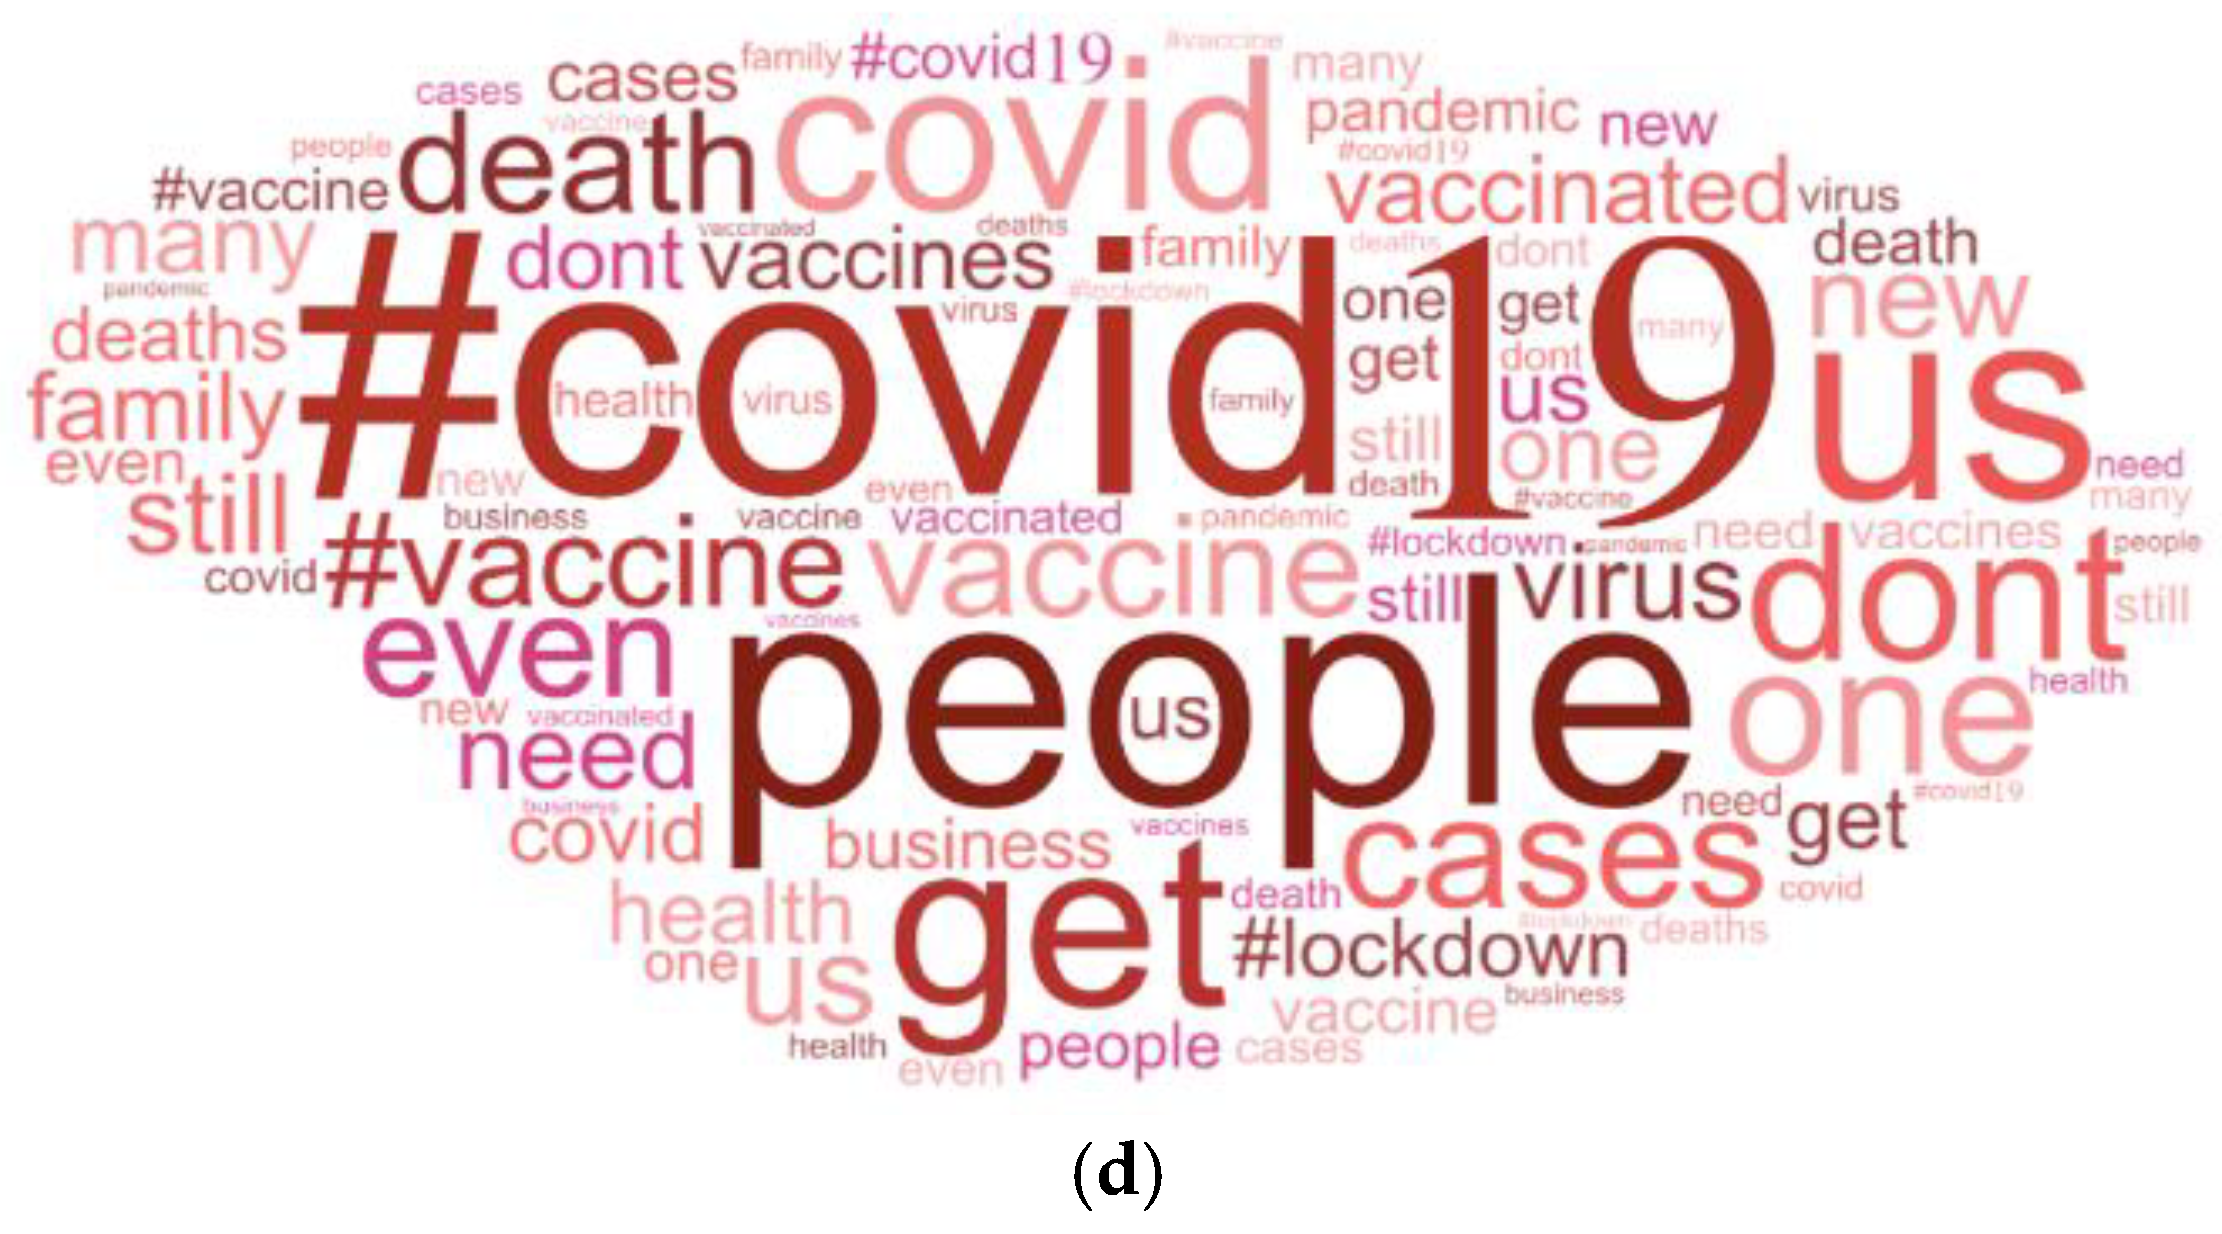
3.1.2. Word Frequency
3.1.3. Intensity of Sentiment
3.2. Machine Learning vs. Lexicon Based: A Comparison of Negative, Positive and Neutral Tweets
3.3. Questionnaire
4. Discussion
4.1. Machine Learning vs. Lexicon-Based Approaches
4.2. Word Identification and Word Frequency
4.3. Relative Frequency of Tweets
4.4. Questionnaire: Vaccine Hesitancy towards COVID-19 Vaccinations
4.5. Limitations and Further Work
5. Conclusions
Author Contributions
Funding
Institutional Review Board Statement
Informed Consent Statement
Data Availability Statement
Acknowledgments
Conflicts of Interest
Appendix A

| Question | Responses (%) | ||||||
|---|---|---|---|---|---|---|---|
| 1 | What is your age? | 18–29 (31.9) | 30–39 (17.6) | 40–49 (12.1) | 50–59 (20.9) | 60–69 (13.2) | 70+ (4.4) |
| 2 | Have you used a search engine (e.g., Google) since January 2020 to search for information about Coronavirus or COVID-19? | Yes (90.1) | No (9.4) | Don’t know (0.6) | |||
| 3 | How often do you use social media (e.g., Twitter, Instagram, Facebook and Snapchat) | Never (2.7) | Rarely (2.2) | Monthly (0.0) | Weekly (3.8) | Daily (64.3) | More frequently than daily (26.9) |
| 4 | Do you believe that information on social media is reliable? | Always reliable (1.1) | Sometimes reliable (70.9) | Rarely reliable (24.2) | Never reliable (2.7) | Don’t know (1.1) | |
| 5 | Have you ever tested positive for COVID-19? | Yes (7.7) | No (92.3) | Don’t know (0.0) | |||
| 6 | As far as you are aware, have you accepted all of the vaccinations you have been invited to (excluding COVID-19) since the age of 18? | Yes I have had all vaccinations I have been invited to (85.7) | I have had some of my vaccinations (8.2) | I have not had any of my vaccinations (2.7) | I have not had vaccinations due to an underlying cause (0.5) | I have decided to opt out of vaccinations (2.7) | Don’t know (0.0) |
| 7 | Have you already or are you going to accept a vaccine against COVID-19? | Yes (90.1) | No (8.2) | Don’t know (1.6) | |||
| 7a | If you selected don’t know, please specify: (optional) | Response 1: “Too early to be sure of safety.” | |||||
| Response 2: “Not sure if I will have my second vaccine.” | |||||||
| Response 3: “I would like to know more long term side effects before committing to being vaccinated.” | |||||||
| 8 | Have you received a vaccination to protect you against COVID-19 | Yes (98.2) | No (1.8) | Don’t know (0.0) | |||
| 9 | Which vaccine did you receive? | Pfizer (49.1) | Oxford Astra Zeneca (48.4) | Modern (1.9) | Janssen (Johnson & Johnson) (0.0) | Don’t know (0.6) | Other (0.0) |
| 10 | Are you concerned about accepting the COVID-19 vaccine/did you have concerns before receiving the vaccine? | I am not/was not concerned (73.8) | I feel/felt impartial (4.3) | I am/was slightly concerned (17.1) | I am/was very concerned (4.3) | Other (0.6) | |
| 10a | If you selected other, please specify: (optional) | Response 1: “I’m informed about side effects and don’t believe what you see in the news without looking at the actual data. So initially concerned but not after looking into the clotting issue.” | |||||
| 11 | Why did (or why will) you accept the COVID-19 vaccine? (Please select the most likely reason) | I have done my own research and I believe them to be safe (20.7) | I want the world to go back to how it used to be before the COVID-19 pandemic (40.2) | I know of or have lost someone to COVID-19 who did not receive the vaccination in time (5.5) | For protection for myself (27.4) | Other (6.1) | |
| 11a | If you selected other, please specify: (optional) | Response 1: “Mainly to protect others.” | |||||
| Response 2: “For protection of the weak and vulnerable as well as myself.” | |||||||
| Response 3: “Family member I care for is vulnerable otherwise I may have declined.” | |||||||
| Response 4: “NHS worker.” | |||||||
| Response 5: “Protection for my high risk family (mother and father).” | |||||||
| 12 | Why did (or why will) you not accept the COVID-19 vaccine? (tick all that apply) | I worry I might get COVID019 (0.0) | I have done my own research and I do not believe them to be safe (52.9) | I worry about the adverse reactions (23.5) | I do not believe the trials have been long enough to ensure accurate results (64.7) | Other (23.5) | |
| 12a | If you selected other, please specify: (optional) | Response 1: “I have had both vaccine doses.” | |||||
| Response 2: “I have an immune system. The majority of people do not need a vaccine for covid 19…. In my opinion. My mother also had a severe adverse reaction to the Astra Zeneca jab and is now suffering high blood pressure.” | |||||||
| Response 3: “I’ve had the flu jab—that’s all I needed!” | |||||||
| Response 4: “I keep myself fit and healthy, I do not have any medical conditions, I ensure I eat a balanced diet and maintain a normal BMI, I exercise frequently and take my general health very seriously thus I did not feel it necessary to have the vaccine. I felt that pressure from colleagues, family and social media made me feel like I didn’t have a choice. I work in an nhs hospital.” | |||||||
| 13 | If you have children, what age are they? (If you have multiple children, please select the age of the youngest) | 0–4 years (16.3) | 5–10 years (7.6) | 11–15 years (4.1) | 16–17 years (1.2) | 18 years + (32.6) | I do not have children (38.4) |
| 14 | As of 1 July 2021 in the UK, children under the age of 18 are not routinely offered a COVID-19 vaccine. If this changed and children were offered the vaccine, would you give permission for your child/children to have the vaccine? | Yes (41.1) | Probably (8.9) | Don’t know (17.9) | Probably not (5.4) | No (26.8) | |
| 15 | If you selected no/probably not to the previous question, please tick the most relevant box | They have an underlying disorder that prevents them from having vaccinations (0.0) | I do not trust what is in the vaccine (22.2) | I do not believe that they work (0.0) | I do not want them to suffer possible long term adverse reactions (50.0) | Other (27.8) | |
| 15a | If you selected other, please specify: (optional) | Response 1: “Given that the effects on children of the virus is known and proven to be low on children on balance I don’t think any benefits outweigh the negatives as the vaccine has not been out for long.” | |||||
| Response 2: “Children were never in the at risk group. I believe this experimental poison that’s only approved for EMERGENCY use (e.g., not approved like measles/chicken pox/meningitis) will cause life changing side effects or even death. How many dead children from this vaccine are acceptable? 1? 10? 100? We are vaccinating a population over a disease with a 99.7% survival rate-oh and it’s not even 100% effective!” | |||||||
| Response 3: “Covid 19 does not affect children… why would anyone vaccinate a child against something that wouldn’t cause them any harm in the first place?” | |||||||
| Response 4: “I would like to see more long term data on infants receiving a vaccine before making my mind.” | |||||||
| 16 | Have/would you use Twitter to find out information about COVID-19 or Coronavirus? | Yes (11.5) | No (83.5) | Don’t know (4.9) | |||
| 17 | I would describe my attitude towards receiving a COVID-19 vaccine as: | Very interested (52.7) | Interested (19.2) | Neutral (12.1) | Uneasy (8.8) | Against it (7.1) | Don’t know (0.0) |
| 18 | If friends or family were offered a COVID-19 vaccine I would: | Strongly encourage them (61.0) | Encourage them (19.8) | Not say anything (12.1) | Discourage them (1.6) | Strongly discourage them (3.3) | Don’t know (2.2) |
| 19 | Taking a COVID-19 vaccination is: | Extremely important (64.6) | Important (21.5) | Neither important nor unimportant (6.1) | Unimportant (2.2) | Extremely unimportant (2.8) | Don’t know (2.8) |
| 20 | Do you consider the COVID-19 vaccine more dangerous than the COVID-19 disease? | Strongly agree (6.6) | Somewhat agree (6.6) | Neither agree nor disagree (7.7) | Somewhat disagree (12.1) | Strongly disagree (64.3) | Don’t know (2.7) |
| 21 | Vaccine safety and effectiveness data are often false | Strongly agree (5.0) | Somewhat agree (12.2) | Neither agree nor disagree (16.0) | Somewhat disagree (20.4) | Strongly disagree (40.3) | Don’t know (6.1) |
| 22 | How would you describe your general knowledge of vaccinations? | Deep/thorough understanding (23.6) | Some understanding (74.2) | No understanding (2.2) | Don’t know (0.0) | ||
References
- Chadeau-Hyam, M.; Bodinier, B.; Elliot, J.; Whitaker, M.D.; Tzoulaki, I.; Vermeulen, R.; Kelly-Irving, M.; Delpierre, C.; Elliot, P. Risk factors for positive and negative COVID-19 tests: A cautious and in-depth analysis of UK biobank data. Int. J. Epidemiol. 2020, 49, 1454–1467. [Google Scholar] [CrossRef]
- Public Health England, Coronavirus (COVID-19) in the UK. 2021. Available online: https://coronavirus.data.gov.uk (accessed on 8 July 2021).
- Puri, N.; Coomes, E.A.; Haghbayan, H.; Gunaratne, K. Social media and vaccine hesitancy: New updates for the era of COVID-19 and globalized infectious diseases. Hum. Vaccine Immunother. 2020, 16, 2586–2593. [Google Scholar] [CrossRef] [PubMed]
- Kata, A. Anti-vaccine activists, Web 2.0, and the postmodern paradigm—An overview of tactics and tropes used online by the anti-vaccination movement. Vaccine 2012, 30, 3778–3789. [Google Scholar] [CrossRef] [PubMed]
- Jacobson, R.M.; St Sauver, J.L.; Finney Rutten, L.J. Vaccine Hesitancy. Mayo Clin. Proc. 2015, 90, 1562–1568. [Google Scholar] [CrossRef]
- Cacciatore, M.A.; Nowak, G.J.; Evans, N.J. It’s complicated: The 2014–2015 US measles outbreak and parents’ vaccination beliefs, confidence, and intentions. Risk Anal. 2018, 38, 2178–2192. [Google Scholar] [CrossRef] [PubMed]
- Smith, N.; Graham, T. Mapping the anti-vaccine movement on Facebook. Inf. Commun. Soc. 2017, 22, 1310–1327. [Google Scholar] [CrossRef]
- Taylor, B.; Miller, E.; Farrington, C.P.; Petropoulos, M.C.; Favot-Mayaud, I.; Li, J.; Waight, P.A. Autism and measles, mumps, and rubella vaccine: No epidemiological evidence for a causal association. Lancet 1999, 353, 2026–2029. [Google Scholar] [CrossRef]
- Kulenkampff, M.; Schwartzman, J.S.; Wilson, J. Neurological complications of pertussis inoculation. Arch. Dis. Child. 1974, 49, 46–49. [Google Scholar] [CrossRef]
- Salmon, D.A.; Dudley, M.Z.; Glanz, J.M.; Omer, S.B. Vaccine hesitancy: Causes, consequences, and a call to action. Vaccine 2015, 33, 66–71. [Google Scholar] [CrossRef]
- Swansea Research Unit of the Royal College of General Practitioners. Effect of a low pertussis vaccination take-up on a large community. Br. Med. J. (Clin. Res. Ed.) 1981, 282, 23–26. [Google Scholar] [CrossRef][Green Version]
- Begg, N.; White, J.; Bozoky, Z. Media dents confidence in MMR vaccine. Br. Med. J. 1998, 316, 561. [Google Scholar] [CrossRef]
- Gangarosa, E.; Galazka, A.M.; Wolfe, C.R.; Philips, L.M.; Gangarosa, R.E.; Miller, E.; Chen, R.T. Impact of anti-vaccine movements on pertussis control: The untold story. Lancet 1998, 351, 356–361. [Google Scholar] [CrossRef]
- Hansen, N.D.; Mølbak, K.; Cox, I.J.; Lioma, C. Relationship between Media Coverage and Measles-Mumps-Rubella (MMR) vaccination Uptake in Denmark: Retrospective Study. JMIR Pub. Health Surveill. 2019, 5, e9544. [Google Scholar] [CrossRef] [PubMed]
- World Health Organisation. News Updates. 2021. Available online: https://www.who.int/news-room/news-updates (accessed on 14 August 2021).
- Kupferschmidt, K. Study pushes emergence of measles back to antiquity. Science 2020, 367, 11–12. [Google Scholar] [CrossRef] [PubMed]
- Gunaratne, K.; Coomes, E.A.; Haghbayan, H. Temporal trends in anti-vaccine discourse on Twitter. Vaccine 2019, 37, 4867–4871. [Google Scholar] [CrossRef]
- Scanfeld, D.; Scanfeld, V.; Larson, E.L. Dissemination of health information through social networks: Twitter and antibiotics. Am. J. Infect. Control 2010, 38, 182–188. [Google Scholar] [CrossRef]
- Betsch, C.; Brewer, N.T.; Brocard, P.; Davies, P.; Gaissmaier, W.; Haase, N.; Leask, J.; Renkewitz, F.; Renner, B.; Reyna, V.F.; et al. Opportunities and challenges of Web 2.0 for vaccine decisions. Vaccine 2012, 30, 3727–3733. [Google Scholar] [CrossRef] [PubMed]
- Ortiz-Sánchez, E.; Velando-Soriano, A.; Pradas-Hernández, L.; Vargas-Román, K.; Gómez-Urquiza, J.L.; Cañdas-De la Fuente, G.; Albendín-García, L. Analysis of the Anti-Vaccine Movement in Social Networks: A Systematic Review. Int. J. Environ. Res. Public Health 2020, 17, 5394. [Google Scholar] [CrossRef] [PubMed]
- Anderson, P. Another media scare about MMR vaccine hits Britain. Br. Med. J. 1999, 318, 1578. [Google Scholar] [CrossRef]
- Diresta, R.; Lotan, G. Anti-Vaxxers Using Twitter to Manipulate a Vaccine Bill. 2015. Available online: https://cran.rproject.org/web/packages/SocialMediaLab/SocialMediaLab.pdf (accessed on 19 July 2021).
- Sense about Science. 2021. Available online: https://senseaboutscience.org (accessed on 11 August 2021).
- Mollema, L.; Harmsen, I.A.; Broekhuizen, E.; Clijnk, R.; Melker, H.D.; Paulussen, T.; Kok, G.; Ruiter, R.; Das, E. Disease Detection or Public Opinion Reflection? Content Analysis of Tweets, Other Social Media, and Online Newspapers During the Measles Outbreak in the Netherlands in 2013. J. Med. Internet Res. 2015, 17, e128. [Google Scholar] [CrossRef]
- Piedrahita-Valdes, H.; Piedrahita-Castillo, D.; Bermejo-Higuera, J.; Guillem-Saiz, P.; Bermejo-Higuera, J.R.; Guillem-Saiz, J.; Sicilia-Montalvo, J.A.; Machio-Regidor, F. Vaccine hesitancy on social media: Sentiment analysis from June 2011 to April 2019. Vaccines 2021, 9, 28. [Google Scholar] [CrossRef] [PubMed]
- Kullar, R.; Goff, D.A.; Gauthier, T.P.; Smith, T.C. To Tweet or Not to Tweet—A Review of the Viral Power of Twitter for Infectious Diseases. Technol. Infect. Dis. 2020, 22, 14. [Google Scholar] [CrossRef]
- Twitter Revenue and Usage Statistics. 2021. Available online: https://www.businessofapps.com/data/twitter-statistics/ (accessed on 14 August 2021).
- Sattar, N.S.; Arifuzzaman, S. COVID-19 Vaccination awareness and aftermath: Public sentiment analysis on Twitter data and vaccinated population prediction in the USA. Appl. Sci. 2021, 11, 6128. [Google Scholar] [CrossRef]
- Neubaum, G.; Rosner, L.; Rosenthal-von der Putten, A.; Kramer, N.C. Psychosocial functions of social media usage in a disaster situation: A multi-methodological approach. Comput. Hum. Behav. 2014, 34, 28–38. [Google Scholar] [CrossRef]
- Skinner, G. Who’s least likely to say they’ll get a COVID-19 vaccine? Ipsos Mori. 2020. Available online: https://www.ipsos.com/en-uk/whos-least-likely-say-they’ll-get-covid-19-vaccine (accessed on 17 August 2021).
- Freeman, D.; Loe, B.S.; Chadwick, A.; Vaccari, C.; Waite, F.; Rosebrock, L.; Jenner, L.; Petit, A.; Lewandowsky, S.; Vanderslott, S.; et al. COVID-19 vaccine hesitancy in the UK: The Oxford coronavirus explanations, attitudes, and narratives survey (Oceans) II. Psychol. Med. 2020, 1–15. [Google Scholar] [CrossRef]
- Google Trends. 2021. Available online: www.trends.google.com (accessed on 19 July 2021).
- Kaur, C.; Sharma, A. Twitter Sentiment Analysis on Coronavirus using Textblob. EasyChair Prepr. 2020, 2974, 1–10. [Google Scholar]
- Tholana, V.S.S.A. Literature Review on Sentiment Analysis. Int. J. Adv. Res. Ideas Innov. Technol. 2017, 3, 5. [Google Scholar]
- Li, N.; Wu, D.D. Using text mining and sentiment analysis for online forums hotspot detection and forecast. Decis. Support Syst. 2010, 48, 354–368. [Google Scholar] [CrossRef]
- Bari, M.D.; Sharoff, S.; Thomas, M. Sentiml: Functional annotation for multilingual sentiment analysis. ICPS Proc. 2013, 15, 1–7. [Google Scholar] [CrossRef]
- Ghassi, M.; Skinner, J.; Zimbra, D. Twitter brand sentiment analysis: A hybrid system using n-gram analysis and dynamic artificial neural network. Expert Syst. Appl. 2013, 40, 6266–6282. [Google Scholar] [CrossRef]
- Tane, J.; Schmitz, C.; Stumme, G. Semantic resource management for the web: An e-learning application. In Proceedings of the 13th International World Wide Web conference on Alternate Track Papers and Posters, New York, NY, USA, 19–21 May 2004; pp. 1–10. [Google Scholar] [CrossRef]
- Raghupathi, V.; Ren, J.; Raghupathi, W. Studying public perception about vaccination: A sentiment analysis of Tweets. Int. J. Environ. Res. Public Health 2020, 17, 3464. [Google Scholar] [CrossRef] [PubMed]
- Cieliebak, M.; Durr, O.; Uzdilli, F. Potential and Limitations of Commercial Sentiment Detection Tools; Zurich University of Applied Sciences: Winterthur, Switzerland, 2013. [Google Scholar]
- Bonta, V.; Janardhan, N.K.N. A Comprehensive Study on Lexicon Based Approaches for Sentiment Analysis. Asian J. Comput. Sci. Technol. 2019, 8, 1–6. [Google Scholar] [CrossRef]
- Shelar, A.; Huang, C.-Y. Sentiment Analysis of Twitter Data. In Proceedings of the International Conference on Computational Science and Computational Intelligence, Las Vegas, NV, USA, 12–14 December 2018; pp. 1301–1302. [Google Scholar] [CrossRef]
- Amin, A.; Hossain, I.; Akther, A.; Alam, K.M. Bengali VADER: A sentiment analysis approach using modified VADER. In Proceedings of the 2019 International Conference on Electrical, Computer and Communication Engineering (ECCE), Cox’sBazar, Bangladesh, 7–9 February 2019; pp. 1–6. [Google Scholar] [CrossRef]
- Hatzivassiloglou, V.; McKeown, K.R. Predicting the semantic orientation of adjectives. In Proceedings of the 35th Annual Meeting of the Association for Computational Linguistics and Eighth Conference of the European Chapter of the Association for Computational Linguistics, Madrid, Spain, 7–12 July 1997; pp. 174–181. [Google Scholar]
- Sarker, D.; Bali, R.; Sahrma, T. Analyzing movie reviews sentiment. In Practical Machine Learning with Python: A Problem-Solver’s Guide to Building Real-World Intelligent Systems; Apress: Berkley, CA, USA, 2018; pp. 246–342. [Google Scholar]
- Ao, S.; Chan, A.S.; Castillo, O.; Kim, H.; Katagiri, H. Transactions on Engineering Sciences: Special Issue for the International Association of Engineers Conferences 2019, IAENG; World Scientific Publishing Pte: Singapore, 2020; pp. 72–73. [Google Scholar]
- Hutto, C.; Gilbert, E. VADER: A Parsimonious Rule-Based Model for Sentiment Analysis of Social Media Text [Scholarly Project]; Comp. Social Lab: Atlanta, GA, USA, 2014; Available online: http://comp.social.gatech.edu/papers/icwsm14.vader.pdf (accessed on 1 August 2021).
- Rahim, N.H.A.; Rafie, S.H.M. Sentiment analysis of social media data in vaccination. Int. J. Emerg. Trends Eng. Res. 2020, 8, 5259–5264. [Google Scholar] [CrossRef]
- Taylor, S.; Landry, C.A.; Paluszek, M.M.; Groenewoud, R.; Rachoe, G.S.; Asmundson, G.J.G. A proactive Approach for Managing COVID-19: The importance of Understanding the Motivational Roots of Vaccination Hesitancy for SARS-CoV-2. Front. Psychol. 2020, 11, 575950. [Google Scholar] [CrossRef]
- Graffigna, G.; Palamenghi, L.; Boccia, S.; Barello, S. Relationship between Citizens’ Health Engagement and Intention to Take the COVID-19 Vaccine in Italy: A Mediation Analysis. Vaccines 2020, 8, 576. [Google Scholar] [CrossRef]
- Group, C. A future vaccination campaign against COVID-19 at risk of vaccine hesitancy and politicization. Lancet Infect. Dis. 2020, 20, 769–770. [Google Scholar]
- Zucco, C.; Paglia, C.; Graziano, S.; Bella, S.; Cannataro, M. Sentiment analysis and text mining of questionnaires to support telemonitoring programs. Information 2020, 11, 550. [Google Scholar] [CrossRef]
- Allery, L.A. Design and use questionnaires for research in medical education. Educ. Prim. Care 2016, 27, 234–238. [Google Scholar] [CrossRef]
- McGuirk, P.M.; O’Neill, P. Using Questionnaires in Qualitative Human Geography. Faculty of Social Sciences—Papers. 2016, Volume 2518, pp. 246–273. Available online: https://ro.uow.edu.au/sspapers/2518 (accessed on 16 August 2021).
- Chandrasekaran, R.; Mehta, V.; Valkunde, T.; Moustakas, E. Topics, Trends, and Sentiments of Tweets About the COVID-19 Pandemic: Temporal Infoveillance Study. J. Med. Internet Res. 2020, 22, e22624. [Google Scholar] [CrossRef]
- JISC Online Surveys. 2021. Available online: www.JISC.ac.uk (accessed on 1 July 2021).
- StatsKingdom. 2021. Available online: www.statskingdom.com (accessed on 13 August 2021).
- D’Andrea, A.; Ferri, F.; Grifoni, P.; Guzzo, T. Approaches, Tools and Applications for Sentiment Analysis Implementation. Int. J. Comput. Appl. 2015, 125, 0975–8887. [Google Scholar] [CrossRef]
- Hutto, C.J.; Gilbert, E. VADER: A Parsimonious Rule-based Model for Sentiment Analysis of Social Media Test. Assoc. Adv. Artif. Intell. 2015. Available online: https://www.researchgate.net/publication/275828927_VADER_A_Parsimonious_Rule-based_Model_for_Sentiment_Analysis_of_Social_Media_Text (accessed on 12 August 2021).
- NLTK. 2021. Available online: https://www.nltk.org/ (accessed on 1 July 2021).
- Karn, A.; Shrestha, A.; Pudasaini, A.; Mahara, B.; Jaiswal, A. Statistic based Sentiment Analysis of Social Media Data. Int. Res. J. Innov. Eng. Technol. 2018, 2, 28–32. [Google Scholar]
- Mantyla, M.V.; Graziotin, D.; Kuutila, M. The evolution of Sentiment Analysis—A review of research topics, venues and top cited papers. Comput. Sci. Rev. 2018, 27, 16–32. [Google Scholar] [CrossRef]
- Abdelwahab, O.; Bahgat, M.; Lowrance, C.J.; Elmaghraby, A. Effect of training set size on SVM and Naïve Bayes for Twitter sentiment analysis. In Proceedings of the 2015 IEEE International Symposium on Signal Processing and Information Technology (ISSPIT), Abu Dhabi, United Arab Emirates, 7–10 December 2015; pp. 46–51. [Google Scholar]
- Canhoto, A.I.; Padmanabhan, Y. ‘We (don’t) know how you feel’—A comparative study of automated vs. manual analysis of social media conversations. J. Mark. Manag. 2015, 13, 1141–1157. [Google Scholar] [CrossRef]
- Chaovalit, P.; Zhou, L. Movie review mining: A comparison between supervised and unsupervised classification approaches. In System Sciences, Proceedings of the 38th Annual Hawaii International Conference HICSS’05, Big Island, HI, USA, 3–6 January 2005; IEEE: Piscataway, NJ, USA, 2005; pp. 1–9. [Google Scholar]
- Kolchyna, O.; Souza, T.T.P.; Treleaven, P.C.; Aste, T. Twitter sentiment analysis: Lexicon method, machine learning method and their combination. arXiv 2015, arXiv:1507.00955. [Google Scholar]
- Dhaoui, C.; Webster, C.M.; Tan, L.P. Social media sentiment analysis: Lexicon versus machine learning. J. Consum. Mark. 2017, 34, 480–488. [Google Scholar] [CrossRef]
- Nguyen, H.; Veluchamy, A.; Diop, M.; Iqbal, R. Comparative study of sentiment analysis with product reviews using machine learning and lexicon based approaches. Data Sci. Rev. 2018, 1, 4–7. [Google Scholar]
- Lu, B.; Tsou, B.K. Combining a large sentiment lexicon and machine learning for subjectivity classification. In Proceedings of the 2010 International Conference on Machine Learning and Cybernetics, Qingdao, China, 11–14 July 2010; pp. 3311–3316. [Google Scholar] [CrossRef]
- Dolianiti, F.S.; Iakovakis, D.; Dias, S.B.; Hadjileontiadou, S.J.; Diniz, J.A.; Natsiou, G.; Tsitoiuridou, M.; Bamidis, P.D.; Hadjileontiadis, L.J. Sentiment analysis on educational datasets: A comparative evaluation of commercial tools. Educ. J. Univ. Patras UNESCO Chair 2019, 6, 262–273. [Google Scholar]
- Sweigart, A. Invent Your Own Computer Games with Python. 2nd Edition. 2012. Available online: https://inventwithpython.com/ (accessed on 19 July 2021).
- Villavicencio, C.; Macrohon, J.J.; Inbaraj, X.A.; Jeng, J.H.; Hsieh, J.G. Twitter Sentiment Analysis towards COVID-19 Vaccines in the Philippines Using Naïve Bayes. Information 2021, 12, 204. [Google Scholar] [CrossRef]
- Chaudhri, A.A.; Saranya, S.; Dubey, S. Implementation Paper on Analyzing COVID-18 Vaccines on Twitter Dataset Using Tweepy and Text Blob. Ann. Rom. Soc. Cell Biol. 2021, 25, 8393–8396. [Google Scholar]
- Xue, J.; Chen, J.; Hu, R.; Chen, C.; Zheng, C.; Liu, X.; Zhu, T. Twitter discussions and emotions and COVID-19 pandemic: A machine learning approach (2020). arXiv 2020, arXiv:2005.12830. [Google Scholar]
- Baghat, K.K.; Mishra, S.; Dixit, A.; Chang, C.Y. Public Opinions about online learning during COVID-19: A sentiment analysis approach. Sustainability 2021, 13, 3364. [Google Scholar] [CrossRef]
- Del Vicario, M.; Bessi, A.; Zollo, F.; Petroni, F.; Scala, A.; Caldarelli, G.; Quattrociocchi, W. The spreading of misinformation online. Proc. Natl. Acad. Sci. USA 2016, 113, 554–559. [Google Scholar] [CrossRef] [PubMed]
- Dredze, M.; Broniatowski, D.A.; Hilyard, K.M. Zika vaccine misconception: A social media analysis. Vaccine 2016, 34, 3441. [Google Scholar] [CrossRef] [PubMed]
- Massey, P.M.; Leader, A.; Yom-Tov, E.; Budena, A.; Fisher, K.; Klasse, A.C. Applying multiple data collection tools to quantify Human Papillomavirus vaccine communication on Twitter. J. Med. Internet Res. 2016, 18, 12. [Google Scholar] [CrossRef]
- Mahajan, R.; Romine, W.; Miller, M.; Banerjee, T. Analyzing public outlook towards vaccination using Twitter. In Proceedings of the 2019 IEEE International Conference on Big Data (Big Data), Los Angeles, CA, USA, 9–12 December 2019; pp. 2763–2772. [Google Scholar] [CrossRef]
- Yuan, X.; Schuchard, R.J.; Crooks, A.T. Examining emergent communities and social bots within the polarized online vaccination debate in Twitter. Soc. Media+ Soc. 2019, 5, 20563051198546. [Google Scholar] [CrossRef]
- Meyer, S.B.; Violette, R.; Aggarwal, R.; Simeoni, M.; MacDoughall, H.; Waite, N. Vaccine hesitancy and Web 2.0: Exploring how attitudes and beliefs about influenza vaccination are exchanged in online threaded user comments. Vaccine 2019, 37, 1769–1774. [Google Scholar] [CrossRef]
- Nyhan, B.; Reifler, J.; Richey, S.; Freed, G.L. Effective messages in vaccine promotion: A randomized trial. Pediatrics 2014, 133, e835–e842. [Google Scholar] [CrossRef]
- Nyhan, B.; Reifler, J. Does correcting myths about the flu vaccine work? An experimental evaluation of the effects of corrective information. Vaccine 2015, 33, 459–464. [Google Scholar] [CrossRef]
- Massey, P.M.; Budenz, A.; Leader, A.; Fisher, K.; Klassen, A.C.; Yom-Tov, E. What drives heath professionals to tweet about # HPV vaccine? Identifying strategies for effective communication. Prev. Chronic Dis. 2018, 15, 15. [Google Scholar] [CrossRef]
- Medicines & Healthcare Products Regulatory Agency, MHRA Guidance on Coronavirus (COVID-19). 2021. Available online: https://www.gov.uk/government/collections/mhra-guidance-on-coronavirus-covid-19 (accessed on 13 July 2021).
- British Foreign Policy Group. COVID-19 Timeline. 2021. Available online: https://bfpg.co.uk/2020/04/covid-19-timeline/ (accessed on 14 August 2021).
- Huang, C.; Wang, Y.; Li, X.; Ren, L.; Zhao, J.; Hu, Y.; Zhang, L.; Fan, G.; Xu, J.; Gu, X.; et al. Clinical features of patients infected with 2019 novel coronavirus in Wuhan, China. Lancet 2020, 395, 497–506. [Google Scholar] [CrossRef]
- Dodd, R.H.; Pickles, K.; Nickel, B.; Cvejic, E.; Ayre, J.; Batcup, C.; Bonner, C.; Copp, T.; Cornell, S.; Dakin, T.; et al. Concerns and motivations about COVID-19 vaccination. Lancet Infect. Dis. 2021, 21, 163–191. [Google Scholar] [CrossRef]
- Chowdhury, A.A.; Das, A.; Saha, S.K.; Rahman, M.; Hasan, K.T. Sentiment Analysis of COVID-19 Vaccination from Survey Responses in Bangladesh. Researchsquare Preprint. 2021. Available online: https://assets.researchsquare.com/files/rs-482293/v1_stamped.pdf?c=1620421587 (accessed on 16 August 2021).
- Pew Research Centre. Parents of Young Children Are More ‘Vaccine Hesitant’; Pew Research Centre: Washington, DC, USA, 2017; Available online: https://www.pewresearch.org/fact-tank/2017/02/06/parents-of-young-children-are-more-vaccine-hesitant/ (accessed on 13 August 2021).
- Dror, A.A.; Eisenbach, N.; Taiber, S.; Morozov, N.G.; Mizrachi, M.; Zigron, A.; Srouji, S.; Sela, E. Vaccine hesitancy: The next challenge in the fight against COVID-19. Eur. J. Epidemiol. 2020, 35, 775–779. [Google Scholar] [CrossRef]
- Bendau, A.; Plag, J.; Petzold, M.B.; Strohle, A. COVID-19 vaccine hesitancy and related fears and anxiety. Int. Immunopharmacol. 2021, 97, 107724. [Google Scholar] [CrossRef]
- Alicke, M.D.; Braun, J.C.; Glor, J.E.; Klotz, K.L.; Magee, J.; Sederholm, H.; Siegel, R. Complaining Behaviour in social interactions. Personal. Soc. Psychol. Bull. 1992, 18, 286–295. [Google Scholar] [CrossRef]
- You, K.H.; Gretzel, U. What motivates consumers to write online travel reviews? Fac. Commer. 2008, 1, 282–296. [Google Scholar] [CrossRef]
- Eastwood, K.; Durrheim, D.N.; Jones, A.; Butler, M. Acceptance of pandemic (H1N1) 2009 influenza vaccination by the Australian public. Med. J. Aust. 2010, 192, 33–36. [Google Scholar] [CrossRef]
- Raude, J.; Caille-Brillet, A.-L.; Setbon, M. The 2009 pandemic H1N1 influenza vaccination in France: Who accepted to receive the vaccine and why? PLoS Curr. 2010, 2. [Google Scholar] [CrossRef] [PubMed]
- Maurer, J.; Harris, K.M.; Parker, A.M.; Lurie, N. Does receipt of seasonal influenza vaccine predict intention to receive novel H1N1 vaccine: Evidence from a nationally representative survey of U.S. adults. Vaccine 2009, 27, 5732–5734. [Google Scholar] [CrossRef][Green Version]
- Maurer, J.; Uscher-Pines, L.; Harris, K.M. Perceived seriousness of seasonal and A(H1N1) influenzas, attitudes toward vaccination, and vaccine uptake among U.S. adults: Does the source of information matter? Prev. Med. 2010, 51, 185–187. [Google Scholar] [CrossRef] [PubMed]
- Schwarzinger, M.; Flicoteaux, R.; Cortarenoda, S.; Obadia, Y.; Moatti, J.-P. Low Acceptability of A/H1N1 Pandemic Vaccination in French Adult Population: Did Public Health Policy Fuel Public Dissonance? PLoS ONE 2010, 5, 4. [Google Scholar] [CrossRef] [PubMed]
- Sypsa, V.; Livanios, T.; Psichogiou, M.; Malliori, M.; Tsiodras, S.; Nikolakopoulos, I.; Hatzakis, A. Public perceptions in relation to intention to receive pandemic influenza vaccination in a random population sample: Evidence from a cross-sectional telephone survey. Eurosurveillance 2009, 14, 19437. [Google Scholar] [CrossRef] [PubMed]
- Rubin, G.J.; Potts, H.; Michie, S. The impact of communications about swine flu (influenza A H1N1v) on public responses to the outbreak: Results from 36 national telephone surveys in the UK. Health Technol. Assess. 2010, 14, 183–266. [Google Scholar] [CrossRef] [PubMed]
- Seale, H.; Heywood, A.E.; McLaws, M.; Ward, K.F.; Lowbridge, C.P.; Van, D.; MacIntyre, C.R. Why do I need it? I am not at risk! Public perceptions towards the pandemic (H1N1) 2009 vaccine. BMC Infect. Dis. 2010, 10, 99. [Google Scholar] [CrossRef]
- Nguyen, T.; Henningsen, K.H.; Brehaut, J.C.; Hoe, E.; Wilson, K. Acceptance of a pandemic influenza vaccine: A systematic review of surveys of the general public. Infect. Drug Resist. 2011, 4, 197–207. [Google Scholar] [PubMed]
- Soni, R.; Mathai, J. Improved Twitter Sentiment Prediction through ‘Cluster-then-Predict Model. Int. J. Comput. Sci. Netw. 2015, 4, 2277–5420. [Google Scholar]


| Parameters | Details |
|---|---|
| Search terms | Vaccineforall, Vaccine, Antivaccine, Vaccinationcovid, Covid19, AstraZeneca, Astrazenecavaccine, Pfizer, Pfizervaccine, UKvaccinerollout, Covidvaccine, Covidvaccination, Covid19vaccine, Covid19vaccination, Modernavaccine, Oxfordvaccine, UKvaccine, AZvaccine, vaccinesideeffects, Antivax, Antivaxxer, Antivaxxers, OxfordAZvaccine, Moderna, Modernasideffects, Astrazenecasideffects, Pfizersideffects, Oxfordsideffects, seconddose, firstdose, Vaccineconspiracy, UKfightscorona, Covid19UK, Covidenier, vaccinehesitancy, AZvax, modernavax, anti-vaccination, anti-vax, anti-vaxxers, pro-vax, covid19jab |
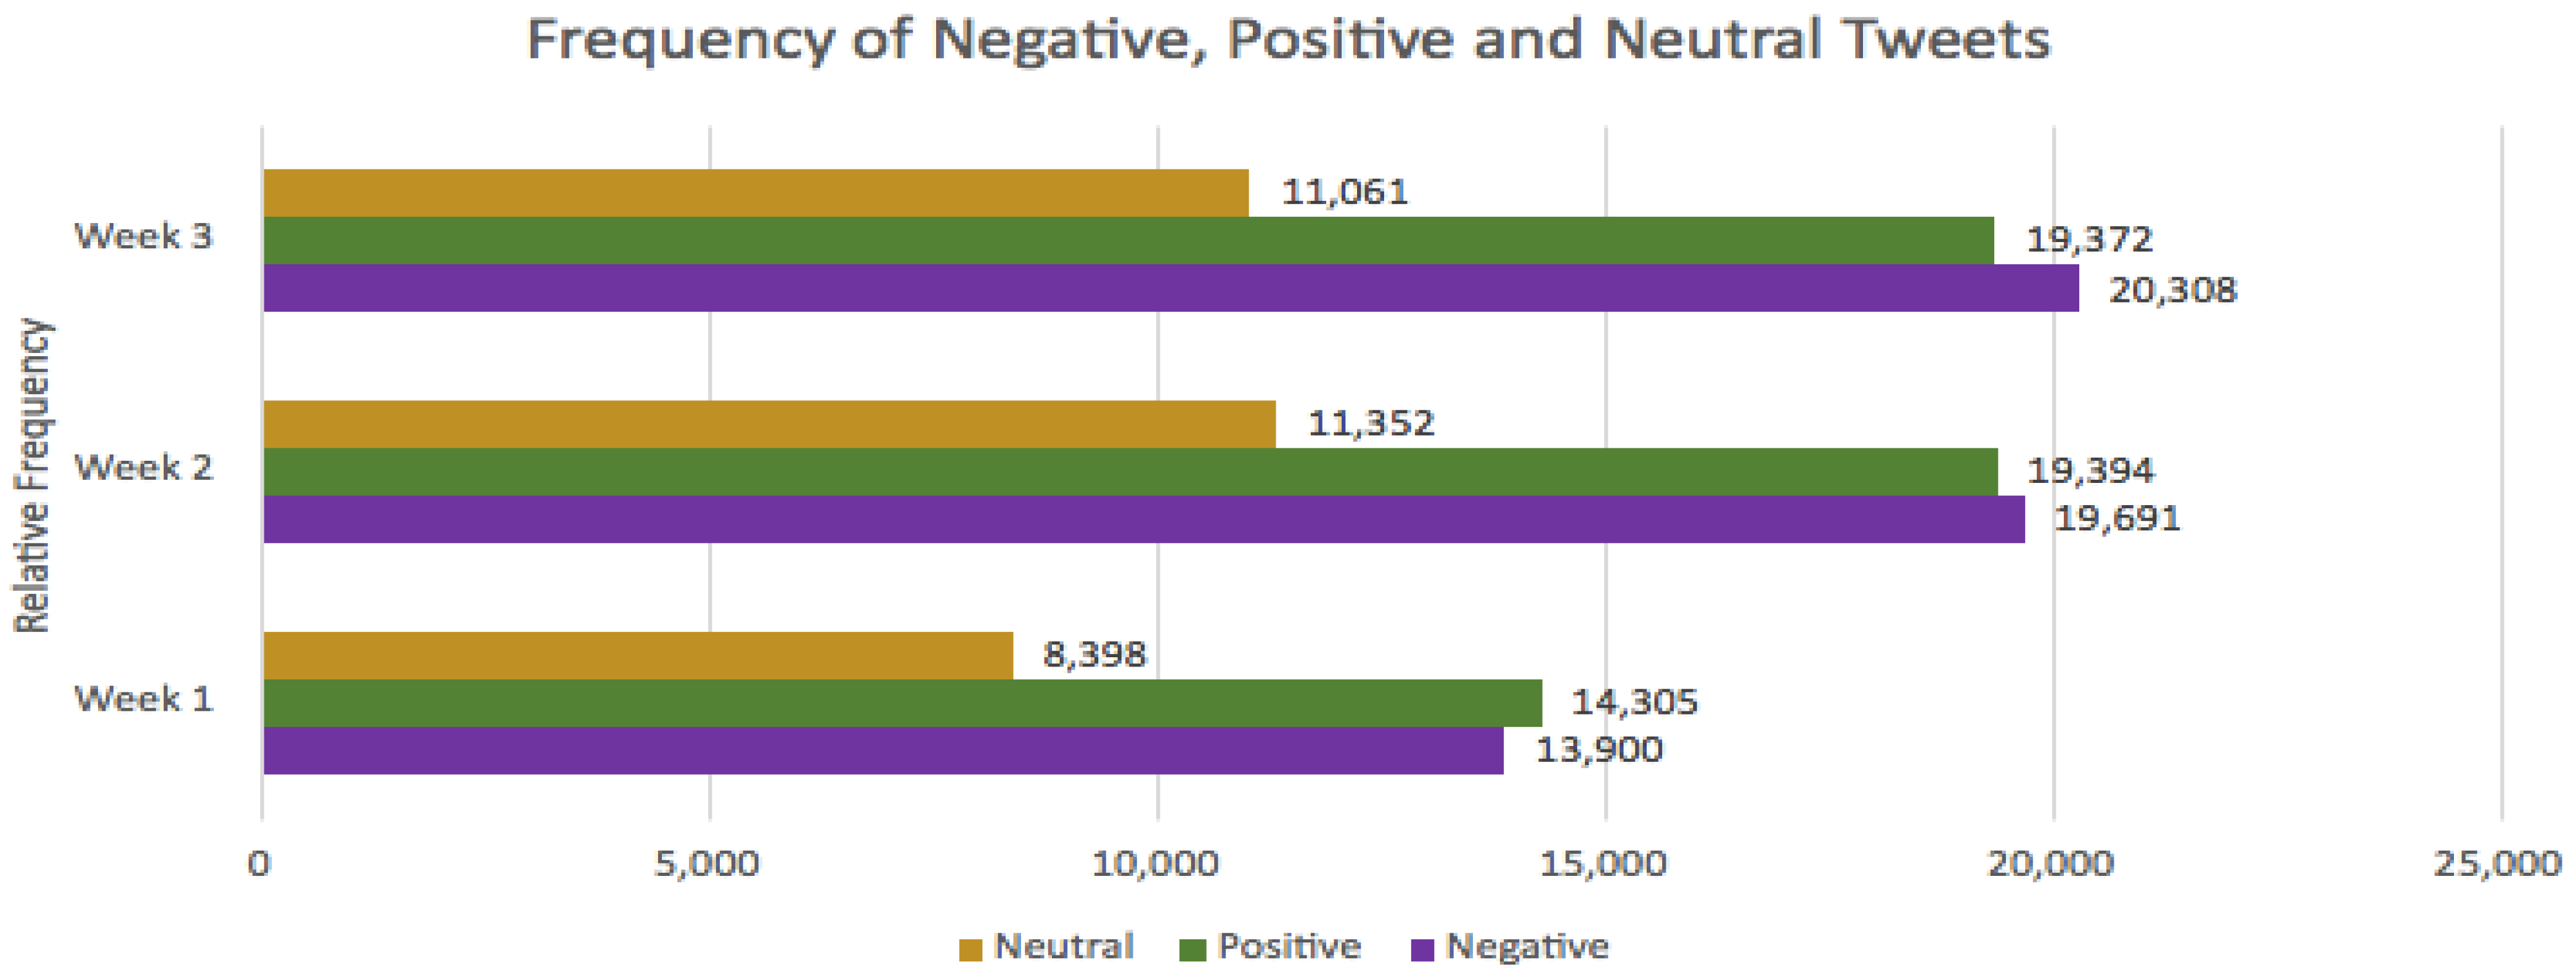
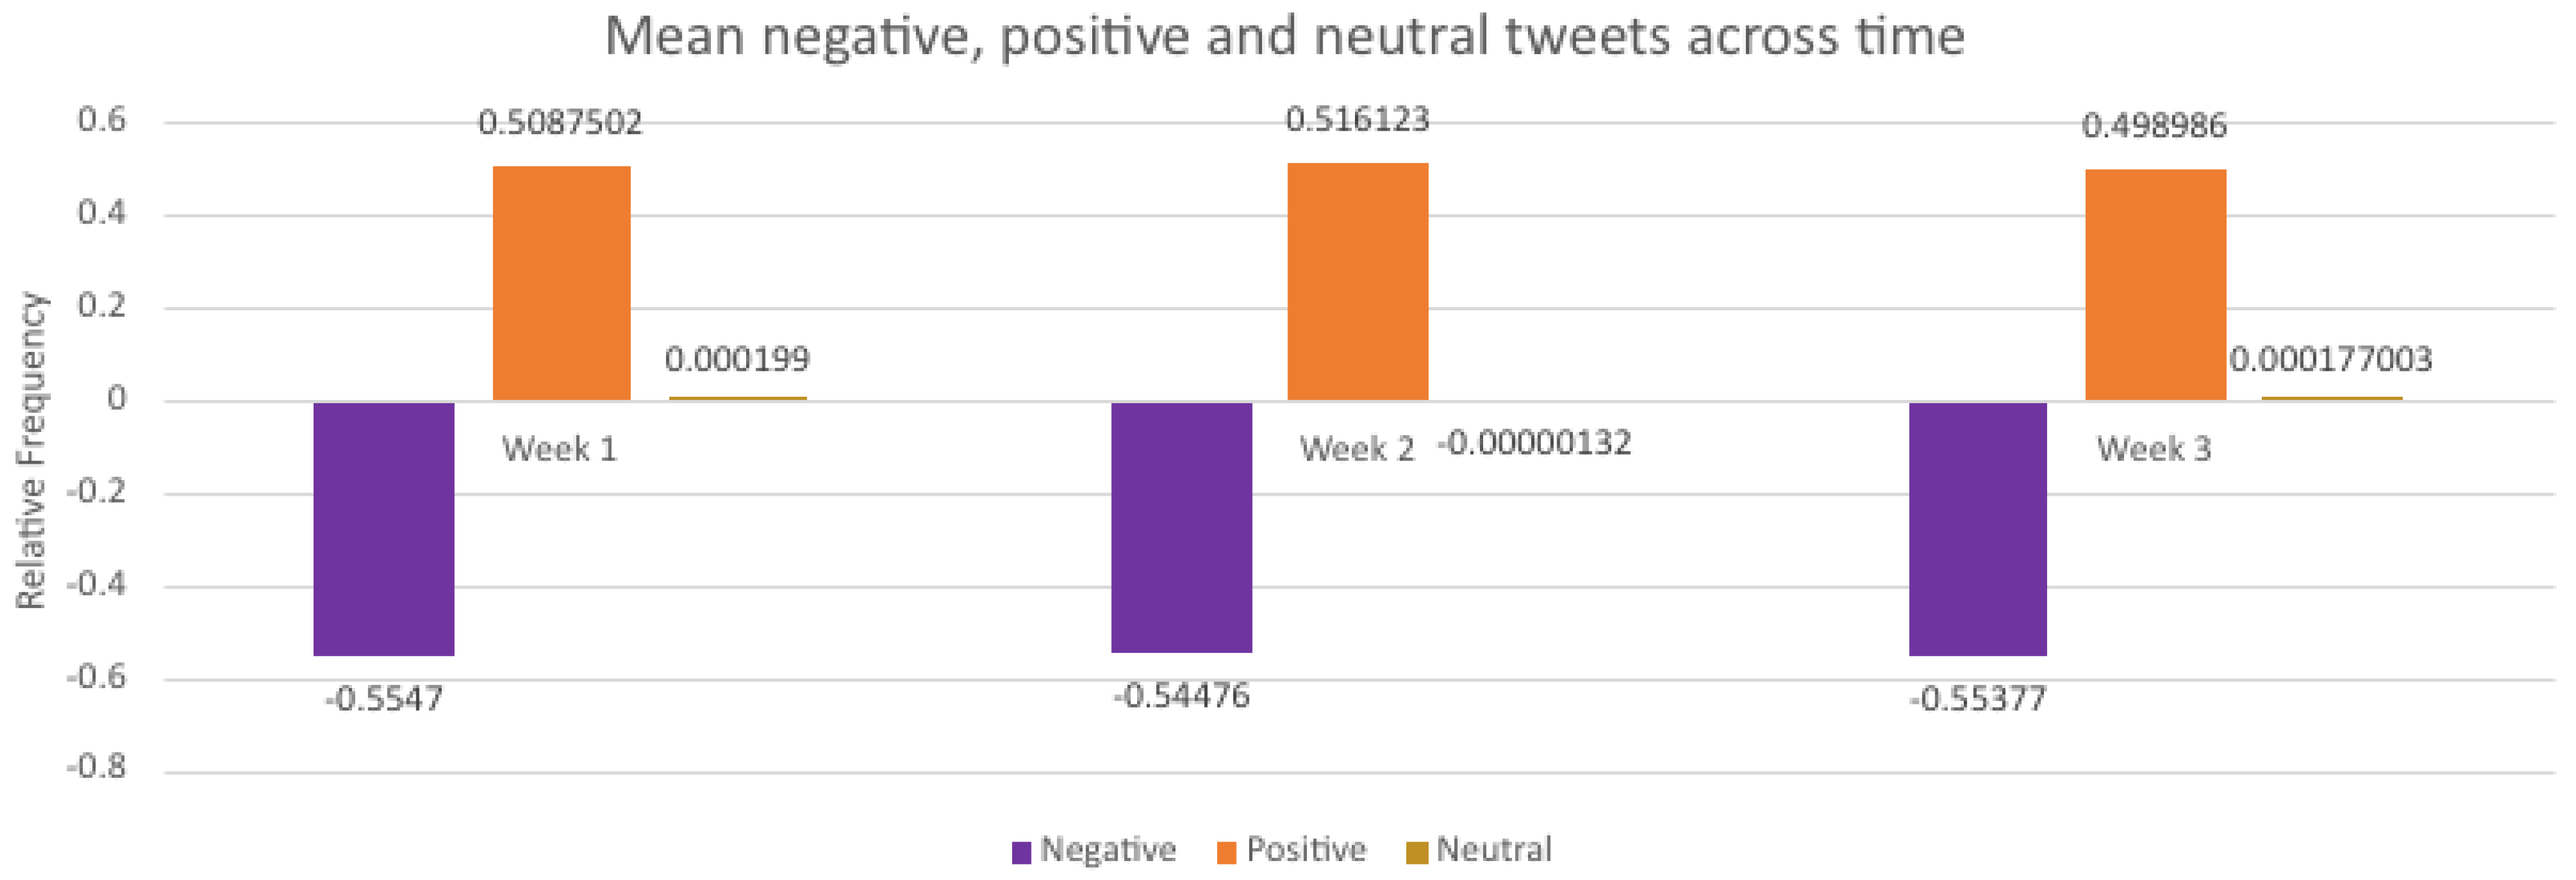
| Week | Negative Tweets | Positive Tweets | Neutral Tweets | Total Frequency | |||
|---|---|---|---|---|---|---|---|
| Frequency | Percentage (%) | Frequency | Percentage (%) | Frequency | Percentage (%) | ||
| 1 | 13,900 | 37.9 | 14,305 | 39.0 | 8398 | 22.9 | 36,603 |
| 2 | 19,691 | 39.0 | 19,394 | 38.4 | 11,352 | 22.5 | 50,437 |
| 3 | 20,308 | 40.0 | 19,372 | 38.1 | 11,061 | 21.7 | 50,741 |
| Total | 53,899 | 53,071 | 30,811 | ||||
| Source | DF | Sum of Square (SS) | Mean Square (MS) | F Statistic (df1df2) | p-Value |
|---|---|---|---|---|---|
| Week | 2 | 0.0001162 | 0.00005809 | 2.528 (2,4) | 0.1951 |
| Sentiment Groups | 2 | 1.6833 | 0.8416 | 36,625.9271 (2,4) | <0.001 |
| Error | 4 | 0.00009192 | 0.00002298 | ||
| Total | 8 | 1.6835 | 0.2104 |
| Category | n 1 | Mean | Std. dev 2 |
|---|---|---|---|
| Positive | 53,071 | 0.48196 | 0.246031 |
| Negative | 53,899 | 0.52706 | 0.258930 |
| Neutral | 30,812 | 0.50119 | 0.066879 |
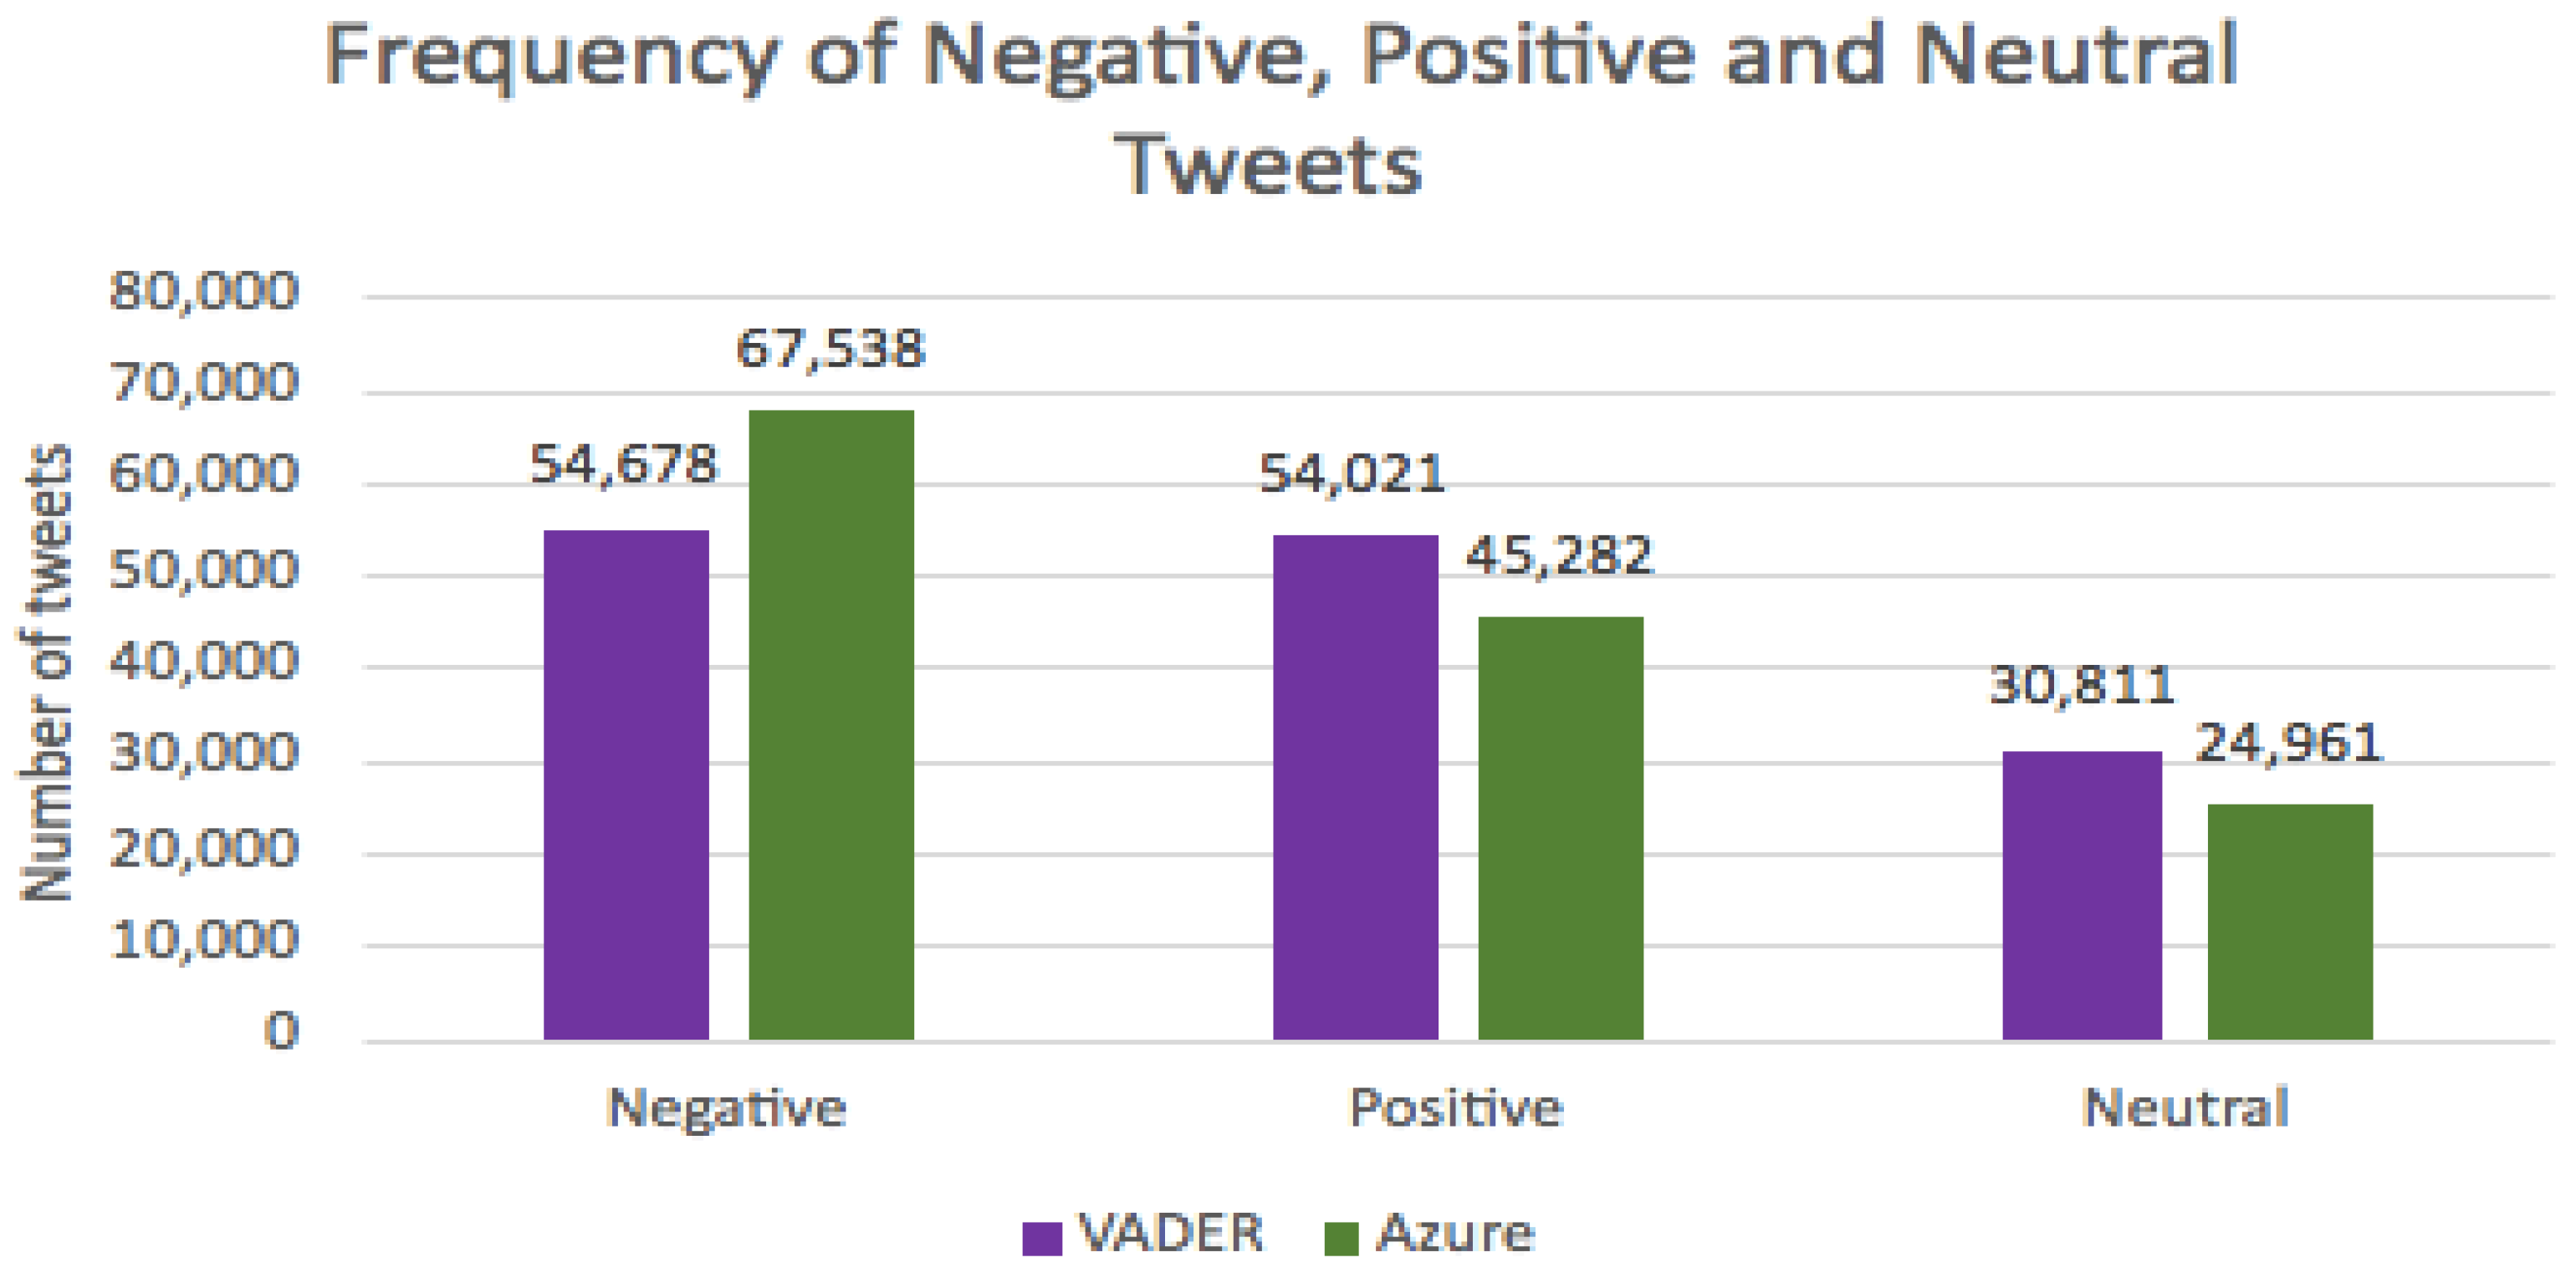
| Parameters | VADER | Azure |
|---|---|---|
| Positive | 53,071 | 45,282 |
| Negative | 53,899 | 67,538 |
| Neutral | 30,811 | 24,961 |
| Median | 0 | 0.459178 |
| Mean | −0.01978 | 0.445796 |
| Variance | 0.262321 | 0.071255 |
| Skewness | −0.04129 | 0.00218 |
| SD 1 | 0.512173 | 0.266937 |
| Total | 137,781 | 137,781 |
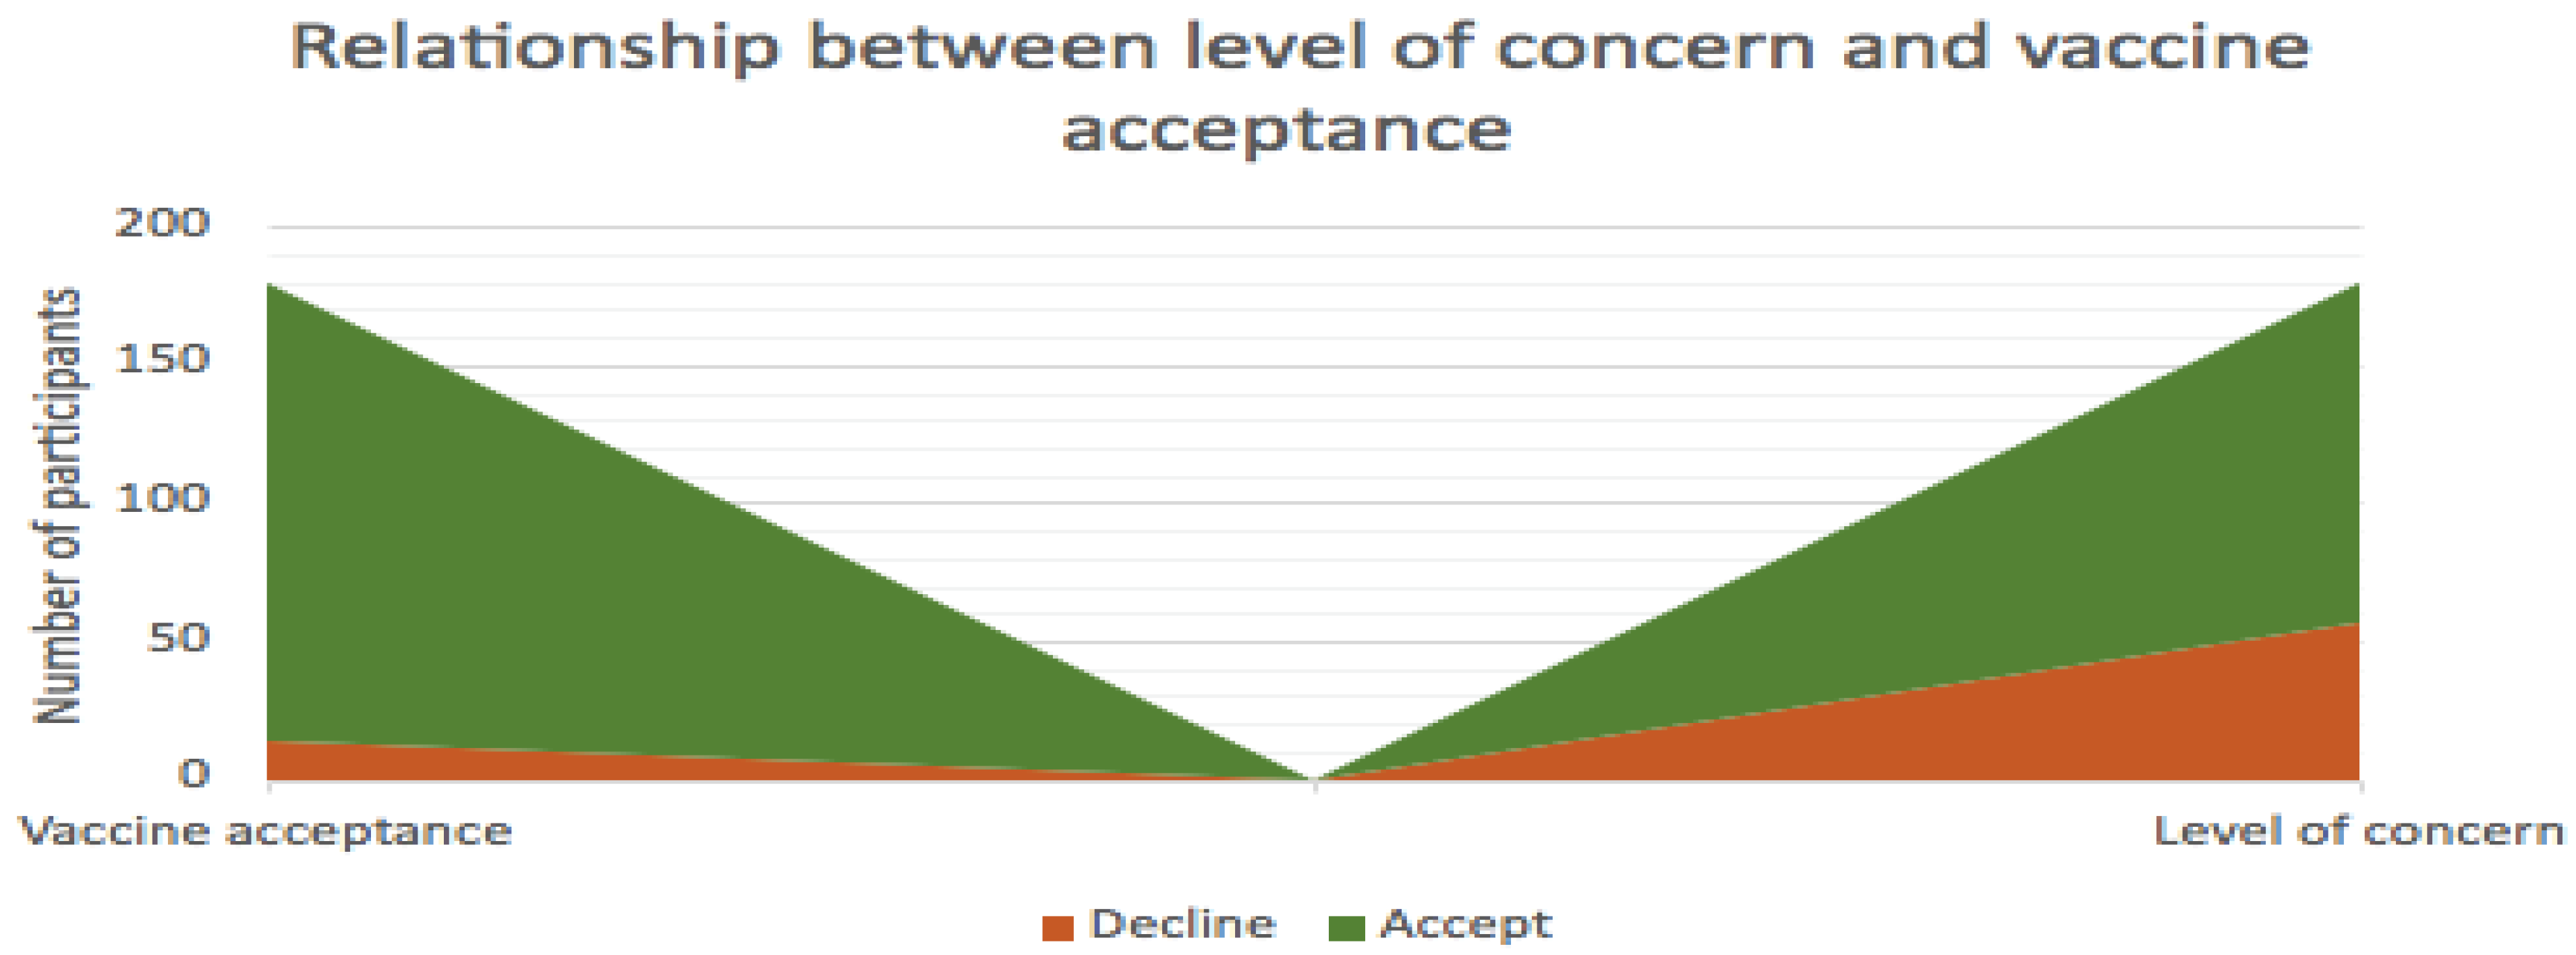
| Parameters | Vaccine Knowledge | Age | Time on Social Media | Vaccine History | Level of Concern | Vaccine Safety |
|---|---|---|---|---|---|---|
| Chi-Square (Observed value) | 2.14521 | 14.25356 | 3.421087 | 56.18451 | 116.8076 | 54.87902 |
| Chi-Square (Critical value) | 9.487729 | 18.30704 | 15.50731 | 9.487729 | 12.59159 | 9.487729 |
| DF | 6 | 10 | 8 | 4 | 6 | 15 |
| p-value | 0.905871 | 0.161737 | 0.905227 | <0.001 | <0.001 | <0.001 |
Publisher’s Note: MDPI stays neutral with regard to jurisdictional claims in published maps and institutional affiliations. |
© 2021 by the authors. Licensee MDPI, Basel, Switzerland. This article is an open access article distributed under the terms and conditions of the Creative Commons Attribution (CC BY) license (https://creativecommons.org/licenses/by/4.0/).
Share and Cite
Roe, C.; Lowe, M.; Williams, B.; Miller, C. Public Perception of SARS-CoV-2 Vaccinations on Social Media: Questionnaire and Sentiment Analysis. Int. J. Environ. Res. Public Health 2021, 18, 13028. https://doi.org/10.3390/ijerph182413028
Roe C, Lowe M, Williams B, Miller C. Public Perception of SARS-CoV-2 Vaccinations on Social Media: Questionnaire and Sentiment Analysis. International Journal of Environmental Research and Public Health. 2021; 18(24):13028. https://doi.org/10.3390/ijerph182413028
Chicago/Turabian StyleRoe, Charlotte, Madison Lowe, Benjamin Williams, and Clare Miller. 2021. "Public Perception of SARS-CoV-2 Vaccinations on Social Media: Questionnaire and Sentiment Analysis" International Journal of Environmental Research and Public Health 18, no. 24: 13028. https://doi.org/10.3390/ijerph182413028
APA StyleRoe, C., Lowe, M., Williams, B., & Miller, C. (2021). Public Perception of SARS-CoV-2 Vaccinations on Social Media: Questionnaire and Sentiment Analysis. International Journal of Environmental Research and Public Health, 18(24), 13028. https://doi.org/10.3390/ijerph182413028