
Field Trial of an Automated Batch Chlorinator System at Two Shared Shallow Tubewells among Camps for Forcibly Displaced Myanmar Nationals (FDMN) in Cox’s Bazar, Bangladesh

 ,
,  , ,
, ,  and
and
Abstract

1. Introduction
2. Materials and Methods
2.1. Study Settings and Design
2.2. Field Team
2.3. Study Participants
2.4. Baseline, Seven-Day Follow-Up, and End-Line Data Collection
2.5. Baseline, Immediate Seven Days and Weekly Water Quality Assessment
2.6. Qualitative Interviews
2.7. Intervention Components
2.7.1. Chlorine Purchase, Dilution, and Dose Adjustment
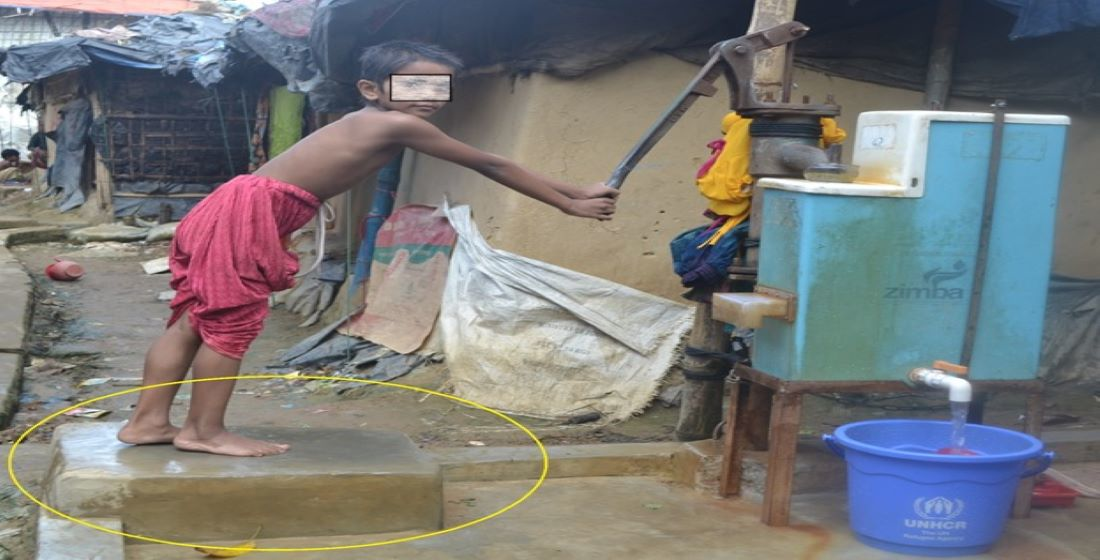
2.7.2. The Zimba Device and Its Installation
- A dispenser made of polypropylene containing diluted bleach (NaOCl);
- A dosing chamber containing a siphon made of polypropylene;
- An outer box made of food grade fiberglass that holds the siphon tank and the dispenser.
2.7.3. Water Storage Containers
2.7.4. Intervention Delivery
2.8. Water Sample Laboratory Analysis
2.9. Quantitative Data Analysis
2.10. Qualitative Data Analysis
3. Results
3.1. Baseline Characteristics
3.1.1. Physiochemical Properties of Water from 4 Selected Tubewells
3.1.2. Demographic and Socioeconomic Status
3.1.3. Water Collection and Storage Practice
3.1.4. Household Stored Water Quality
3.2. Follow-Up and End-Line Visits
3.3. Acceptability and Perception of Chlorine-Treated Water
3.4. Interaction between Iron Concentration and Free Residual Chlorine
4. Discussion
5. Conclusions and Public Health Relevance
Supplementary Materials
Author Contributions
Funding
Institutional Review Board Statement
Informed Consent Statement
Data Availability Statement
Acknowledgments
Conflicts of Interest
References
- World Health Organization. Drinking-Water. Available online: https://www.who.int/news-room/fact-sheets/detail/drinking-water (accessed on 3 February 2019).
- Ramesh, A.; Blanchet, K.; Ensink, J.H.J.; Roberts, B. Evidence on the Effectiveness of Water, Sanitation, and Hygiene (WASH) Interventions on Health Outcomes in Humanitarian Crises: A Systematic Review. PLoS ONE 2015, 10, e0124688. [Google Scholar]
- Shannon, K.; Hast, M.; Azman, A.S.; Legros, D.; McKay, H.; Lessler, J. Cholera prevention and control in refugee settings: Successes and continued challenges. PLoS Negl. Trop. Dis. 2019, 13, e0007347. [Google Scholar] [CrossRef]
- Haar, R.J.; Wang, K.; Venters, H.; Salonen, S.; Patel, R.; Nelson, T.; Mishori, R.; Parmar, P.K. Documentation of human rights abuses among Rohingya refugees from Myanmar. Confl. Health 2019, 13, 42. [Google Scholar] [CrossRef] [PubMed]
- Messner, N.; Woods, A.; Petty, A.; Parmar, P.K.; Leigh, J.; Thomas, E.; Curry, D.; Venters, H.; Gilbert, A.; Nelson, T.; et al. Qualitative evidence of crimes against humanity: The August 2017 attacks on the Rohingya in northern Rakhine State, Myanmar. Confl. Health 2019, 13, 41. [Google Scholar] [CrossRef]
- United Nations High Commissioner for Refugees. Fighting Water Scarcity in Cox’s Bazar Refugee Camps. Available online: https://www.unhcr.org/news/latest/2019/1/5c2fc16a4/fighting-water-scarcity-coxs-bazar-refugee-camps.html (accessed on 29 August 2020).
- Hasan, M.K.; Shahriar, A.; Jim, K.U. Water pollution in Bangladesh and its impact on public health. Heliyon 2019, 5, e02145. [Google Scholar] [CrossRef]
- Mahmud, Z.H.; Kabir, M.H.; Ali, S.; Moniruzzaman, M.; Imran, K.M.; Nafiz, T.N.; Islam, M.S.; Hussain, A.; Hakim, S.A.I.; Worth, M.; et al. Extended-Spectrum Beta-Lactamase-Producing Escherichia coli in Drinking Water Samples From a Forcibly Displaced, Densely Populated Community Setting in Bangladesh. Front. Public Health 2020, 8, 228. [Google Scholar] [CrossRef] [PubMed]
- Geen, A.V.; Ahmed, K.M.; Akita, Y.; Alam, M.J.; Culligan, P.J.; Emch, M.; Escamilla, V.; Feighery, J.; Ferguson, A.S.; Knappett, P.; et al. Fecal Contamination of Shallow Tubewells in Bangladesh Inversely Related to Arsenic. Environ. Sci. Technol. 2011, 45, 1199–1205. [Google Scholar] [CrossRef] [PubMed]
- icddr,b.; unicef. Fact Sheet-8: A Bacteriological Water Quality Issue: Rohingya “Forcefully Displaced Myanmar Citizen” Camp in Cox’s Bazar, Bangladesh. Available online: https://reliefweb.int/sites/reliefweb.int/files/resources/fact_sheet-8_upto_6th_august-2018_final.pdf (accessed on 15 April 2019).
- World Health Organization. 330 000 Rohingyas and Host Community to get Cholera Vaccine in Cox’s Bazar. Available online: https://www.who.int/bangladesh/news/detail/17-11-2018-330-000-rohingyas-and-host-community-to-get-cholera-vaccine-in-cox-s-bazar (accessed on 7 July 2021).
- Lantagne, D.; Clasen, T. Effective use of household water treatment and safe storage in response to the 2010 Haiti earthquake. Am. J. Trop. Med. Hyg. 2013, 89, 426–433. [Google Scholar] [CrossRef]
- Lantagne, D.S.; Blount, B.C.; Cardinali, F.; Quick, R. Disinfection by-product formation and mitigation strategies in point-of-use chlorination of turbid and non-turbid waters in western Kenya. J. Water Health 2008, 6, 67–82. [Google Scholar] [CrossRef]
- Alam, M.U.; Unicomb, L.; Ahasan, S.M.M.; Amin, N.; Biswas, D.; Ferdous, S.; Afrin, A.; Sarker, S.; Rahman, M. Barriers and Enabling Factors for Central and Household Level Water Treatment in a Refugee Setting: A Mixed-Method Study among Rohingyas in Cox’s Bazar, Bangladesh. Water 2020, 12, 3149. [Google Scholar] [CrossRef]
- Dhar, R.K.; Zheng, Y.; Stute, M.; van Geen, A.; Cheng, Z.; Shanewaz, M.; Shamsudduha, M.; Hoque, M.A.; Rahman, M.W.; Ahmed, K.M. Temporal variability of groundwater chemistry in shallow and deep aquifers of Araihazar, Bangladesh. J. Contam. Hydrol. 2008, 99, 97–111. [Google Scholar] [CrossRef]
- Loo, S.-L.; Fane, A.G.; Krantz, W.B.; Lim, T.T. Emergency water supply: A review of potential technologies and selection criteria. Water Res. 2012, 46, 3125–3151. [Google Scholar] [CrossRef]
- Crider, Y.; Sultana, S.; Unicomb, L.; Davis, J.; Luby, S.P.; Pickering, A.J. Can you taste it? Taste detection and acceptability thresholds for chlorine residual in drinking water in Dhaka, Bangladesh. Sci. Total Environ. 2018, 613, 840–846. [Google Scholar] [CrossRef]
- Yeasmin, F.; Sultana, F.; Unicomb, L.; Nizame, F.A.; Rahman, M.; Kabir, H.; Winch, P.J.; Luby, S.P. Piloting a Shared Source Water Treatment Intervention among Elementary Schools in Bangladesh. Am. J. Trop. Med. Hyg. 2019, 101, 984–993. [Google Scholar] [CrossRef]
- Clasen, T.; Edmondson, P. Sodium dichloroisocyanurate (NaDCC) tablets as an alternative to sodium hypochlorite for the routine treatment of drinking water at the household level. Int. J. Hyg. Environ. Health 2006, 209, 173–181. [Google Scholar] [CrossRef]
- Kremer, M.; Leino, J.; Miguel, E.; Zwane, A.P. Spring cleaning: Rural water impacts, valuation, and property rights institutions. Q. J. Econ. 2011, 126, 145–205. [Google Scholar] [CrossRef]
- Akhter, M.; Uddin, S.M.N.; Rafa, N.; Hridi, S.M.; Staddon, C.; Powell, W. Drinking Water Security Challenges in Rohingya Refugee Camps of Cox’s Bazar, Bangladesh. Sustainability 2020, 12, 7325. [Google Scholar] [CrossRef]
- Amin, N.; Crider, Y.S.; Unicomb, L.; Das, K.K.; Gope, P.S.; Mahmud, Z.H.; Islam, M.S.; Davis, J.; Luby, S.P.; Pickering, A.J. Field trial of an automated batch chlorinator system at shared water points in an urban community of Dhaka, Bangladesh. J. Water Sanit. Hyg. Dev. 2016, 6, 32–41. [Google Scholar] [CrossRef][Green Version]
- Pickering, A.J.; Crider, Y.; Amin, N.; Bauza, V.; Unicomb, L.; Davis, J.; Luby, S.P. Differences in Field Effectiveness and Adoption between a Novel Automated Chlorination System and Household Manual Chlorination of Drinking Water in Dhaka, Bangladesh: A Randomized Controlled Trial. PLoS ONE 2015, 10, e0118397. [Google Scholar]
- Pickering, A.J.; Crider, Y.; Sultana, S.; Swarthout, J.; Goddard, F.G.B.; Anjerul Islam, S.; Sen, S.; Ayyagari, R.; Luby, S.P. Effect of in-line drinking water chlorination at the point of collection on child diarrhoea in urban Bangladesh: A double-blind, cluster-randomised controlled trial. Lancet Glob. Health 2019, 7, e1247–e1256. [Google Scholar] [CrossRef]
- Wisdom, J.; Creswell, J.W. Mixed Methods: Integrating Quantitative and Qualitative Data Collection and Analysis While Studying Patient-Centered Medical Home Models; Agency for Healthcare Research and Quality: Rockville, MD, USA, 2013; AHRQ publication No. 13-0028-EF. Available online: https://pcmh.ahrq.gov/sites/default/files/attachments/MixedMethods_032513comp.pdf (accessed on 16 October 2021).
- Lippy, E.C. Chlorination to Prevent and Control Waterborne Diseases. J.—AWWA 1986, 78, 49–52. [Google Scholar] [CrossRef]
- IDEXX. IDEXX Summary: Evaluation of Colilert and Interolert Defined Substrate Methodology for Wastewater Application. Available online: http://www.idexx.co.uk/pdf/en_gb/water/64194006K.pdf (accessed on 1 February 2018).
- Amin, N.; Liu, P.; Foster, T.; Rahman, M.; Miah, M.R.; Ahmed, G.B.; Kabir, M.; Raj, S.; Moe, C.L.; Willetts, J. Pathogen flows from on-site sanitation systems in low-income urban neighborhoods, Dhaka: A quantitative environmental assessment. Int. J. Hyg. Environ. Health 2020, 230, 113619. [Google Scholar] [CrossRef] [PubMed]
- Amin, N.; Pickering, A.J.; Ram, P.K.; Unicomb, L.; Najnin, N.; Homaira, N.; Ashraf, S.; Abedin, J.; Islam, M.S.; Luby, S.P. Microbiological evaluation of the efficacy of soapy water to clean hands: A randomized, non-inferiority field trial. Am. J. Trop. Med. Hyg. 2014, 91, 415–423. [Google Scholar] [CrossRef]
- Amin, N.; Rahman, M.; Raj, S.; Ali, S.; Green, J.; Das, S.; Doza, S.; Mondol, M.H.; Wang, Y.; Islam, M.A.; et al. Quantitative assessment of fecal contamination in multiple environmental sample types in urban communities in Dhaka, Bangladesh using SaniPath microbial approach. PLoS ONE 2019, 14, e0221193. [Google Scholar] [CrossRef] [PubMed]
- World Health Organization. Total Dissolved Solids in Drinking-Water: Background Document for Development of WHO Guidelines for Drinking-Water Quality. Available online: https://www.who.int/water_sanitation_health/dwq/chemicals/tds.pdf (accessed on 14 August 2021).
- Sikder, M.; Mirindi, P.; String, G.; Lantagne, D. Delivering Drinking Water by Truck in Humanitarian Contexts: Results from Mixed-Methods Evaluations in the Democratic Republic of the Congo and Bangladesh. Environ. Sci. Technol. 2020, 54, 5041–5050. [Google Scholar] [CrossRef]
- Steele, A.; Clarke, B.; Watkins, O. Impact of jerry can disinfection in a camp environment—Experiences in an IDP camp in Northern Uganda. J. Water Health 2008, 6, 559–564. [Google Scholar] [CrossRef]
- CDC. Safe Water Storage. Available online: https://www.cdc.gov/safewater/storage.html (accessed on 14 August 2021).
- Ercumen, A.; Naser, A.M.; Unicomb, L.; Arnold, B.F.; Colford, J.M., Jr.; Luby, S.P. Effects of source-versus household contamination of tubewell water on child diarrhea in rural Bangladesh: A randomized controlled trial. PLoS ONE 2015, 10, e0121907. [Google Scholar] [CrossRef] [PubMed]
- World Health Organization. Guidelines for Drinking-Water Quality, 2nd ed.—Volume 3: Surveillance and Control of Community Supplies. Available online: https://www.who.int/publications/i/item/9241545038 (accessed on 14 August 2021).
- Clasen, T.F.; Bastable, A. Faecal contamination of drinking water during collection and household storage: The need to extend protection to the point of use. J. Water Health 2003, 1, 109–115. [Google Scholar] [CrossRef]
- Quick, R.E.; Venczel, L.V.; Gonzalez, O.; Mintz, E.D.; Highsmith, A.K.; Espada, A.; Damiani, E.; Bean, N.H.; De Hannover, E.H.; Tauxe, R.V. Narrow-mouthed water storage vessels and in situ chlorination in a Bolivian community: A simple method to improve drinking water quality. Am. J. Trop. Med. Hyg. 1996, 54, 511–516. [Google Scholar]
- Naser, A.M.; Higgins, E.M.; Arman, S.; Ercumen, A.; Ashraf, S.; Das, K.K.; Rahman, M.; Luby, S.P.; Unicomb, L. Effect of Groundwater Iron on Residual Chlorine in Water Treated with Sodium Dichloroisocyanurate Tablets in Rural Bangladesh. Am. J. Trop. Med. Hyg. 2018, 98, 977–983. [Google Scholar] [CrossRef]
- Merrill, R.D.; Labrique, A.B.; Shamim, A.A.; Schulze, K.; Christian, P.; Merrill, R.K.; West, K.P., Jr. Elevated and variable groundwater iron in rural northwestern Bangladesh. J. Water Health 2010, 8, 818–825. [Google Scholar] [CrossRef][Green Version]
- Khadse, G.K.; Patni, P.M.; Labhasetwar, P.K. Removal of iron and manganese from drinking water supply. Sustain. Water Resour. Manag. 2015, 1, 157–165. [Google Scholar] [CrossRef]
- Ayotte, J.D.; Nielsen, M.G.; Robinson, G.R., Jr.; Moore, R.B. Relation of Arsenic, Iron, and Manganese in Ground Water to Aquifer Type, Bedrock Lithogeochemistry, and Land Use in the New England Coastal Basins; US Department of the Interior, US Geological Survey: Reston, VA, USA, 1999; Volume 99, p. 4162.
- Hrudey, S.E. Chlorination disinfection by-products, public health risk tradeoffs and me. Water Res. 2009, 43, 2057–2092. [Google Scholar] [CrossRef] [PubMed]
- Costet, N.; Villanueva, C.M.; Jaakkola, J.J.K.; Kogevinas, M.; Cantor, K.P.; King, W.D.; Lynch, C.F.; Nieuwenhuijsen, M.J.; Cordier, S. Water disinfection by-products and bladder cancer: Is there a European specificity? A pooled and meta-analysis of European case–control studies. Occup. Environ. Med. 2011, 68, 379–385. [Google Scholar] [CrossRef] [PubMed]
- Luby, S.P.; Mendoza, C.; Keswick, B.H.; Chiller, T.M.; Hoekstra, R.M. Difficulties in bringing point-of-use water treatment to scale in rural Guatemala. Am. J. Trop. Med. Hyg. 2008, 78, 382–387. [Google Scholar] [CrossRef]
- Schmidt, W.P.; Cairncross, S. Household water treatment in poor populations: Is there enough evidence for scaling up now? Environ. Sci. Technol. 2009, 43, 986–992. [Google Scholar] [CrossRef] [PubMed]


| Characteristics | Households n = 20, n (%) |
|---|---|
| Demographics | |
| Mean age (years) of the respondents (range) | 37 (18–65) |
| Education of the respondents | |
| No formal schooling | 13 (65) |
| Up to 5th grade | 4 (20) |
| Secondary School | 3 (15) |
| Education of the household head | |
| No formal schooling | 7 (35) |
| Up to 5th grade | 5 (25) |
| Secondary School | 6 (30) |
| College/University | 1 (5) |
| Mean number of children/household <5 (SD) | 2 (1.3) |
| Mean number of household members (SD) | 6 (3.2) |
| Occupation of the household head | |
| Fixed/contractual job | 7 (35) |
| Self-employed or own business | 5 (25) |
| Day labor | 6 (30) |
| Unemployed | 2 (10) |
| 1 Household income | |
| No income | 2 (10) |
| =<5000 BDT (=< USD 60) | 9 (45) |
| >5000 BDT–<10,000 BDT (>60–< USD 115) | 6 (30) |
| 10,000 BDT or above (=> USD 115) | 3 (15) |
| Average household income (BDT) (range) | 5705 (0–15,000) |
| Water collection and storage practice | |
| Vessels used for drinking water collection | |
| Kolshi (traditional metal pot, 5 L and 10 L) | 12 (60) |
| Bucket (10 L and 15 L) | 4 (20) |
| Plastic jug (2–3 L) | 4 (20) |
| Observed Water storage covering | |
| Fully covered with solid lid | 6 (30) |
| Partially covered/covered with non-solid lid (paper/perforated lid) | 12 (60) |
| Not covered | 2 (10) |
| 2 Level of satisfaction with existing drinking water | |
| Generally satisfied with water supply (amount available plus quality) | 19 (95) |
| Water available at sources at a predictable time (Yes) | 20 (100) |
| Water available 24 h | 20 (100) |
| Described water taste as good | 19 (95) |
| Described water taste as not good (e.g., soil, dirt, chemical smell) | 1 (5) |
| Source Water | Baseline Stored Water 1 | Immediately after Treatment | Post-Treated Follow-up Visits: Stored Water | Mean Differences between Baseline vs. Post-Treated Follow-up Visits | ||||
|---|---|---|---|---|---|---|---|---|
| Tubewell n (%) | Household Own Vessel n (%) | Zimba Water n (%) | Household Own Vessel n (%) | Project-Provided Safe Storage Containers 3 n (%) | Baseline Household Stored Water Minus Post-Treated Household Own Vessel (95% CI) | Baseline Household Stored Water Minus Project-Provided Safe Storage (95% CI) | Project-Provided Safe storage Container Minus Post-Treated Household Own Vessel (95% CI) | |
| Turbidity (NTU) | n = 2 | n = 20 | n = 2 | n = 84 | n = 15 | |||
| <5 | 2 2 (100) | 17 (85) | 3 2 (100) | 77 (91.7) | 14 (93.7) | |||
| 5 and above | 0 | 3 (15) | 0 | 7 (8.3) | 1 (6.7) | |||
| Mean (SD) | 2.55 (2.3) | 2.6 (5.7) | 2.50 (2.2) | 1.8 (3.2) | 2.81 (2.7) | 0.76 (−1.96, 3.48) | −0.21 (−3.170, 2.749) | 0.97 (−2.587, 0.650) |
| Total Dissolved Solids (ppm) | n = 2 | n = 20 | n = 2 | n = 133 | n = 22 | |||
| <300 (excellent) | 2 2 (100) | 10 (50) | 2 2 (66.7) | 70 (52.5) | 12 (54.6) | |||
| 300–500 (fair) | 0 | 10 (50) | 1 2 (33.3) | 63 (47.3) | 10 (45.5) | |||
| Mean (SD) | 240.3 (119.9) | 238.0 (92.2) | 215.3 (115.9) | 253.1 (88.9) | 235.4 (90.0) | −15.1 (−60.45, 30.29) | 2.69 (−54.265, 59.638) | 17.76 (−24.588, 60.117) |
| Iron concentration (mg/L) | n = 12 | n = 20 | n = 2 | n = 79 | n = 17 | |||
| <1 | 0 | 9 (45) | 0 | 35 (28.2) | 10 (58.8) | |||
| 1- <3 | 6 (50.0) | 4 (20) | 1 (14.3) | 27 (34.2) | 0 | |||
| 3- < 5 | 0 | 2(10) | 0 | 3 (3.8) | 0 | |||
| 5 or above | 6 (50.0) | 5 (25) | 6 (85.7) | 14 (17.7) | 7 (41.2) | |||
| Mean (SD) | 4.0 (2.1) | 2.2 (2.4) | 5.8 (1.9) | 1.9 (2.1) | 2.8 (2.9) | 0.59 (−0.846, 1.57) | −0.54 (−2.34, 1.26) | −0.91 (−2.45, 0.63) |
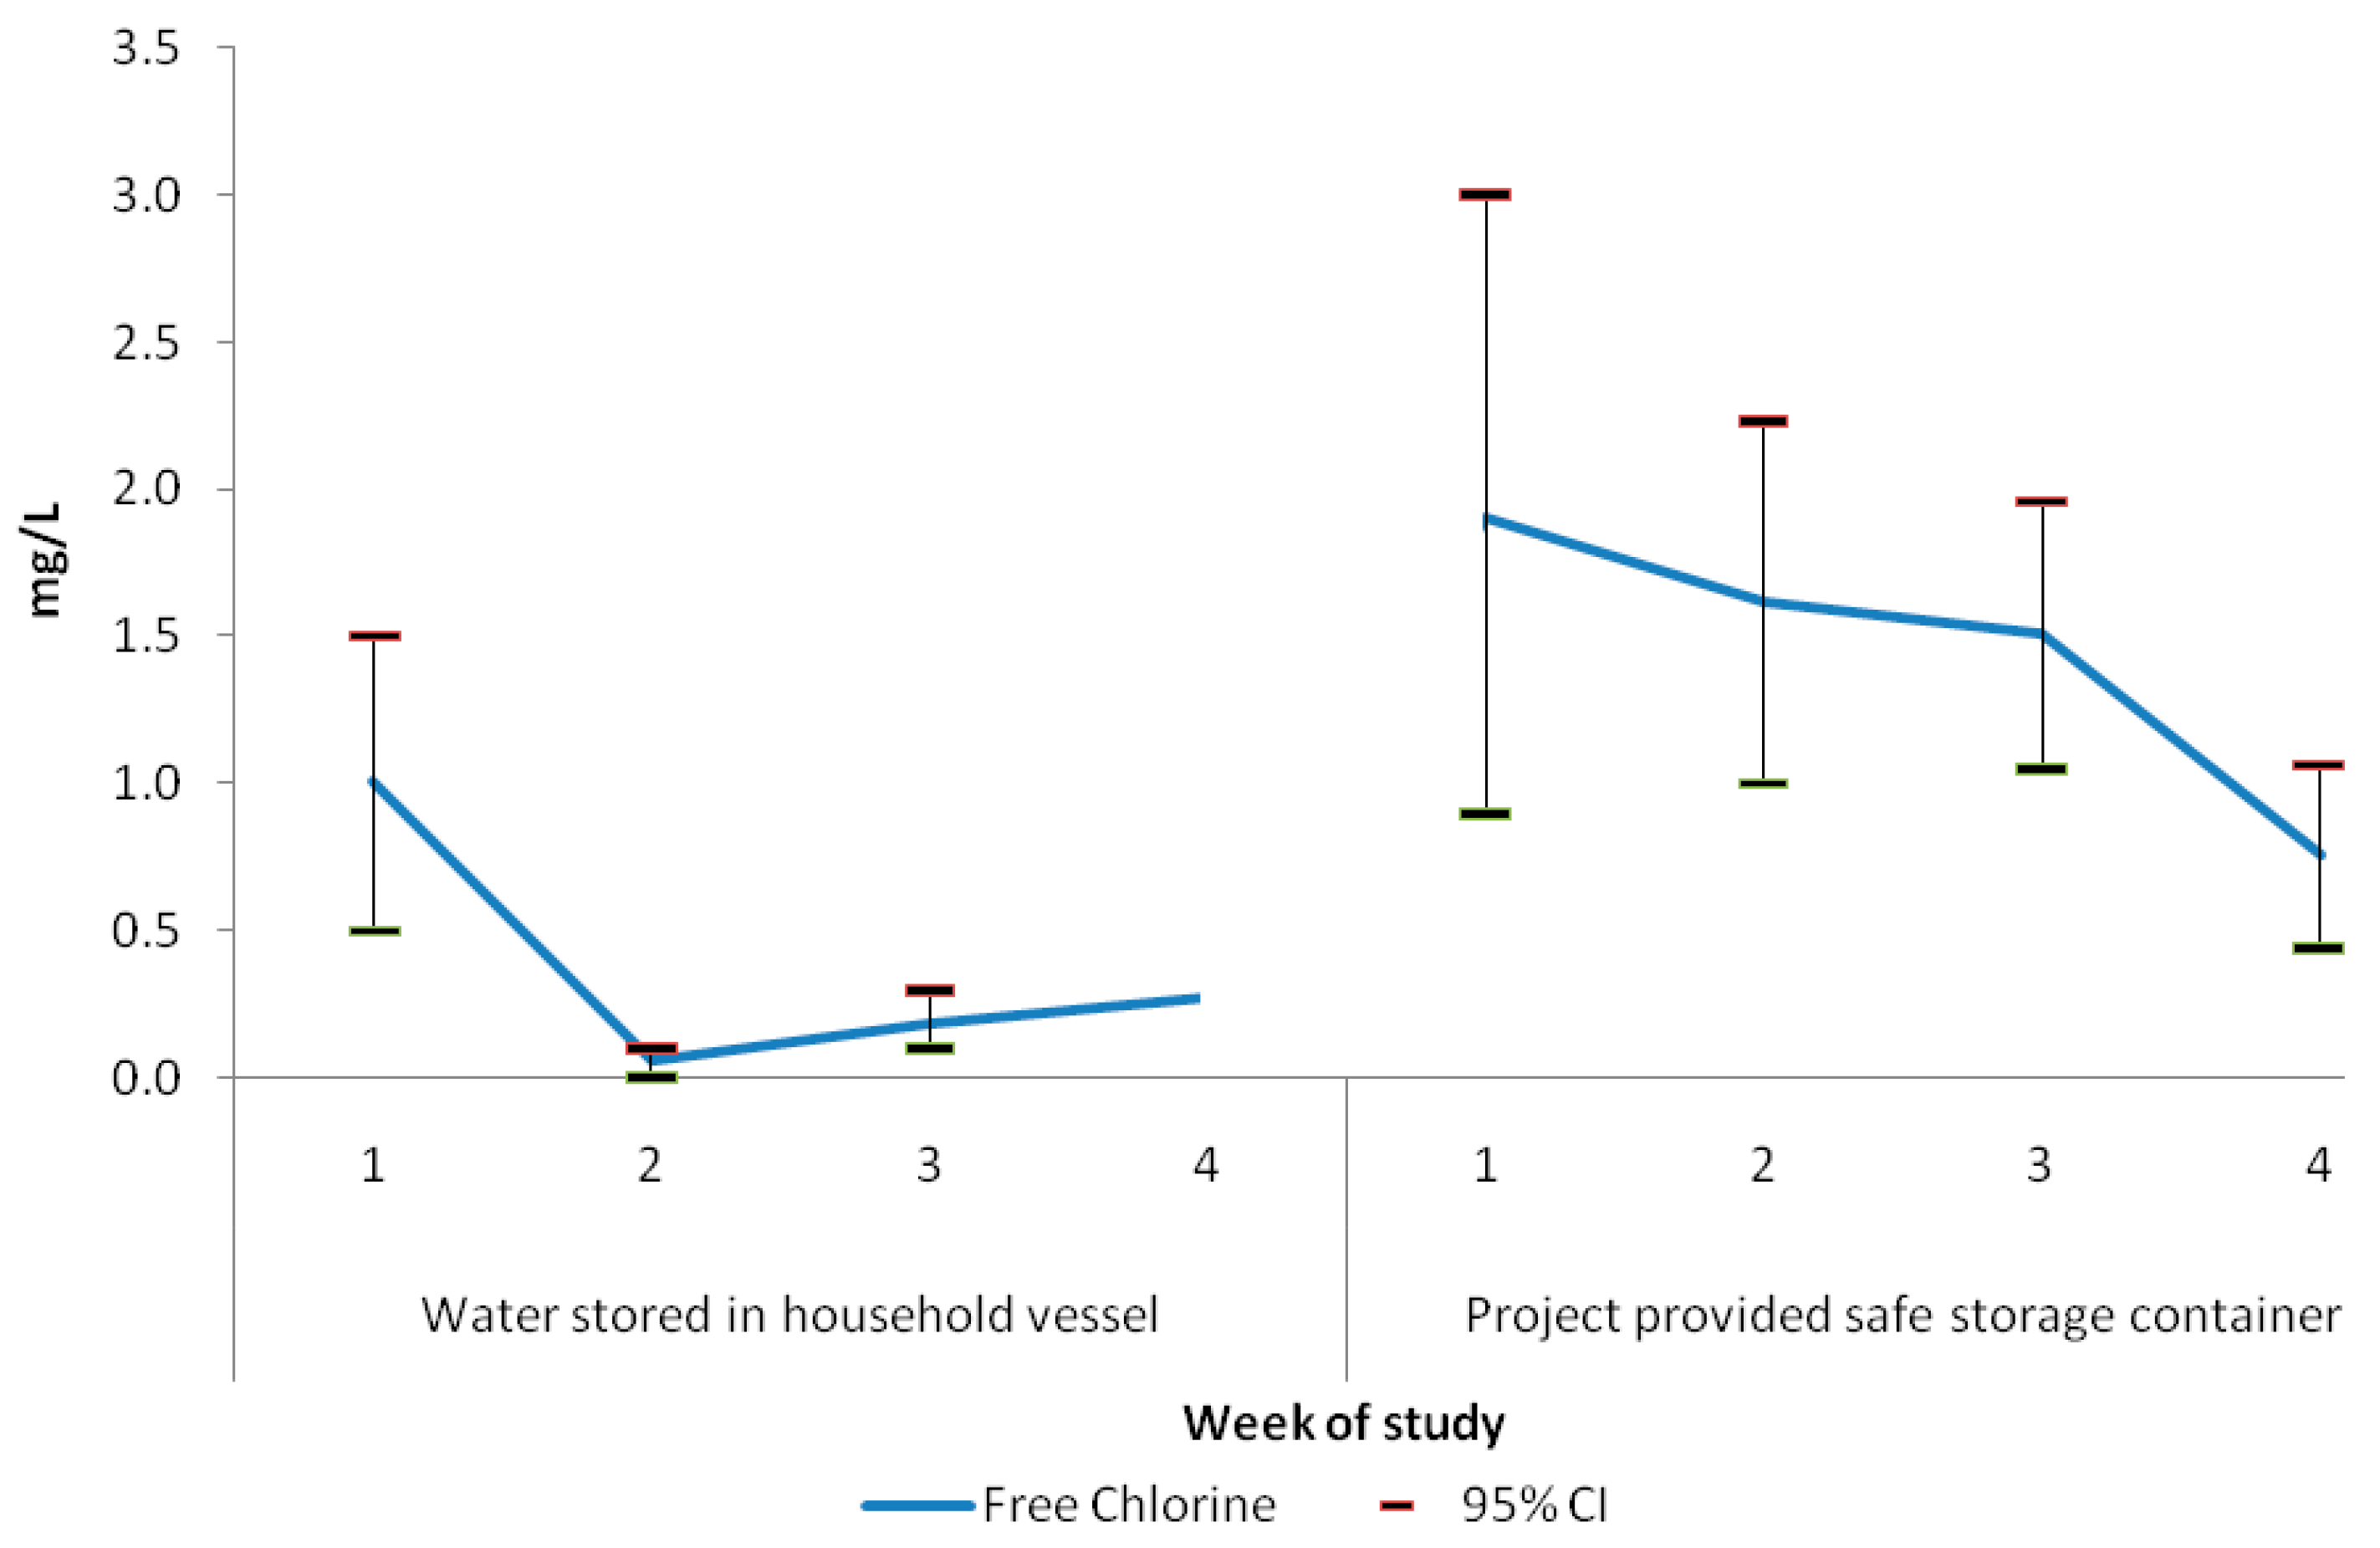
| Free Chlorine (mg/L) | NA | n = 20 | n = 323 | n = 133 | n = 32 | |||
| <0.2 | NA | 17 (85.0) | 0 | 101 (75.3) | 2 (6.2) | |||
| 0.2–2 | NA | 3 (15.0) | 165 (50.0) | 24 (18.0) | 22 (68.8) | |||
| >2 | NA | 0 | 164 (50.0) | 8 (6.0) | 8 (25.0) | |||
| Mean (mg/L) (SD) | NA | 0.15 (0.4) | 2.1 (1.1) | 0.39 (0.9) | 1.4 (0.9) | −0.23 (−0.64, 0.17) | −1.25 (−1.65, −0.84) | −1.01 (−1.36, −0.67) |
| Total Chlorine (mg/L) | NA | n = 20 | n = 72 | n = 133 | n = 32 | |||
| < 0.2 | NA | 17 (85.0) | 0 | 93 (69.9) | 1 (3.1) | |||
| 0.2–2 | NA | 3 (15.0) | 31 (43.0) | 32 (24.0) | 22 (68.8) | |||
| > 2 | NA | 0 | 41 (57.0) | 8 (6.0) | 9 (28.2) | |||
| Mean (mg/L) (SD) | NA | 0.17 (0.4) | 2.21 (0.95) | 0.5 (1.1) | 1.72 (1.0) | −0.16 (−0.68, 0.36) | −1.39 (−1.88, −1.90) | −1.23 (−1.66, −0.80) |
| E. coli MPN/100 mL | n = 2 | n = 20 | n = 8 | n = 80 | n = 32 | |||
| 0 | 2 (100) | 8 (40.0) | 8 (100) | 47 (58.8) | 32 (100) | |||
| 1–10 | 0 | 6 (30.0) | 0 | 22 (27.5) | 0 | |||
| > 10 | 0 | 6 (30.0) | 0 | 11 (13.7) | 0 | |||
| Log-mean E. coli MPN/100 mL (SD) | −0.30 | 0.62 (0.9) | −0.30 | 0.28 (0.73) | −0.30 | 0.34 (−0.03, 0.73) | 0.92 (0.59, 1.24) | 0.57 (0.32, 0.83) |
| Characteristics | Household n (%) | ||
|---|---|---|---|
| Baseline n = 20 | Within 7 Days of Zimba Installation n = 20 | End-Line (Week 4) n = 20 | |
| Reported water collection from Zimba | |||
| Always | 2 NA | NA | 14 (70) |
| Sometimes | NA | NA | 1 (5) |
| Never | NA | NA | 5 (20) |
| Taste of water described by users | |||
| Good | 19 (95) | 7 (35) | 15 (75) |
| Chemical/chlorine/medicine | 1 (5) | 13 (65) | 5 (25) |
| Satisfaction with the current water system | |||
| Satisfied | 19 (95) | 5 (25) | 16 (80) |
| 1 Reasons for dissatisfaction with the chlorine intervention | |||
| Height of the tubewell increased and it was difficult to pump | NA | 15 (75) | 5 (25) |
| Chemical/chlorine/medicine smell | NA | 14 (70) | 4 (20) |
| Took a long time to collect water | NA | 17 (85) | 3 (15) |
| Tubewell was very hard/stiff to pump | NA | 7 (35) | 1 (5) |
| Not suitable for small water collection (one jug/mug) | NA | 18 (90) | 15 (75) |
| Difficult for the children and disabled people to collect water | NA | 3 (15) | 0 |
| Hair loss after bathing in Zimba water | NA | 2 (10) | 5 (25) |
| Drinking from this hand pump makes your family members sick | |||
| Often | 2 (10) | 0 | 0 |
| Sometimes | 3 (15) | 1 (5) | 1 (5) |
| Never | 14 (70) | 18 (90) | 18 (90) |
| Do not know | 1 (5) | 1 (5) | 1 (5) |
| Do you think drinking directly from this tubewell is safe? | |||
| Yes | 4 (20) | 19 (95) | 16 (80) |
| Free Chlorine (mg/L) | n = 20 | n = 30 | n = 20 |
| <0.2 | 17 (85.0) | 16 (53.3) | 12 (60.0) |
| 0.2–2 | 3 (15.0) | 7 (23.3) | 7 (35.0) |
| >2 | 0 | 7 (23.3) | 1 (5.0) |
| Mean (mg/L) (SD) | 0.15 (0.4) | 0.75 (1.02) | 0.39 (0.57) |
| Total Chlorine (mg/L) | n = 20 | n = 30 | n = 20 |
| <0.2 | 17 (85.0) | 14 (46.7) | 12 (60.0) |
| 0.2–2 | 3 (15.0) | 9 (30.0) | 7 (35.0) |
| > 2 | 0 | 7 (23.3) | 1 (5.0) |
| Mean (mg/L) (SD) | 0.17 (0.4) | 0.88 (1.12) | 0.43 (0.58) |
| E. coli MPN/100 mL | n = 20 | n = 20 | n = 20 |
| 0 | 8 (40.0) | 12 (40.0) | 13 (65.0) |
| 1–10 | 6 (30.0) | 5 (16.7) | 5 (25.0) |
| >10 | 6 (30.0) | 13 (43.3) | 3 (10.0) |
| Log-mean E. coli MPN/100 mL (SD) | 0.62 (0.9) | 0.14 (0.6) | 0.11 (0.61) |
| Parameters | Tubewell Water Samples | Households Stored Water Samples | ||
|---|---|---|---|---|
| Tubewell ID-13 n | Tubewell ID-5 n | Tubewell ID-13 n (%) | Tubewell ID-5 n (%) | |
| Concentration of iron (mg/L) | n = 6 | n = 6 | n = 29 | n = 50 |
| <1 | 0 | 0 | 4 (13.8) | 31 (62) |
| 1- <3 | 0 | 6 | 8 (27.6) | 19 (38) |
| 3- < 5 | 0 | 0 | 3 (10.3) | 0 |
| 5 or above | 6 | 0 | 14 (48.3) | 0 |
| Mean (SD) | 6.5 (0.4) | 1.5 (0.5) | 3.9 (2.4) | 0.7 (0.3) |
| Average % of NaOCl used to treat water in Zimba | 2.85% | 2.25% | 2.85% | 2.25% |
| Free Chlorine (mg/L) | n = 160 | n = 177 | n = 53 | n = 80 |
| <0.2 | 0 | 0 | 39 (73.6) | 62 (77.5) |
| 0.2–2 | 118 (73.7) | 55 (30.1) | 13 (24.5) | 11 (13.7) |
| >2 | 42 (26.2) | 122 (68.9) | 1 (1.9) | 7 (8.7) |
| Mean (mg/L) (SD) | 1.5 (0.9) | 2.5 (1.1) | 0.3 (0.8) | 0.4 (0.9) |
| Total Chlorine (mg/L) | n = 43 | n = 35 | n = 53 | n = 80 |
| <0.2 | 0 | 0 | 36 (67.9) | 57 (71.2) |
| 0.2–2 | 25 (58.1) | 12 (34.3) | 16 (30.2) | 16 (2) |
| > 2 | 18 (41.8) | 23 (65.7) | 1 (1.9) | 7 (8.7) |
| Mean (mg/L) (SD) | 1.8 (0.8) | 2.4 (1.0) | 0.43 (1.1) | 0.53 (1.1) |
Publisher’s Note: MDPI stays neutral with regard to jurisdictional claims in published maps and institutional affiliations. |
© 2021 by the authors. Licensee MDPI, Basel, Switzerland. This article is an open access article distributed under the terms and conditions of the Creative Commons Attribution (CC BY) license (https://creativecommons.org/licenses/by/4.0/).
Share and Cite
Amin, N.; Rahman, M.; Alam, M.-U.; Shoab, A.K.; Alome, M.K.; Amin, M.; Huda, T.M.N.; Unicomb, L. Field Trial of an Automated Batch Chlorinator System at Two Shared Shallow Tubewells among Camps for Forcibly Displaced Myanmar Nationals (FDMN) in Cox’s Bazar, Bangladesh. Int. J. Environ. Res. Public Health 2021, 18, 12917. https://doi.org/10.3390/ijerph182412917
Amin N, Rahman M, Alam M-U, Shoab AK, Alome MK, Amin M, Huda TMN, Unicomb L. Field Trial of an Automated Batch Chlorinator System at Two Shared Shallow Tubewells among Camps for Forcibly Displaced Myanmar Nationals (FDMN) in Cox’s Bazar, Bangladesh. International Journal of Environmental Research and Public Health. 2021; 18(24):12917. https://doi.org/10.3390/ijerph182412917
Chicago/Turabian StyleAmin, Nuhu, Mahbubur Rahman, Mahbub-Ul Alam, Abul Kasham Shoab, Md. Kawsar Alome, Maksudul Amin, Tarique Md. Nurul Huda, and Leanne Unicomb. 2021. "Field Trial of an Automated Batch Chlorinator System at Two Shared Shallow Tubewells among Camps for Forcibly Displaced Myanmar Nationals (FDMN) in Cox’s Bazar, Bangladesh" International Journal of Environmental Research and Public Health 18, no. 24: 12917. https://doi.org/10.3390/ijerph182412917
APA StyleAmin, N., Rahman, M., Alam, M.-U., Shoab, A. K., Alome, M. K., Amin, M., Huda, T. M. N., & Unicomb, L. (2021). Field Trial of an Automated Batch Chlorinator System at Two Shared Shallow Tubewells among Camps for Forcibly Displaced Myanmar Nationals (FDMN) in Cox’s Bazar, Bangladesh. International Journal of Environmental Research and Public Health, 18(24), 12917. https://doi.org/10.3390/ijerph182412917