
Primary and Secondary Emissions of VOCs and PAHs in Indoor Air from a Waterproof Coal-Tar Membrane: Diagnosis and Remediation


Abstract
:1. Introduction
2. Materials and Methods
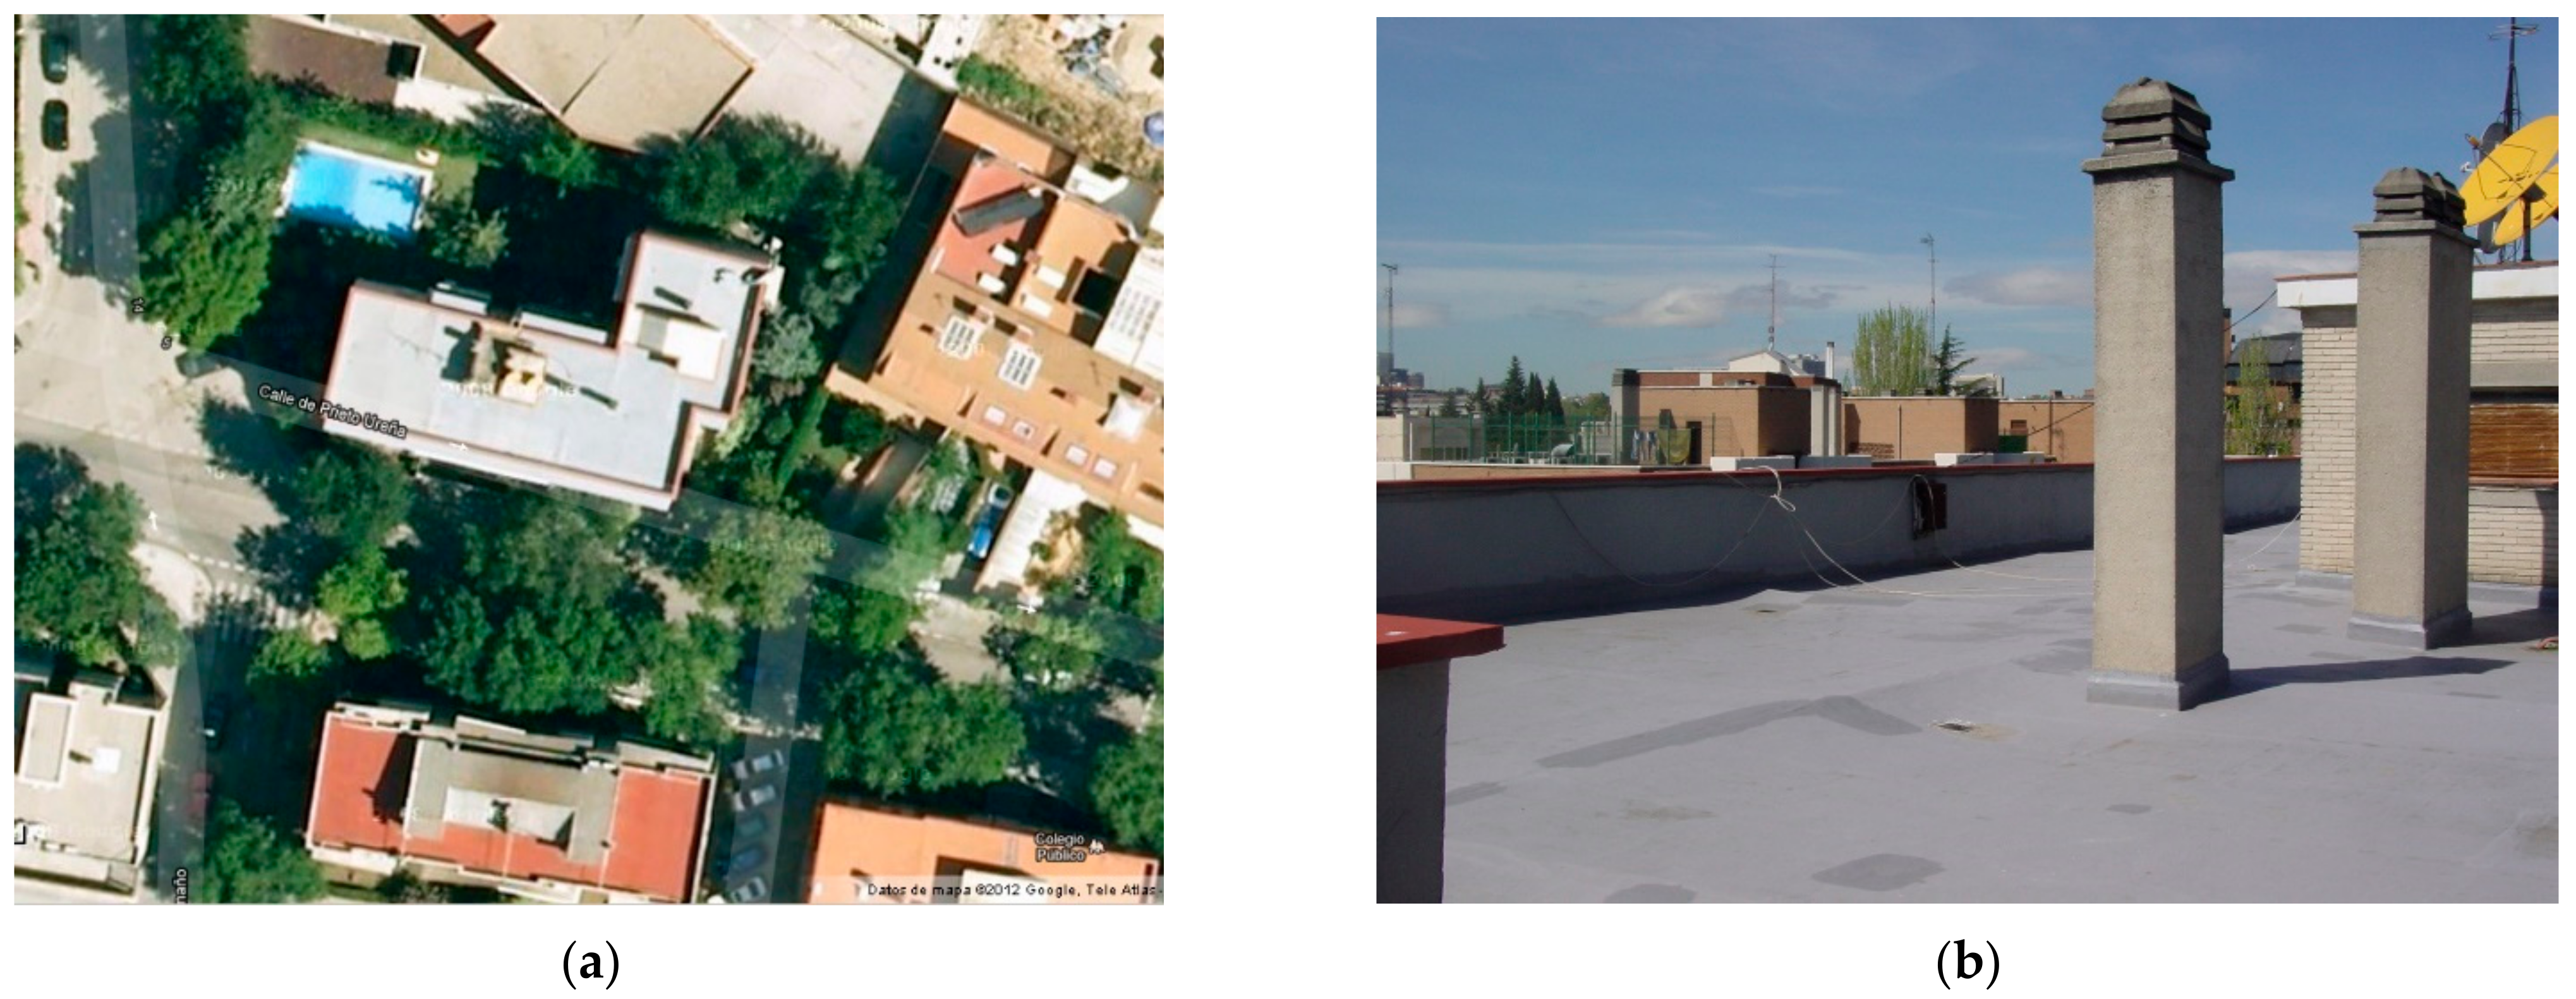
2.1. Description of the Problem
2.2. Environmental Assessment
- The air-borne compounds susceptible to photoionization were assessed in all the rooms using a Photovac 2020 hand-held photoionization detector (PID). The efficiency of detection of the PID depends on the ionization potential, IP (eV), of the target compound. The equipment employed a 10.6 eV UV lamp. Therefore, any compounds with an IP smaller, than 10.6, could be detected. According to [38], this includes most PAHs. It should be stressed that the measurement results have to be taken with caution, mainly as indicative values, since the photoionization response of various compounds significantly differ.
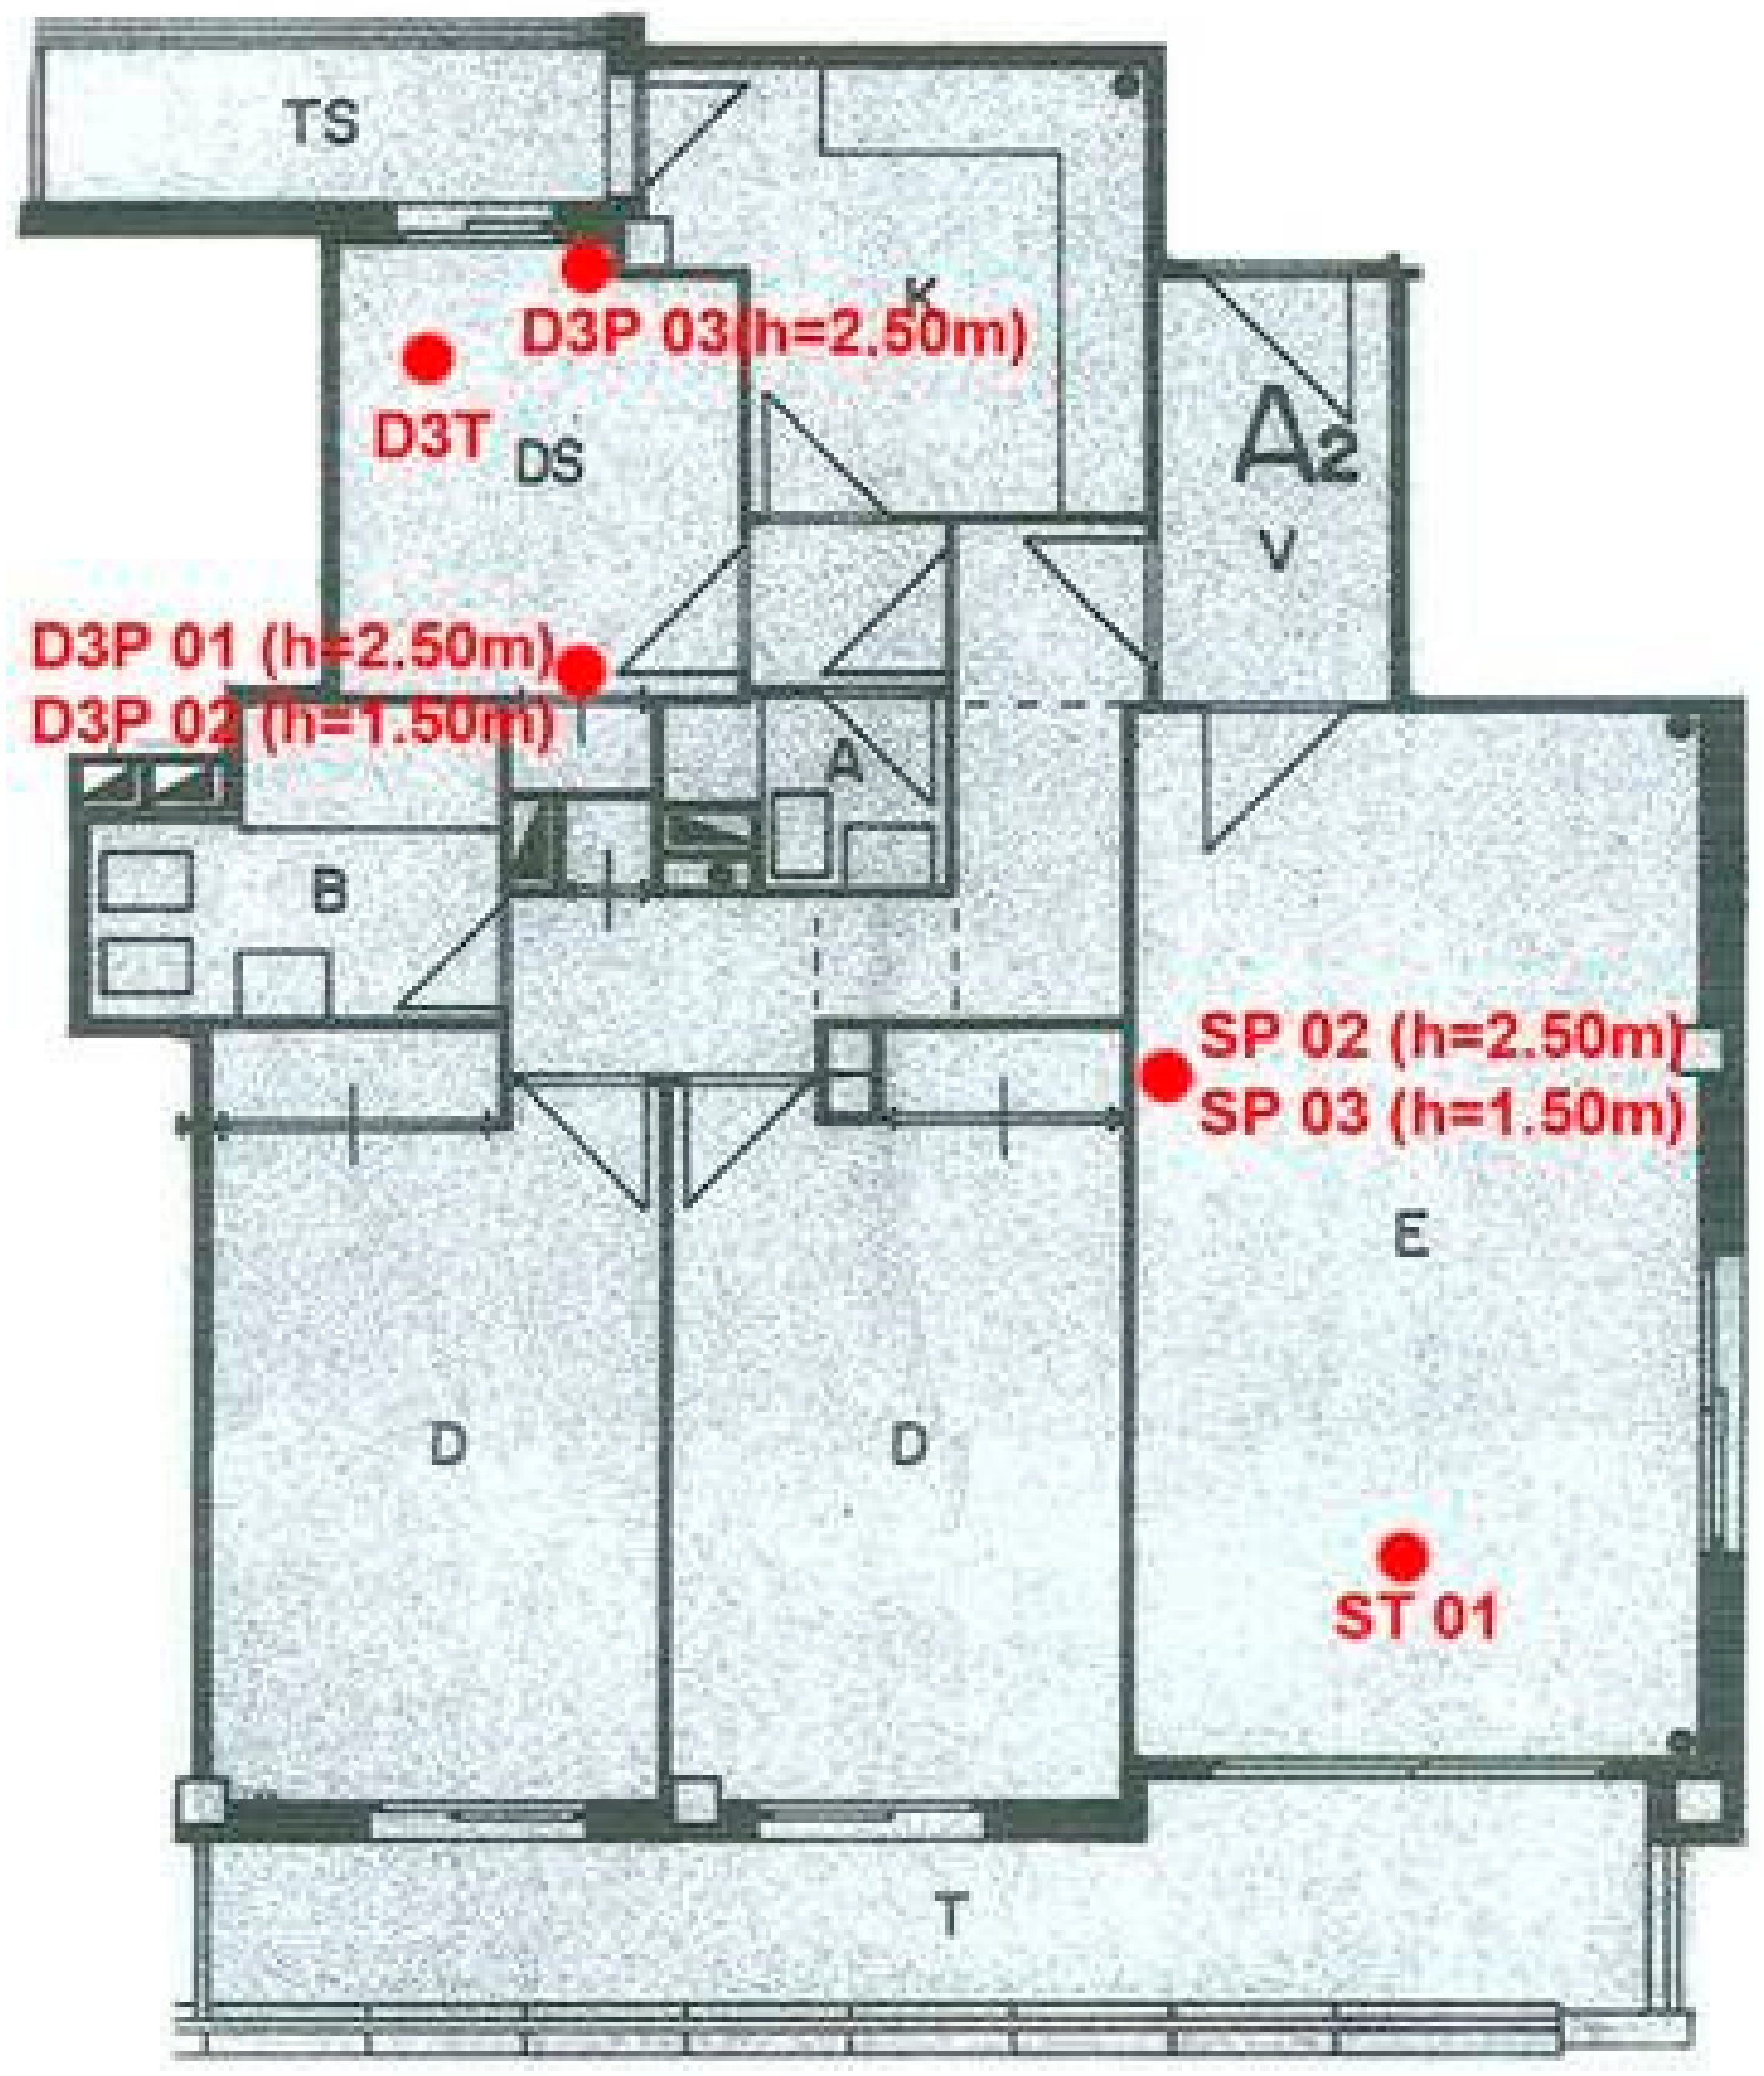
- The samples of air-borne contaminants were collected separately for the living room, bedroom D3 and the inter-joist pan forms in the structural ceiling. From the ceiling, the air samples were obtained at different heights 1.5 m from the floor. The flat was not ventilated for 12 h prior to the sampling. The air was pumped through three different sorbents using a pump Buck-basic supplied by A.P. Buck Inc., Orlando, FL, USA. Three types of sorbents were used: activated carbon supplied by Drager (AC), XAD2 and Tenax GR supplied by Supelco. The sorbents were chosen in order to capture the largest possible number of various VOCs and PAHs. The analysis of the adsorbed contaminants was made using gas chromatography coupled to a mass spectrometer (GC-MS) by ALcontrol Laboratories, in Rotterdam, Netherlands. The measurements were conducted in three campaigns in April, June and September 2012, respectively.
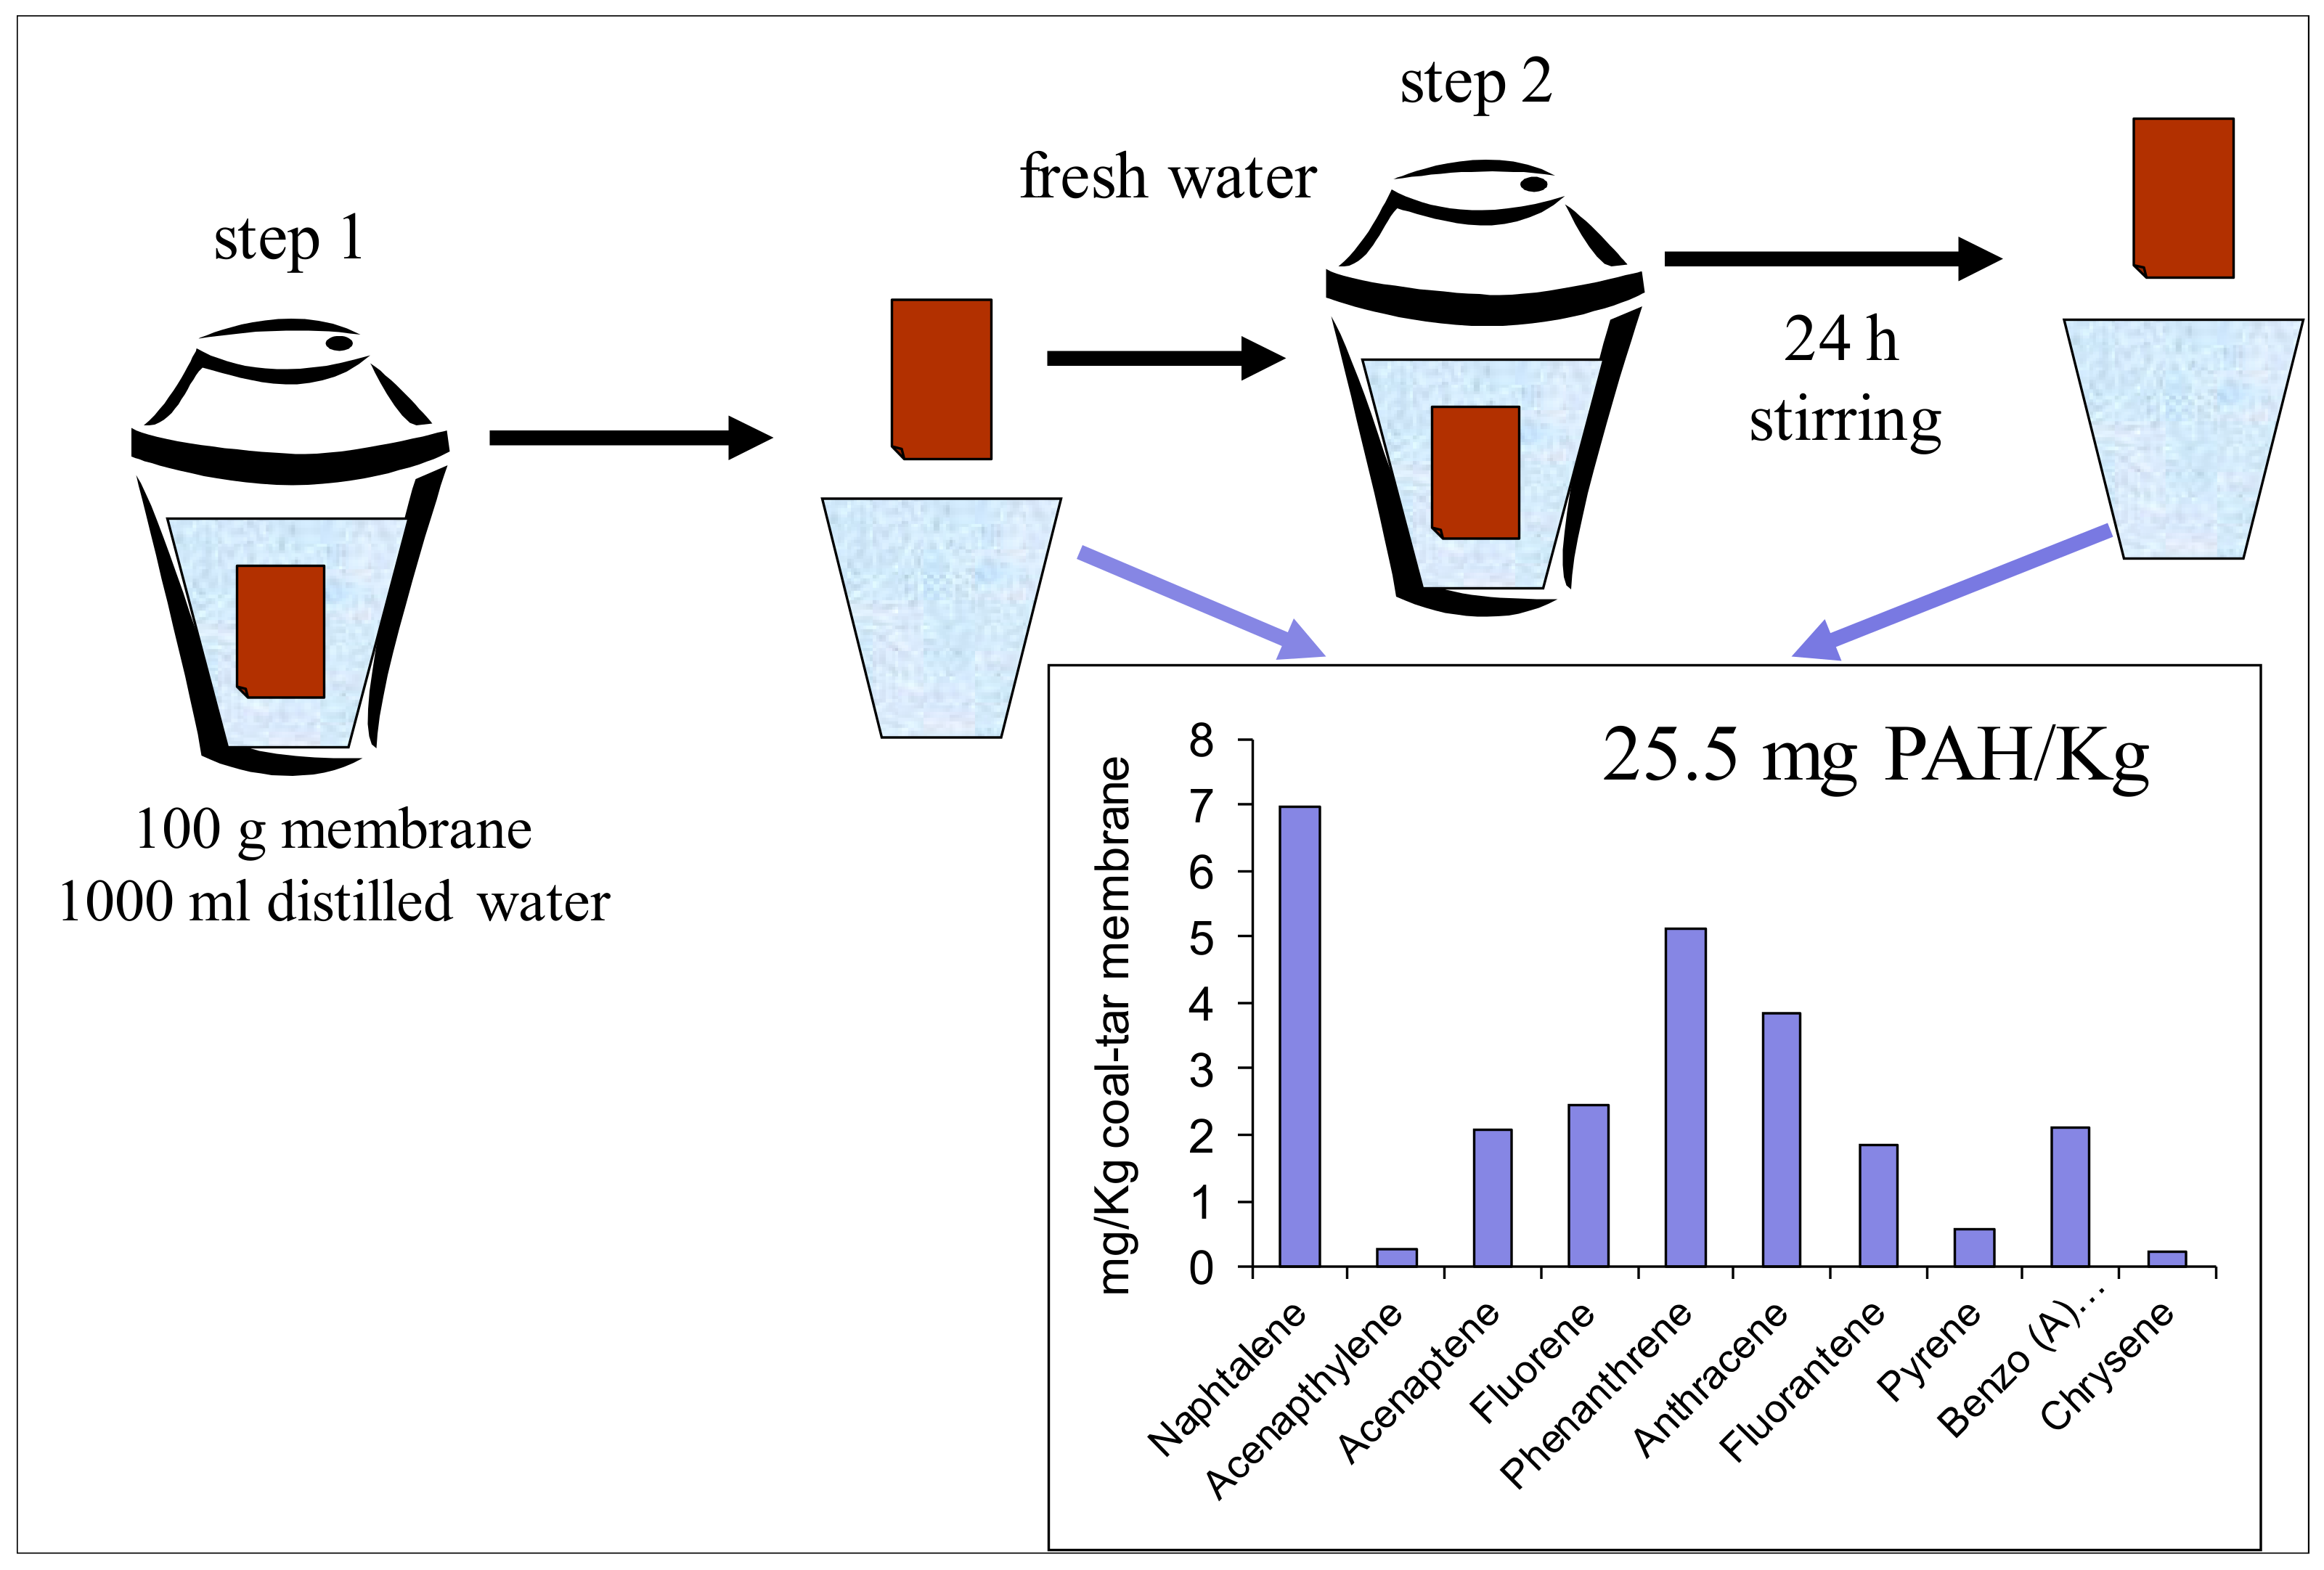
2.3. Pollutant Assessment in Construction Materials
3. Results
3.1. Contaminants in the Air
3.1.1. Photoionisation Analysis
3.1.2. Analysis of the Contaminants Captured by the Sorbents
3.2. Building Materials
4. Discussion
4.1. Diagnosis
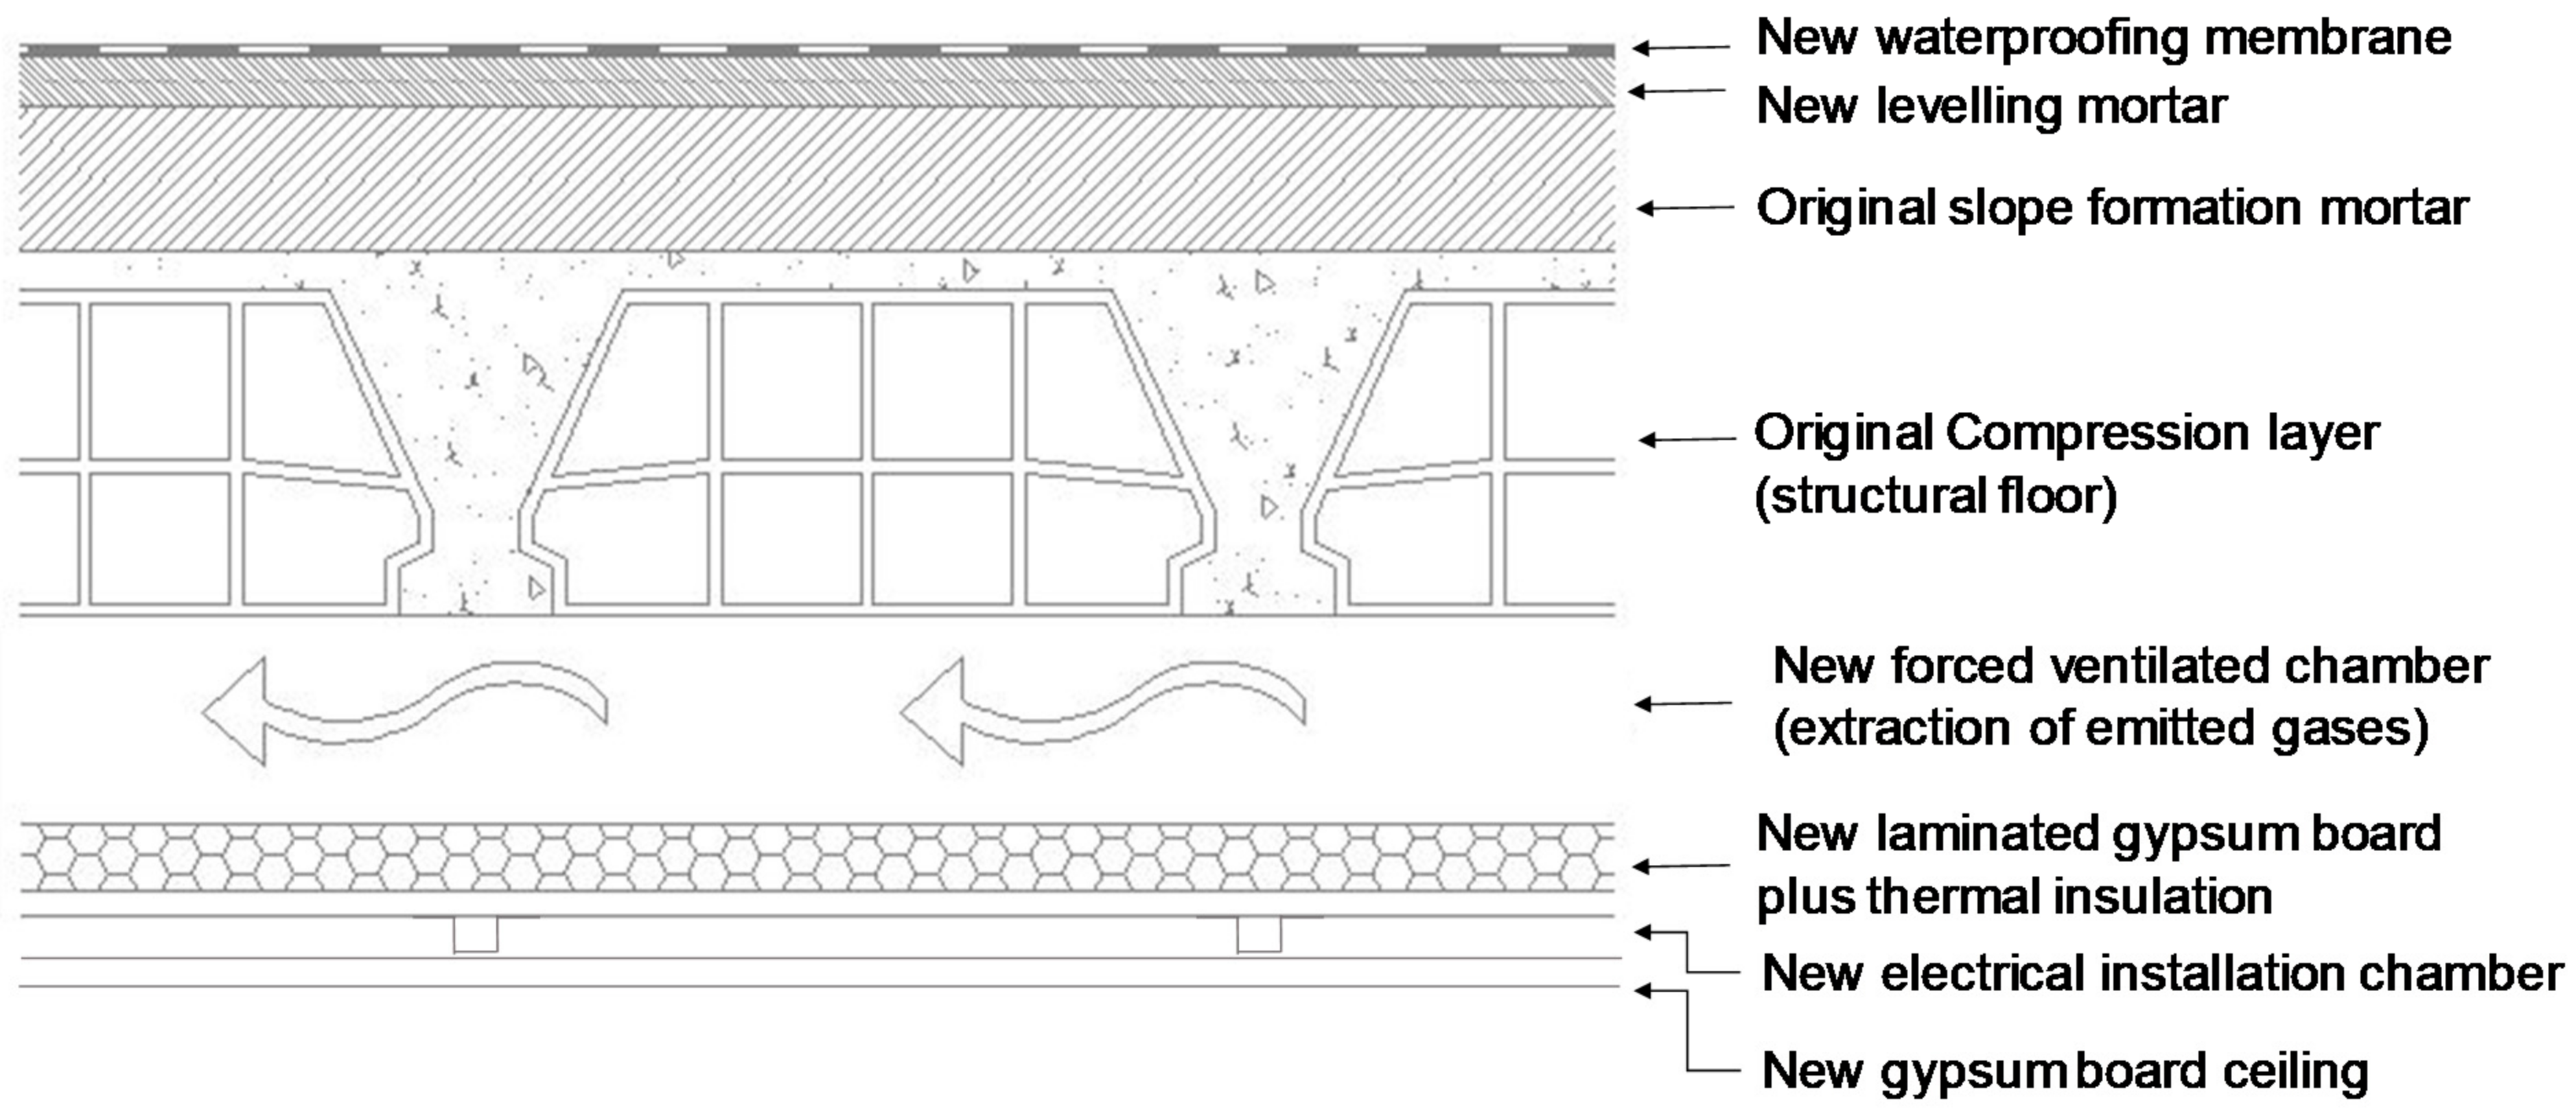
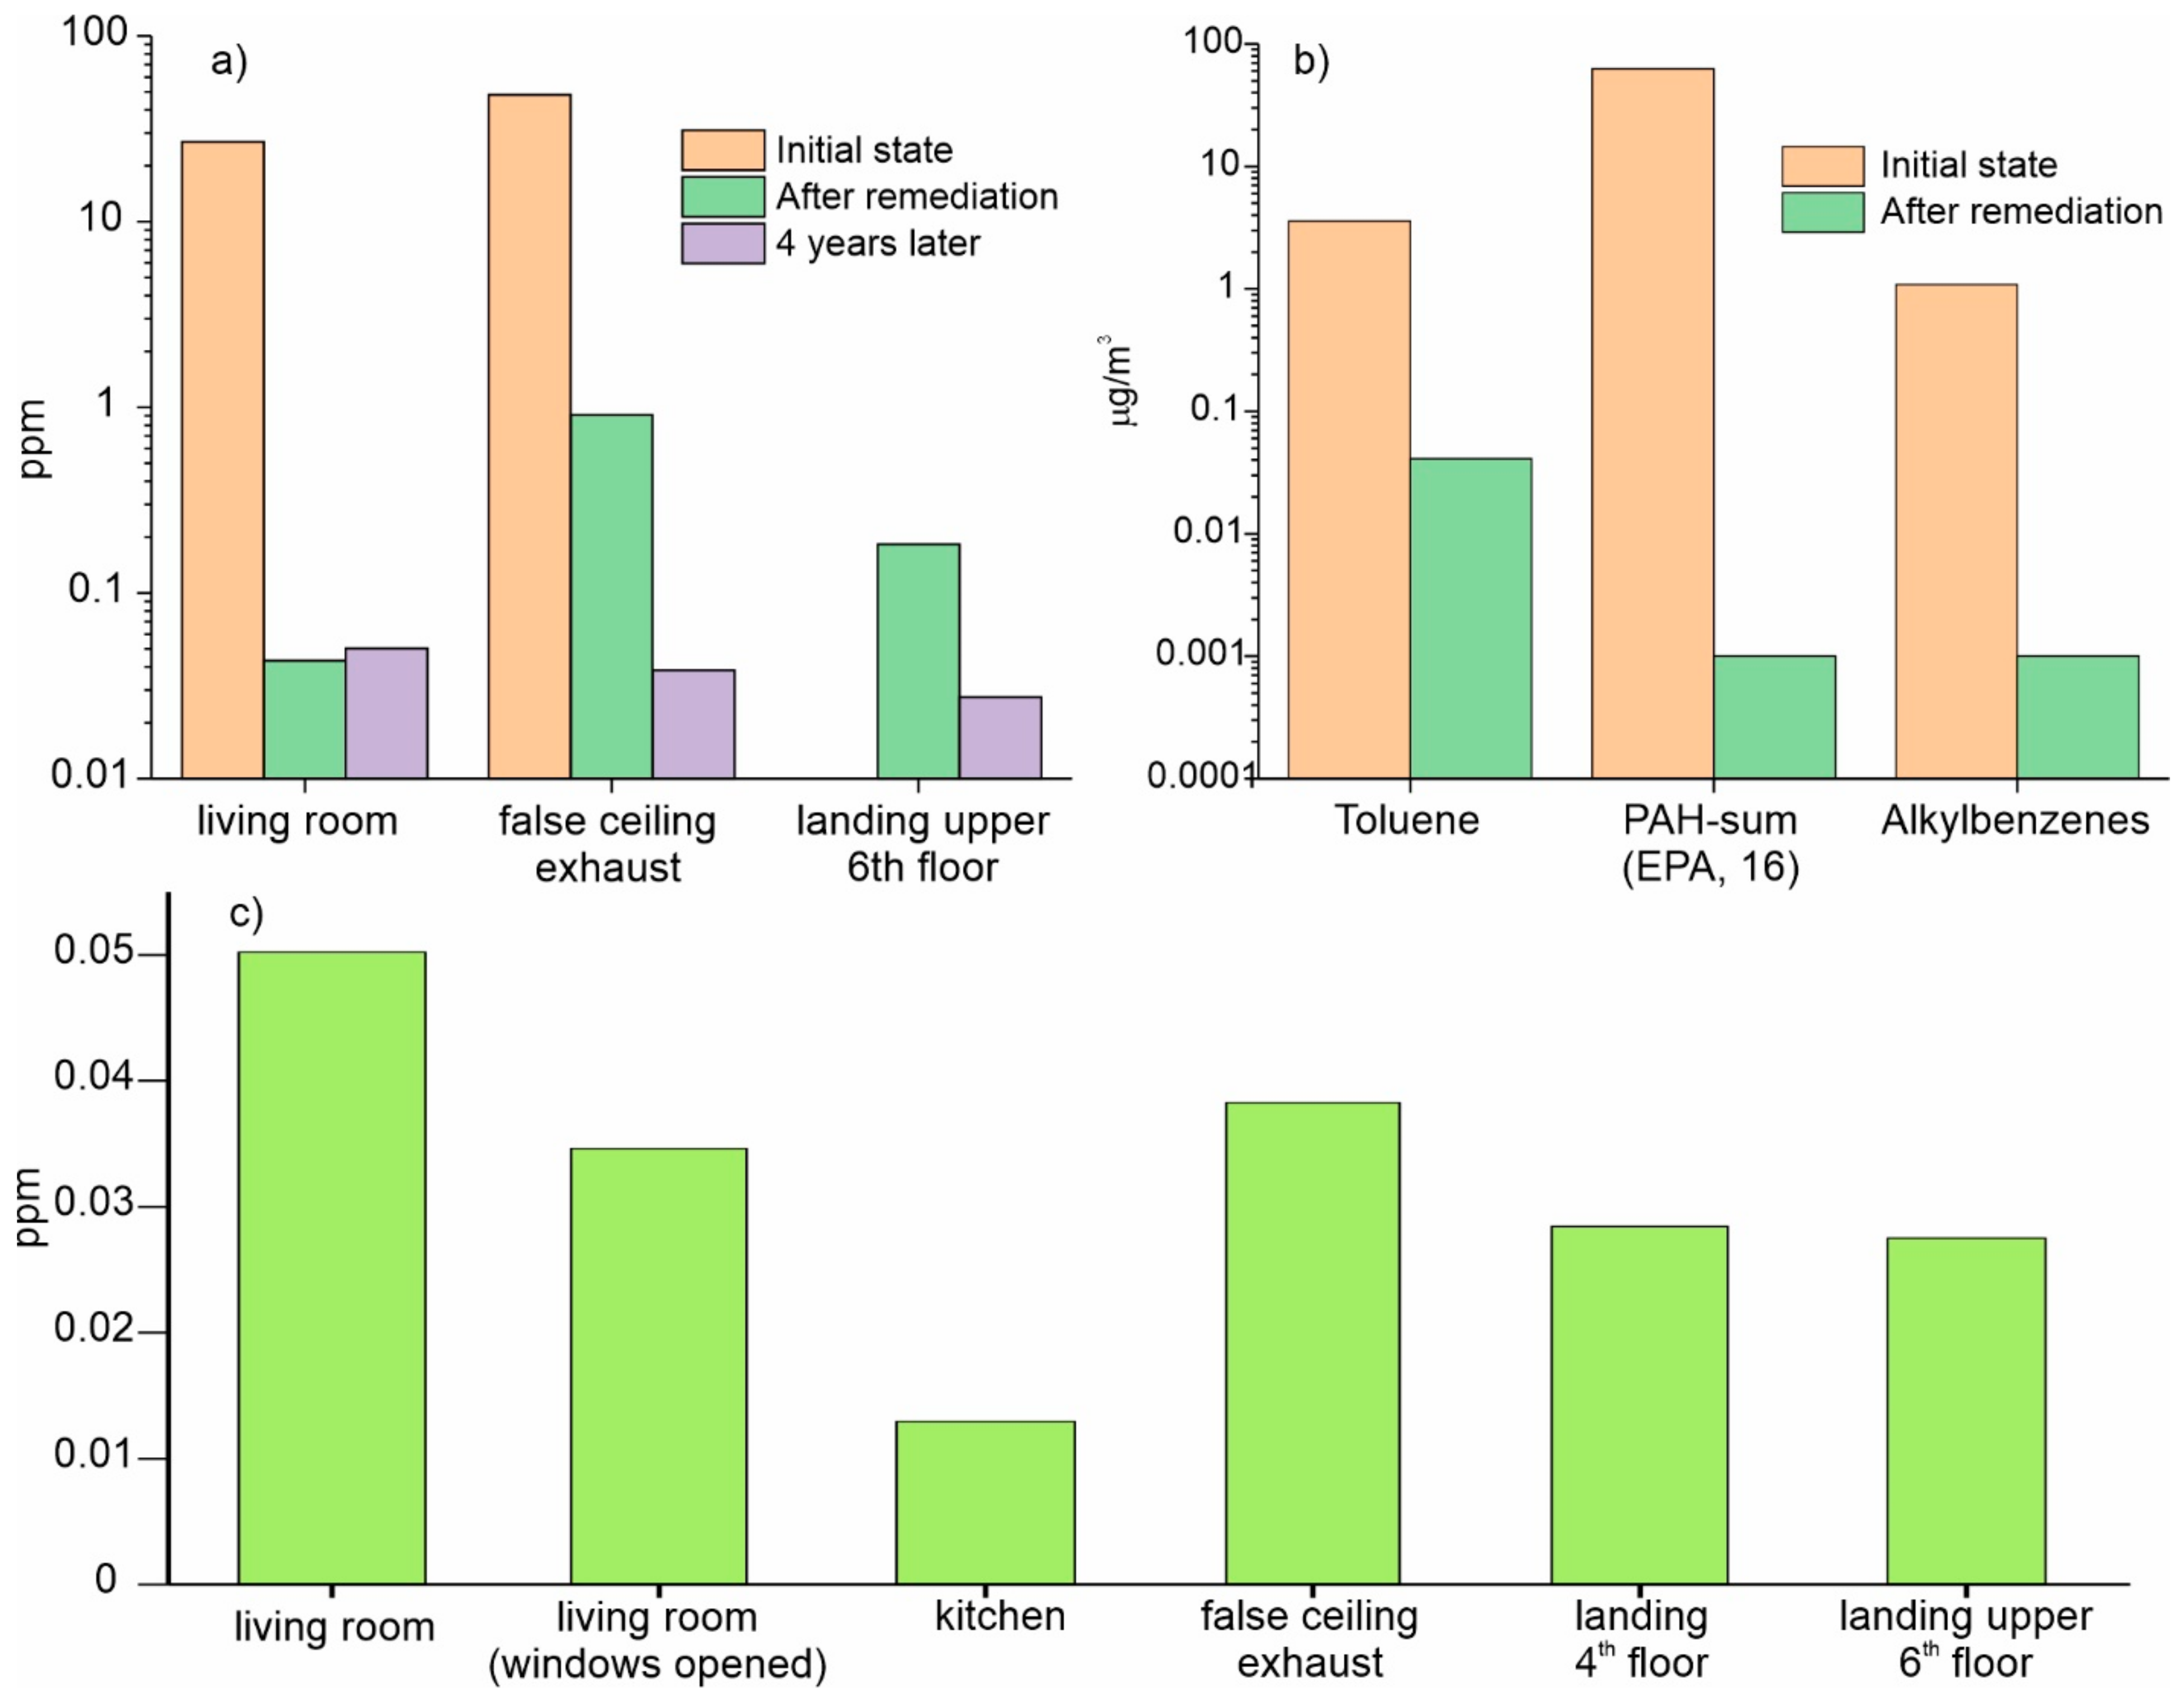
4.2. Remediation
5. Conclusions
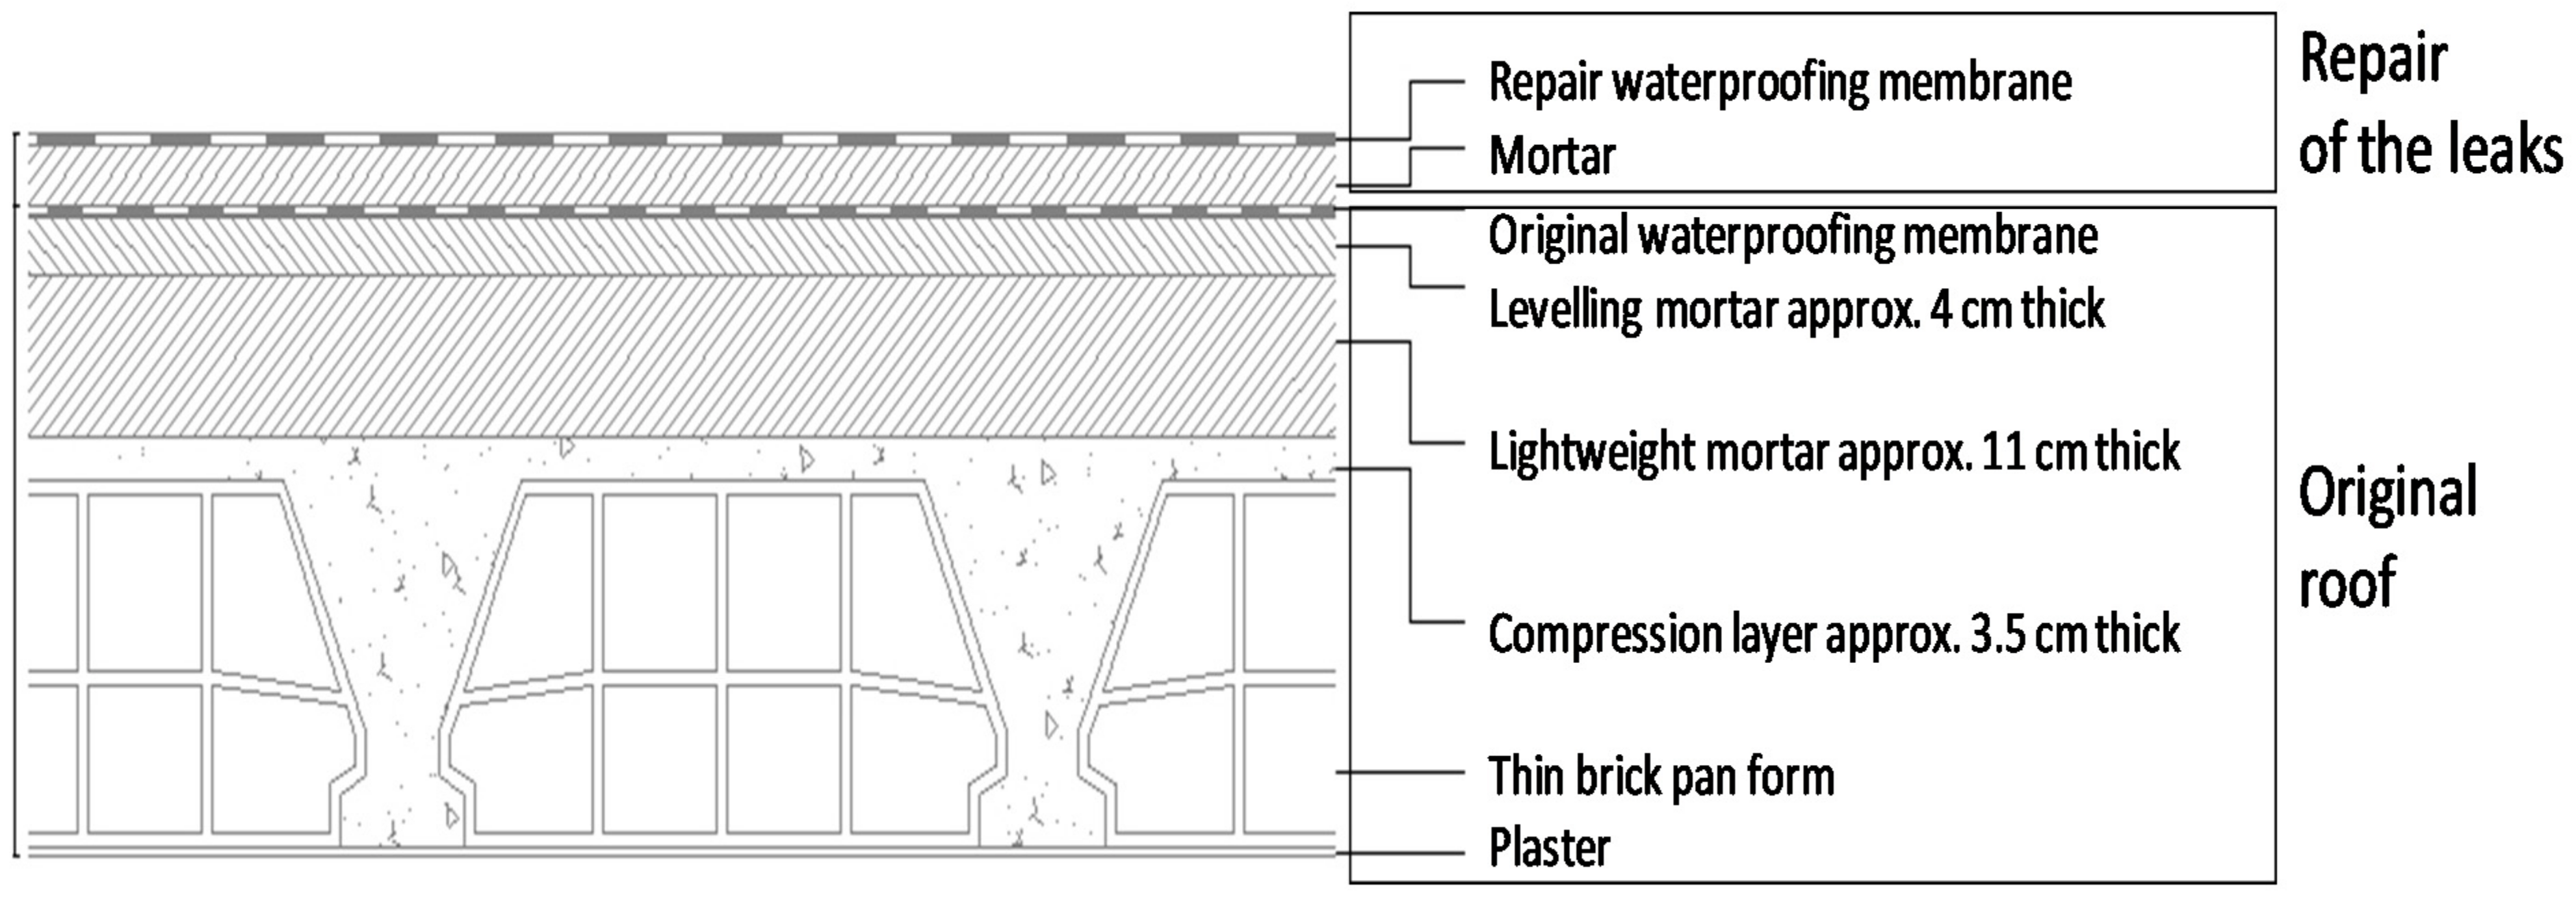
- The primary source of contamination was identified as the PAHs (polycyclic aromatic hydrocarbons) emitted by the original rooftop coal tar-based waterproof membrane. The contamination was attributed to the repair of the original roof, over which a layer of mortar and a liquid waterproof membrane were placed as a solution to the water leakage problem. The second membrane prevented the contaminants to be dissipated in the outdoor environment, and they migrated into the interior of the house, which process was accelerated by water leaks. The contaminated building materials were the secondary emission source of air-borne contaminants.
- Indoor naphthalene concentrations exceeded the limits laid down by both the WHO and OSHA. The levels of 1,2,4-trimethylbenzene in the air exceeded the EPA’s limit value. The air in the ceiling slab pan forms contained volatile organic compounds such as toluene, acenaphthene, phenanthrene, fluorene, 1,3,5-trimethylbenzene and volatile hydrocarbons (C6-C12) above the established limits.
- The remediation of the contamination problem implied removing the primary and secondary emission sources to the highest possible extent, and creation of the alternative emission ways using an additional ventilated chamber at a false ceiling with forced extraction of the air. The follow up tests validated the remediation solution.
Author Contributions
Funding
Institutional Review Board Statement
Informed Consent Statement
Acknowledgments
Conflicts of Interest
References
- Menzie, C.A.; Potocki, B.B.; Santodonato, J. Exposure to carcinogenic PAHs in the environment. Environ. Sci. Technol. 1992, 26, 1278–1284. [Google Scholar] [CrossRef]
- IARC. Bitumens and Bitumen Emissions, and Some N- and S-Heterocyclic Polycyclic Aromatic Hydrocarbons. 2013. Available online: https://www.ncbi.nlm.nih.gov/books/NBK294234/ (accessed on 4 September 2021).
- Jia, C.; Fu, X. Characterizing Community Exposure to Atmospheric Polycyclic Aromatic Hydrocarbons (PAHs) in The Memphis Tri-State Area. 2020. Available online: https://www.epa.gov/sites/default/files/2020-01/documents/memphis_pahs_study_final_report_08.pdf (accessed on 8 September 2021).
- Berglund, B.; Brunekreef, B.; Knoppe, H.; Lindvall, T.; Maroni, M.; Molhave, L.; Skov, P. Effects of Indoor Air Pollution on Human Health. Indoor Air 1992, 2, 2–25. [Google Scholar] [CrossRef]
- Wolkoff, P.; Clausen, P.; Jensen, B.; Nielsen, G.; Wilkins, C. Are we measuring the relevant indoor pollutants? Indoor Air 1997, 7, 92–106. [Google Scholar] [CrossRef]
- Guo, H.; Lee, S.-C.; Chan, L.; Li, W. Risk assessment of exposure to volatile organic compounds in different indoor environments. Environ. Res. 2003, 94, 57–66. [Google Scholar] [CrossRef]
- Poppendieck, D.G.; Ng, L.C.; Persily, A.K.; Hodgson, A.T. Long term air quality monitoring in a net-zero energy residence designed with low emitting interior products. Build. Environ. 2015, 94, 33–42. [Google Scholar] [CrossRef]
- M/366 Horizontal Complement to the Mandates for the Development of Horizontal Standardised Assessment Methods for Harmonised Approaches Relating to Dangerous Substances under the Construction Products Directive (cpd). 2005. Available online: https://ec.europa.eu/growth/tools-databases/mandates/index.cfm?fuseaction=search.detail&id=323# (accessed on 11 September 2021).
- Saarela, K.; Tirkkonen, T.; Björkroth, M.; Kukkonen, E.; Seppänen, O.; Tuomainen, M. M1, Emission Classification of Building Materials: Protocol for Chemical and Sensory Testing of Building Materials. 2004. Available online: https://login.rakennustieto.fi/kortistot/rane/material/attachments/5ezkfuhFL/5eNmqcoNb/Files/CurrentFile/Testing_protocol_version_15122004.pdf (accessed on 16 September 2021).
- Bluyssen, P.; Cochet, C.; Fischer, M.; Knöppel, H.; Levy, L.; Lundgren, B.; Maroni, M.; Mølhave, L.; Rothweiler, H.; Saarela, K. Evaluation of VOC Emissions from Building Products. 1997. Available online: https://www.aivc.org/sites/default/files/members_area/medias/pdf/Inive/ECA/ECA_Report18.pdf (accessed on 16 September 2021).
- De Bortoli, M.; Kephalopoulos, S.; Kirchner, S.; Schauenburg, H.; Vissers, H. European Inter-Laboratory Comparison on VOC Emitted from and Products. Available online: https://www.aivc.org/sites/default/files/members_area/medias/pdf/Inive/ECA/ECA_Report21.pdf (accessed on 18 September 2021).
- Francisco, P.W.; Jacobs, D.E.; Targos, L.; Dixon, S.L.; Breysse, J.; Rose, W.; Cali, S. Ventilation, indoor air quality, and health in homes undergoing weatherization. Indoor Air 2016, 27, 463–477. [Google Scholar] [CrossRef]
- Uhde, E.; Salthammer, T. Impact of reaction products from building materials and furnishings on indoor air quality—A review of recent advances in indoor chemistry. Atmos. Environ. 2007, 41, 3111–3128. [Google Scholar] [CrossRef]
- Weschler, C.J.; Carslaw, N. Indoor chemistry. Environ. Sci. Technol. 2018, 52, 2419–2428. [Google Scholar] [CrossRef] [PubMed]
- Ji, W.; Zhao, B. Contribution of outdoor-originating particles, indoor-emitted particles and indoor secondary organic aerosol (SOA) to residential indoor PM2.5 concentration: A model-based estimation. Build. Environ. 2015, 90, 196–205. [Google Scholar] [CrossRef]
- Won, D.; Corsi, R.L.; Rynes, M. Sorptive Interactions between VOCs and Indoor Materials. Indoor Air 2001, 11, 246–256. [Google Scholar] [CrossRef] [PubMed] [Green Version]
- Molhave, L.; Clausen, G.; Berglund, B.; De Ceaurriz, J.; Kettrup, A.; Lindvall, T.; Maroni, M.; Pickering, A.C.; Risse, U.; Rothweiler, H.; et al. Total Volatile Organic Compounds (TVOC) in Indoor Air Quality Investigations*. Indoor Air 1997, 7, 225–240. [Google Scholar] [CrossRef]
- Kim, K.-H.; Jahan, S.A.; Kabir, E.; Brown, R.J.C. A review of airborne polycyclic aromatic hydrocarbons (PAHs) and their human health effects. Environ. Int. 2013, 60, 71–80. [Google Scholar] [CrossRef] [PubMed]
- Abdel-Shafy, H.I.; Mansour, M. A review on polycyclic aromatic hydrocarbons: Source, environmental impact, effect on human health and remediation. Egypt. J. Pet. 2016, 25, 107–123. [Google Scholar] [CrossRef] [Green Version]
- Živković, M.M.; Jovašević-Stojanović, M.; Cvetković, A.; Lazović, I.; Tasic, V.; Stevanović, Ž.; Gržetić, I.A. PAHs levels in gas and particle-bound phase in schools at different locations in Serbia. Chem. Ind. Chem. Eng. Q. CICEQ 2015, 21, 159–167. [Google Scholar] [CrossRef]
- Qi, H.; Li, W.-L.; Zhu, N.-Z.; Ma, W.-L.; Liu, L.-Y.; Zhang, F.; Li, Y.-F. Concentrations and sources of polycyclic aromatic hydrocarbons in indoor dust in China. Sci. Total Environ. 2014, 491–492, 100–107. [Google Scholar] [CrossRef] [PubMed]
- Zorn, C.; Kohler, M.; Weis, N.; Scharenberg, W. Proposal for assessment of indoor air polycyclic aromatic hydrocarbon (PAH). In Proceedings of 10th International Conference on Indoor Air Quality and Climate (Indoor Air 2005); Tsinghua University Press: Beijing China, 2005; pp. 2535–2540. [Google Scholar]
- Batterman, S.; Chin, J.-Y.; Jia, C.; Godwin, C.; Parker, E.; Robins, T.; Max, P.; Lewis, T. Sources, concentrations, and risks of naphthalene in indoor and outdoor air. Indoor Air 2011, 22, 266–278. [Google Scholar] [CrossRef] [PubMed] [Green Version]
- Roberts, J.W.; Dickey, P. Exposure of children to pollutants in house dust and indoor air. Rev. Environ. Contam. Toxicol. 1995, 143, 59–78. [Google Scholar] [PubMed]
- Liu, X.; Schnelle-Kreis, J.; Schloter-Hai, B.; Ma, L.; Tai, P.; Cao, X.; Yu, C.; Adam, T.; Zimmermann, R. Analysis of PAHs Associated with PM10 and PM2.5 from Different Districts in Nanjing. Aerosol Air Qual. Res. 2019, 19, 2294–2307. [Google Scholar] [CrossRef] [Green Version]
- Williams, E.S.; Mahler, B.J.; Van Metre, P.C. Coal-tar pavement sealants might substantially increase children’s PAH exposures. Environ. Pollut. 2012, 164, 40–41. [Google Scholar] [CrossRef] [PubMed]
- Mahler, B.J.; Van Metre, P.; Wilson, J.T.; Musgrove, M.; Burbank, T.L.; Ennis, T.E.; Bashara, T.J. Coal-Tar-Based Parking Lot Sealcoat: An Unrecognized Source of PAH to Settled House Dust. Environ. Sci. Technol. 2010, 44, 894–900. [Google Scholar] [CrossRef] [PubMed]
- Mahler, B.J.; Van Metre, P.C.; Crane, J.L.; Watts, A.W.; Scoggins, M.; Williams, E.S. Coal-Tar-Based Pavement Sealcoat and PAHs: Implications for the Environment, Human Health, and Stormwater Management. Environ. Sci. Technol. 2012, 46, 3039–3045. [Google Scholar] [CrossRef]
- Kozicki, M.; Piasecki, M.; Goljan, A.; Deptuła, H.; Niesłochowski, A. Emission of Volatile Organic Compounds (VOCs) from Dispersion and Cementitious Waterproofing Products. Sustainability 2018, 10, 2178. [Google Scholar] [CrossRef] [Green Version]
- Wise, S.A.; Benner, B.A.; Byrd, G.D.; Chesler, S.N.; Rebbert, R.E.; Schantz, M.M. Determination of polycyclic aromatic hydrocarbons in a coal tar standard reference material. Anal. Chem. 1988, 60, 887–894. [Google Scholar] [CrossRef]
- Fayerweather, W.E. Meta-Analysis of Lung Cancer in Asphalt Roofing and Paving Workers with External Adjustment for Confounding by Coal Tar. J. Occup. Environ. Hyg. 2007, 4, 175–200. [Google Scholar] [CrossRef]
- Van Metre, P.; Majewski, M.S.; Mahler, B.; Foreman, W.T.; Braun, C.L.; Wilson, J.; Burbank, T.L. PAH volatilization following application of coal-tar-based pavement sealant. Atmos. Environ. 2012, 51, 108–115. [Google Scholar] [CrossRef]
- Li, Z.; Wu, Y.; Zhao, Y.; Wang, L.; Zhu, H.; Qin, L.; Feng, F.; Wang, W.; Wu, Y. Analysis of coal tar pitch and smoke extract components and their cytotoxicity on human bronchial epithelial cells. J. Hazard. Mater. 2011, 186, 1277–1282. [Google Scholar] [CrossRef] [PubMed]
- Kienzler, A.; Mahler, B.J.; Van Metre, P.C.; Schweigert, N.; Devaux, A.; Bony, S. Exposure to runoff from coal-tar-sealed pavement induces genotoxicity and impairment of DNA repair capacity in the RTL-W1 fish liver cell line. Sci. Total Environ. 2015, 520, 73–80. [Google Scholar] [CrossRef] [PubMed]
- Siemering, G.S.; Thiboldeaux, R. Background Concentration, Risk Assessment and Regulatory Threshold Development: Polycyclic Aromatic Hydrocarbons (PAH) in Milwaukee, Wisconsin Surface Soils. Environ. Pollut. 2020, 268, 115772. [Google Scholar] [CrossRef] [PubMed]
- Chiovatto, A.C.L.; de Godoi, A.V.O.; Zanardi-Lamardo, E.; Duarte, F.A.; DelValls, T.; Pereira, C.D.S.; Castro, B. Effects of substances released from a coal tar-based coating used to protect harbor structures on oysters. Mar. Pollut. Bull. 2021, 166, 112221. [Google Scholar] [CrossRef]
- Honkanen, H.; Riala, R.; Kokotti, H. Volatile polycyclic aromatic hydrocarbons in coal tar pitch of water barrier in floors and in ceiling of an old office building and IAQ. AIVC 2006, 2, 267–270. [Google Scholar]
- Dabestani, R.; Ivanov, I.N. A compilation of physical, spectroscopic and photophysical properties of polycyclic aromatic hydrocarbons. Photochem. Photobiol. 1999, 70, 10–34. [Google Scholar]
- Haynes, W.M.; Lide, D.; Bruno, T. CRC Handbook of Chemistry and Physics, 2009−2010. J. Am. Chem. Soc. 2009, 131, 12862. [Google Scholar] [CrossRef]
- Puszkarewicz, A.; Kaleta, J. The Efficiency of the Removal of Naphthalene from Aqueous Solutions by Different Adsorbents. Int. J. Environ. Res. Public Health 2020, 17, 5969. [Google Scholar] [CrossRef] [PubMed]
- Odler, I. The BET-specific surface area of hydrated Portland cement and related materials. Cem. Concr. Res. 2003, 33, 2049–2056. [Google Scholar] [CrossRef]
- Castellini, E.; Malferrari, D.; Bernini, F.; Sainz Diaz, C.I.; Mucci, A.; Sola, M.; Brigatti, M.F.; Borsari, M. Trapping at the Solid–Gas Interface: Selective Adsorption of Naphthalene by Montmorillonite Intercalated with a Fe(III)–Phenanthroline Complex. ACS Omega 2019, 4, 7785–7794. [Google Scholar] [CrossRef] [PubMed]
- ASHRAE Standard 62-1999—Ventilation for Acceptable Indoor Air QualityStandard 62-1999. 1999. Available online: https://en.ru1lib.org/book/651762/c0ff02?dsource=recommend (accessed on 18 September 2021).
- Avgelis, A.; Papadopoulos, A.M. Indoor Air Quality Guidelines and Standards—A State of the Art Review. Int. J. Vent. 2004, 3, 267–278. [Google Scholar] [CrossRef]
- Límites de Exposición Profesional Para Agentes Químicos en España. 2021. Available online: https://www.insst.es/documents/94886/1637405/LEP+2021.pdf/3e65c9ac-0708-f262-4808-2562cc9e0134 (accessed on 19 September 2021).
- Weinrich, A.J. Recommended Exposure Limits (REL). In Encyclopedia of Toxicology, 2nd ed.; Wexler, P., Ed.; Elsevier: New York, NY, USA, 2005; pp. 621–622. [Google Scholar] [CrossRef]
- Barsan, M. NIOSH Pocket Guide to Chemical Hazards. 2007. Available online: https://stacks.cdc.gov/view/cdc/21265 (accessed on 21 September 2021).
- World Health Organization Regional Office for Europe. WHO Guidelines for Indoor Air Quality: Selected Pollutants. 2010. Available online: https://apps.who.int/iris/handle/10665/260127 (accessed on 21 September 2021).
- Calidad del Ambiente Interior en Edificios de Uso Público. 2018. Available online: http://www.madrid.org/bvirtual/BVCM020191.pdf (accessed on 21 September 2021).


| Campaign | Concentration (1) (ppm): Mean ± sd | T (°C) | RH (%) | |
|---|---|---|---|---|
| Living Room (E) | Bedroom (D) | |||
| 1 | 11.7 ± 1.57 | 10.7 ± 1.31 | 18.0 ± 3.97 | 24.8 ± 11.1 |
| 2 | 27.0 ± 2.75 | 20.5 ± 3.74 | 27.8 ± 2.4 | 24.4 ± 7.28 |
| 3 (2) | 9.05 ± 4.87 | 9.25 ± 3.32 | 24.5 ± 2.89 | 44.4 ± 2.47 |
| Borehole | Campaign | Concentrations (1) (ppm) | T (°C) | RH (%) | |
|---|---|---|---|---|---|
| Location | Living Room (E) | Bedroom (D) | |||
| Ceiling | 2 | 48.1 | 32.8 | 32.8 | 34.1 |
| Wall, H = 2.5 m | 14.8 | 19.2 | |||
| Wall, H = 1.5 m | 22.8 | 17.2 | |||
| Ceiling | 3 | 26.3 | 23.8 | 24.8 | 40.6 |
| Wall | 9.25 | 24.5 | 44.4 | ||
| Living Room | Bedroom | |||
|---|---|---|---|---|
| Type of Sorbent | AC | XAD2 | XAD2 | Tenax GR |
| Volatile aromatic compounds | ||||
| Toluene | 3.60 | 0.210 | ||
| p- and m-Xylene | 1.92 | |||
| Naphthalene | 154 | 2.26 | ||
| Polycyclic aromatic hydrocarbons | ||||
| Naphthalene | 48.0 | 16.3 | 2.26 | |
| Acenaphthene | 13.2 | 13.3 | 0.088 | |
| Phenanthrene | 1.32 | 1.14 | ||
| Acenaphthylene | 0.18 | 0.11 | 0.065 | |
| Fluorene | 0.16 | 0.12 | ||
| Fluoranthene | ||||
| Methylnaphthalenes | 1.47 | |||
| PAH-total (VROM. 10) | 49.3 | 17.3 | ||
| PAH-total (EPA. 16) | 62.5 | 30.3 | ||
| Volatile organic halogens | ||||
| Chloroform | 1.26 | |||
| Trichlorofluoromethane | 0.94 | |||
| Alkylbenzenes | ||||
| 1.2.4-Trimethylbenzene | 1.08 | |||
| Hydrocarbons | ||||
| Volatile hydrocarbons (C6-C12) | 168 | |||
| Living Room | Bedroom | ||||
|---|---|---|---|---|---|
| Type of Tube | AC | XAD2 | Tenax GR | XAD2 | Tenax GR |
| Volatile aromatic compounds | |||||
| Toluene | 5.29 | ||||
| p- and m-Xylene | 2.58 | ||||
| Naphthalene | 6152 | 8.05 | 3.69 | ||
| Polycyclic aromatic hydrocarbons | |||||
| Naphthalene | 21.2 | 8.05 | 0.513 | 3.69 | |
| Acenaphthene | 511 | 0.112 | |||
| Phenanthrene | 401 | ||||
| Fluorene | 175 | ||||
| Fluoranthene | 7.44 | 4.47 | |||
| Pyrene | 6.49 | ||||
| PAH-total (VROM. 10) | 496 | 0.513 | |||
| PAH-total (EPA, 16) | 1167 | 0.513 | |||
| Chlorobenzenes | |||||
| 1,4-Dichlorobenzene | 0.62 | ||||
| Alkylbenzenes | |||||
| 1,3,5-trimethylbenzene | 1.17 | ||||
| Hydrocarbons | |||||
| Volatile hydrocarbons (C6-C12) | 3076 | ||||
| Location | Living Room-Ceiling | Living Room-Wall | Bedroom-Wall | |||||
|---|---|---|---|---|---|---|---|---|
| Material | Plaster | Leveling Mortar | Pan Forms +Mortar | Membrane +Mortar | Plaster +Brick | Plaster +Brick | Brick | Paint +Plaster +Brick |
| Sample | ST01-01 | ST01-04 | ST01C-06 | ST01C-08 | SP02-01 | SP03-02 | D3P02-02 | D3P03-01 |
| Dry matter wt% | 88 | 94.5 | 98.8 | 96.4 | 100 | 100 | 92 | 85.5 |
| PID values (ppm) | 24.55 | 16.56 | 11 | 32.6 | 17.1 | |||
| Polycyclic aromatic hydrocarbons (mg/kg dry matter) | ||||||||
| Naphthalene | 0.76 | 2.4 | 0.99 | 230 | 0.62 | 0.13 | 0.16 | 0.35 |
| Acenaphthylene | 0.09 | 0.05 | 0.82 | 6.6 | <0.03 | <0.03 | <0.02 | <0.02 |
| Acenaphthene | 2.2 | 7.8 | 2.8 | 540 | 1.8 | 0.72 | 0.35 | 0.88 |
| Fluorene | 0.25 | 1.2 | 0.35 | 350 | 0.11 | <0.03 | 0.03 | 0.02 |
| Phenanthrene | 4.9 | 28 | 13 | 2300 | 2 | 0.19 | 0.18 | 0.27 |
| Anthracene | <0.02 | 1.4 | 0.3 | 460 | <0.03 | <0.03 | 0.02 | <0.02 |
| Fluoranthene | 0.09 | 8 | 1.1 | 1300 | 0.08 | 0.04 | 0.09 | 0.03 |
| Pyrene | 0.03 | 4 | 0.34 | 780 | 0.05 | <0.03 | 0.06 | <0.02 |
| Benzo(a)anthracene | <0.02 | 0.7 | <0.02 | 340 | 0.03 | <0.03 | 0.02 | <0.02 |
| Chrysene | <0.02 | 0.58 | <0.02 | 290 | 0.03 | <0.03 | 0.02 | <0.02 |
| Benzo(b)fluoranthene | <0.02 | 0.31 | <0.02 | 360 | 0.03 | <0.03 | 0.02 | <0.02 |
| Benzo(k)fluoranthene | <0.02 | 0.14 | <0.02 | 160 | <0.03 | <0.03 | <0.02 | <0.02 |
| Benzo(a)pyrene | <0.02 | 0.04 | <0.02 | 260 | <0.03 | <0.03 | <0.02 | <0.02 |
| Dibenzo(a,h)anthracene | <0.02 | <0.02 | <0.02 | 49 | <0.03 | <0.03 | <0.02 | <0.02 |
| Benzo(g,h,i)perylene | <0.02 | 0.04 | <0.02 | 170 | <0.03 | <0.03 | <0.02 | <0.02 |
| Indene(1,2,3-cd)pyrene | <0.02 | 0.05 | <0.02 | 190 | <0.03 | <0.03 | <0.02 | <0.02 |
| PAH-total (VROM, 10) | 5.8 | 41 | 16 | 5700 | 2.7 | 0.36 | 0.52 | 0.64 |
| PAH-total (EPA, 16) | 8.4 | 54 | 20 | 7800 | 4.7 | 1.1 | 0.98 | 1.5 |
| Concentrations (µg/m3) | |||
|---|---|---|---|
| Living Room | False Ceiling Exhaust | Staircase Landing on the Upper (6th) Floor | |
| Toluene | 0.041 | 0.003 | 0.003 |
| Naphthalene | 0.001 | 134.36 | 49.5 |
| 1,3,4-Trimethylbenzene | 0.001 | 0.003 | |
| Acenaphthene | 71 | ||
| Phenanthrene | 52 | ||
| Fluorene | 24 | ||
Publisher’s Note: MDPI stays neutral with regard to jurisdictional claims in published maps and institutional affiliations. |
© 2021 by the authors. Licensee MDPI, Basel, Switzerland. This article is an open access article distributed under the terms and conditions of the Creative Commons Attribution (CC BY) license (https://creativecommons.org/licenses/by/4.0/).
Share and Cite
Piñeiro, R.; Jimenez-Relinque, E.; Nevshupa, R.; Castellote, M. Primary and Secondary Emissions of VOCs and PAHs in Indoor Air from a Waterproof Coal-Tar Membrane: Diagnosis and Remediation. Int. J. Environ. Res. Public Health 2021, 18, 12855. https://doi.org/10.3390/ijerph182312855
Piñeiro R, Jimenez-Relinque E, Nevshupa R, Castellote M. Primary and Secondary Emissions of VOCs and PAHs in Indoor Air from a Waterproof Coal-Tar Membrane: Diagnosis and Remediation. International Journal of Environmental Research and Public Health. 2021; 18(23):12855. https://doi.org/10.3390/ijerph182312855
Chicago/Turabian StylePiñeiro, Rafael, Eva Jimenez-Relinque, Roman Nevshupa, and Marta Castellote. 2021. "Primary and Secondary Emissions of VOCs and PAHs in Indoor Air from a Waterproof Coal-Tar Membrane: Diagnosis and Remediation" International Journal of Environmental Research and Public Health 18, no. 23: 12855. https://doi.org/10.3390/ijerph182312855
APA StylePiñeiro, R., Jimenez-Relinque, E., Nevshupa, R., & Castellote, M. (2021). Primary and Secondary Emissions of VOCs and PAHs in Indoor Air from a Waterproof Coal-Tar Membrane: Diagnosis and Remediation. International Journal of Environmental Research and Public Health, 18(23), 12855. https://doi.org/10.3390/ijerph182312855