
Diagnostic Value of the TpTe Interval in Children with Ventricular Arrhythmias


Abstract
1. Introduction
2. Materials and Methods
2.1. The Studied Subjects
Electrocardiography
2.2. Statistical Analysis
2.3. Ethical Approval
3. Results
4. Discussion
5. Conclusions
Author Contributions
Funding
Institutional Review Board Statement
Informed Consent Statement
Conflicts of Interest
References
- Szydłowski, L.; Skierska, A.; Markiewicz-Łoskot, G.; Mazurek, B.; Morka, A.; Undas, A. The role of interleukin-6, its -174 G>C polymorphism and C-reactive protein in idiopathic cardiac arrhythmias in children. Adv. Med. Sci. 2013, 58, 320–325. [Google Scholar] [CrossRef] [PubMed]
- Miszczak-Knecht, M.; Werner, B. Benign arrhythmia in children. N Ped. 2015, 19, 96–100. [Google Scholar]
- Badhwar, N.; Scheinman, M.M. Idiopathic Ventricular Tachycardia: Diagnosis and Management. Curr. Probl. Cardiol. 2007, 32, 7–43. [Google Scholar] [CrossRef] [PubMed]
- Iwamoto, M.; Niimura, I.; Shibata, T.; Yasui, K.; Takigiku, K.; Nishizawa, T.; Akaike, T.; Yokota, S. Long-term course and clinical characteristics of ventricular tachycardia detected in children by school-based heart disease screening. Circ. J. 2005, 3, 273–276. [Google Scholar] [CrossRef] [PubMed][Green Version]
- Crosson, J.E.; Callans, D.J.; Bradley, D.J.; Dubin, A.; Epstein, M.; Etheridge, S.; Papez, A.; Phillips, J.R.; Rhodes, L.A.; Saul, P.; et al. PACES/HRS expert consensus statement on the evaluation and management of ventricular arrhythmias in the child with a structurally normal heart. Heart Rhythm 2014, 11, 55–78. [Google Scholar] [CrossRef] [PubMed]
- Thiene, G.; Corrado, M.; Basso, C. Sudden Cardiac Death in the Young and Athletes; Springer Science and Business Media LLC: Milan, Italy, 2016. [Google Scholar]
- Turska-Kmieć, A.; Ziółkowska, L.; Kawalec, W. Modern concepts on the etiology of the idiopathic ventricular arrhythmias in children. Prog. Med. 2011, 12, 1046–1053. [Google Scholar]
- Yan, G.X.; Antzelevitch, C. Cellular basis for the normal T-wave and the electrocardiographic manifestation of the long QT syndrome. Circulation 1998, 98, 1928–1936. [Google Scholar] [CrossRef] [PubMed]
- Markiewicz-Łoskot, G.; Kolarczyk, E.; Mazurek, B.; Łoskot, M.; Szydłowski, L. Prolongation of Electrocardiographic T Wave Parameters Recorded during the Head-Up Tilt Table Test as Independent Markers of Syncope Severity in Children. Int. J. Environ. Res. Public Health 2020, 17, 6441. [Google Scholar] [CrossRef]
- Priori, S.G.; Blomström-Lundqvist, C.; Mazzanti, A.; Bloma, N.; Borggrefe, M.; Camm, J.; Elliott, P.M.; Fitzsimons, D.; Hatala, R.; Hindricks, G.; et al. 2015 ESC Guidelines for the management of patients with ventricular arrhythmias and the prevention of sudden cardiac death. Eur. Heart J. 2015, 36, 2793–2867. [Google Scholar] [CrossRef] [PubMed]
- Getchell, W.S.; Larsen, G.C.; Morris, C.D.; McAnulty, J.H. Epidemiology of syncope in hospitalized patients. J. Gen. Intern. Med. 1999, 14, 677–687. [Google Scholar] [CrossRef] [PubMed]
- Pruszkowska-Skrzep, P.; Pluta, S.; Lenarczyk, A.; Kowalski, O.; Lenarczyk, R.; Kurek, T.; Zdrzałek-Skiba, A.; Chodór, B.; Zeifert, B.; Szkutnik, M.; et al. A comparison of the clinical course of prexcitation syndrome in children and adolescents and in adults. Cardiol. J. 2007, 14, 384–390. [Google Scholar] [PubMed]
- Antzelevitch, C.; Di Diego, J.M. Tpeak-Tend interval as a marker of arrhythmic risk. Heart Rhythm 2019, 16, 954–955. [Google Scholar] [CrossRef] [PubMed]
- Kolarczyk, E.; Markiewicz-Łoskot, G.; Szydłowski, L. The repolarization period during the head-up tilt test in children with vasovagal syncope. Int. J. Environ. Res. Public Health 2020, 17, 1908. [Google Scholar] [CrossRef] [PubMed]
- Antelevitch, C.; Sicouri, S. Clinical relevance of cardiac arrhythmias generated by after depolarizations. Role of M cells in the generation of U waves, triggered activity and torsade de pointes. J. Am. Coll. Cardiol. 1994, 23, 259–277. [Google Scholar]
- Haraguchi, Y.; Yosinaga, M.; Sarantuya, J.; Shimago, A.; Nishi, J.; Kono, Y.; Nomura, Y.; Kubo, R.; Eguchi, T.; Tanaka, S.; et al. Interval representative of transmural dispersion of repolarization in children and young adolescents with congenital long QT syndrome. Circ. J. 2005, 69, 78–82. [Google Scholar] [CrossRef][Green Version]
- Fridericia, L.S. Diesystolendauerim elektrokardiogramm bei normalen menschen und bei herzkranken. Acta Med. Scand. 1920, 53, 469–486. [Google Scholar] [CrossRef]
- Bazett, H.C. An analysis of time relations of electrocardiograms. Heart 1920, 7, 353–367. [Google Scholar] [CrossRef]
- Rautaharju, P.M.; Surawicz, B.; Gettes, L.S. AHA/ACCF/HRS recommendations for the standardization and interpretation of the electrocardiogram: Part IV: The ST segment, T and U waves, and the QT interval: A scientific statement from the American Heart Association Electrocardiography and Arrhythmias Committee, Council on Clinical Cardiology; the American College of Cardiology Foundation; and the Heart Rhythm Society; endorsed by the International Society for Computerized Electrocardiology. Circulation 2009, 119, 241–250. [Google Scholar]
- Takenaka, K.; Tomohiko, A.; Shimizu, W.; Kobori, A.; Ninomiya, T.; Otani, H.; Kubota, T.; Takaki, H.; Kamakura, S.; Horie, M. Exercise stress test amplifies genotype-phenotype correlation in the LQT1 and LQT2 forms of the long-QT syndrome. Circulation 2003, 107, 838–844. [Google Scholar] [CrossRef]
- Markiewicz-Łoskot, G. Electrocardiographic Characteristics of a Total of Repolarization (QT), Early Repolarization Phase (QTP) and Late Phase Repolarization (TpTe) in Healthy Children and Children with Long QT Syndrome; Medical University of Silesia: Katowice, Poland, 2009; Volume 8, pp. 59–76. [Google Scholar]
- West, L.; Beerman, L.; Arora, G. Ventricular Ectopy in Children without Known Heart Disease. J. Pediatrics 2015, 166, 338–342. [Google Scholar] [CrossRef] [PubMed]
- Beaufort-Krol, G.; Dijkstra, S.; Bink-Boelkens, M. Natural history of ventricular premature contractions in children with a structurally normal heart: Does origin matter? Europace 2008, 10, 998–1003. [Google Scholar] [CrossRef] [PubMed]
- Harris, K.; Potts, J.; Fournier, A.; Gross, G.J.; Kantoch, M.J.; Cote, J.-M.; Sanatani, S. A multicenter study of right ventricular outflow tract tachycardia in children. Heart Rhythm 2005, 2, 211. [Google Scholar] [CrossRef]
- Cetin, M.; Yavuz, İ.; Gümüştaş, M.; Yavuz, G. P wave dispersion, Tpeak–Tend interval, and Tp-e/QT ratio in children with psoriasis. Cardiol. Young 2020, 30, 318–322. [Google Scholar] [CrossRef]
- Opthof, T.; Coronel, R.; Wilms-Schopman, J.G.; Plotnikov, A.N.; Shlapakova, I.N.; Danilo, P., Jr.; Rosen, M.R.; Janse, M.J. Dispersion of repolarization in canine ventricle and the electrocardiographic T-wave: Tp-e interval does not reflect transmural dispersion. Heart Rhythm 2007, 4, 341–348. [Google Scholar] [CrossRef] [PubMed]
- Yamaguchi, M.; Shimizu, M.; Ino, H.; Terai, H.; Uchiyama, K.; Oe, K.; Mabuchi, T.; Konno, T.; Kaneda, T.; Mabuchi, H. T-wave peak-to-end interval and QT dispersion in acquired long QT syndrome: A new index for arrythmogenicity. Clin. Sci. 2003, 105, 671–676. [Google Scholar] [CrossRef]
- Topilski, I.; Rogowski, O.; Rosso, R.; Justo, D.; Copperman, Y.; Glikson, M.; Belhassen, B.; Hochenberg, M.; Viskin, S. The morphology of the QT interval predicts torsade de pointes during acquired bradyarrhythmias. J. Am. CollCardiol. 2007, 49, 320–328. [Google Scholar] [CrossRef]
- Zhang, L.; Timothy, K.; Vincent, G. Spectrum of ST-T-wave patterns and repolarization parameters in congenital long-QT syndrome: ECG findings identify genotypes. Circulation 2000, 5, 2849–2855. [Google Scholar] [CrossRef] [PubMed]
- Garson, A.; Dick, M.; Fournier, A. The long QT syndrome in children. An international study of 287 patients. Circulation 1993, 87, 1866–1872. [Google Scholar] [CrossRef] [PubMed]
- Lehmann, M.; Suzuki, F.; Barbara, F. T-wave “humps” as a potential electrcardiographic marker of the long QT syndrome. JACC 1994, 3, 746–754. [Google Scholar] [CrossRef]
- Malfatto, G.; Beria, G.; Sala, S.; Bonazzi, O.; Schwartz, P.J. Quantitative analysis of T-wave abnormalities and their prognostic implications in the idiopathic long QT syndrome. J. Am. CollCardiol. 1994, 23, 296–301. [Google Scholar] [CrossRef]
- Kanters, J.K.; Haarmark, C.; Vedel-Larsen, E.; Andersen, M.P.; Graff, C.; Struijk, J.J.; Thomsen, P.E.B.; Christiansen, M.; Jensen, H.K.; Toft, E. Tpeak-Tend interval in long QT syndrome. J. Electrocardiol. 2008, 41, 603–608. [Google Scholar] [CrossRef] [PubMed]
- Antzelevitch, C.; Shimizu, W.; Yan, G.X.; Sicouri, S. Cellular basis for QT dispersion. J. Electrocardiol. 1998, 30, 168–175. [Google Scholar] [CrossRef]
- Anyukhovsky, E.P.; Sosunov, E.A.; Gainullin, R.Z.; Rosen, M.R. The controversial M cell. J. Cardiovasc. Electrophysiol. 1999, 10, 244–260. [Google Scholar] [CrossRef] [PubMed]
- Antzelevitch, C.; Shimizu, W. Cellular mechanisms underlying the long QT syndrome. Curr. Opin. Cardiol. 2002, 17, 43–51. [Google Scholar] [CrossRef] [PubMed]
- Castro-Torres, Y.; Carmona-Puerta, R.; Katholi, R.E. Ventricular repolarization markers for predicting malignant arrhythmias in clinical practice. World J. Clin. Cases WJCC 2015, 3, 705–720. [Google Scholar] [CrossRef] [PubMed]
- Van Camp, G.; Pasquet, A.; Sinnaeve, P.; Mairesse, G.; De Pauw, M.; Claeys, M.J. Summary 2015 ESC guidelines. ActaCardiol 2016, 71, 7–13. [Google Scholar]
- Wolk, R.; Stec, S.; Kulakowski, P. Extrasystolic beats affect transmural electrical dispersion during programmed electrical stimulation. Eur. J. Clin. Investig. 2001, 31, 293–301. [Google Scholar] [CrossRef]
- Lubinski, A.; Kornacewicz-Jach, Z.; Wnuk-Wojnar, A.M.; Adamus, J.; Kempa, M.; Królak, T.; Lewicka-Nowak, E.; Radomski, M.; Swiatecka, G. The terminal portion of the T-wave: A new electrocardiographic marker of risk of ventricular arrhythmias. Pacing Clin. Electrophysiol. 2000, 23, 1957. [Google Scholar] [CrossRef] [PubMed]
- Lubinski, A.; Lewicka-Nowak, E.; Kempa, M. New insight into repolarization abnormalities in patients with congenital long QT syndrome: The increased transmural dispersion of repolarization. Pacing Clin. Electrophysiol. 1998, 21, 172. [Google Scholar] [CrossRef] [PubMed]
- Viitasalo, M.; Oikarinen, L.; Swan, H.; Väänänen, H.; Glatter, K.; Laitinen, P.J.; Kontula, K.; Barron, H.V.; Toivonen, L.; Scheinman, M.M. Ambulatory electrocardiographic evidence of transmural dispersion of repolarization in patients with long-QT syndrome types 1 and 2. Circulation 2002, 106, 2473. [Google Scholar] [CrossRef]
- Shimizu, M.; Ino, H.; Okeie, K.; Yamaguchi, M.; Nagata, M.; Hayashi, K.; Itoh, H.; Iwaki, T.; Oe, K.; Konno, T.; et al. T-peak to T-end interval may be a better predictor of high-risk patients with hypertrophic cardiomyopathy associated with a cardiac troponin I mutation than QT dispersion. Clin. Cardiol. 2002, 25, 335–339. [Google Scholar] [CrossRef] [PubMed]
- Anttonen, O.; Junttila, M.J.; Maury, P.; Schimpf, R.; Wolpert, C.; Borggrefe, M.; Giustetto, C.; Gaita, F.; Sacher, F.; Haïssaguerre, M.; et al. Differences in twelve-lead electrocardiogram between symptomatic and asymptomatic subjects with short QT interval. Heart Rhythm 2009, 6, 267–271. [Google Scholar] [CrossRef] [PubMed]
- Markiewicz-Łoskot, G.; Moritz-Janiszewska, E.; Mazurek, B.; Łoskot, M.; Bartusek, M.; Skierska, A.; Szydłowski, L. Electrocardiographic T-wave parameters in families with long QT syndrome. Adv.Clin. Exp. Med. 2018, 27, 501–507. [Google Scholar] [CrossRef]
- Carmona Puerta, R.; León Aliz, E.; Morales Salinas, A. Vulnerabilidad arrítmica incrementada y surelación con la hipertensión arterial. Relampa 2011, 24, 96–105. [Google Scholar]
- Mozos, I.; Serban, C. The relation between QT interval and T-wave variables in hypertensive patients. J. Pharm. BioalliedSci. 2011, 3, 339–344. [Google Scholar] [CrossRef] [PubMed]
- Imamura, T.; Sumitomo, N.; Muraji, S.; Yasuda, K.; Nishihara, E.; Iwamoto, M.; Tateno, S.; Doi, S.; Hata, T.; Kogaki, S.; et al. Impact of the T-wave characteristics on distinguishing arrhythmogenic right ventricular cardiomyopathy from healthy children. Int. J. Cardiol. 2021, 323, 168–174. [Google Scholar] [CrossRef] [PubMed]
- Pelliccia, A.; Sharma, S.; Gati, S.; Bäck, M.; Börjesson, M.; Caselli, S.; Collet, J.-P.; Corrado, D.; Drezner, J.A.; Halle, M.; et al. 2020 ESC Guidelines on sports cardiology and exercise in patients with cardiovascular disease. Eur. Heart J. 2021, 42, 17–96. [Google Scholar] [CrossRef] [PubMed]


| Total Cohort (n = 80) | Children with Ventricular Arrhythmias (n = 46) | Control Group of Healthy Children (n = 34) | |
|---|---|---|---|
| Age (median) | 13.4 | 13.6 | 13.3 |
| Female, n (%) | 43 (53.7%) | 21 (46%) | 22 (65%) |
| Male, n (%) | 37 (46.3%) | 25 (54%) | 12 (35%) |
| Complaints | |||
| Palpitations, n (%) | 2 (2.5%) | 2 (9.1%) | 0 |
| Chest twinge, n (%) | 5 (6.2%) | 5 (22.7%) | 0 |
| Chest pain, n (%) | 1 (1.2%) | 1 (4.5%) | 0 |
| Fainting, n (%) | 4 (5%) | 4 (18.2%) | 0 |
| Worse exercise tolerance, n (%) | 8 (10%) | 8 (36.4%) | 0 |
| Syncope, n (%) | 5 (6.2%) | 5 (22.7%) | 0 |
| Headache and dizziness, n (%) | 2 (2.5%) | 2 (9.1%) | 0 |
| Feeling of irregular heart-beat, n (%) | 1 (1.2%) | 1 (4.5%) | 0 |
| Ventricular extrasystoles in ECG, n (%) | 12 (15%) | 12 (26%) | 0 |
| T-wave morphology | |||
| Bactrian, n (%) | 5 (6.2%) | 5 (11%) | 0 |
| Humid, n (%) | 5 (6.2%) | 5 (11%) | 0 |
| Number of Extrasystoles | Children with Ventricular Arrhythmias (n = 46) | Control Group of Healthy Children (n = 34) |
|---|---|---|
| Less than 1000 a Day | 7 (15.26%) | 0 |
| 1000–10,000 per Day | 19 (41.30%) | 0 |
| Over 10,000 a Day | 20 (43.44%) | 0 |
| Tachycardia | 0 | 0 |
| Total | 46 (100%) | 0 |
| Single/complex beats | 22 (47.82%)/8 (17.34%) | 0 |
| Children with Ventricular Arrhythmias | Mann-Whitney U Test p-Value | ||||
|---|---|---|---|---|---|
| T-Wave Normal | T-Wave Abnormal | ||||
| N | 36 | 10 | |||
| Parameter [ms] | Sum of Ranks | Mean of Ranks | Sum of Ranks | Mean of Ranks | |
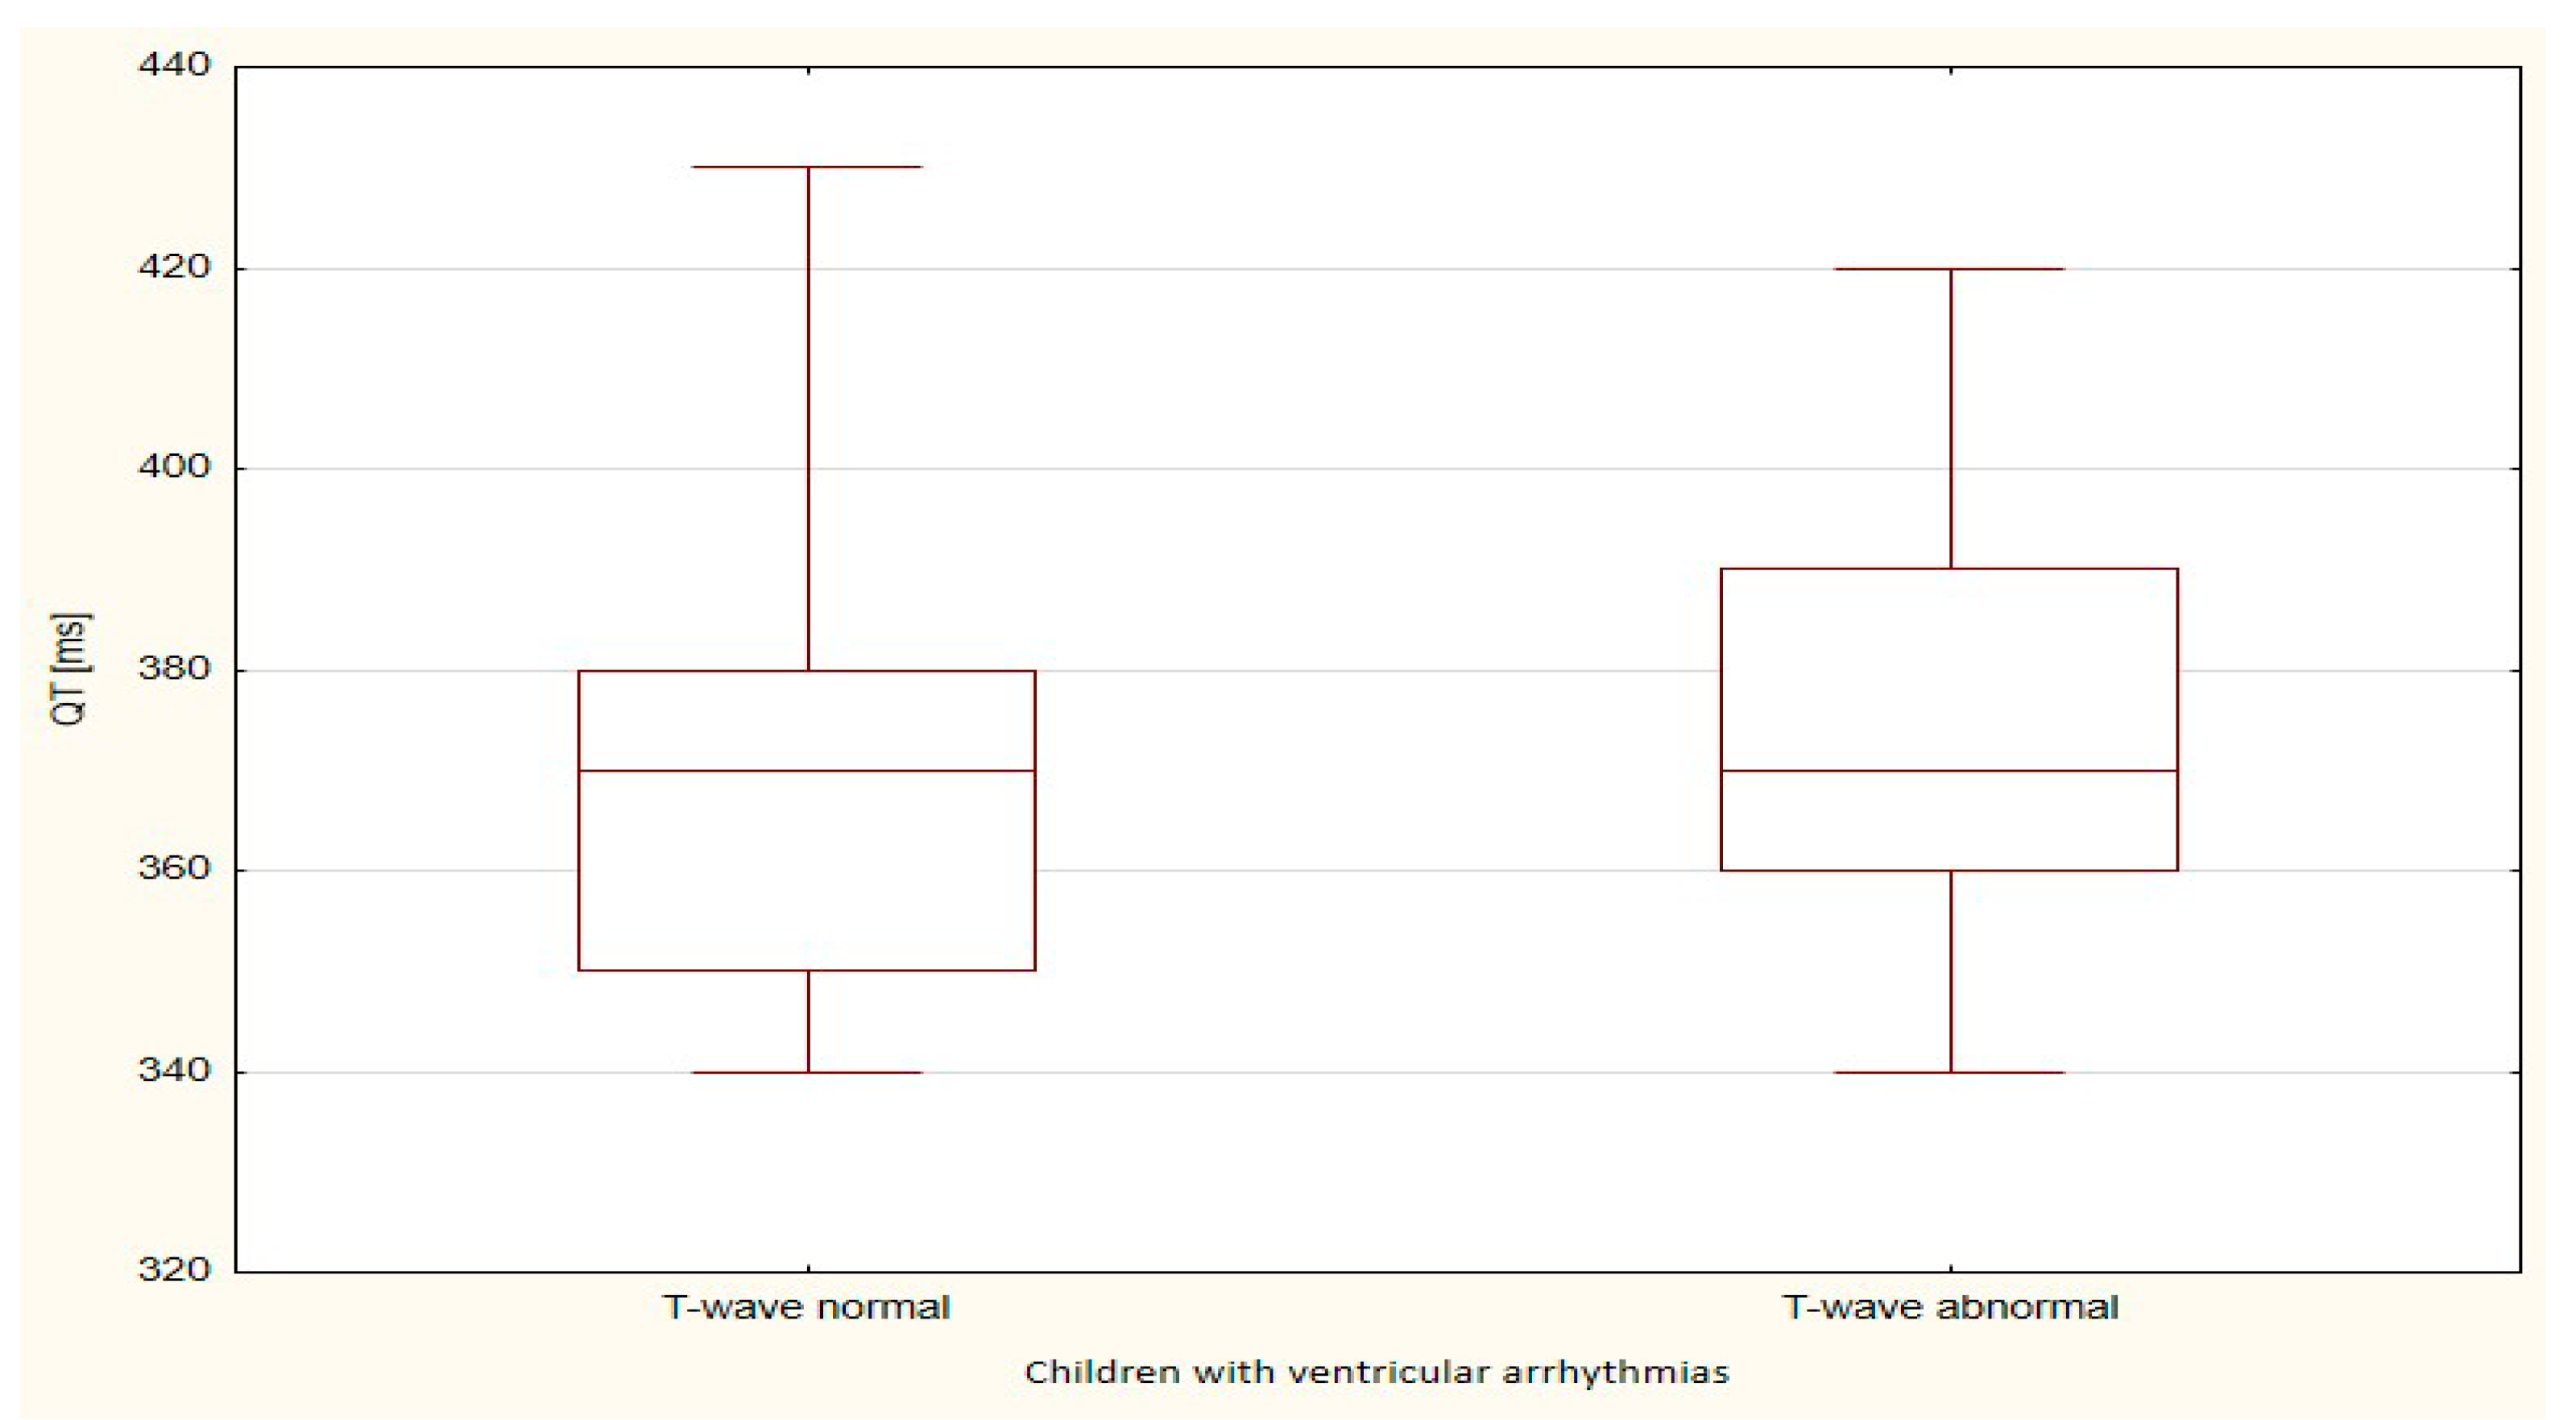
| QT | 824.0 | 22.9 | 257.0 | 25.7 | 0.562 |
| QTp | 844.5 | 23.5 | 236.5 | 23.7 | 0.978 |
| TpTe | 775.5 | 21.5 | 305.5 | 30.6 | 0.033 |
| Children with Ventricular Arrhythmias | Student’s t-Test p-Value | ||||
|---|---|---|---|---|---|
| T-Wave Normal | T-Wave Abnormal | ||||
| N | 36 | 10 | |||
| Parameter [ms] | Mean | Standard Deviation | Mean | Standard Deviation | |
| QTcB | 409.1 | 24.9 | 423.1 | 28.3 | 0.134 |
| QTcF | 394.9 | 16.9 | 405.7 | 21.4 | 0.097 |
| Children with Ventricular Arrhythmias | Children from the Control Group | Mann-Whitney U Test p-Value | |||
|---|---|---|---|---|---|
| T-Wave Abnormal | T-Wave Normal | ||||
| N | 10 | 34 | |||
| Parameter [ms] | Sum of Ranks | Mean of Ranks | Sum of Ranks | Mean of Ranks | |
| QT | 288.0 | 28.8 | 702.0 | 20.6 | 0.080 |
| QTp | 206.0 | 20.6 | 784.0 | 23.1 | 0.610 |
| TpTe | 395.0 | 39.5 | 595.0 | 17.5 | <0.001 |
| Children with Ventricular Arrhythmias | Children from the Control Group | Student’s t-Test p-Value | |||
|---|---|---|---|---|---|
| T-Wave Abnormal | T-Wave Normal | ||||
| N | 10 | 34 | |||
| Parameter [ms] | Sum of Ranks | Mean of Ranks | Sum of Ranks | Mean of Ranks | |
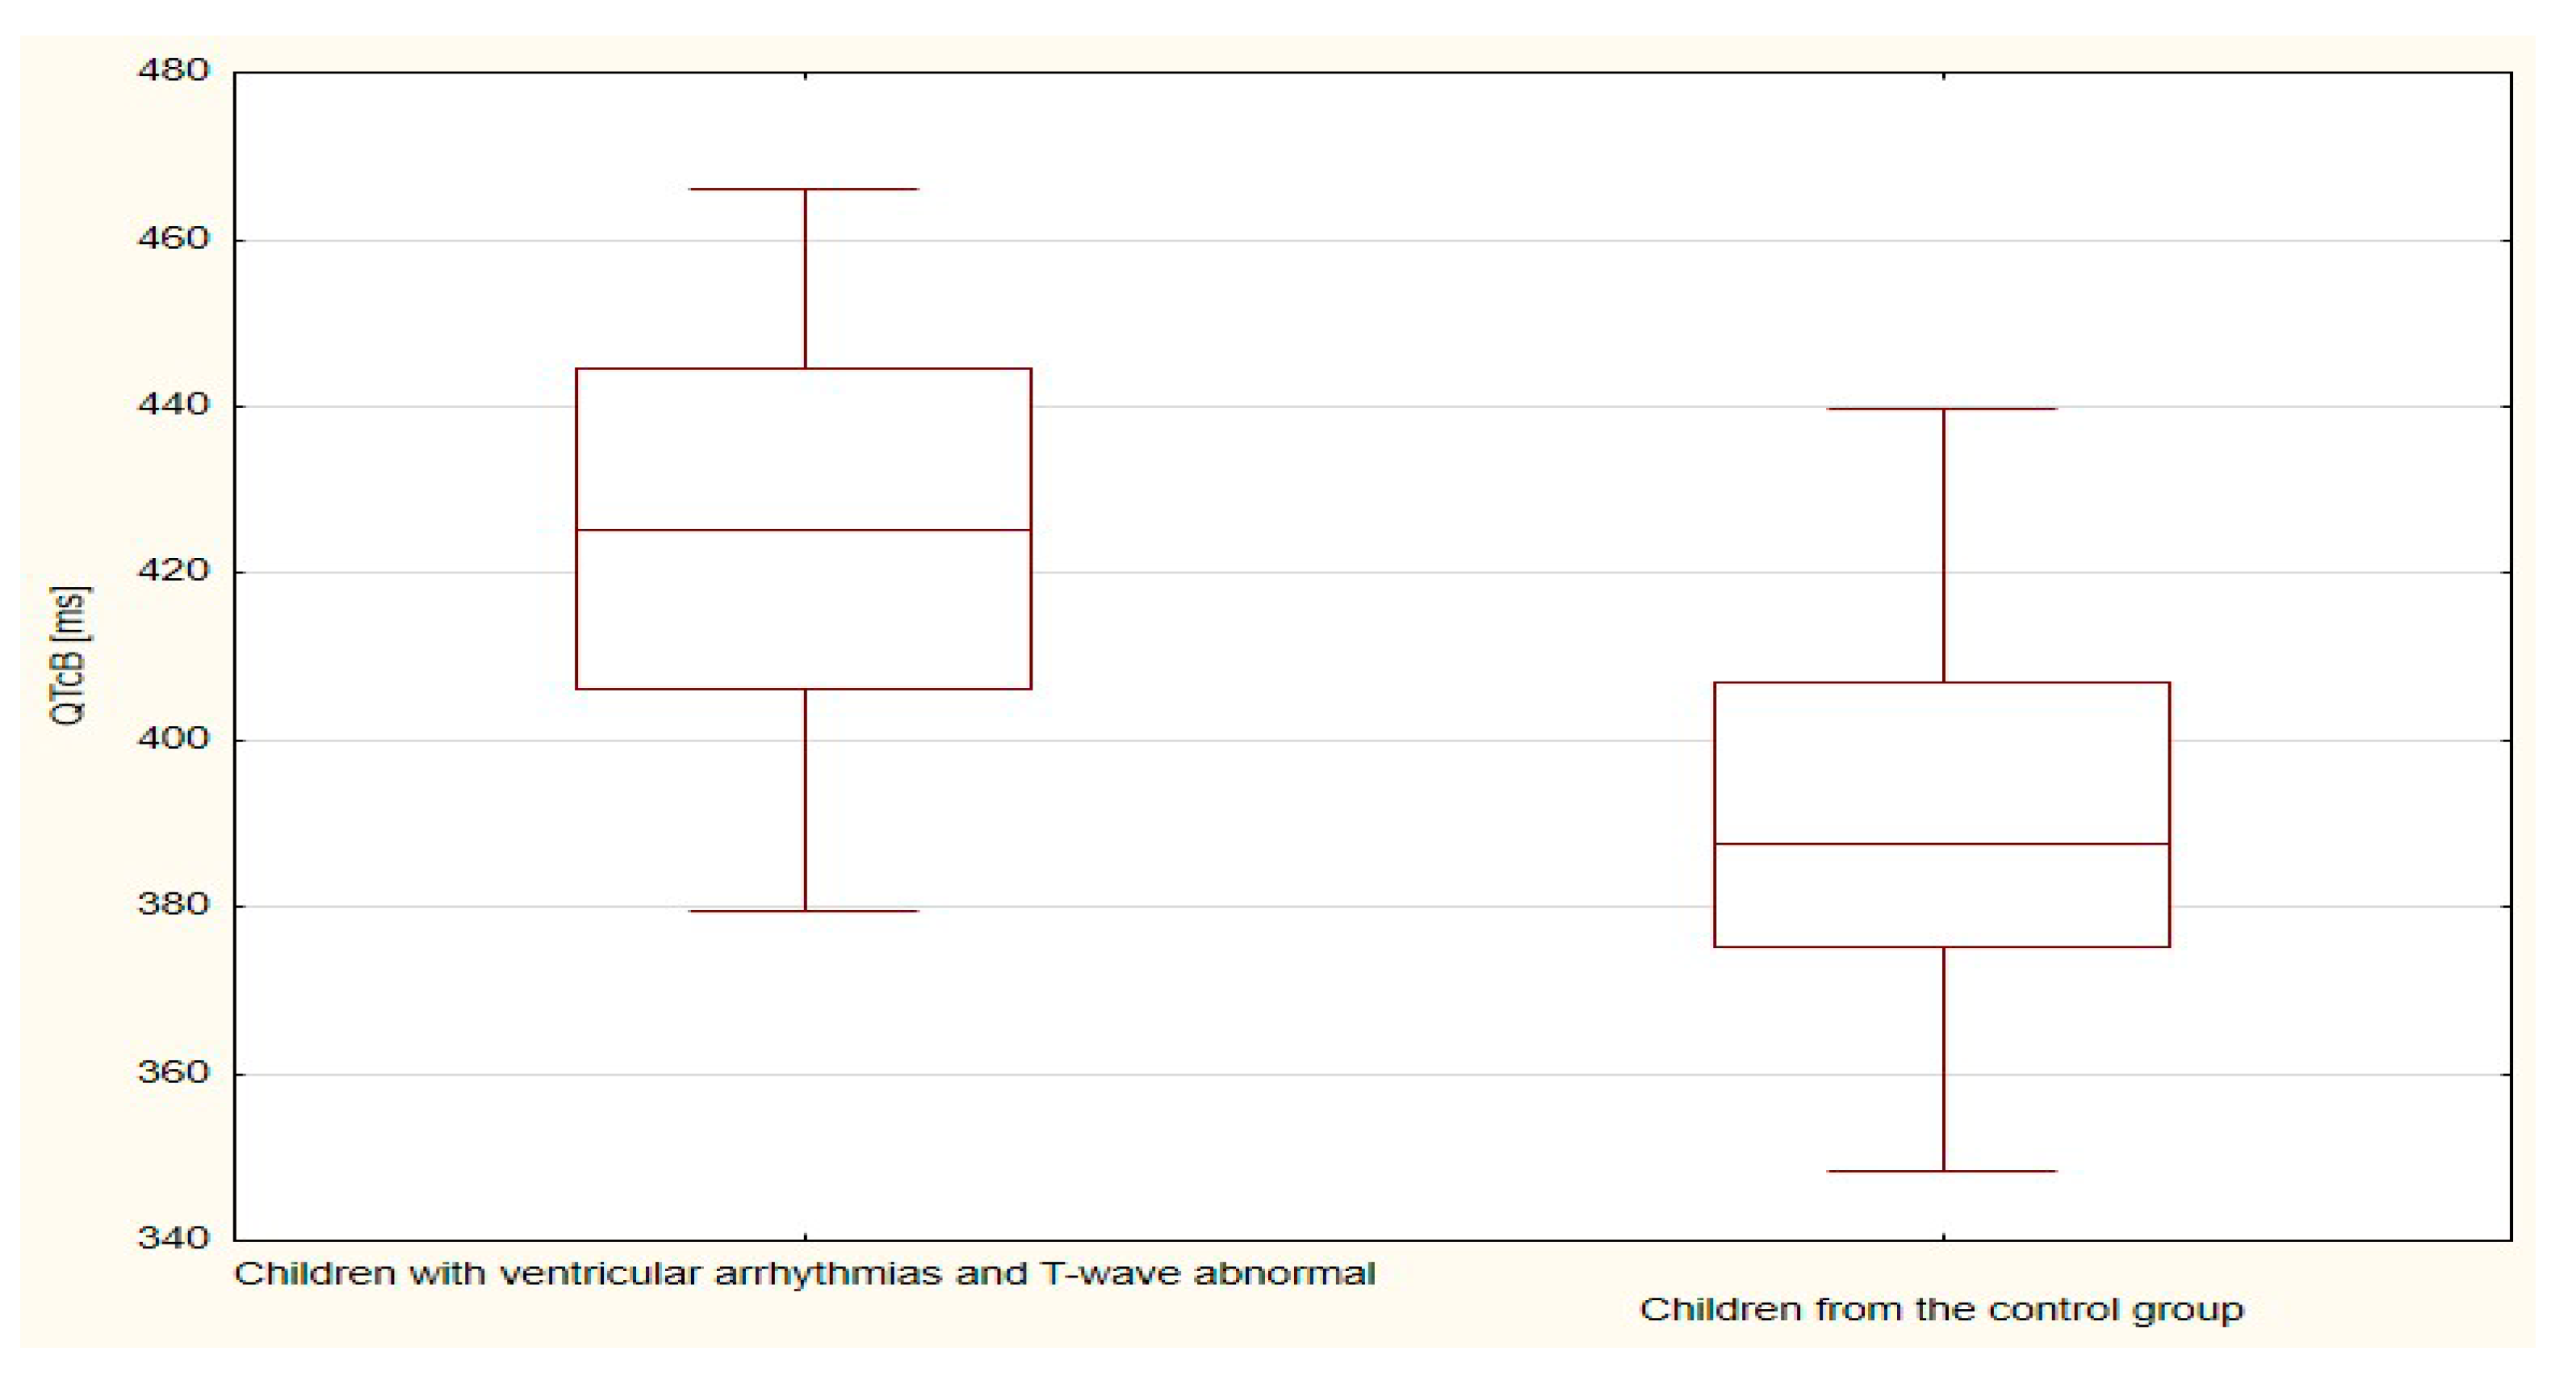
| QTcB | 423.1 | 28.3 | 391.1 | 21.3 | <0.001 |
| QTcF | 405.7 | 21.4 | 379.4 | 18.1 | <0.001 |
| Children with Ventricular Arrhythmias | Mann-Whitney U Test p-Value | ||||
|---|---|---|---|---|---|
| Children with Clinical Symptoms | Children without Clinical Symptoms | ||||
| N | 28 | 18 | |||
| Parameter [ms] | Sum of Ranks | Mean of Ranks | Sum of Ranks | Mean of Ranks | |
| QT | 678.5 | 24.2 | 402.5 | 22.4 | 0.653 |
| QTp | 708.5 | 25.3 | 372.5 | 20.7 | 0.260 |
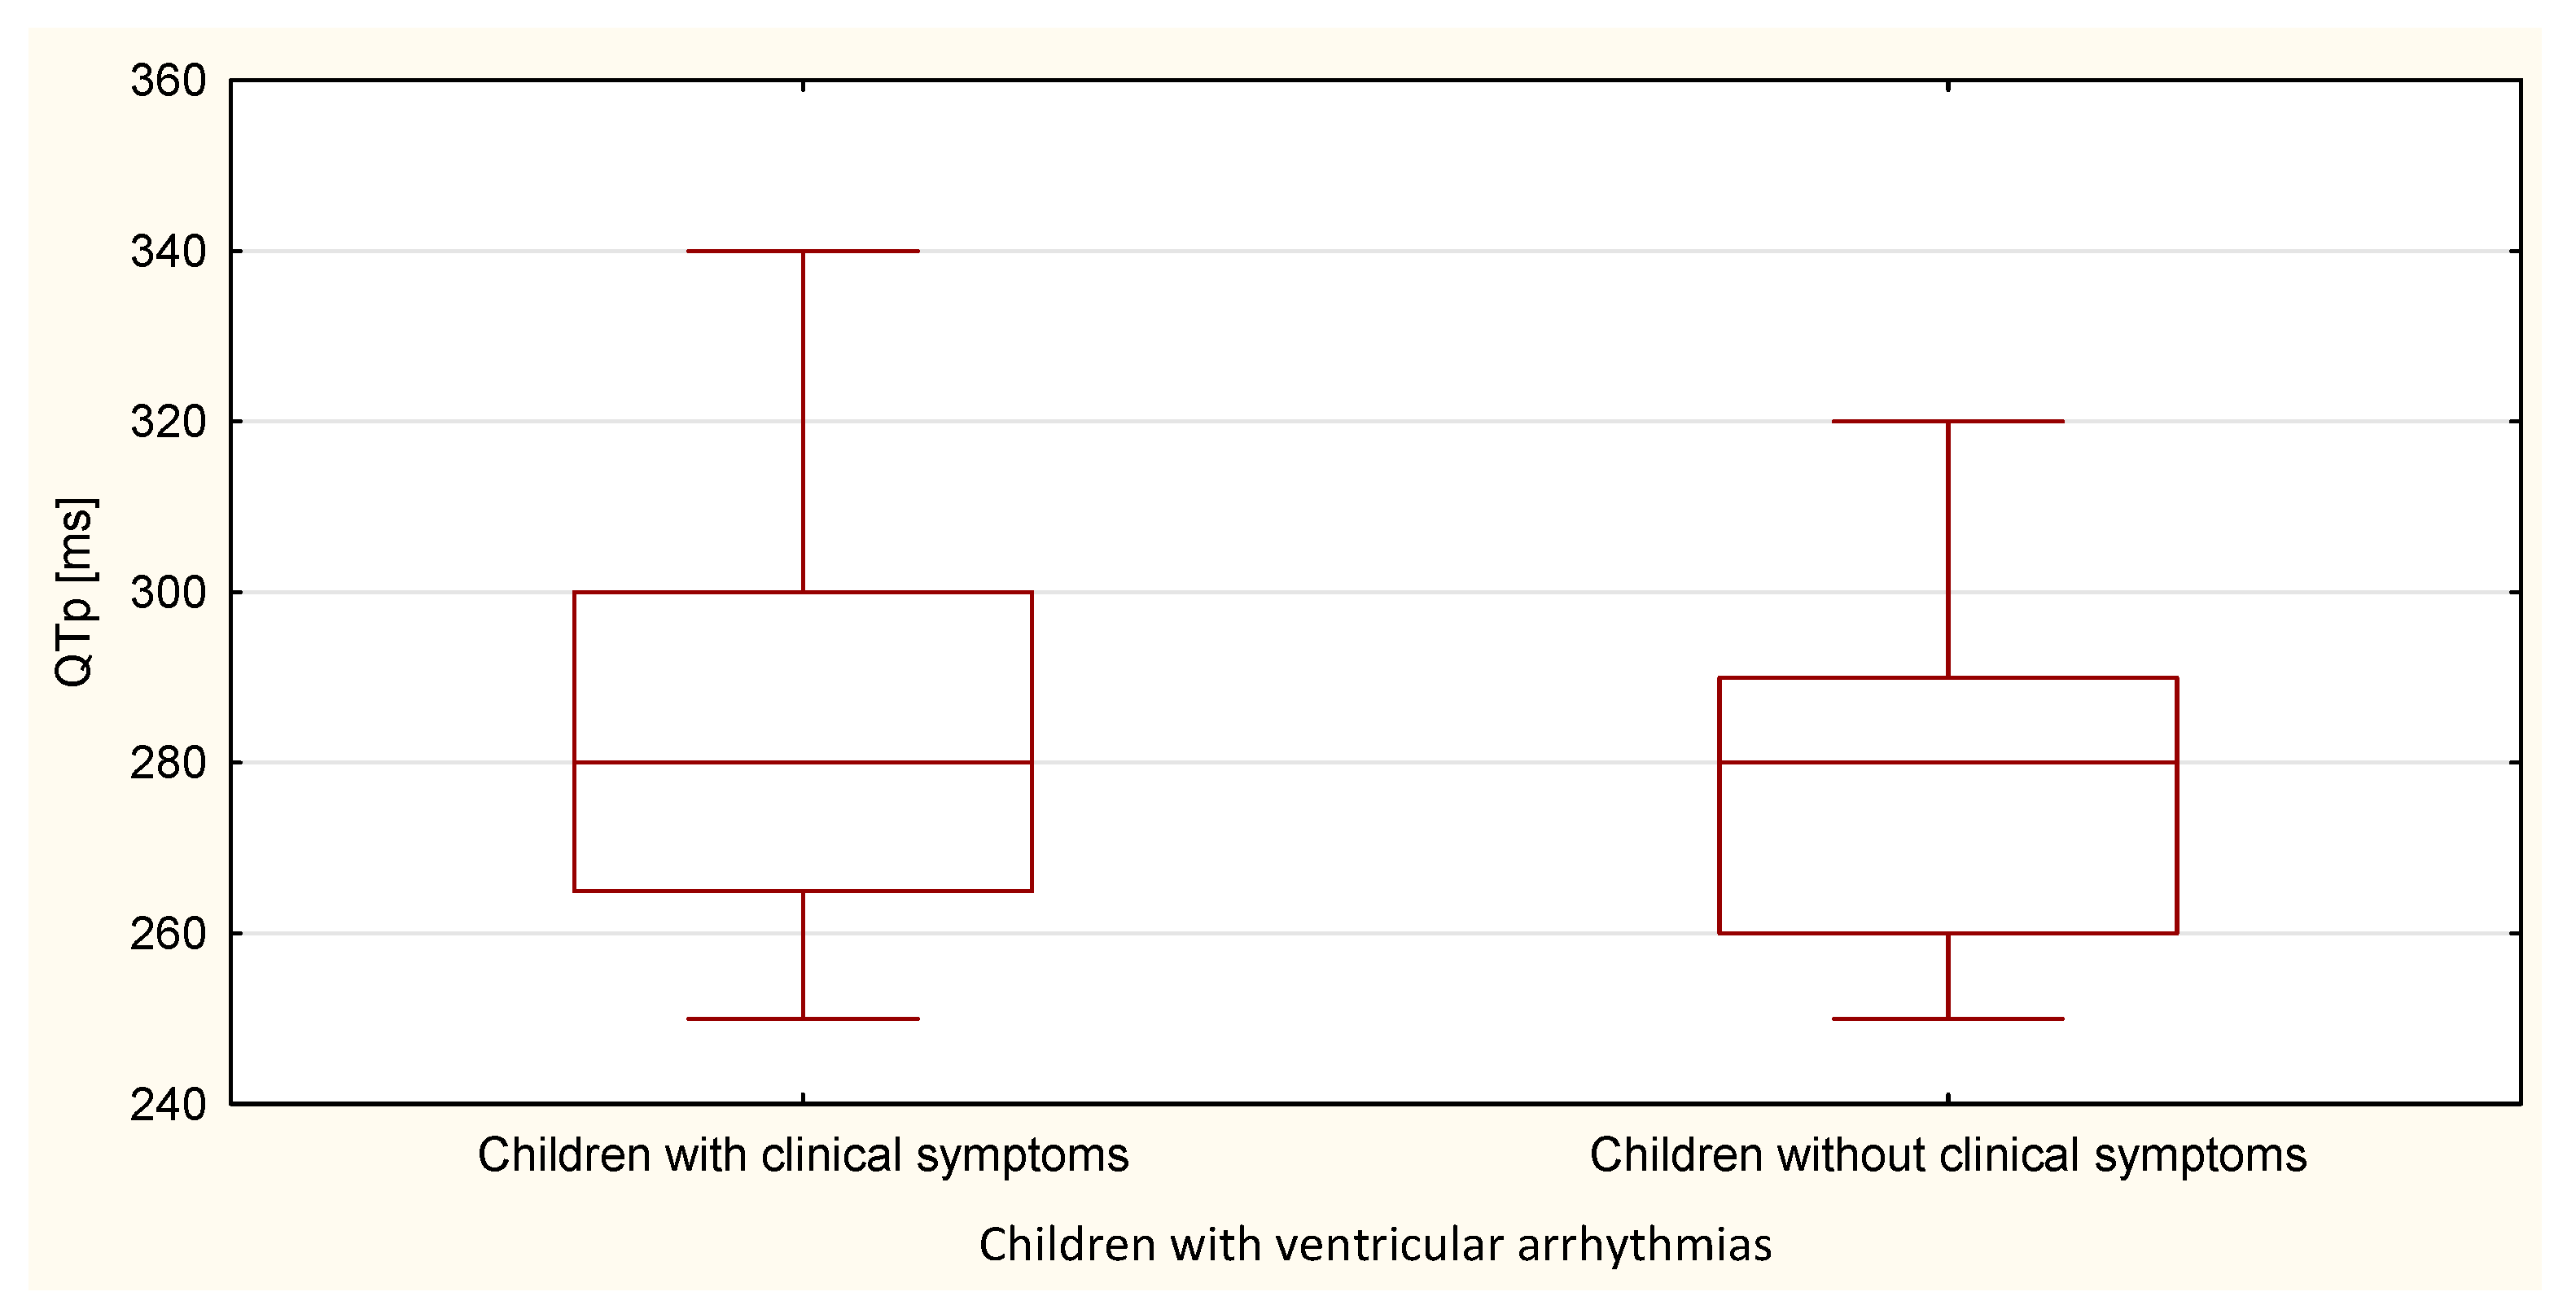
| TpTe | 554.5 | 19.8 | 526.5 | 29.3 | 0.020 |
| Children with Ventricular Arrhythmias | Student’s t-Test p-Value | ||||
|---|---|---|---|---|---|
| Children with Clinical Symptoms | Children without Clinical Symptoms | ||||
| N | 28 | 18 | |||
| Parameter [ms] | Mean | Standard Deviation | Mean | Standard Deviation | |
| QTcB | 410.6 | 27.1 | 414.6 | 24.8 | 0.615 |
| QTcF | 396.8 | 19.3 | 397.9 | 17.0 | 0.850 |
| Children with Ventricular Arrhythmias | Mann-Whitney U Test p-Value | ||||
|---|---|---|---|---|---|
| Ventricular Extrasystoles Recorded in Standard ECG | Ventricular Extrasystoles Recorded in Holter ECG | ||||
| N | 12 | 34 | |||
| Parameter | Sum of Ranks | Mean of Ranks | Sum of Ranks | Mean of Ranks | |
| TpTe [ms] | 410.0 | 34.2 | 671.0 | 19.7 | <0.001 |
| Number of extrasystoles recorded in 24-h Holter ECG | 360.0 | 30.0 | 721.0 | 21.2 | 0.035 |
Publisher’s Note: MDPI stays neutral with regard to jurisdictional claims in published maps and institutional affiliations. |
© 2021 by the authors. Licensee MDPI, Basel, Switzerland. This article is an open access article distributed under the terms and conditions of the Creative Commons Attribution (CC BY) license (https://creativecommons.org/licenses/by/4.0/).
Share and Cite
Jaromin, J.; Markiewicz-Łoskot, G.; Szydłowski, L.; Kulawik, A. Diagnostic Value of the TpTe Interval in Children with Ventricular Arrhythmias. Int. J. Environ. Res. Public Health 2021, 18, 12194. https://doi.org/10.3390/ijerph182212194
Jaromin J, Markiewicz-Łoskot G, Szydłowski L, Kulawik A. Diagnostic Value of the TpTe Interval in Children with Ventricular Arrhythmias. International Journal of Environmental Research and Public Health. 2021; 18(22):12194. https://doi.org/10.3390/ijerph182212194
Chicago/Turabian StyleJaromin, Joanna, Grażyna Markiewicz-Łoskot, Lesław Szydłowski, and Agnieszka Kulawik. 2021. "Diagnostic Value of the TpTe Interval in Children with Ventricular Arrhythmias" International Journal of Environmental Research and Public Health 18, no. 22: 12194. https://doi.org/10.3390/ijerph182212194
APA StyleJaromin, J., Markiewicz-Łoskot, G., Szydłowski, L., & Kulawik, A. (2021). Diagnostic Value of the TpTe Interval in Children with Ventricular Arrhythmias. International Journal of Environmental Research and Public Health, 18(22), 12194. https://doi.org/10.3390/ijerph182212194