
What Explains Successful or Unsuccessful Postural Adaptations to Repeated Surface Perturbations among Older Adults?


Abstract
:1. Introduction
2. Materials and Methods
2.1. Participants
2.2. Test Protocol
2.2.1. Setting
2.2.2. Motor Control Strategies
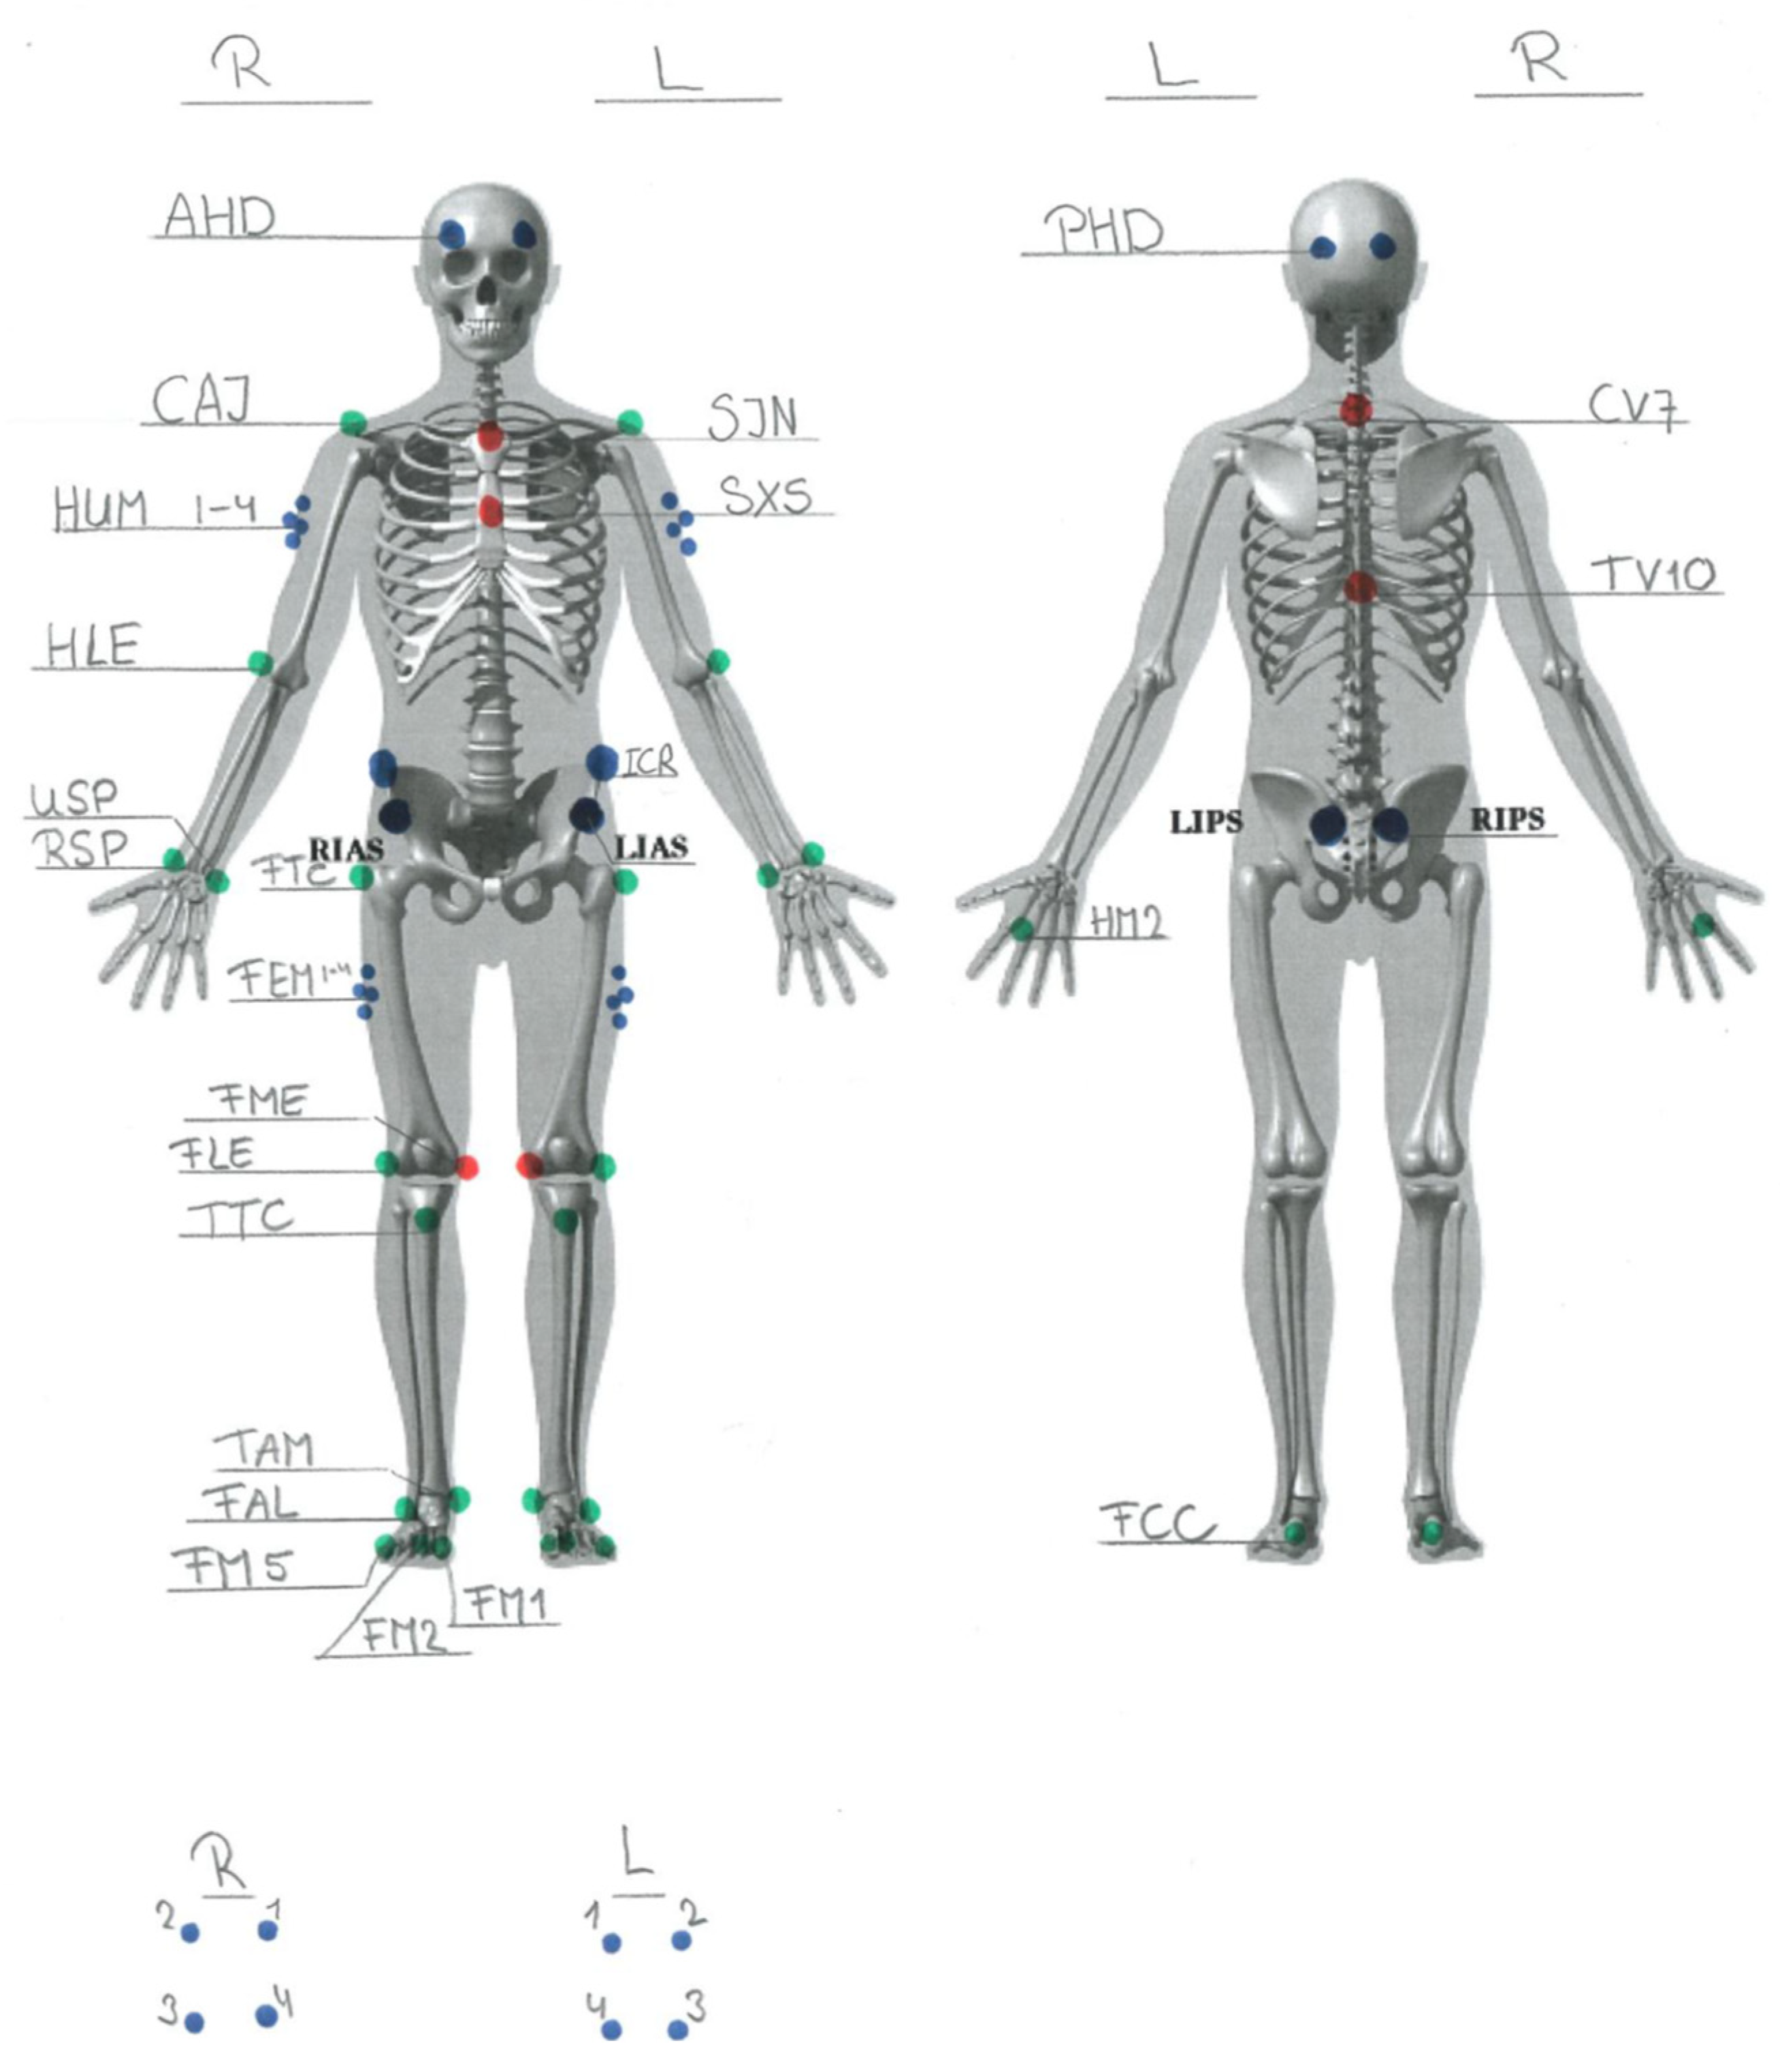
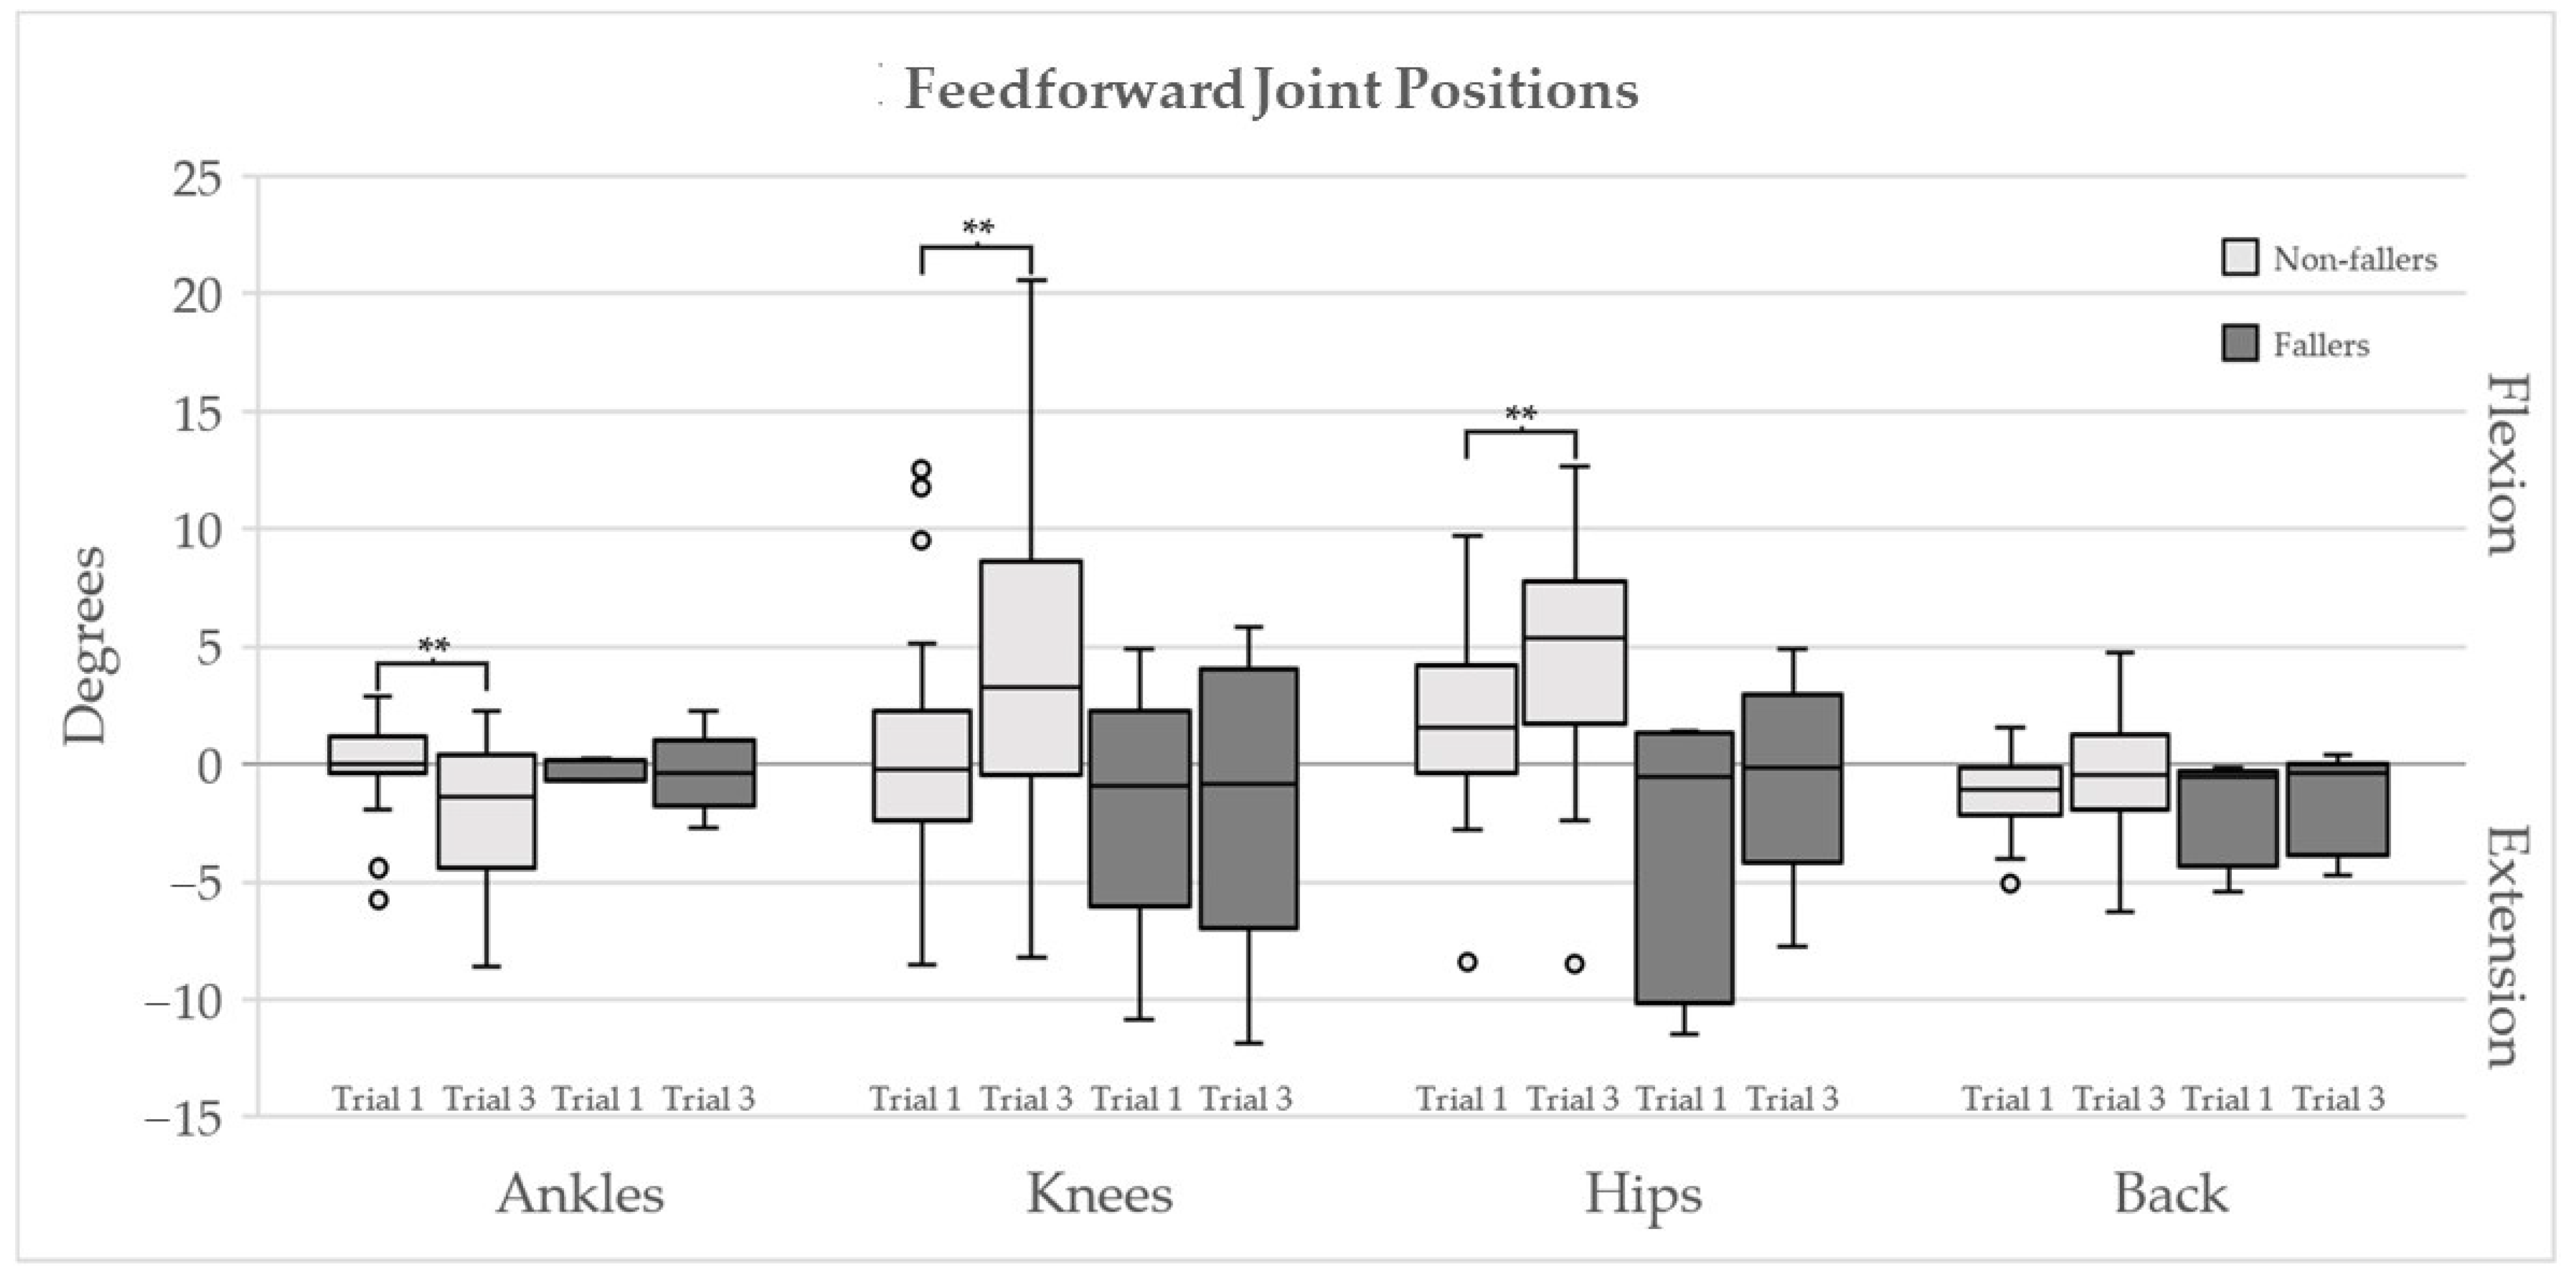
Kinematics
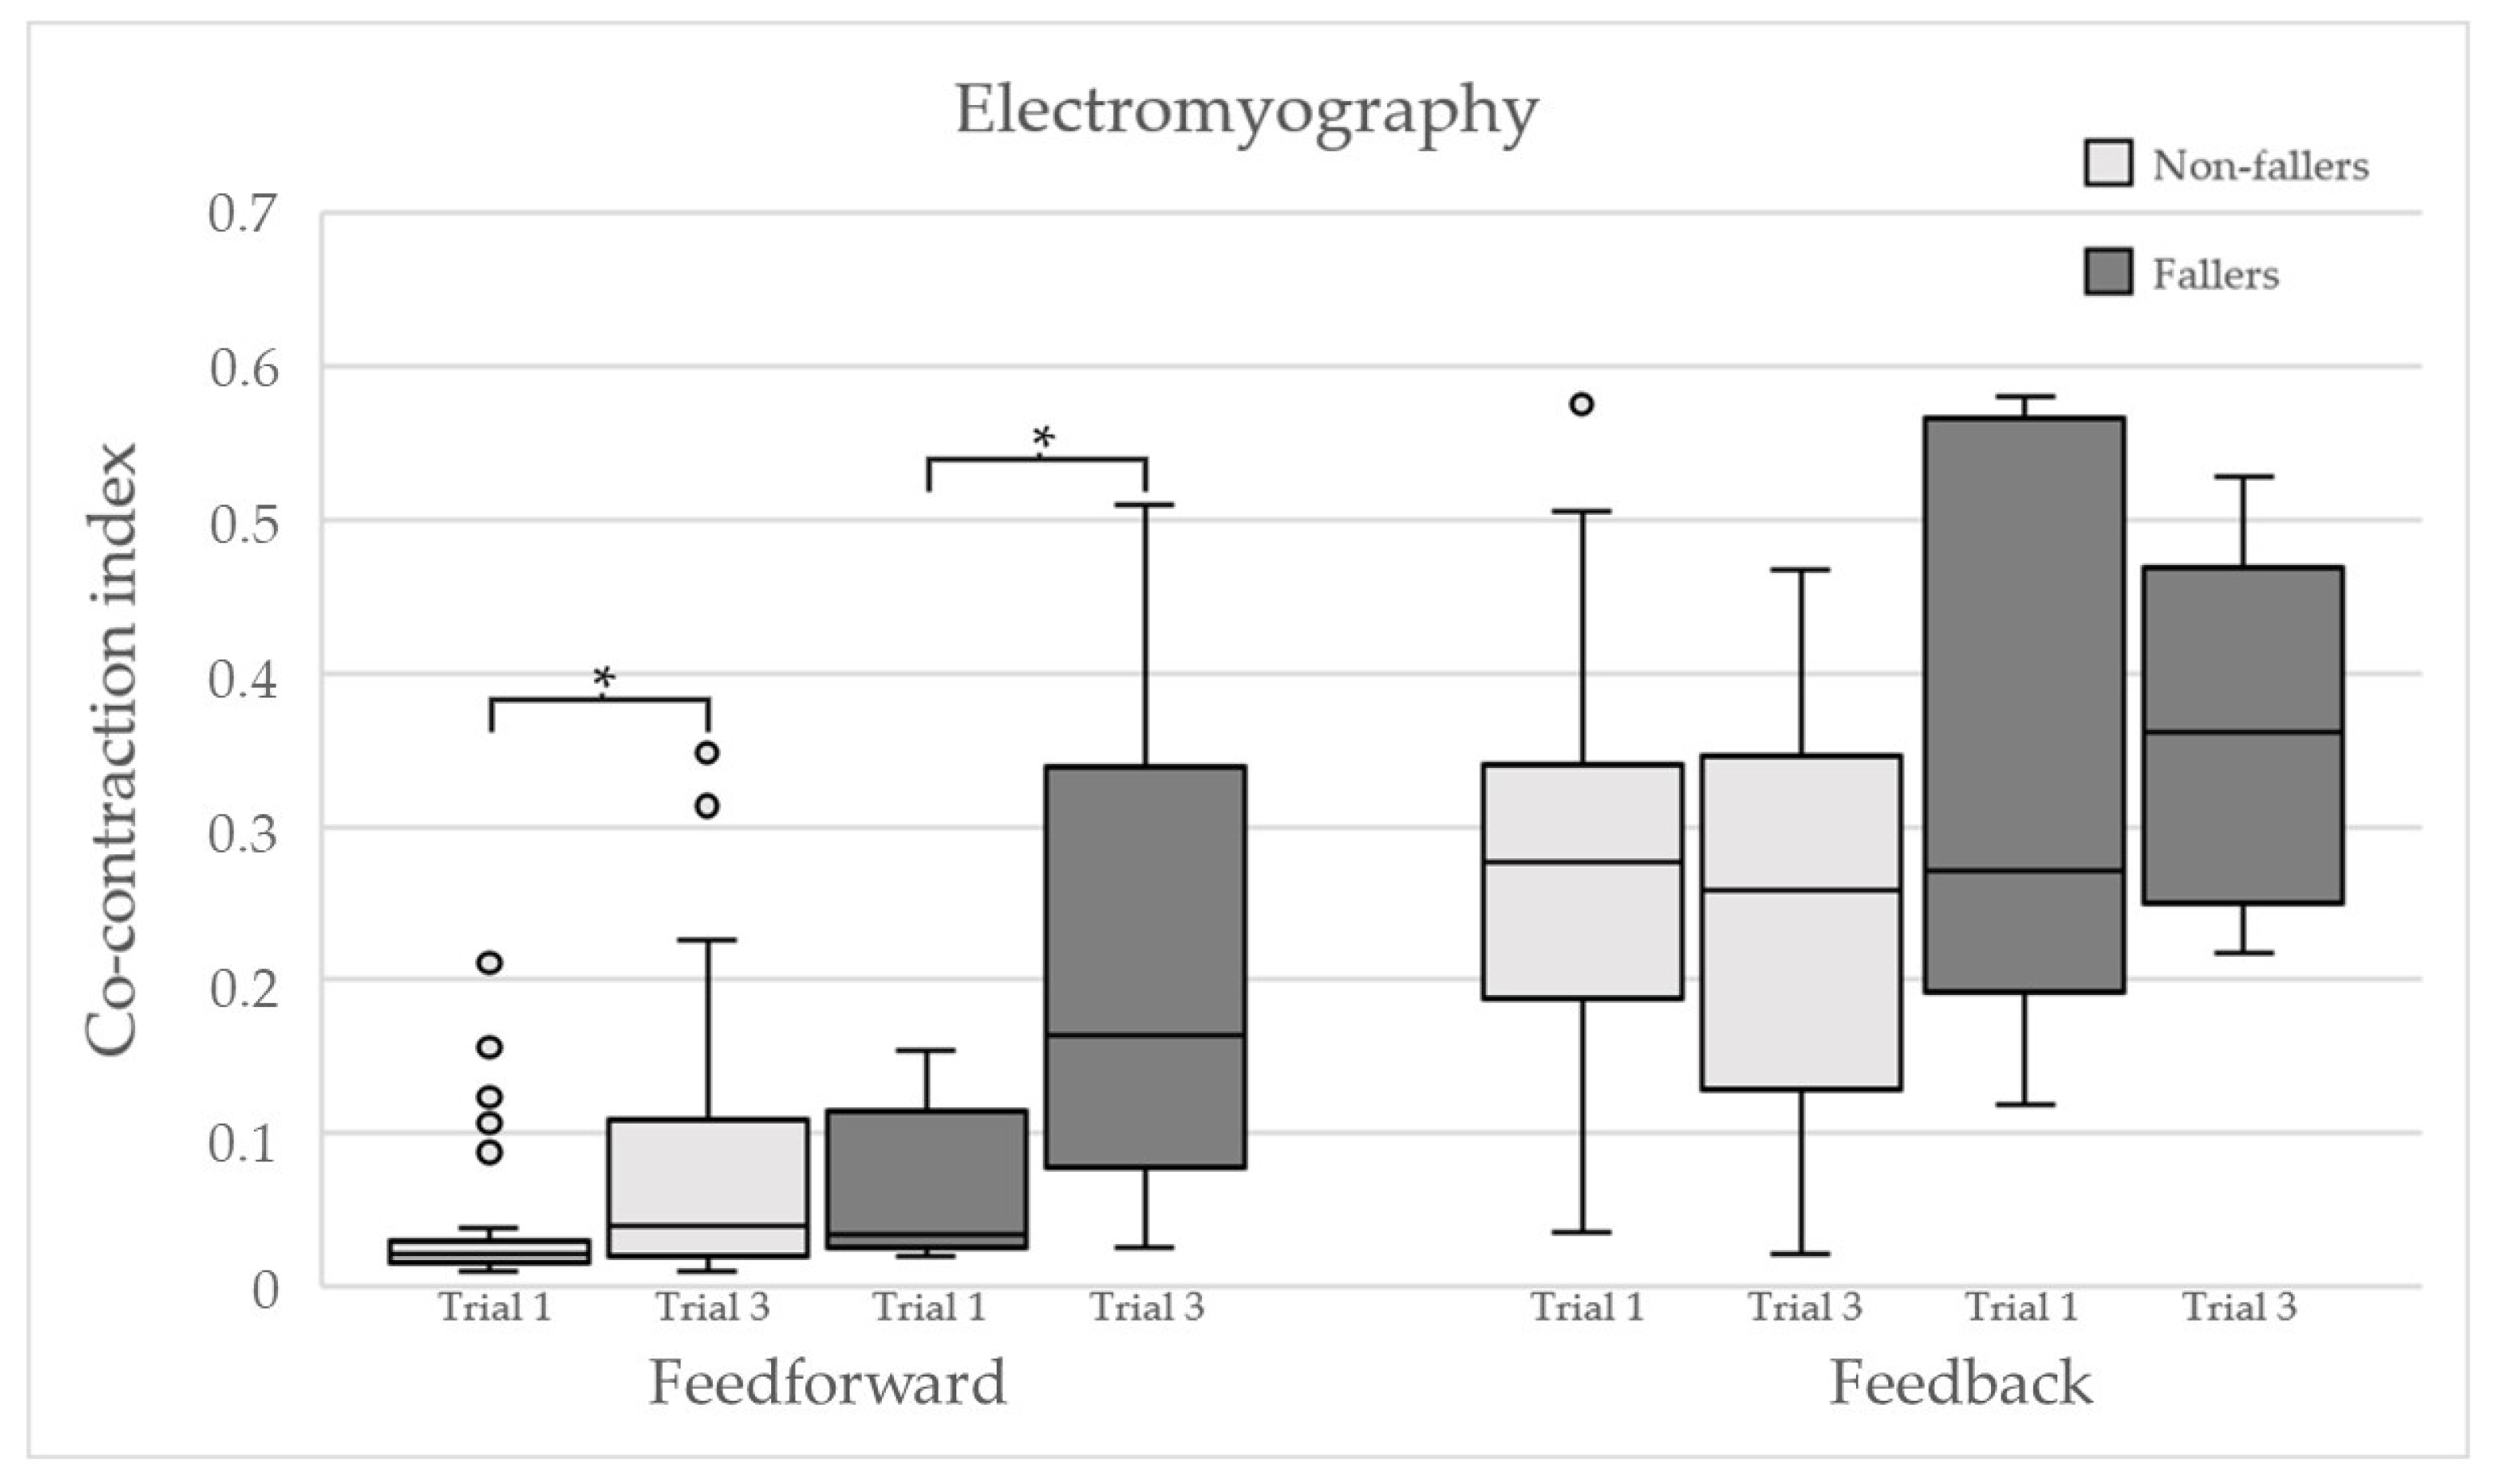
Electromyography
2.2.3. Medication
2.2.4. Psychological Instruments
2.2.5. Sensory Testing
2.2.6. Strength Testing
2.2.7. Functional Testing
2.2.8. Postural Sway Testing
2.3. Statistics
2.4. Ethical Considerations
3. Results
3.1. Participants
3.2. Main Results
- -
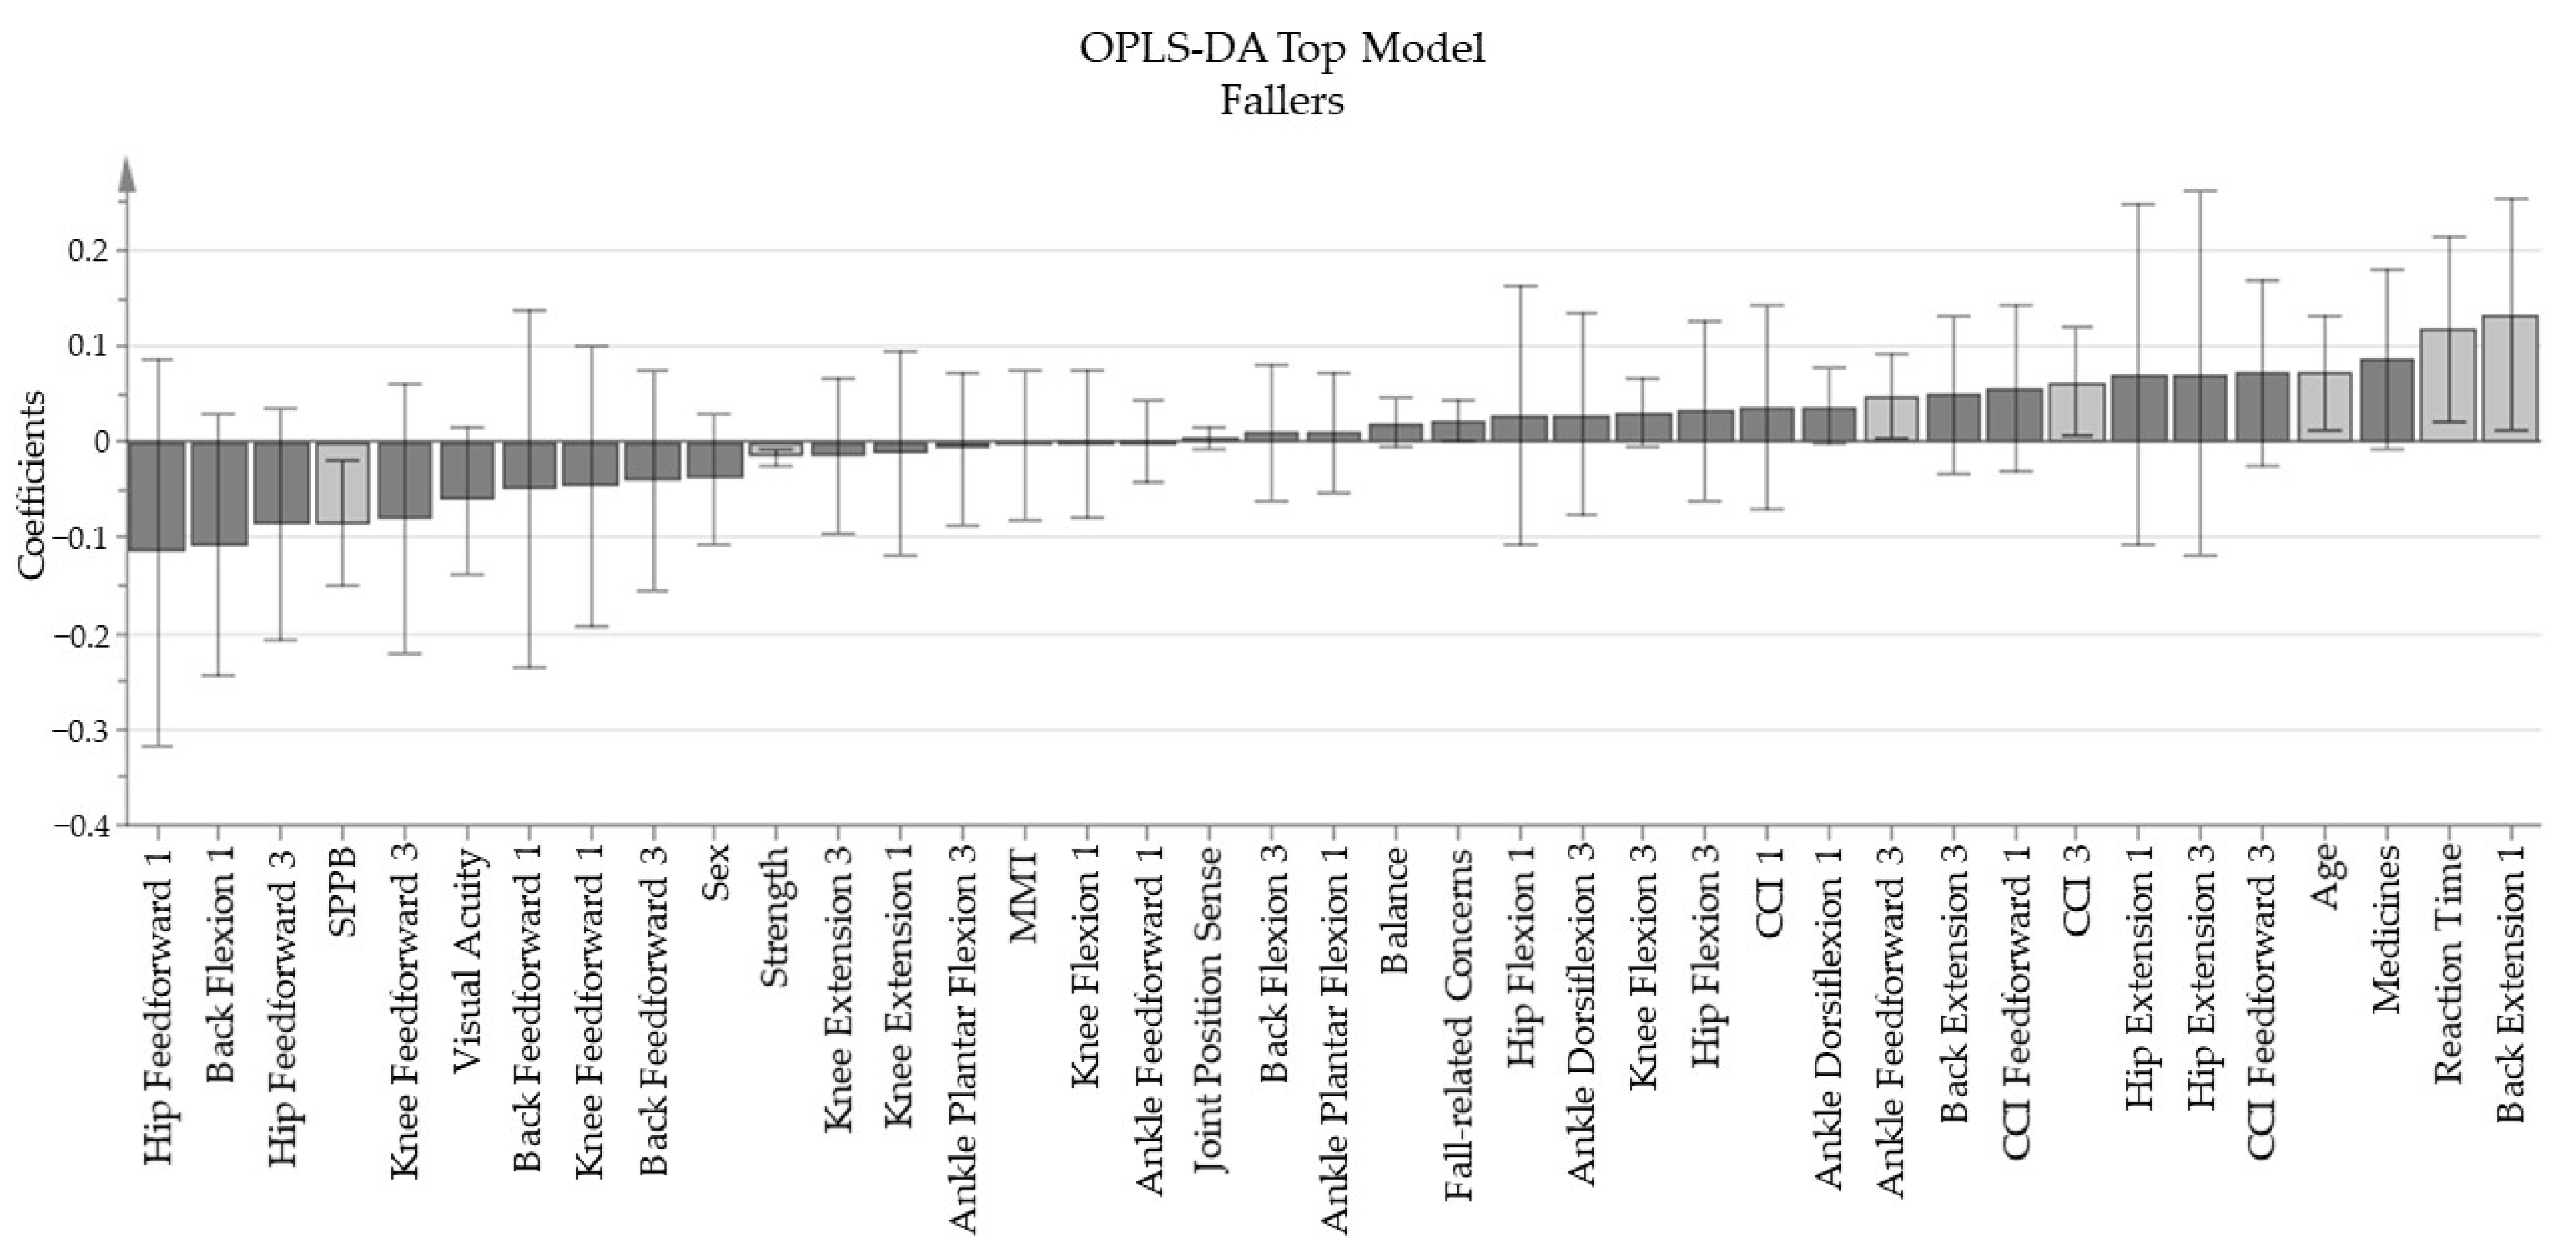
- The base model “Fall-related Concerns”, containing the variables “Are you afraid of falling?”, and the four items of consequence concern, and FES-I, produced one principal component with an explained variance (R2Y) of 57.7% and a predictive value (Q2) of 31.2%.
- -
- The four trials of quiet stance balance concluded the “Balance” base model, made of one principal component with a R2Y of 57.1% and Q2 of 19.3%
- -
- “Strength” is the base model enclosing all strength tests for the lower extremity, which resulted in a one component model with an R2Y of 69.5% and Q2 of 63.1%.
- -
- The joint position sense tests for both left and right knee and ankle produced the base model “Joint Position Sense” with one principal component with an R2Y value of 56% and a Q2 value of 14.7%.
4. Discussion
5. Conclusions
Author Contributions
Funding
Institutional Review Board Statement
Informed Consent Statement
Data Availability Statement
Acknowledgments
Conflicts of Interest
Appendix A

References
- WHO. WHO Global Report on Falls Prevention in Older Age; World Health Organization: Geneva, Switzerland, 2007; p. 53. Available online: http://www.who.int/ageing/publications/Falls_prevention7March.pdf (accessed on 10 February 2020).
- Masud, T.; Morris, R.O. Epidemiology of falls. Age Ageing 2001, 30, 3–7. [Google Scholar] [CrossRef]
- Shaffer, S.W.; Harrison, A.L. Aging of the Somatosensory System: A Translational Perspective. Phys. Ther. 2007, 87, 193–207. [Google Scholar] [CrossRef] [Green Version]
- Hadjistavropoulos, T.; Delbaere, K.; Fitzgerald, T.D. Reconceptualizing the Role of Fear of Falling and Balance Confidence in Fall Risk. J. Aging Health 2010, 23, 3–23. [Google Scholar] [CrossRef] [PubMed] [Green Version]
- Hajek, A.; König, H. What are the psychosocial consequences when fear of falling starts or ends? Evidence from an asymmetric fixed effects analysis based on longitudinal data from the general population. Int. J. Geriatr. Psychiatry 2020, 35, 1028–1035. [Google Scholar] [CrossRef]
- Shumway-Cook, A. Motor Control: Translating Research into Clinical Practice, 5th ed.; Woollacott, M.H., Ed.; Wolters Kluwer: Philadelphia, PA, USA, 2016. [Google Scholar]
- Franklin, D.W.; Wolpert, D. Computational Mechanisms of Sensorimotor Control. Neuron 2011, 72, 425–442. [Google Scholar] [CrossRef] [PubMed] [Green Version]
- Horak, F.B.; Nashner, L.M. Central programming of postural movements: Adaptation to altered support-surface configurations. J. Neurophysiol. 1986, 55, 1369–1381. [Google Scholar] [CrossRef]
- Runge, C.F.; Shupert, C.L.; Horak, F.B.; Zajac, F.E. Ankle and hip postural strategies defined by joint torques. Gait Posture 1999, 10, 161–170. [Google Scholar] [CrossRef]
- Saftari, L.N.; Kwon, O.-S. Ageing vision and falls: A review. J. Physiol. Anthr. 2018, 37, 11. [Google Scholar] [CrossRef] [Green Version]
- Allen, D.; Ribeiro, L.; Arshad, Q.; Seemungal, B.M. Age-Related Vestibular Loss: Current Understanding and Future Research Directions. Front. Neurol. 2016, 7, 231. [Google Scholar] [CrossRef] [PubMed] [Green Version]
- Jeka, J.J.; Allison, L.K.; Kiemel, T. The Dynamics of Visual Reweighting in Healthy and Fall-Prone Older Adults. J. Mot. Behav. 2010, 42, 197–208. [Google Scholar] [CrossRef]
- Seidler, R.D.; Bernard, J.A.; Burutolu, T.B.; Fling, B.W.; Gordon, M.T.; Gwin, J.T.; Kwak, Y.; Lipps, D.B. Motor control and aging: Links to age-related brain structural, functional, and biochemical effects. Neurosci. Biobehav. Rev. 2010, 34, 721–733. [Google Scholar] [CrossRef] [Green Version]
- Marzetti, E.; on behalf of the SPRINTT Consortium; Calvani, R.; Tosato, M.; Cesari, M.; Di Bari, M.; Cherubini, A.; Collamati, A.; D’Angelo, E.; Pahor, M.; et al. Sarcopenia: An overview. Aging Clin. Exp. Res. 2017, 29, 11–17. [Google Scholar] [CrossRef]
- Horak, F.B. Postural orientation and equilibrium: What do we need to know about neural control of balance to prevent falls? Age Ageing 2006, 35 (Suppl. 2), ii7–ii11. [Google Scholar] [CrossRef] [PubMed] [Green Version]
- Henry, M.; Baudry, S. Age-related changes in leg proprioception: Implications for postural control. J. Neurophysiol. 2019, 122, 525–538. [Google Scholar] [CrossRef] [PubMed] [Green Version]
- Peeters, G.; Feeney, J.; Carey, D.; Kennelly, S.; Kenny, R.A. Fear of falling: A manifestation of executive dysfunction? Int. J. Geriatr. Psychiatry 2019, 34, 1275–1282. [Google Scholar] [CrossRef]
- Okada, S.; Hirakawa, K.; Takada, Y.; Kinoshita, H. Relationship between fear of falling and balancing ability during abrupt deceleration in aged women having similar habitual physical activities. Eur. J. Appl. Physiol. 2001, 85, 501–506. [Google Scholar] [CrossRef]
- Pauelsen, M.; Vikman, I.; Strandkvist, V.J.; Larsson, A.; Röijezon, U. Decline in sensorimotor systems explains reduced falls self-efficacy. J. Electromyogr. Kinesiol. 2018, 42, 104–110. [Google Scholar] [CrossRef]
- Pauelsen, M.; Jafari, H.; Strandkvist, V.; Nyberg, L.; Gustafsson, T.; Vikman, I.; Röijezon, U. Frequency domain shows: Fall-related concerns and sensorimotor decline explain inability to adjust postural control strategy in older adults. PLoS ONE 2020, 15, e0242608. [Google Scholar] [CrossRef] [PubMed]
- Young, W.R.; Williams, A.M. How fear of falling can increase fall-risk in older adults: Applying psychological theory to practical observations. Gait Posture 2015, 41, 7–12. [Google Scholar] [CrossRef] [Green Version]
- Delbaere, K.; Close, J.C.; Brodaty, H.; Sachdev, P.; Lord, S.R. Determinants of disparities between perceived and physiological risk of falling among elderly people: Cohort study. BMJ 2010, 341, c4165. [Google Scholar] [CrossRef]
- Zia, A.; Kamaruzzaman, S.B.; Tan, M.P. Polypharmacy and falls in older people: Balancing evidence-based medicine against falls risk. Postgrad. Med. 2014, 127, 330–337. [Google Scholar] [CrossRef] [PubMed]
- Dijkstra, B.W.; Horak, F.B.; Kamsma, Y.P.T.; Peterson, D.S. Older adults can improve compensatory stepping with repeated postural perturbations. Front. Aging Neurosci. 2015, 7, 201. [Google Scholar] [CrossRef]
- Pavol, M.J.; Runtz, E.F.; Edwards, B.J.; Pai, Y.-C. Age Influences the Outcome of a Slipping Perturbation During Initial But Not Repeated Exposures. J. Gerontol. Ser. A Boil. Sci. Med. Sci. 2002, 57, M496–M503. [Google Scholar] [CrossRef] [PubMed]
- Pai, Y.-C.; Bhatt, T.; Wang, E.; Espy, D.; Pavol, M.J. Inoculation against Falls: Rapid Adaptation by Young and Older Adults to Slips during Daily Activities. Arch. Phys. Med. Rehabil. 2010, 91, 452–459. [Google Scholar] [CrossRef] [Green Version]
- Oude Nijhuis, L.B.; Allum, J.H.; Borm, G.F.; Honegger, F.; Overeem, S.; Bloem, B.R. Directional sensitivity of “first trial” reactions in human balance control. J. Neurophysiol. 2009, 101, 2802–2814. [Google Scholar] [CrossRef]
- Pavol, M.J.; Runtz, E.F.; Pai, Y.-C. Young and Older Adults Exhibit Proactive and Reactive Adaptations to Repeated Slip Exposure. J. Gerontol. Ser. A Boil. Sci. Med Sci. 2004, 59, M494–M502. [Google Scholar] [CrossRef]
- Laessoe, U.; Voigt, M. Anticipatory postural control strategies related to predictive perturbations. Gait Posture 2008, 28, 62–68. [Google Scholar] [CrossRef]
- Welch, T.D.J.; Ting, L.H. Mechanisms of Motor Adaptation in Reactive Balance Control. PLoS ONE 2014, 9, e96440. [Google Scholar] [CrossRef] [Green Version]
- Hermens, H.J.; Freriks, B.; Disselhorst-Klug, C.; Rau, G. Development of recommendations for SEMG sensors and sensor placement procedures. J. Electromyogr. Kinesiol. 2000, 10, 361–374. [Google Scholar] [CrossRef]
- Rudolph, K.S.; Axe, M.J.; Snyder-Mackler, L. Dynamic stability after ACL injury: Who can hop? Knee Surg. Sports Traumatol. Arthrosc. 2000, 8, 262–269. [Google Scholar] [CrossRef]
- Greenberg, S.A.; Sullivan-Marx, E.; Sommers, M.S.; Chittams, J.; Cacchione, P. Measuring fear of falling among high-risk, urban, community-dwelling older adults. Geriatr. Nurs. 2016, 37, 489–495. [Google Scholar] [CrossRef]
- Yardley, L.; Smith, H. A Prospective Study of the Relationship between Feared Consequences of Falling and Avoidance of Activity in Community-Living Older People. Gerontologist 2002, 42, 17–23. [Google Scholar] [CrossRef] [Green Version]
- Delbaere, K.; Close, J.C.T.; Mikolaizak, A.S.; Sachdev, P.; Brodaty, H.; Lord, S.R. The Falls Efficacy Scale International (FES-I). A comprehensive longitudinal validation study. Age Ageing 2010, 39, 210–216. [Google Scholar] [CrossRef] [PubMed] [Green Version]
- Mitchell, A.J. A meta-analysis of the accuracy of the mini-mental state examination in the detection of dementia and mild cognitive impairment. J. Psychiatr. Res. 2009, 43, 411–431. [Google Scholar] [CrossRef] [PubMed]
- Mijnarends, D.M.; Meijers, J.M.; Halfens, R.J.; ter Borg, S.; Luiking, Y.C.; Verlaan, S.; Schoberer, D.; Cruz-Jentoft, A.J.; van Loon, L.J.; Schols, J.M. Validity and Reliability of Tools to Measure Muscle Mass, Strength, and Physical Performance in Community-Dwelling Older People: A Systematic Review. J. Am. Med. Dir. Assoc. 2013, 14, 170–178. [Google Scholar] [CrossRef] [PubMed]
- Salthouse, T.A. The processing-speed theory of adult age differences in cognition. Psychol. Rev. 1996, 103, 403–428. [Google Scholar] [CrossRef] [Green Version]
- Bielak, A.A.M.; Hultsch, D.F.; Strauss, E.; MacDonald, S.W.S.; Hunter, M.A. Intraindividual variability in reaction time predicts cognitive outcomes 5 years later. Neuropsychology 2010, 24, 731–741. [Google Scholar] [CrossRef] [PubMed]
- Graveson, J.; Bauermeister, S.; McKeown, D.; Bunce, D. Intraindividual Reaction Time Variability, Falls, and Gait in Old Age: A Systematic Review. J. Gerontol. Ser. B 2015, 71, 857–864. [Google Scholar] [CrossRef] [Green Version]
- Latash, M.L. Muscle coactivation: Definitions, mechanisms, and functions. J. Neurophysiol. 2018, 120, 88–104. [Google Scholar] [CrossRef]
- Mohapatra, S.; Krishnan, V.; Aruin, A.S. The effect of decreased visual acuity on control of posture. Clin. Neurophysiol. 2012, 123, 173–182. [Google Scholar] [CrossRef] [Green Version]
- Davis, J.R.; Campbell, A.D.; Adkin, A.L.; Carpenter, M.G. The relationship between fear of falling and human postural control. Gait Posture 2009, 29, 275–279. [Google Scholar] [CrossRef]
- Adkin, A.L.; Frank, J.S.; Carpenter, M.G.; Peysar, G.W. Fear of falling modifies anticipatory postural control. Exp. Brain Res. 2002, 143, 160–170. [Google Scholar] [CrossRef] [PubMed]
- Nagai, K.; Yamada, M.; Uemura, K.; Tanaka, B.; Mori, S.; Yamada, Y.; Aoyama, T.; Ichihashi, N.; Tsuboyama, T. Effects of fear of falling on muscular coactivation during walking. Aging Clin. Exp. Res. 2011, 24, 157–161. [Google Scholar] [CrossRef] [PubMed]
- Thompson, J.D.; Plummer, P.; Franz, J.R. Age and falls history effects on antagonist leg muscle coactivation during walking with balance perturbations. Clin. Biomech. 2018, 59, 94–100. [Google Scholar] [CrossRef] [PubMed]
- Rogers, M.W.; Mille, M.L. Balance perturbations. Handb. Clin. Neurol. 2018, 159, 85–105. [Google Scholar] [PubMed]
- Pauelsen, M. Losing Control and Developing Concerns: The Complexities of Ageing Postural Control and Fall-Related Concerns. Ph.D. Thesis, Luleå University of Technology, Luleå, Sweden, 2021. [Google Scholar]


| Non-Fallers | Fallers | Sig. | |
|---|---|---|---|
| Descriptive data | |||
| Sex (Male/Female) | 13/17 | 1/4 | 0.627 a |
| Age (years) | 74 (71–76) | 77 (75–78) | 0.170 b |
| Height (cm) | 167 (161–177) | 155 (153–160) | 0.014 b |
| Weight (kg) | 71.5 (64–83) | 75 (70–77) | 0.873 b |
| Number of medicines | 2 (1–4) | 6 (4–7) | 0.018b |
| Psychological instruments | |||
| Afraid of falling | 1 (1–2) | 1 (1–2) | 0.766 b |
| Concerns of injury | 1 (1–2.75) | 2 (2–4) | 0.141 b |
| Concerns of staying helpless on the floor | 1 (1–1) | 1 (1–2) | 0.506 b |
| Concerns of needing more Help | 1 (1–1) | 1 (1–3) | 0.421 b |
| Concerns of becoming a burden | 1 (1–1) | 2 (2–3) | 0.054 b |
| FES-I | 19 (17–23) | 23 (20–24) | 0.299 b |
| MMT | 29 (27–30) | 28 (28–29) | 0.477 b |
| Sensory testing | |||
| Visual acuity | 0.8 (0.7–0.9) | 0.7 (0.7–0.7) | 0.054 b |
| JPS Knee (degrees) | 4.65 (3.85–6.79) | 3.2 (3–6) | 0.450 b |
| JPS Foot (degrees) | 3.85 (2.43–5.07) | 6 (4–7.2) | 0.062 b |
| Strength testing | |||
| Hip Extension torque (Nm) | 49.8 (37.0–66.0) | 37.3 (21.0–43.7) | 0.090 b |
| Hip Abduction torque (Nm) | 51.8 (34.8–71.4) | 40.8 (36.2–41.7) | 0.509 b |
| Knee Extension torque (Nm) | 84.5 (67.3–111.7) | 61 (58.6–65.5) | 0.038b |
| Knee Flexion torque (Nm) | 61.9 (53.8–84.7) | 50.1 (38.6–53.3) | 0.099 b |
| Ankle Dorsiflexion torque (Nm) | 21.7 (18.3–25.5) | 19.6 (15.7–2.0) | 0.203 b |
| Ankle Plantar Flexion torque (Nm) | 88.0 (63.2–107.5) | 57.7 (40.4–60.4) | 0.010b |
| Functional testing | |||
| Reaction Time (ms) | 365 (327–414) | 442 (439–448) | 0.012 b |
| SPPB | 11.5 (11–12) | 10 (9–11) | 0.054 b |
| Postural sway testing | |||
| Stable Eyes Open (cm2) | 0.93 (0.71–1.73) | 2.95 (1.24–3.57) | 0.086 b |
| Stable Eyes Closed (cm2) | 1.25 (0.86–1.95) | 2.81 (1.31–3.43) | 0.232 b |
| Unstable Eyes Open (cm2) | 4.95 (4.15–6.37) | 11.08 (8.83–12.44) | 0.001 b |
| Unstable Eyes Closed (cm2) | 12.2 (9.12–19.32) | 19.11 (18.48–21.14) | 0.137 b |
| Maximum Joint Angle (Degrees) | Non-Fallers n = 30 | Fallers n = 5 | ||||
|---|---|---|---|---|---|---|
| Trial 1 | Trial 3 | Sig. | Trial 1 | Trial 3 | Sig. | |
| Ankle Plantar Flexion | 0.80 (0.61–2.32) | 2.63 (1.69–4.10) | 0.002 | 0.79 (0.73–1.17) | 1.85 (1.34–3.40) | 0.043 |
| Ankle Dorsiflexion | 6.55 (5.00–8.39) | 6.48 (5.06–7.37) | 0.480 | 7.47 (6.91–7.58) | 6.70 (5.69–9.60) | 0.893 |
| Knee Flexion | 12.50 (11.66–16.68) | 8.77 (5.48–11.92) | 0.001 | 14.01 (13.89–14.69) | 8.15 (7.86–10.30) | 0.225 |
| Knee Extension | 0.23 (0.16–0.31) | 0.15 (0.11–0.26) | 0.495 | 0.15 (0.14–0.30) | 0.17 (0.00–0.34) | 0.686 |
| Hip Flexion | 7.67 (5.30–11.88) | 3.23 (1.64–5.53) | <0.001 | 12.26 (8.54–19.32) | 5.03 (2.43–6.29) | 0.080 |
| Hip Extension | 0.04 (0.01–0.28) | 0.19 (0.06–1.19) | 0.139 | 0.35 (0.11–0.83) | 2.14 (0.45–4.19) | 0.686 |
| Back Flexion | 2.61 (2.08–3.64) | 1.51 (0.88–2.04) | <0.001 | 1.90 (0.43–1.91) | 1.64 (1.00–3.13) | 0.225 |
| Back Extension | 0.13 (0.01–0.61) | 0.11 (0.03–0.52) | 0.754 | 2.04 (1.69–2.56) | 0.70 (0.17–2.49) | 0.138 |
Publisher’s Note: MDPI stays neutral with regard to jurisdictional claims in published maps and institutional affiliations. |
© 2021 by the authors. Licensee MDPI, Basel, Switzerland. This article is an open access article distributed under the terms and conditions of the Creative Commons Attribution (CC BY) license (https://creativecommons.org/licenses/by/4.0/).
Share and Cite
Falk, J.; Strandkvist, V.; Vikman, I.; Pauelsen, M.; Röijezon, U. What Explains Successful or Unsuccessful Postural Adaptations to Repeated Surface Perturbations among Older Adults? Int. J. Environ. Res. Public Health 2021, 18, 12069. https://doi.org/10.3390/ijerph182212069
Falk J, Strandkvist V, Vikman I, Pauelsen M, Röijezon U. What Explains Successful or Unsuccessful Postural Adaptations to Repeated Surface Perturbations among Older Adults? International Journal of Environmental Research and Public Health. 2021; 18(22):12069. https://doi.org/10.3390/ijerph182212069
Chicago/Turabian StyleFalk, Jimmy, Viktor Strandkvist, Irene Vikman, Mascha Pauelsen, and Ulrik Röijezon. 2021. "What Explains Successful or Unsuccessful Postural Adaptations to Repeated Surface Perturbations among Older Adults?" International Journal of Environmental Research and Public Health 18, no. 22: 12069. https://doi.org/10.3390/ijerph182212069
APA StyleFalk, J., Strandkvist, V., Vikman, I., Pauelsen, M., & Röijezon, U. (2021). What Explains Successful or Unsuccessful Postural Adaptations to Repeated Surface Perturbations among Older Adults? International Journal of Environmental Research and Public Health, 18(22), 12069. https://doi.org/10.3390/ijerph182212069