
Effects of High-Intensity Interval Training and Moderate-Intensity Continuous Training on Cardiometabolic Risk Factors in Overweight and Obesity Children and Adolescents: A Meta-Analysis of Randomized Controlled Trials


Abstract
:1. Introduction
2. Methods
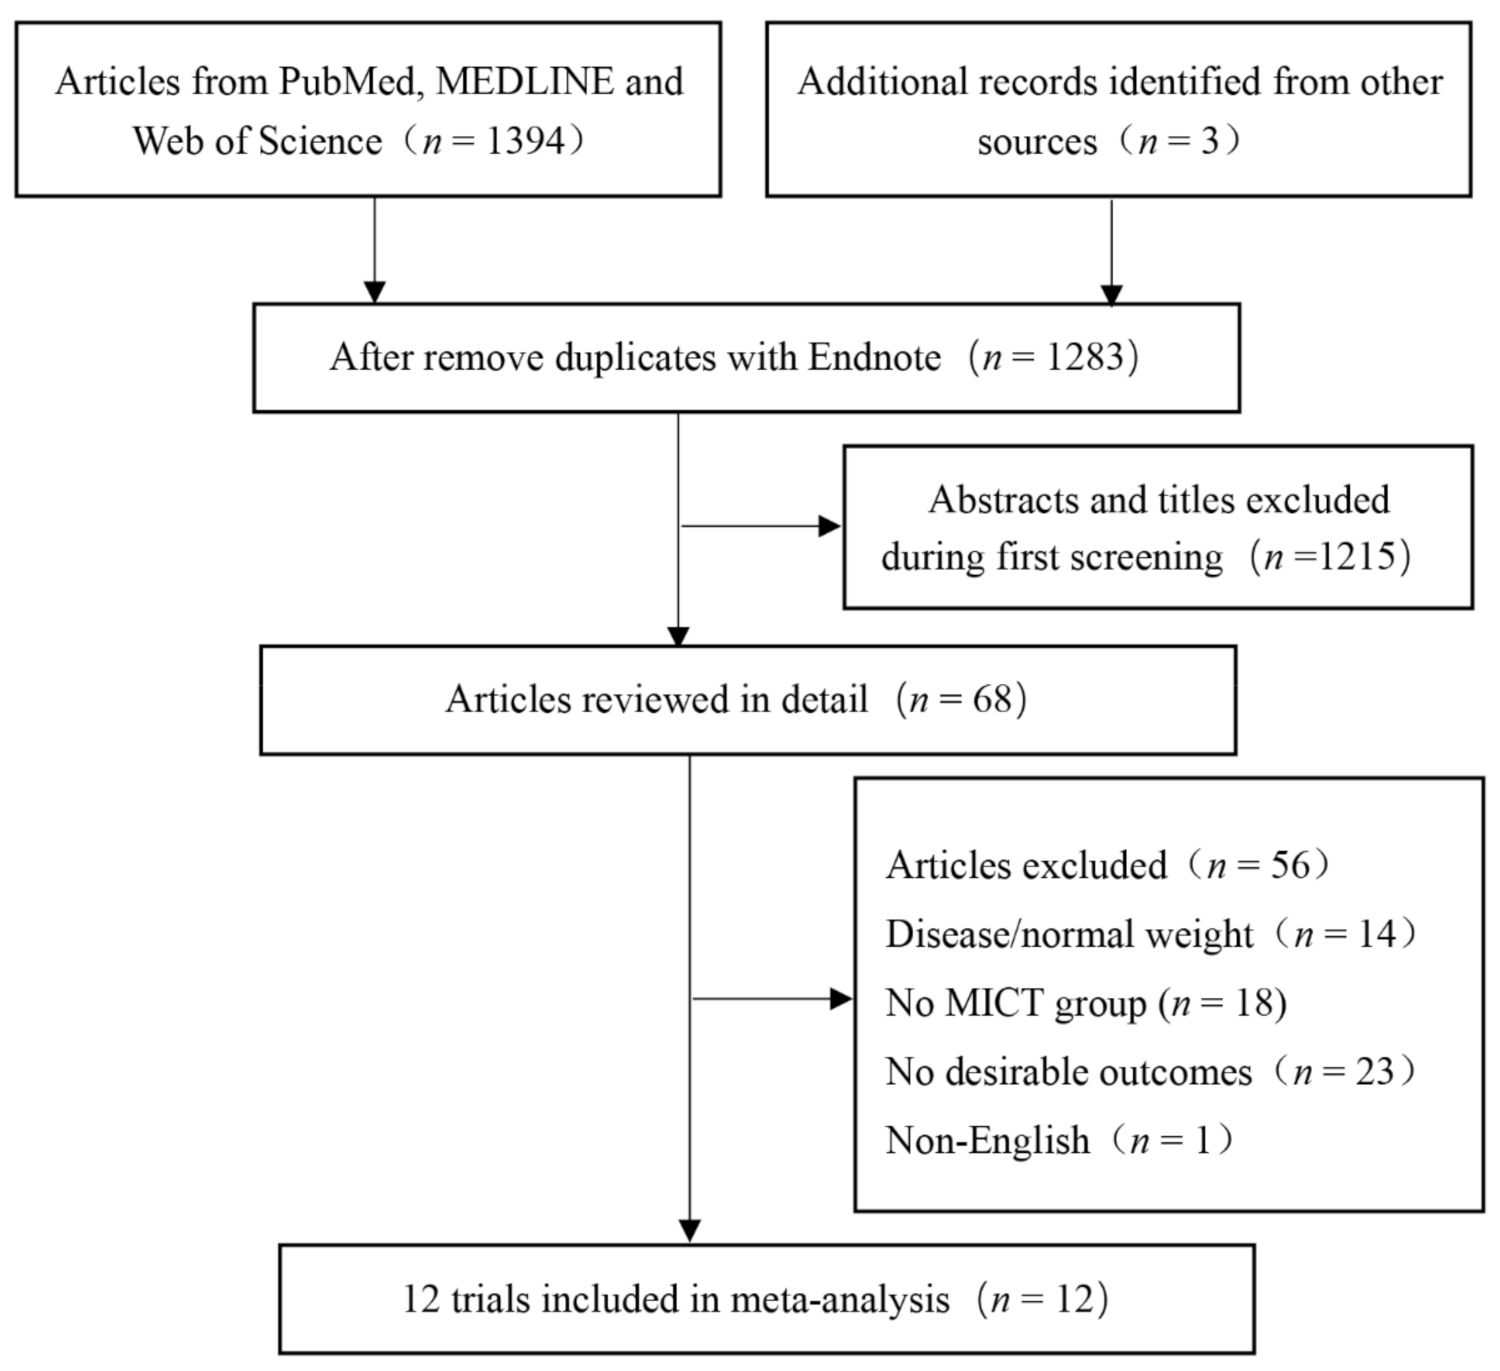
2.1. Search Strategy
2.2. Inclusion Criteria
2.3. Data Synthesis
2.4. Risk of Bias
2.5. Publication Bias
2.6. Statistical Analysis
3. Results
3.1. Included Studies
3.2. Results
3.3. Body Composition
3.3.1. Body Mass (BM)
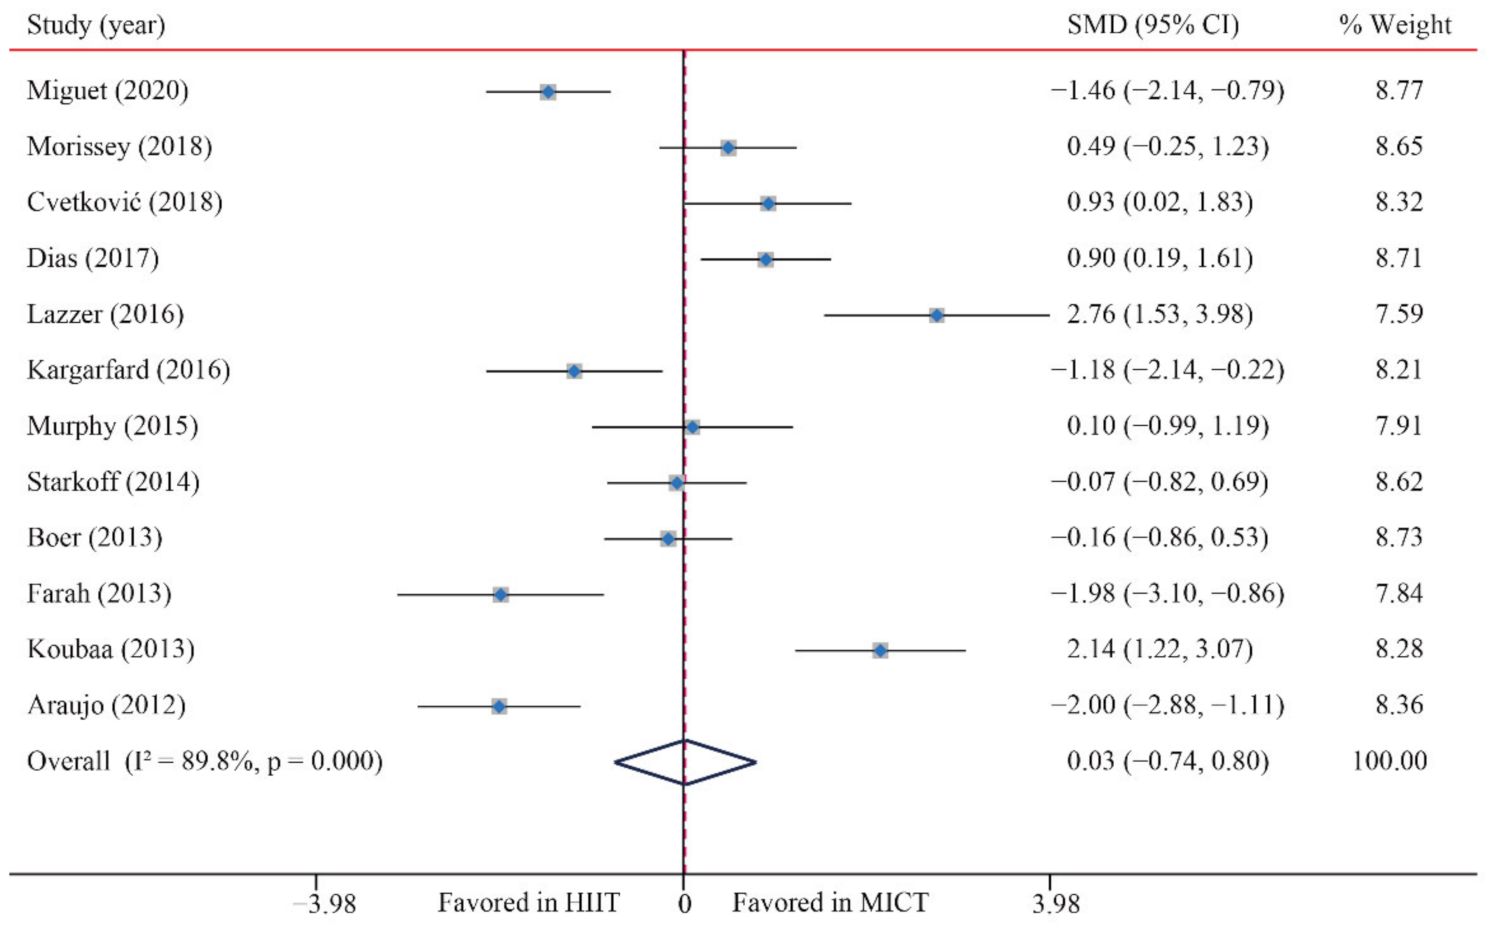
3.3.2. Body Mass Index (BMI)
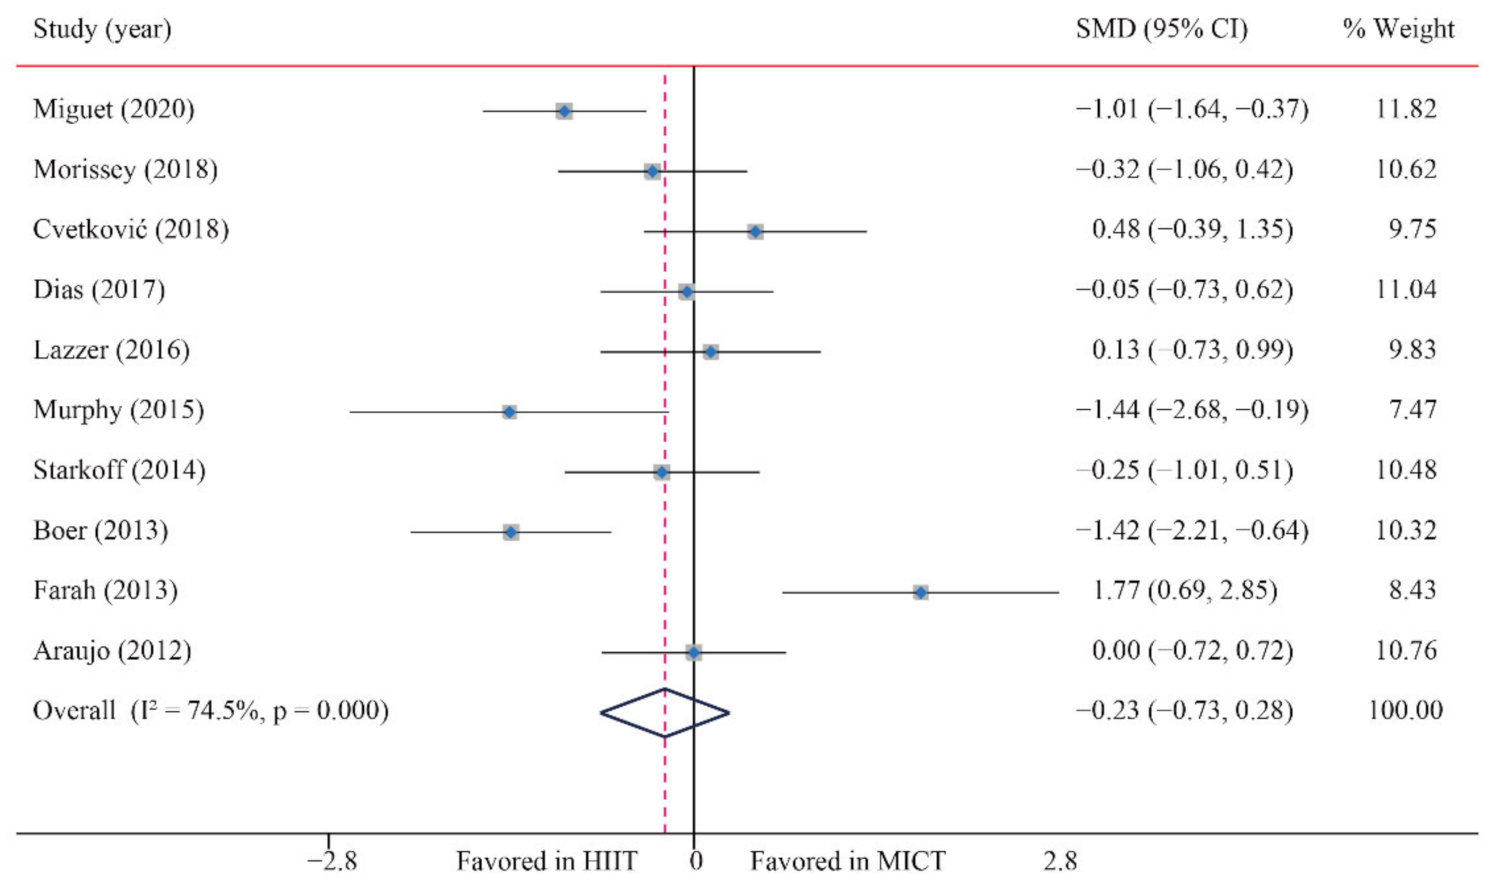
3.3.3. Body fat percentage (BF%)
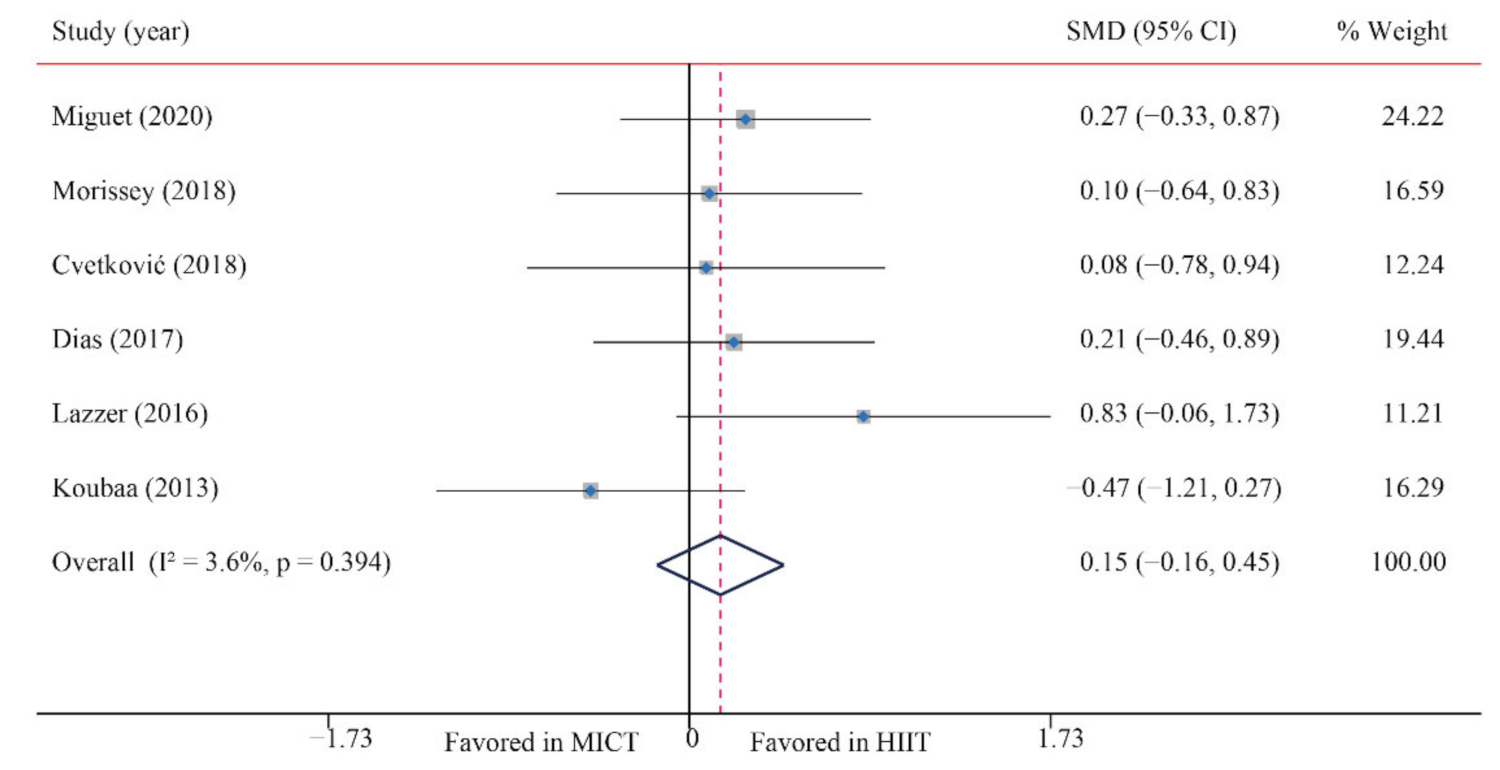
3.3.4. Fat-Free Mass (FFM)
3.3.5. Abdominal Fat (AF)
3.4. Cardiorespiratory Fitness (CRF)
3.5. Blood Pressure
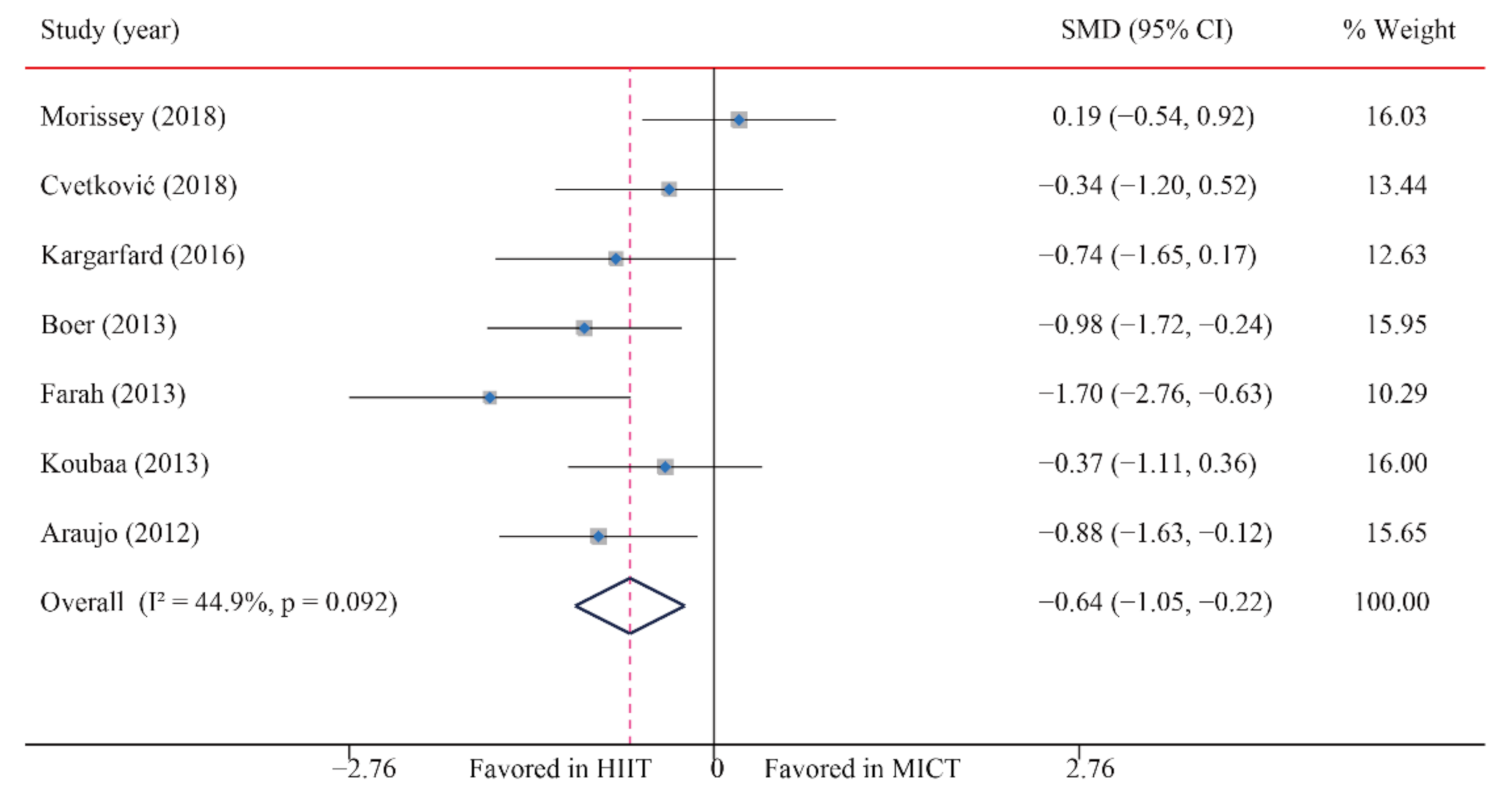
3.5.1. Systolic Blood Pressure (SBP)
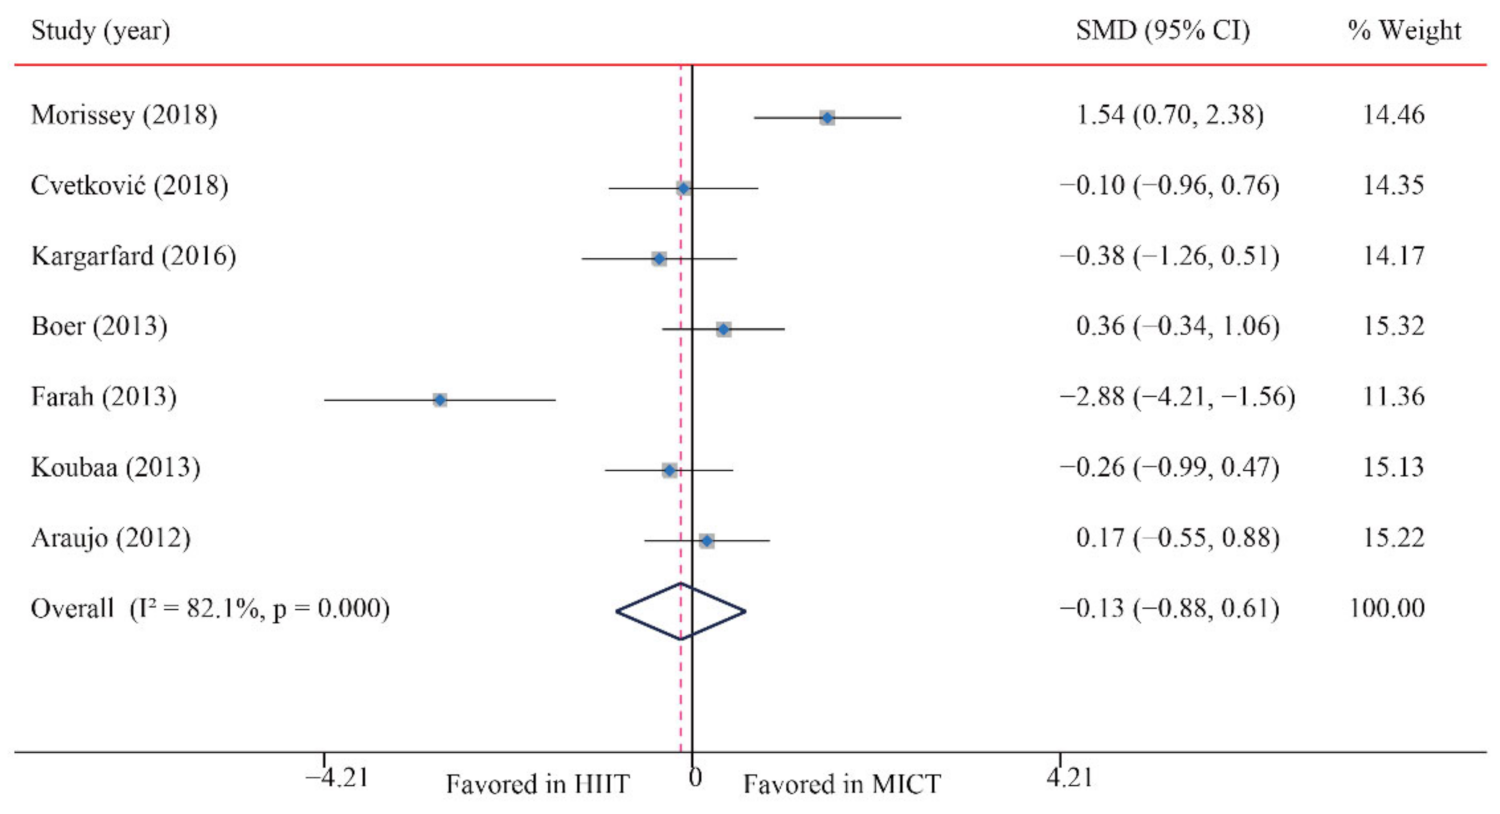
3.5.2. Diastolic Blood Pressure (DBP)
3.6. Lipid Metabolism Markers
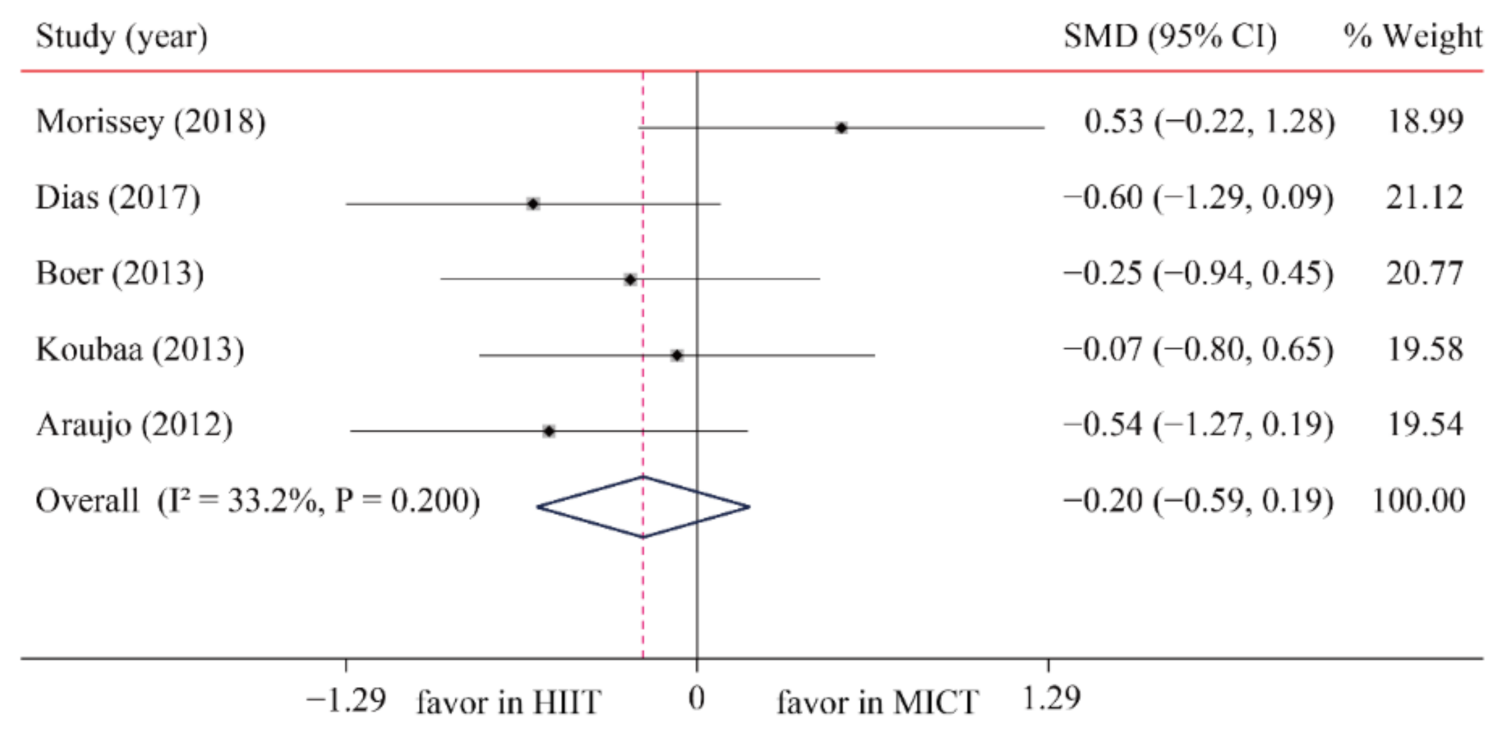
3.6.1. Triglycerides (TG)
3.6.2. Total Cholesterol (TC)
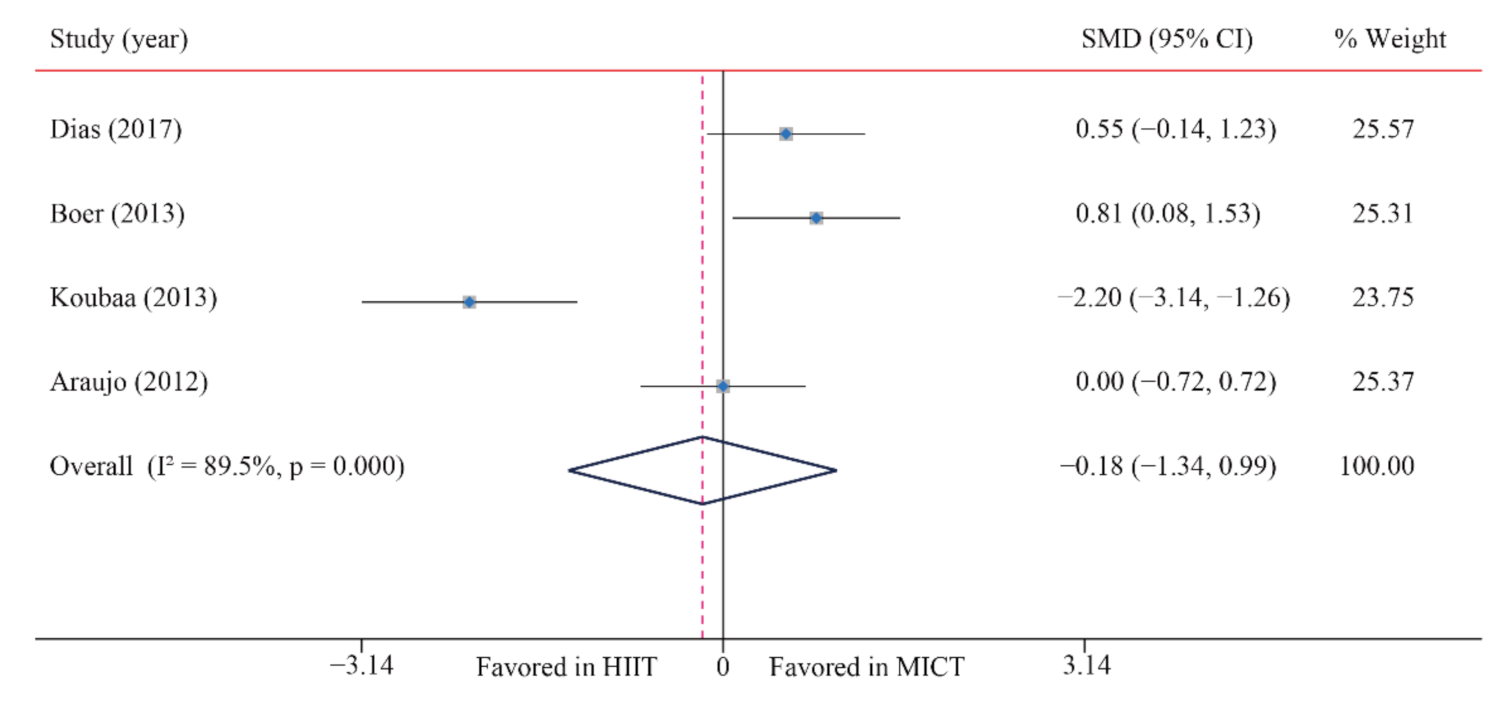
3.6.3. High-Density Lipoprotein-Cholesterol (HDL-C)
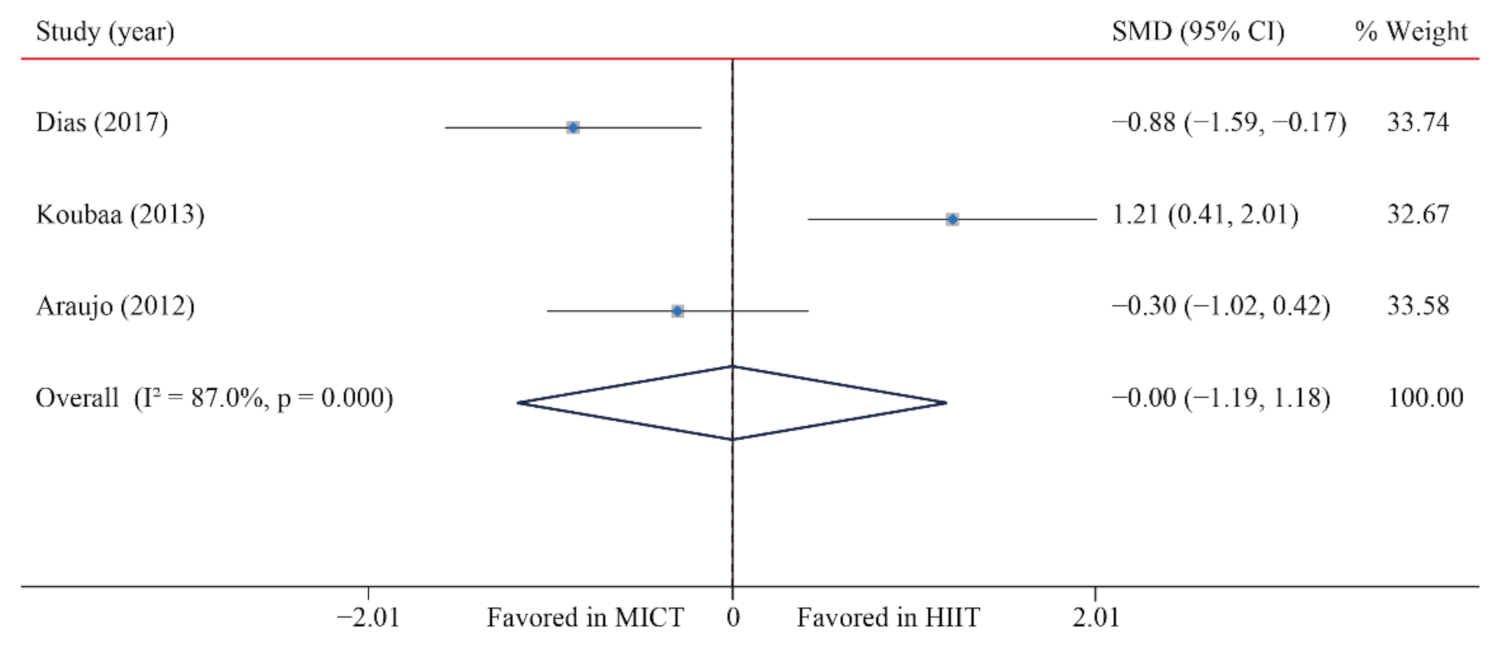
3.6.4. Low-Density Lipoprotein Cholesterol (LDL-C)
3.7. Glucose Metabolism Markers
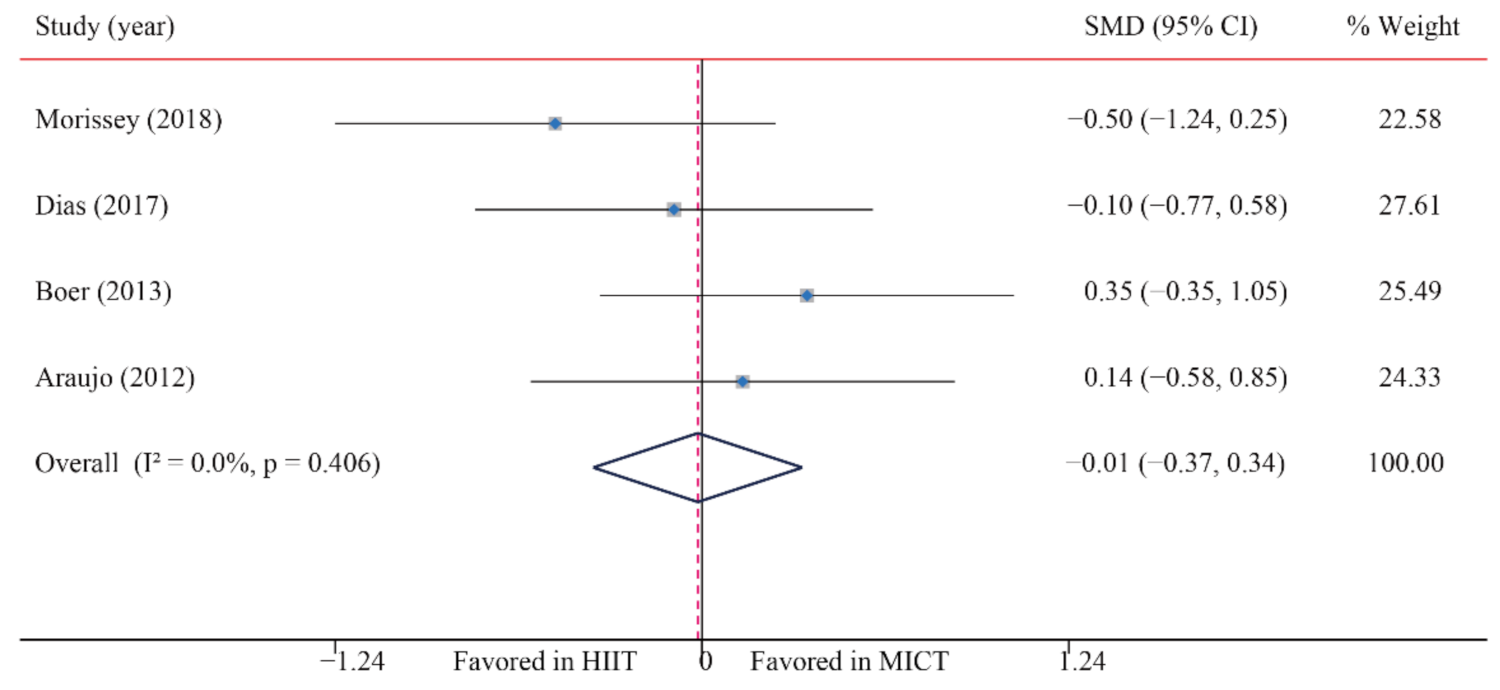
3.7.1. Blood Glucose (BG)
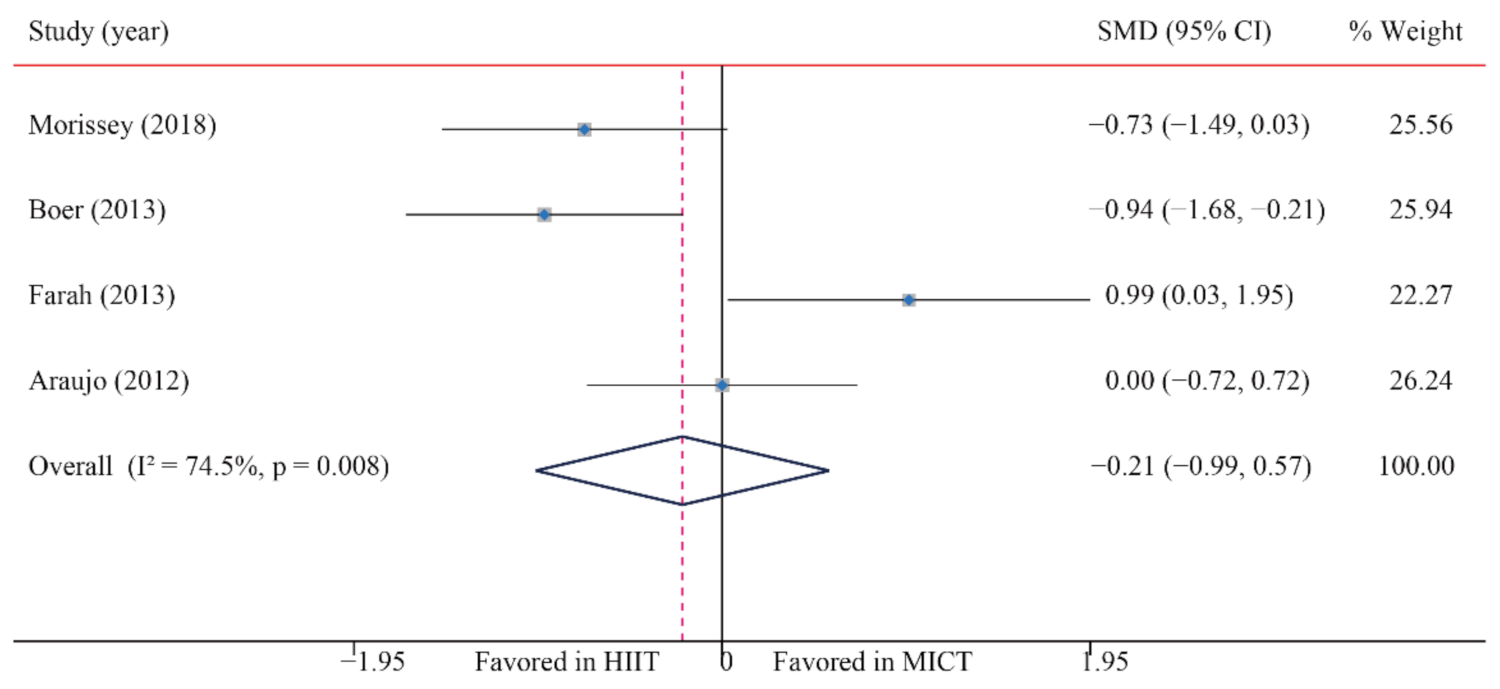
3.7.2. Blood Insulin (BI)
3.7.3. HOMA-IR
3.8. Subgroup Analysis
3.8.1. Subgroup Analysis of HIIT on Cardiorespiratory Fitness
3.8.2. Subgroup Analysis of HIIT on Systolic Blood Pressure
4. Discussion
4.1. Body Composition
4.2. Cardiorespiratory Fitness
4.3. Blood Pressure
4.4. Glycolipid Metabolism
4.5. Strengths and Limitations
5. Conclusions
Supplementary Materials
Author Contributions
Funding
Institutional Review Board Statement
Informed Consent Statement
Acknowledgments
Conflicts of Interest
References
- Skinner, A.C.; Ravanbakht, S.N.; Skelton, J.A.; Perrin, E.M.; Armstrong, S.C. Prevalence of obesity and severe obesity in US Children, 1999–2016. Pediatrics 2018, 141, e20173459. [Google Scholar] [CrossRef] [Green Version]
- US Preventive Services Task Force. Screening for obesity in children and adolescents: US Preventive Services Task Force recommendation statement. JAMA 2017, 317, 2417–2426. [CrossRef] [PubMed]
- The GBD 2015 Obesity Collaborators; Afshin, A.; Forouzanfar, M.H.; Reitsma, M.B.; Sur, P.; Estep, K.; Lee, A.; Marczak, L.; Mokdad, A.H.; Moradi-Lakeh, M.; et al. Health effects of overweight and obesity in 195 countries over 25 years. N. Engl. J. Med. 2017, 377, 13–27. [Google Scholar]
- Cole, T.J.; Lobstein, T. Extended international (IOTF) body mass index cut-offs for thinness, overweight and obesity. Pediatric Obes. 2012, 7, 284–294. [Google Scholar] [CrossRef]
- Bull, F.C.; Al-Ansari, S.S.; Biddle, S.; Borodulin, K.; Buman, M.P.; Cardon, G.; Carty, C.; Chaput, J.-P.; Chastin, S.; Chou, R.; et al. World health organization 2020 guidelines on physical activity and sedentary behaviour. Br. J. Sports Med. 2020, 54, 1451–1462. [Google Scholar] [CrossRef]
- Hallal, P.C.; Andersen, L.B.; Bull, F.C.; Guthold, R.; Haskell, W.; Ekelund, U. Lancet Physical Activity Series Working G: Global physical activity levels: Surveillance progress, pitfalls, and prospects. Lancet 2012, 380, 247–257. [Google Scholar] [CrossRef]
- Kumar, S.; Kelly, A.S. Review of childhood obesity: From epidemiology, etiology, and comorbidities to clinical assessment and treatment. Mayo Clin. Proc. 2017, 92, 251–265. [Google Scholar] [CrossRef] [PubMed] [Green Version]
- Reichert, F.F.; Barros, A.J.; Domingues, M.R.; Hallal, P.C. The role of perceived personal barriers to engagement in leisure-time physical activity. Am. J. Public Health 2007, 97, 515–519. [Google Scholar] [CrossRef]
- Bailey, R.C.; Olson, J.; Pepper, S.L.; Porszasz, J.; Barstow, T.J.; Cooper, D.M. The level and tempo of children’s physical activities: An observational study. Med. Sci. Sports Exerc. 1995, 27, 1033–1041. [Google Scholar] [CrossRef] [Green Version]
- Martin-Smith, R.; Cox, A.; Buchan, D.S.; Baker, J.S.; Grace, F.; Sculthorpe, N. High Intensity Interval Training (HIIT) Improves Cardiorespiratory Fitness (CRF) in healthy, overweight and obese adolescents: A systematic review and meta-analysis of controlled studies. Int. J. Environ. Res. Public Health 2020, 17, 2955. [Google Scholar] [CrossRef] [PubMed]
- Delgado-Floody, P.; Latorre-Roman, P.; Jerez-Mayorga, D.; Caamano-Navarrete, F.; Garcia-Pinillos, F. Feasibility of incorporating high-intensity interval training into physical education programs to improve body composition and cardiorespiratory capacity of overweight and obese children: A systematic review. J. Exerc. Sci. Fit. 2019, 17, 35–40. [Google Scholar] [CrossRef]
- Costigan, S.A.; Eather, N.; Plotnikoff, R.C.; Taaffe, D.R.; Lubans, D.R. High-intensity interval training for improving health-related fitness in adolescents: A systematic review and meta-analysis. Br. J. Sports Med. 2015, 49, 1253–1261. [Google Scholar] [CrossRef]
- Tjønna, A.E.; Stølen, T.O.; Bye, A.; Volden, M.; Slørdahl, S.A.; Ødegård, R.; Skogvoll, E.; Wisløff, U. Aerobic interval training reduces cardiovascular risk factors more than a multitreatment approach in overweight adolescents. Clin. Sci. 2009, 116, 317–326. [Google Scholar] [CrossRef] [PubMed] [Green Version]
- Racil, G.; Coquart, J.B.; Elmontassar, W.; Haddad, M.; Goebel, R.; Chaouachi, A.; Amri, M.; Chamari, K. Greater effects of high-compared with moderate-intensity interval training on cardio-metabolic variables, blood leptin concentration and ratings of perceived exertion in obese adolescent females. Biol. Sport 2016, 33, 145–152. [Google Scholar] [CrossRef]
- Da Silva, M.R.; Waclawovsky, G.; Perin, L.; Camboim, I.; Eibel, B.; Lehnen, A.M. Effects of high-intensity interval training on endothelial function, lipid profile, body composition and physical fitness in normal-weight and overweight-obese adolescents: A clinical trial. Physiol. Behav. 2020, 213, 112728. [Google Scholar] [CrossRef] [PubMed]
- Miguet, M.; Fearnbach, N.S.; Metz, L.; Khammassi, M.; Julian, V.; Cardenoux, C.; Pereira, B.; Boirie, Y.; Duclos, M.; Thivel, D. Effect of HIIT versus MICT on body composition and energy intake in dietary restrained and unrestrained adolescents with obesity. Appl. Physiol. Nutr. Metab. 2020, 45, 437–445. [Google Scholar] [CrossRef]
- Morrissey, C.; Montero, D.; Raverdy, C.; Masson, D.; Amiot, M.J.; Vinet, A. Effects of exercise intensity on microvascular function in obese adolescents. Int. J. Sports Med. 2018, 39, 450–455. [Google Scholar] [CrossRef]
- Dias, K.A.; Ingul, C.B.; Tjønna, A.E.; Keating, S.E.; Gomersall, S.R.; Follestad, T.; Hosseini, M.S.; Hollekim-Strand, S.M.; Ro, T.B.; Haram, M. Effect of high-intensity interval training on fitness, fat mass and cardiometabolic biomarkers in children with obesity: A randomised controlled trial. Sports Med. 2017, 48, 733–746. [Google Scholar] [CrossRef]
- Kargarfard, M.; Lam, E.T.; Shariat, A.; Asle Mohammadi, M.; Afrasiabi, S.; Shaw, I.; Shaw, B.S. Effects of endurance and high intensity training on ICAM-1 and VCAM-1 levels and arterial pressure in obese and normal weight adolescents. Phys. Sportsmed. 2016, 44, 208–216. [Google Scholar] [CrossRef]
- Cvetković, N.; Stojanovic, E.; Stojiljkovic, N.; Nikolic, D.; Scanlan, A.T.; Milanovic, Z. Exercise training in overweight and obese children: Recreational football and high-intensity interval training provide similar benefits to physical fitness. Scand. J. Med. Sci. Sports 2018, 28 (Suppl. 1), 1),18–32. [Google Scholar] [CrossRef] [PubMed]
- Liberati, A.; Altman, D.G.; Tetzlaff, J.; Mulrow, C.; Gøtzsche, P.C.; Ioannidis, J.P.; Clarke, M.; Devereaux, P.J.; Kleijnen, J.; Moher, D. The PRISMA statement for reporting systematic reviews and meta-analyses of studies that evaluate healthcare interventions: Explanation and elaboration. BMJ 2009, 6, e1–e34. [Google Scholar] [CrossRef] [Green Version]
- Gibala, M.J.; Mcgee, S.L. Metabolic adaptations to short-term high-intensity interval training: A little pain for a lot of gain? Exerc. Sport Sci. Rev. 2008, 36, 58–63. [Google Scholar] [CrossRef]
- Weston, K.S.; Wisloff, U.; Coombes, J.S. High-intensity interval training in patients with lifestyle-induced cardiometabolic disease: A systematic review and meta-analysis. Br. J. Sports Med. 2014, 48, 1227–1234. [Google Scholar] [CrossRef] [PubMed]
- Baker, D. Recent trends in high-intensity aerobic training for field sports. Prof. Strength Cond. 2011, 22, 3–8. [Google Scholar]
- Egger, M.; Smith, G.D.; Schneider, M.; Minder, C. Bias in meta-analysis detected by a simple, graphical test. BMJ 1997, 315, 629–634. [Google Scholar] [CrossRef] [PubMed] [Green Version]
- Duval, S.; Tweedie, R. Trim and fill: A simple funnel-plot-based method of testing and adjusting for publication bias in meta-analysis. Biometrics 2000, 56, 455–463. [Google Scholar] [CrossRef] [PubMed]
- Lazzer, S.; Tringali, G.; Caccavale, M.; De, M.R.; Abbruzzese, L.; Sartorio, A. Effects of high-intensity interval training on physical capacities and substrate oxidation rate in obese adolescents. J. Endocrinol. Investig. 2016, 40, 217–226. [Google Scholar] [CrossRef]
- Murphy, A.; Kist, C.; Gier, A.J.; Edwards, N.M.; Gao, Z.; Siegel, R.M. The feasibility of high-intensity interval exercise in obese adolescents. Clin. Pediatrics 2015, 54, 87–90. [Google Scholar] [CrossRef] [Green Version]
- Starkoff, B.E.; Eneli, I.U.; Bonny, A.E.; Hoffman, R.P.; Devor, S.T. Estimated aerobic capacity changes in adolescents with obesity following high intensity interval exercise. Int. J. Kinesiol. Sports Sci. 2014, 2, 2202–2946. [Google Scholar]
- Farah, B.Q.; Ritti-Dias, R.M.; Balagopal, P.B.; Hill, J.O.; Prado, W.L. Does exercise intensity affect blood pressure and heart rate in obese adolescents? A 6-month multidisciplinary randomized intervention study. Pediatr. Obes. 2014, 9, 111–120. [Google Scholar] [CrossRef]
- Boer, P.H.; Meeus, M.; Terblanche, E.; Rombaut, L.; Wandele, I.D.; Hermans, L.; Gysel, T.; Ruige, J.; Calders, P. The influence of sprint interval training on body composition, physical and metabolic fitness in adolescents and young adults with intellectual disability: A randomized controlled trial. Clin. Rehabil. 2014, 28, 221–231. [Google Scholar] [CrossRef] [PubMed]
- Koubaa, A. Effect of intermittent and continuous training on body composition cardiorespiratory fitness and lipid profile in obese adolescents. IOSR 2013, 3, 31–37. [Google Scholar] [CrossRef]
- Ac, C.D.A.; Roschel, H.; Picanço, A.R.; do Prado, D.M.; Villares, S.M.; Al, D.S.P.; Gualano, B. Similar health benefits of endurance and high-intensity interval training in obese children. PLoS ONE 2012, 7, e42747. [Google Scholar]
- Batacan, R.B., Jr.; Duncan, M.J.; Dalbo, V.J.; Tucker, P.S.; Fenning, A.S. Effects of high-intensity interval training on cardiometabolic health: A systematic review and meta-analysis of intervention studies. Br. J. Sports Med. 2017, 51, 494–503. [Google Scholar] [CrossRef]
- Wewege, M.; van den Berg, R.; Ward, R.E.; Keech, A. The effects of high-intensity interval training vs. moderate-intensity continuous training on body composition in overweight and obese adults: A systematic review and meta-analysis. Obes. Rev. 2017, 18, 635–646. [Google Scholar] [CrossRef]
- Laforgia, J.; Withers, R.T.; Gore, C.J. Effects of exercise intensity and duration on the excess post-exercise oxygen consumption. J. Sports Sci. 2006, 24, 1247–1264. [Google Scholar] [CrossRef]
- Boutcher, S.H. High-intensity intermittent exercise and fat loss. J. Obes. 2011, 2011, 868305. [Google Scholar] [CrossRef] [Green Version]
- Raghuveer, G.; Hartz, J.; Lubans, D.R.; Takken, T.; Wiltz, J.L.; Mietus-Snyder, M.; Perak, A.M.; Baker-Smith, C.; Pietris, N.; Edwards, N.M.; et al. Cardiorespiratory fitness in youth: An important marker of health: A scientific statement from the American heart association. Circulation 2020, 142, e101–e118. [Google Scholar] [CrossRef]
- Cao, M.; Quan, M.; Zhuang, J. Effect of high-intensity interval training versus moderate-intensity continuous training on cardiorespiratory fitness in children and adolescents: A meta-analysis. Int. J. Environ. Res. Public Health 2019, 16, 1533. [Google Scholar] [CrossRef] [Green Version]
- Suriano, K.; Curran, J.; Byrne, S.M.; Jones, T.W.; Davis, E.A. Fatness, fitness, and increased cardiovascular risk in young children. J. Pediatrics 2010, 157, 552–558. [Google Scholar] [CrossRef]
- Helgerud, J.; Høydal, K.; Wang, E.; Karlsen, T.; Berg, P.; Bjerkaas, M.; Simonsen, T.; Helgesen, C.; Hjorth, N.; Bach, R.; et al. Aerobic high-intensity intervals improve VO2max more than moderate training. Med. Sci. Sports Exerc. 2007, 39, 665–671. [Google Scholar] [CrossRef] [PubMed] [Green Version]
- Slørdahl, S.A.; Wang, E.; Hoff, J.; Kemi, O.J.; Amundsen, B.H.; Helgerud, J. Effective training for patients with intermittent claudication. Scand. Cardiovasc. J. 2005, 39, 244–249. [Google Scholar] [CrossRef] [PubMed]
- Gibala, M.; Bonen, A. Molecular responses to high-intensity interval exercise. Appl. Physiol. Nutr. Metab. 2009, 34, 428–432. [Google Scholar] [CrossRef]
- Daussin, F.N.; Zoll, J.; Dufour, S.P.; Ponsot, E.; Lonsdorfer-Wolf, E.; Doutreleau, S.; Mettauer, B.; Piquard, F.; Geny, B.; Richard, R. Effect of interval versus continuous training on cardiorespiratory and mitochondrial functions: Relationship to aerobic performance improvements in sedentary subjects. Am. J. Physiol. Regul. Integr. Comp. Physiol. 2008, 295, R264–R272. [Google Scholar] [CrossRef] [PubMed] [Green Version]
- Juhola, J.; Oikonen, M.; Magnussen, C.G.; Mikkila, V.; Siitonen, N.; Jokinen, E.; Laitinen, T.; Wurtz, P.; Gidding, S.S.; Taittonen, L.; et al. Childhood physical, environmental, and genetic predictors of adult hypertension: The cardiovascular risk in young Finns study. Circulation 2012, 126, 402–409. [Google Scholar] [CrossRef] [PubMed] [Green Version]
- Chen, X.; Wang, Y. Tracking of blood pressure from childhood to adulthood: A systematic review and meta-regression analysis. Circulation 2008, 117, 3171–3180. [Google Scholar] [CrossRef] [Green Version]
- Yan, Y.; Liu, J.; Wang, L.; Hou, D.; Zhao, X.; Cheng, H.; Mi, J. Independent influences of excessive body weight and elevated blood pressure from childhood on left ventricular geometric remodeling in adulthood. Int. J. Cardiol. 2017, 243, 492–496. [Google Scholar] [CrossRef]
- Dong, Y.; Ma, J.; Song, Y.; Ma, Y.; Dong, B.; Zou, Z.; Prochaska, J.J. Secular trends in blood pressure and overweight and obesity in chinese boys and girls aged 7 to 17 years from 1995 to 2014. Hypertension 2018, 72, 298–305. [Google Scholar] [CrossRef] [Green Version]
- Costa, E.C.; Hay, J.L.; Kehler, D.S.; Boreskie, K.F.; Arora, R.C.; Umpierre, D.; Szwajcer, A.; Duhamel, T.A. Effects of high-intensity interval training versus moderate-intensity continuous training on blood pressure in adults with pre- to established hypertension: A systematic review and meta-analysis of randomized trials. Sports Med. 2018, 48, 2127–2142. [Google Scholar] [CrossRef]
- Lacey, B.; Lewington, S.; Clarke, R.; Kong, X.L.; Chen, Y.; Guo, Y.; Yang, L.; Bennett, D.; Bragg, F.; Bian, Z.; et al. Age-specific association between blood pressure and vascular and non-vascular chronic diseases in 0.5 million adults in China: A prospective cohort study. Lancet Glob. Health 2018, 6, e641–e649. [Google Scholar] [CrossRef]
- Pal, S.; Radavelli-Bagatini, S.; Ho, S. Potential benefits of exercise on blood pressure and vascular function. J. Am. Soc. Hypertens. 2013, 7, 494–506. [Google Scholar] [CrossRef] [Green Version]
- Nishida, K.; Harrison, D.G.; Navas, J.P.; Fisher, A.A.; Dockery, S.P.; Uematsu, M.; Nerem, R.M.; Alexander, R.W.; Murphy, T.J. Molecular cloning and characterization of the constitutive bovine aortic endothelial cell nitric oxide synthase. J. Clin. Investig. 1992, 90, 2092–2096. [Google Scholar] [CrossRef] [PubMed] [Green Version]
- Cornelissen, V.A.; Smart, N.A. Effects of endurance training on blood pressure, blood pressure-regulating mechanisms, and cardiovascular risk factors. J. Am. Heart Assoc. 2013, 2, e004473. [Google Scholar] [CrossRef] [PubMed] [Green Version]
- De Lima, J.B.; da Silveira, A.D.; Saffi, M.A.L.; Menezes, M.G.; Piardi, D.S.; Ramm, L.D.C.R.; Zanini, M.; Stein, R.M.N. Vasodilation and reduction of systolic blood pressure after one session of high-intensity interval training in patients with heart failure with preserved ejection fraction. Arq. Bras. Cardiol. 2018, 111, 699–707. [Google Scholar]
- Gepstein, V.; Weiss, R. Obesity as the Main Risk Factor for Metabolic Syndrome in Children. Front. Endocrinol. 2019, 10, 568. [Google Scholar] [CrossRef]
- Cockcroft, E.J.; Williams, C.A.; Jackman, S.R.; Bassi, S.; Armstrong, N.; Barker, A.R. A single bout of high-intensity interval exercise and work-matched moderate-intensity exercise has minimal effect on glucose tolerance and insulin sensitivity in 7- to 10-year-old boys. J. Sports Sci. 2017, 36, 149–155. [Google Scholar] [CrossRef]
- Pelham, J.H.; Hanks, L.; Aslibekyan, S.; Dowla, S.; Ashraf, A.P. Higher hemoglobin A1C and atherogenic lipoprotein profiles in children and adolescents with type 2 diabetes mellitus. J. Clin. Transl. Endocrinol. 2019, 15, 30–34. [Google Scholar] [CrossRef]
- Gibala, M.J.; Mcgee, S.L.; Garnham, A.P.; Howlett, K.F.; Snow, R.J.; Hargreaves, M. Brief intense interval exercise activates AMPK and p38 MAPK signaling and increases the expression of PGC-1alpha in human skeletal muscle. J. Appl. Physiol. 2009, 106, 929–934. [Google Scholar] [CrossRef] [Green Version]
- Richter, E.A. Is GLUT4 translocation the answer to exercise-stimulated muscle glucose uptake? Am. J. Physiol. Endocrinol. Metab. 2021, 320, E240–E243. [Google Scholar] [CrossRef]
- Ferreira, G.D.S.; Bochi, A.P.G.; Pinto, P.R.; Del Bianco, V.; Rodrigues, L.G.; Morais, M.R.P.T.; Nakandakare, E.R.; Machado, U.F.; Catanozi, S.; Passarelli, M. Aerobic Exercise Training Prevents Insulin Resistance and Hepatic Lipid Accumulation in LDL Receptor Knockout Mice Chronically Fed a Low-Sodium Diet. Nutrients 2021, 13, 2174. [Google Scholar] [CrossRef]


| Study | Subjects’ Characteristic | Training Information | Outcomes | |||||||
|---|---|---|---|---|---|---|---|---|---|---|
| Status | Age (Years) | n | Gender (M/F) | Group | Training Modality, Setting and Protocol | Time (Min/Session) | Frequency (Times/Week) | Duration (Weeks) | ||
| Miguet et al. [16] France, 2020 | OW | 13.6 ± 1.5 | 22 | NR | HIIT | Bicycle (lab) 15 × [30 s (90% VO2max): 30 s (50 w)] | 15 | 2 | 16 | ① |
| 13.6 ± 1.5 | 21 | NR | MICT | Bicycle (lab) 45 min (70% VO2max) | 45 | |||||
| Morissey et al. [17] France, 2018 | OW | 15.0 ± 1.4 | 16 | 4/12 | HIIT | Mix (lab) 4–6 × [120–150 s (90–95% HRmax): 90 s (55% HRmax)] | 14–24 | 3 | 12 | ①③④⑤ |
| 15.0 ± 1.6 | 13 | 4/9 | MICT | Mix (lab) 40–60 min (65–70% HRmax) | 40–60 | |||||
| Cvetković et al. [20] Serbia, 2018 | OW/OB | 11–13 | 11 | 11/0 | HIIT | Run (school) 3 × 5–10 × [10–20 s (100% MAS): 10–20 s (0)]: 3 min (0) | 11–26 | 3 | 12 | ①②③ |
| 11–13 | 10 | 10/0 | MICT | Football (school) 60 min (NR) | 60 | |||||
| Dias et al. [18] Australia, 2017 | OB | 7–16 | 17 | NR | HIIT | Treadmill (lab) 4 × [4 min (85–95% HRmax): 3 min (50–70% HRmax)] | 28 | 3 | 12 | ①②④⑤ |
| 7–16 | 24 | NR | MICT | Treadmill (lab) 44 min (60–70% HRmax) | 44 | |||||
| Lazzer et al. [27] Italy, 2016 | OB | 16.8 ± 0.7 | 10 | 10/0 | HIIT | Treadmill (lab) 6 × [40 s (100% VO2max): 5 min (40% VO2max)] | 34 | 3 | 3 | ①② |
| 16.4 ± 1.1 | 11 | 11/0 | MICT | Treadmill (lab) 45 min × (70% VO2max) | 45 | |||||
| Kargarfard et al. [19] Iran, 2016 | OB | 12.4 ± 1.3 | 10 | 10/0 | HIIT | Treadmill (lab) 8 × [4 min (80–90% HRR): 2 min (40–50% HRR)] | 48 | 3 | 8 | ①②③ |
| 12.4 ± 1.3 | 10 | 10/0 | MICT | Treadmill (lab) 45 min (60–70% HRR) | 45 | |||||
| Murphy et al. [28] USA, 2015 | OB | 13.7 ± 2.0 | 7 | 2/5 | HIIT | Treadmill (lab) 10 × [1 min (80–90% HRmax): 2 min (60% HRmax)] | 30 | 3 | 4 | ①② |
| 14.3 ± 1.2 | 6 | 5/1 | MICT | Treadmill (lab) 30 min (65% HRmax) | 30 | |||||
| Starkoff et al. [29] USA, 2014 | OB | 14.9 ± 1.6 | 14 | 5/9 | HIIT | Bicycle (lab) 10 × [2 min (90–95% HRmax): 1 min (55% HRmax)] | 30 | 3 | 6 | ①② |
| 14.5 ± 1.4 | 13 | 5/8 | MICT | Bicycle (lab) 30 min (65–70% HRmax) | 30 | |||||
| Farah et al. [30] Brazil, 2013 | OB | 15.4 ± 0.4 | 9 | 5/4 | HIIT | Treadmill (lab) NR × [30 s (120% MAS): 30 s (0)] EE 350 kcal | NR | 3 | 24 | ①②③⑤ |
| 14.8 ± 0.4 | 10 | 5/5 | MICT | Treadmill (lab) NR (80% VT) EE 350 kcal | NR | |||||
| Boer et al. [31] Belgium, 2013 | OB | 18.0 ± 3.2 | 17 | 11/6 | HIIT | Bicycle (lab) 10 × [15 s (100% VT): 45 s (50% VT)] | 10 | 2 | 15 | ①③④⑤ |
| 16.7 ± 3.6 | 15 | 10/5 | MICT | Bicycle (lab) 30 min (NR) | 30 | |||||
| Koubaa et al. [32] Tunisia, 2013 | OB | 13.0 ± 0.8 | 14 | 14/0 | HIIT | Treadmill (lab) NR × [2 min (80–90% MAS): 1 min (0)] | NA | 3 | 12 | ①②③④ |
| 12.9 ± 0.5 | 15 | 15/0 | MICT | Treadmill (lab) NR (60–70% MAS) | NA | |||||
| Araujo et al. [33] Brazil, 2012 | OB | 10.7 ± 0.7 | 15 | 5/10 | HIIT | Bicycle (lab) 3–6 × [1 min (100% MAS): 3 min (50% MAS)] | 12–24 | 3 | 12 | ①③④⑤ |
| 10.4 ± 0.9 | 15 | 4/11 | MICT | Treadmill (lab) 30–60 min (80% HRmax) | 30–60 | |||||
| Study | Assessment | Score | Risk of Bias | |||||||
|---|---|---|---|---|---|---|---|---|---|---|
| 1 | 2 | 3 | 4 | 5 | 6 | 7 | 8 | |||
| Miguet | ● | ● | ● | ○ | ○ | ● | ● | ○ | 5 | Moderate |
| Morissey | ● | ● | ● | ○ | ● | ● | ○ | ● | 6 | Moderate |
| Cvetković | ● | ● | ● | ○ | ● | ● | ○ | ● | 6 | Moderate |
| Dias | ● | ● | ● | ○ | ● | ● | ● | ● | 7 | Low |
| Lazzer | ● | ● | ● | ○ | ● | ● | ○ | ● | 6 | Moderate |
| Kargarfard | ● | ● | ● | ○ | ● | ● | ○ | ● | 6 | Moderate |
| Murphy | ● | ● | ● | ○ | ● | ● | ○ | ○ | 5 | Moderate |
| Starkoff | ● | ● | ● | ○ | ● | ● | ● | ○ | 6 | Moderate |
| Farah | ● | ● | ● | ● | ○ | ○ | ○ | ● | 5 | Moderate |
| Boer | ● | ○ | ○ | ○ | ● | ● | ○ | ○ | 3 | High |
| Koubaa | ● | ● | ○ | ○ | ○ | ● | ○ | ○ | 3 | High |
| Araujo | ● | ● | ● | ○ | ● | ● | ○ | ● | 6 | Moderate |
| Subgroup | Synthesis Studies/Total (%) | SMD (95% CI) | MICT | HIIT | I2 (%) | p-Value | p for Interaction |
|---|---|---|---|---|---|---|---|
| Total | 8/8 (100) | 0.87 (0.39, 1.35) |  | 56.8 | 0.023 | ||
| Gender | 0.903 | ||||||
| Boys | 4/8 (50) | 0.91 (0.17, 1.65) | 63.6 | 0.041 | |||
| Both | 4/8 (50) | 0.83 (0.10, 1.56) | 61.8 | 0.049 | |||
| Age | 0.472 | ||||||
| ≤13 years | 4/8 (50) | 0.69 (0.23, 1.16) | 25.6 | 0.258 | |||
| >13 years | 4/8 (50) | 1.12 (0.15, 2.09) | 73.4 | 0.010 | |||
| Modality | 0.257 | ||||||
| Running | 6/8 (75) | 1.05 (0.47, 1.64) * | 61.2 | 0.024 | |||
| Cycling | 2/8 (25) | 0.29 (−0.34, 0.92) | 0.0 | 0.370 | |||
| Duration | 0.525 | ||||||
| ≤8 weeks | 4/8 (50) | 0.68 (−0.04, 1.39) | 57.3 | 0.071 | |||
| >8 weeks | 4/8 (50) | 1.05 (0.34, 1.76) * | 63.1 | 0.043 | |||
| Time | 0.473 | ||||||
| <20 min | 2/8 (25) | 1.64 (0.79, 2.49) * | 34.2 | 0.218 | |||
| 20–30 min | 4/8 (50) | 0.47 (0.06, 0.88) * | 0.0 | 0.633 | |||
| >30 min | 2/8 (25) | 1.09 (−0.40, 2.58) | 79.0 | 0.029 | |||
| Settings | 0.375 | ||||||
| Laboratory | 6/8 (75) | 0.81 (0.34, 1.28) * | 44.0 | 0.112 | |||
| School | 2/8 (25) | 1.16 (−0.78, 3.10) | 86.1 | 0.007 | |||
| Work/rest ratio | 0.686 | ||||||
| <1 | 2/8 (25) | 0.98 (−0.81, 2.76) | 82.1 | 0.018 | |||
| =1 | 2/8 (25) | 1.16 (−0.78, 3.10) | 86.1 | 0.007 | |||
| >1 | 4/8 (50) | 0.75 (0.36, 1.14) * | 0.1 | 0.391 | |||
| Work duration | 0.296 | ||||||
| <1 min | 3/8 (38) | 1.38 (0.10, 2.66) * | 79.0 | 0.009 | |||
| 1–4 min | 2/8 (24) | 0.68 (−0.01, 1.37) | 46.4 | 0.155 | |||
| =4 min | 3/8 (38) | 0.62 (0.08, 1.17) * | 0.0 | 0.446 | |||
| Subgroup | Synthesis Studies/Total (%) | SMD (95% CI) | MICT | HIIT | I2 (%) | p-Value | p for Interaction |
|---|---|---|---|---|---|---|---|
| Total | 7/7 (100) | −0.64 (−1.05, −0.22) | 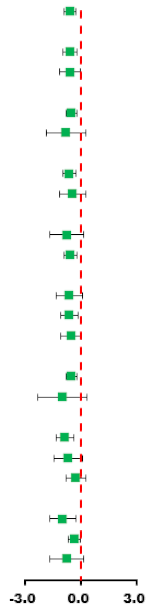 | 44.9 | 0.092 | ||
| Gender | 0.770 | ||||||
| Boys | 4/7 (51) | −0.58 (−0.98, −0.18) * | 0.0 | 0.009 | |||
| Both | 3/7 (49) | −0.78 (−1.83, 0.27) | 79.0 | 0.072 | |||
| Age | 0.770 | ||||||
| ≤13 years | 4/7 (51) | −0.58 (−0.98, −0.18) * | 0.0 | 0.722 | |||
| >13 years | 3/7 (49) | −0.78 (−1.83, 0.27) | 79.0 | 0.009 | |||
| Modality | 0.489 | ||||||
| Running | 5/7 (71) | −0.73 (−1.16, −0.31) * | 20.2 | 0.286 | |||
| Cycling | 2/7 (29) | −0.40 (−1.54, 0.75) | 79.5 | 0.027 | |||
| Duration | 0.876 | ||||||
| ≤8 weeks | 1/7 (14) | −0.74 (−1.65, 0.17) | - | - | |||
| >8 weeks | 6/7 (86) | −0.63 (−1.11, −0.15) * | 53.7 | 0.056 | |||
| Time | 0.794 | ||||||
| <20 min | 4/7 (71) | −0.66 (−1.38, 0.07) | 69.7 | 0.019 | |||
| 20–30 min | 1/7 (14) | −0.34 (−1.20, 0.52) | - | - | |||
| >30 min | 2/7 (25) | −0.82 (−1.40, −0.24) * | 44.9 | 0.092 | |||
| Settings | 0.493 | ||||||
| Laboratory | 5/7 (71) | −0.54 (−0.98, −0.11) * | 36.9 | 0.175 | |||
| School | 2/7 (29) | −0.98 (−2.31, 0.35) | 73.4 | 0.052 | |||
| Work/rest ratio | 0.169 | ||||||
| <1 | 2/7 (29) | −0.93 (−1.46, −0.40) * | 0.0 | 0.843 | |||
| =1 | 2/7 (29) | −0.98 (−2.31, 0.35) | 73.4 | 0.052 | |||
| >1 | 3/7 (42) | −0.26 (−0.78, 0.26) | 23.4 | 0.271 | |||
| Work duration | 0.493 | ||||||
| <1 min | 3/7 (43) | −0.96 (−1.65, −0.26) * | 47.5 | 0.149 | |||
| 1–4 min | 3/7 (43) | −0.35 (−0.95, 0.25) | 49.4 | 0.138 | |||
| =4 min | 1/7 (14) | −0.74 (−1.65, 0.17) | - | - | |||
| Outcomes | Studies/Total (%) | N | SMD (95% CI) | Favored HIIT | Favored MICT | I2 | Q | p-Value |
|---|---|---|---|---|---|---|---|---|
| Total | 12/12 (100) | 325 | 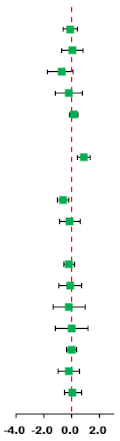 | |||||
| Body composition | ||||||||
| BM | 11/12 (92) | 313 | −0.10 (−0.61, 0.41) | 78.4 | 46.3 | 0.001 | ||
| BMI | 12/12 (100) | 325 | 0.03 (−0.75, 0.80) | 89.8 | 107.3 | 0.001 | ||
| BF% | 10/12 (83) | 277 | −0.23 (−0.73, 0.28) | 74.5 | 35.3 | 0.001 | ||
| AF | 6/12 (50) | 178 | −0.21 (−1.19, 0.76) | 88.3 | 42.8 | 0.001 | ||
| FFM | 6/12 (50) | 184 | 0.15 (−0.16, 0.45) | 3.6 | 5.2 | 0.394 | ||
| Cardiorespiratory fitness | ||||||||
| VO2max | 8/12 (67) | 191 | 0.87 (0.39, 1.35) * | 56.8 | 16.2 | 0.023 | ||
| Blood pressure | ||||||||
| SBP | 7/12 (58) | 180 | −0.64 (−1.05, −0.22) * | 44.9 | 10.9 | 0.092 | ||
| DBP | 7/12 (58) | 180 | −0.13 (−0.88, 0.61) | 82.1 | 33.6 | 0.001 | ||
| Glycolipid metabolism | ||||||||
| TG | 5/12 (42) | 161 | −0.20 (−0.59, 0.19) | 33.2 | 6.0 | 0.200 | ||
| TC | 5/12 (42) | 161 | −0.11 (−0.94, 0.72) | 83.9 | 24.8 | 0.001 | ||
| HDL-C | 4/12 (33) | 125 | −0.18 (−1.34, 0.99) | 89.5 | 28.5 | 0.001 | ||
| LDL-C | 3/12 (25) | 101 | −0.01 (−1.19, 1.18) | 87.0 | 15.4 | 0.001 | ||
| BG | 4/12 (33) | 125 | −0.02 (−0.37, 0.34) | 0 | 2.9 | 0.406 | ||
| BI | 4/12 (33) | 125 | −0.21 (−0.99, 0.57) | 74.5 | 11.8 | 0.008 | ||
| HOMA-IR | 4/12 (33) | 132 | 0.08 (−0.54, 0.70) | 70.1 | 13.4 | 0.010 | ||
Publisher’s Note: MDPI stays neutral with regard to jurisdictional claims in published maps and institutional affiliations. |
© 2021 by the authors. Licensee MDPI, Basel, Switzerland. This article is an open access article distributed under the terms and conditions of the Creative Commons Attribution (CC BY) license (https://creativecommons.org/licenses/by/4.0/).
Share and Cite
Cao, M.; Tang, Y.; Li, S.; Zou, Y. Effects of High-Intensity Interval Training and Moderate-Intensity Continuous Training on Cardiometabolic Risk Factors in Overweight and Obesity Children and Adolescents: A Meta-Analysis of Randomized Controlled Trials. Int. J. Environ. Res. Public Health 2021, 18, 11905. https://doi.org/10.3390/ijerph182211905
Cao M, Tang Y, Li S, Zou Y. Effects of High-Intensity Interval Training and Moderate-Intensity Continuous Training on Cardiometabolic Risk Factors in Overweight and Obesity Children and Adolescents: A Meta-Analysis of Randomized Controlled Trials. International Journal of Environmental Research and Public Health. 2021; 18(22):11905. https://doi.org/10.3390/ijerph182211905
Chicago/Turabian StyleCao, Meng, Yucheng Tang, Shu Li, and Yu Zou. 2021. "Effects of High-Intensity Interval Training and Moderate-Intensity Continuous Training on Cardiometabolic Risk Factors in Overweight and Obesity Children and Adolescents: A Meta-Analysis of Randomized Controlled Trials" International Journal of Environmental Research and Public Health 18, no. 22: 11905. https://doi.org/10.3390/ijerph182211905
APA StyleCao, M., Tang, Y., Li, S., & Zou, Y. (2021). Effects of High-Intensity Interval Training and Moderate-Intensity Continuous Training on Cardiometabolic Risk Factors in Overweight and Obesity Children and Adolescents: A Meta-Analysis of Randomized Controlled Trials. International Journal of Environmental Research and Public Health, 18(22), 11905. https://doi.org/10.3390/ijerph182211905