
Correlates of Physical Activity among Adults with Sight Loss in High-Income-Countries: A Systematic Review


 , ,
, ,  , , , , and
Abstract
:1. Introduction
2. Materials and Methods
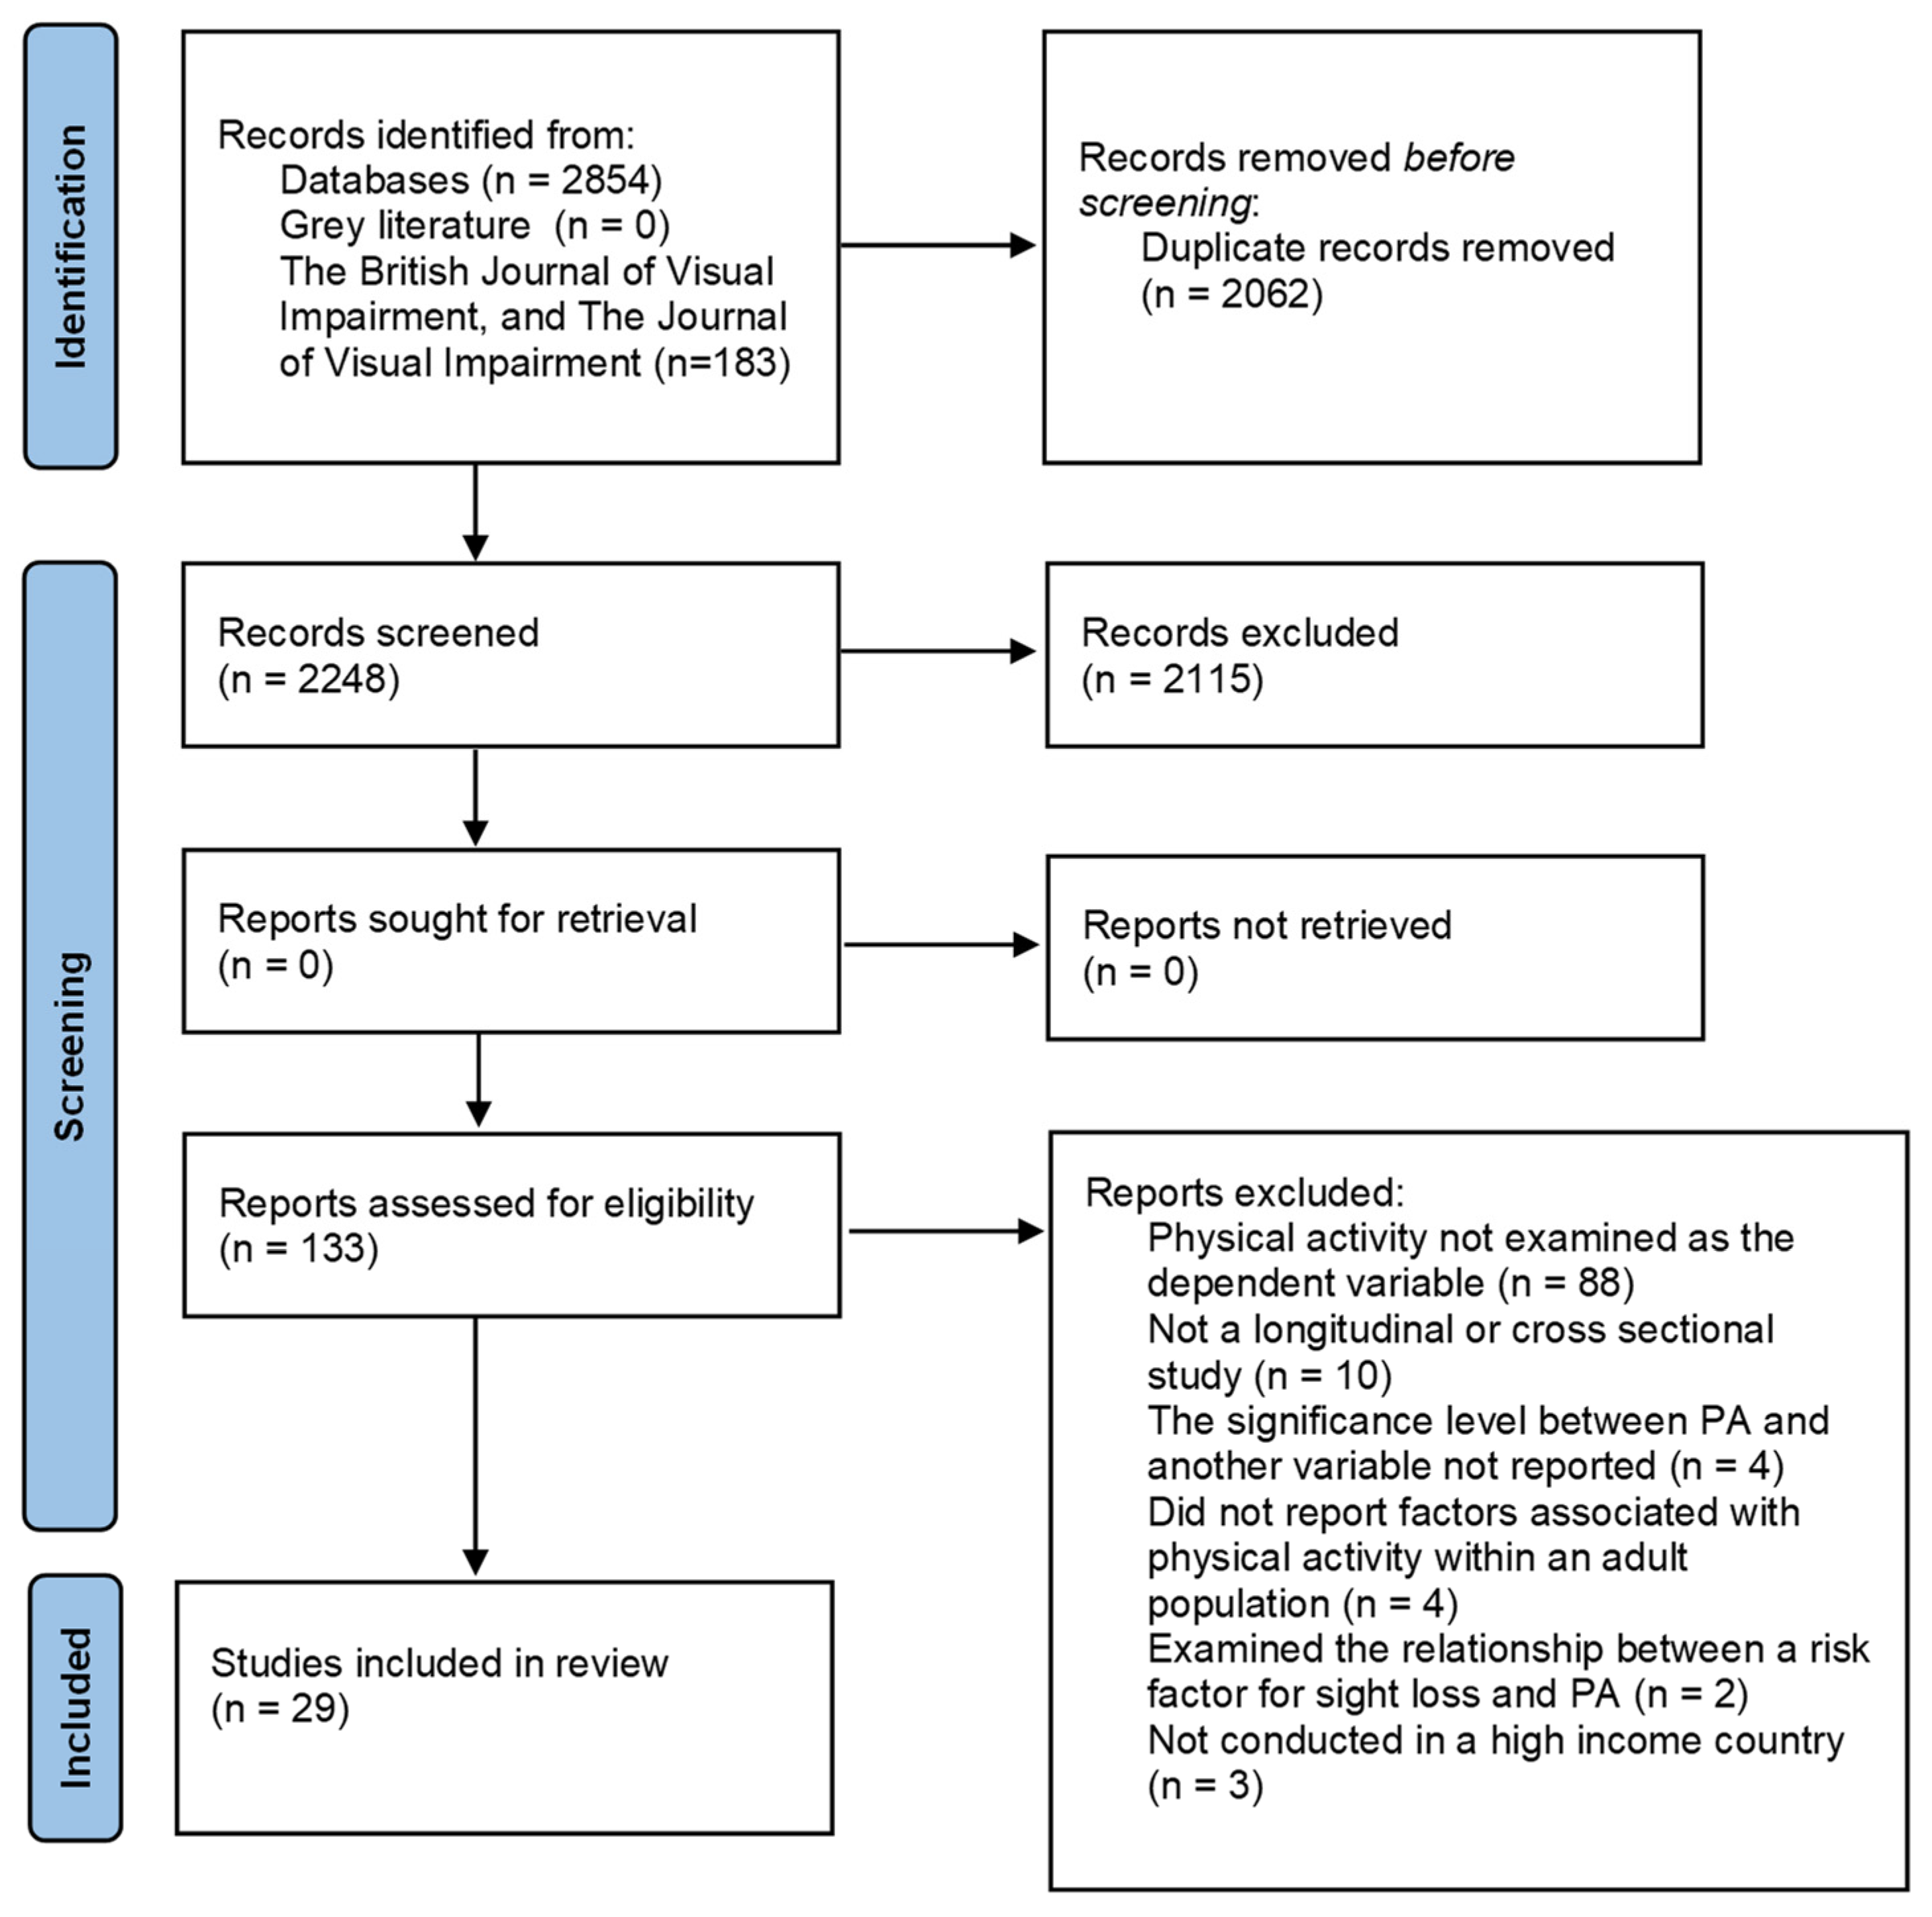
2.1. Search Strategy
2.2. Study Selection
3. Results
3.1. Non-Modifiable Correlates
3.1.1. Measures of Vision
3.1.2. Personal Correlates
3.2. Modifiable
3.2.1. Personal Correlates
3.2.2. Environmental Correlates
4. Discussion
5. Conclusions
Implications for Practice
- Worse visual acuity and visual field may indicate that an individual is at risk of lower PA [29,36,37,38,40,43,44,45]. These measures are examined in routine eye tests, thus optometrists and ophthalmologists could identify people at risk of low PA, and play a key role in referring people to PA groups and opportunities.
- It is important to understand how factors including gender, age, ethnicity, and additional disabilities influence PA in the context in which interventions are being delivered. Interventions should work with communities to understand local needs, develop appropriate interventions, and target different sociodemographic groups, when appropriate [55,56].
- Future studies, with larger, representative sample sizes, and objectively measured PA, are required, to explore the findings in studies which are currently limited to a small evidence base.
Author Contributions
Funding
Institutional Review Board Statement
Informed Consent Statement
Data Availability Statement
Conflicts of Interest
Appendix A
References
- Caspersen, C.J.; Powell, K.E.; Christenson, G.M. Physical activity, exercise, and physical fitness: Definitions and distinctions for health-related research. Public Health Rep. 1985, 100, 126–131. [Google Scholar]
- Bull, F.C.; Al-Ansari, S.S.; Biddle, S.; Borodulin, K.; Buman, M.P.; Cardon, G.; Carty, C.; Chaput, J.-P.; Chastin, S.; Chou, R.; et al. World Health Organization 2020 guidelines on physical activity and sedentary behaviour. Br. J. Sports Med. 2020, 54, 1451–1462. [Google Scholar] [CrossRef] [PubMed]
- Lee, I.; Shiroma, E.; Lobelo, F.; Puska, P.; Blair, S.; Katzmarzyk, P. Effect of physical inactivity on major non-communicable diseases worldwide: An analysis of burden of disease and life expectancy. Lancet 2012, 380, 219–229. [Google Scholar] [CrossRef] [Green Version]
- World Health Organisation. World Report on Vision. 2019. Available online: https://www.who.int/publications/i/item/world-report-on-vision (accessed on 22 October 2021).
- World Health Organisation. Blindness and Vision Impairment. 2021. Available online: https://www.who.int/news-room/fact-sheets/detail/blindness-and-visual-impairment (accessed on 5 November 2021).
- Royal National Institute of Blind People (RNIB). The Economic Impact of Sight Loss and Blindness in the UK Adult Population. 2013. Available online: www.deloitte.com/au/about (accessed on 22 October 2021).
- McMullan, I.I.; Bunting, B.P.; Smith, L.; Koyanagi, A.; Tully, M.A. Is There an Association Between Self-Reported Physical Activity and Self-Rated Vision Over Time? Results From the Irish Longitudinal Study of Ageing. J. Aging Phys. Act. 2020, 28, 1–8. [Google Scholar] [CrossRef] [PubMed]
- Willis, J.R.; Jefferys, J.L.; Vitale, S.; Ramulu, P.Y. Visual impairment, uncorrected refractive error, and accelerometer-defined physical activity in the United States. Arch. Ophthalmol. 2012, 130, 329–335. [Google Scholar] [CrossRef] [Green Version]
- Smith, L.; A Timmis, M.; Pardhan, S.; Latham, K.; Johnstone, J.; Hamer, M. Physical inactivity in relation to self-rated eyesight: Cross-sectional analysis from the English Longitudinal Study of Ageing. BMJ Open Ophthalmol. 2017, 1, e000046. [Google Scholar] [CrossRef] [Green Version]
- Brunes, A.; Flanders, W.D.; Augestad, L.B. Self-reported visual impairment, physical activity and all-cause mortality: The HUNT Study. Scand. J. Public Health 2016, 45, 33–41. [Google Scholar] [CrossRef]
- Loprinzi, P.D.; Joyner, C. Accelerometer-determined physical activity and mortality in a national prospective cohort study: Considerations by visual acuity. Prev. Med. 2016, 87, 18–21. [Google Scholar] [CrossRef]
- Kim, K.-N.; Park, S.J.; Kim, W.; Joo, J.; Kim, H.; Kim, K.H.; Sohn, J.H.; Kwon, Y.J. Modification of the Association between Visual Impairment and Mortality by Physical Activity: A Cohort Study among the Korean National Health Examinees. Int. J. Environ. Res. Public Health 2019, 16, 4386. [Google Scholar] [CrossRef] [Green Version]
- Sweeting, J.; Merom, D.; Astuti, P.A.S.; Antoun, M.; Edwards, K.; Ding, D. Physical activity interventions for adults who are visually impaired: A systematic review and meta-analysis. BMJ Open 2020, 10, e034036. [Google Scholar] [CrossRef] [Green Version]
- NHS. Age Related Macular Degeneration. Available online: https://www.nhs.uk/conditions/age-related-macular-degeneration-amd/ (accessed on 5 November 2021).
- National Eye Institute. Retinitis Pigmentosa. Available online: https://www.nei.nih.gov/learn-about-eye-health/eye-conditions-and-diseases/retinitis-pigmentosa (accessed on 5 November 2021).
- Page, M.J.; McKenzie, J.E.; Bossuyt, P.M.; Boutron, I.; Hoffmann, T.C.; Mulrow, C.D.; Shamseer, L.; Tetzlaff, J.M.; Akl, E.A.; Brennan, S.E.; et al. The PRISMA 2020 statement: An updated guideline for reporting systematic reviews. BMJ 2021, 372, n71. [Google Scholar] [CrossRef] [PubMed]
- Li, Q.D.; Kuang, X.M.; Qi, J. Correlates of Physical Activity of Children and Adolescents with Visual Impairments: A Systematic Review. Curr. Pharm. Des. 2020, 26, 5002–5011. [Google Scholar] [CrossRef] [PubMed]
- Barnett, A.; Cerin, E.; Zhang, C.J.P.; Sit, C.H.P.; Johnston, J.M.; Cheung, M.M.C.; Lee, R.S.Y. Associations between the neighbourhood environment characteristics and physical activity in older adults with specific types of chronic conditions: The ALECS cross-sectional study. Int. J. Behav. Nutr. Phys. Act. 2016, 13, 1–13. [Google Scholar] [CrossRef] [Green Version]
- Black, A.A.; Wood, J.M.; Lovie-Kitchin, J.E. Inferior visual field reductions are associated with poorer functional status among older adults with glaucoma. Ophthalmic Physiol. Opt. 2011, 31, 283–291. [Google Scholar] [CrossRef] [Green Version]
- Haegele, J.A.; Zhu, X.; Lee, J.; Lieberman, L.J. Physical Activity for Adults with Visual Impairments: Impact of Socio-Demographic Factors. Eur. J. Adapt. Phys. Act. 2016, 9, 3–14. [Google Scholar] [CrossRef] [Green Version]
- Haegele, J.A.; Brian, A.S.; Lieberman, L.J. Social Cognitive Theory Determinants of Physical Activity in Adults with Visual Impairments. J. Dev. Phys. Disabil. 2017, 29, 911–923. [Google Scholar] [CrossRef]
- Haegele, J.A.; Hodge, S.R.; Kozub, F.M. Beliefs about physical activity and sedentary behaviors of adults with visual impairments. Disabil. Health J. 2017, 10, 571–579. [Google Scholar] [CrossRef]
- Haegele, J.A.; Famelia, R.; Lee, J. Health-related quality of life, physical activity, and sedentary behavior of adults with visual impairments. Disabil. Rehabil. 2016, 39, 2269–2276. [Google Scholar] [CrossRef]
- Haegele, J.A.; Kirk, T.N.; Zhu, X. Self-efficacy and physical activity among adults with visual impairments. Disabil. Health J. 2018, 11, 324–329. [Google Scholar] [CrossRef] [PubMed]
- Haegele, J.A.; Zhu, X. Physical Activity, Self-efficacy and Health-related Quality of Life among Adults with Visual Impairments. Disabil. Rehabil. 2019, 43, 530–536. [Google Scholar] [CrossRef] [PubMed]
- Haegele, J.A.; Zhu, X.; Healy, S. Behavioral Correlates of Depression Among Adults with Visual Impairments. J. Vis. Impair. Blind. 2021, 115, 403–413. [Google Scholar] [CrossRef]
- Holbrook, E.A.; Caputo, J.L.; Perry, T.L.; Fuller, D.K.; Morgans, D.W. Physical activity, body composition, and perceived quality of life of adults with visual impairments. J. Vis. Impair. Blind. 2009, 103, 17–29. [Google Scholar] [CrossRef]
- Holbrook, E.A.; Kang, M.; Morgan, N.W. Acquiring a stable estimate of physical activity in adults with visual impairment. Adapt. Phys. Act. Q. 2013, 30, 59–69. [Google Scholar] [CrossRef] [PubMed]
- Inoue, S.; Kawashima, M.; Hiratsuka, Y.; Nakano, T.; Tamura, H.; Ono, K.; Mrukami, A.; Tsubota, K.; Yamada, M. Assessment of physical inactivity and locomotor dysfunction in adults with visual impairment. Sci. Rep. 2018, 8, 12032. [Google Scholar] [CrossRef] [PubMed]
- Jaarsma, E.A.; Dekker, R.; Koopmans, S.A.; Dijkstra, P.U.; Geertzen, J.H.B. Barriers to and Facilitators of Sports Participation in People with Visual Impairments. Adapt. Phys. Act. Q. 2014, 31, 240–264. [Google Scholar] [CrossRef]
- Jones, G.C.; Crews, J.E.; Danielson, M.L. Health risk profile for older adults with blindness: An application of the international classification of functioning, disability, and health framework. Ophthalmic Epidemiol. 2010, 17, 400–410. [Google Scholar] [CrossRef]
- Łabudzki, J.; Tasiemski, T. Physical activity and life satisfaction in blind and visually impaired individuals. Hum. Mov. 2013, 14, 210–216. [Google Scholar] [CrossRef]
- Lee, M.; Zhu, W.; Ackley-Holbrook, E.; Brower, D.G.; McMurray, B. Calibration and validation of the Physical Activity Barrier Scale for persons who are blind or visually impaired. Disabil. Health J. 2014, 7, 309–317. [Google Scholar] [CrossRef]
- Loprinzi, P.D.; Smit, E.; Lin, F.R.; Gilham, B.; Ramulu, P.Y. Accelerometer-assessed physical activity and objectively determined dual sensory impairment in US adults. Mayo Clin. Proc. 2013, 88, 690–696. [Google Scholar] [CrossRef]
- Marmeleira, J.; Laranjo, L.; Marques, O.; Pereira, C. Physical activity patterns in adults who are blind as assessed by accelerometry. Adapt. Phys. Act. Q. 2014, 31, 283–296. [Google Scholar] [CrossRef] [Green Version]
- Montarzino, A.; Robertson, B.; Aspinall, P.; Ambrecht, A.; Findlay, C.; Hine, J.; Dhillon, B. The Impact of Mobility and Public Transport on the Independence of Visually Impaired People. Vis. Impair. Res. 2007, 9, 67–82. [Google Scholar] [CrossRef]
- Nguyen, A.M.; Arora, K.S.; Swenor, B.K.; Friedman, D.S.; Ramulu, P.Y. Physical activity restriction in age-related eye disease: A cross-sectional study exploring fear of falling as a potential mediator Physical functioning, physical health and activity. BMC Geriatr. 2015, 15, 1–10. [Google Scholar] [CrossRef] [Green Version]
- Ramulu, P.Y.; Maul, E.; Hochberg, C.; Chan, E.S.; Ferrucci, L.; Friedman, D. Real-World Assessment of Physical Activity in Glaucoma Using an Accelerometer. Ophthalmology 2012, 119, 1159–1166. [Google Scholar] [CrossRef] [Green Version]
- Ramulu, P.Y.; Ms, A.M.; West, S.K.; Friedman, D.S.; Gitlin, L.N. What Is a Falls Risk Factor? Factors Associated with Falls per Time or per Step in Individuals with Glaucoma. J. Am. Geriatr. Soc. 2018, 67, 87–92. [Google Scholar] [CrossRef] [Green Version]
- Sengupta, S.; Nguyen, A.M.; van Landingham, S.W.; Solomon, S.D.; Do, D.V.; Ferrucci, L.; Friedman, D.S.; Ramulu, P.Y. Evaluation of real-world mobility in age-related macular degeneration. BMC Ophthalmol. 2015, 15, 9. [Google Scholar] [CrossRef] [PubMed] [Green Version]
- Shakarchi, A.F.; Mihailovic, A.; West, S.K.; Friedman, D.; Ramulu, P.Y. Vision Parameters Most Important to Functionality in Glaucoma. Investig. Opthalmology Vis. Sci. 2019, 60, 4556–4563. [Google Scholar] [CrossRef] [Green Version]
- Starkoff, B.E.; Lenz, E.K.; Lieberman, L.J.; Foley, J.; Too, D. Physical activity patterns of adults with visual impairments. Br. J. Vis. Impair. 2017, 35, 130–142. [Google Scholar] [CrossRef]
- Subhi, Y.; Sørensen, T.L. Physical activity patterns in patients with early and late age-related macular degeneration. Dan. Med. J. 2016, 63, A5303. [Google Scholar]
- van Landingham, S.W.; Willis, J.R.; Vitale, S.; Ramulu, P.Y. Visual field loss and accelerometer-measured physical activity in the United States. Ophthalmology 2012, 119, 2486–2492. [Google Scholar] [CrossRef]
- Zult, T.; Smith, L.; Stringer, C.; Pardhan, S. Levels of self-reported and objective physical activity in individuals with age-related macular degeneration. BMC Public Health 2020, 20, 1144. [Google Scholar] [CrossRef] [PubMed]
- Critical Appraisal Program. CASP Cohort Study Checklist. 2018. Available online: https://casp-uk.net/wp-content/uploads/2018/03/CASP-Cohort-Study-Checklist-2018_fillable_form.pdf (accessed on 4 May 2021).
- Guthold, R.; A Stevens, G.; Riley, L.M.; Bull, F.C. Worldwide trends in insufficient physical activity from 2001 to 2016: A pooled analysis of 358 population-based surveys with 1.9 million participants. Lancet Glob. Health 2018, 6, e1077–e1086. [Google Scholar] [CrossRef] [Green Version]
- Sallis, J.F. Age-related decline in physical activity: A synthesis of human and animal studies. Med. Sci. Sports Exerc. 2000, 32, 1598–1600. [Google Scholar] [CrossRef]
- GOV.UK. Physical Activity. 2020. Available online: https://www.ethnicity-facts-figures.service.gov.uk/health/diet-and-exercise/physical-activity/latest#by-ethnicity-over-time (accessed on 4 June 2021).
- Bhatnagar, P.; Townsend, N.; Shaw, A.; Foster, C. The physical activity profiles of South Asian ethnic groups in England. J. Epidemiol. Community Health 2015, 70, 602–608. [Google Scholar] [CrossRef] [Green Version]
- Johnson, M.R.; Morjaria-Keval, A. Ethnicity, sight loss and invisibility. Br. J. Vis. Impair. 2007, 25, 21–31. [Google Scholar] [CrossRef]
- RNIB. Learning Disability and Sight Loss 2013. Available online: http://www.rnib.org.uk/learningdisability (accessed on 5 November 2021).
- da Silva, E.S.; Fischer, G.; da Rosa, R.G.; Schons, P.; Teixeira, L.B.T.; Hoogkamer, W.; Peyré-Tartaruga, L.A. Gait and functionality of individuals with visual impairment who participate in sports. Gait Posture 2018, 62, 355–358. [Google Scholar] [CrossRef]
- Gleeson, M.; Sherrington, C.; Lo, S.; Auld, R.; Keay, L. Impact of the Alexander technique on well-being: A randomised controlled trial involving older adults with visual impairment. Clin. Exp. Optom. 2017, 100, 633–641. [Google Scholar] [CrossRef] [PubMed] [Green Version]
- Moore, G.F.; Evans, R.E.; Hawkins, J.; Littlecott, H.; Melendez-Torres, G.; Bonell, C.; Murphy, S. From complex social interventions to interventions in complex social systems: Future directions and unresolved questions for intervention development and evaluation. Evaluation 2018, 25, 23–45. [Google Scholar] [CrossRef] [PubMed] [Green Version]
- Craig, P.; Di Ruggiero, E.; Frohlich, K.L.; Mykhalovskiy, E.; White, M.; Campbell, R.; Cummins, S.; Edwards, N.; Hunt, K.; Kee, F.; et al. Taking account of context in population health intervention research: Guidance for producers, users and funders of research. Fac. Health Sci. Sport Res. Rep. 2018. [Google Scholar] [CrossRef] [Green Version]


| Reference | Population Characteristics: Age (Years), Gender. | Population: (n) | Physical Activity Measurement Tool | Vision Measurement Tool | Specific Eye Disease Examined? | Statistical Test | Country | Confounders Controlled for | Main Findings |
|---|---|---|---|---|---|---|---|---|---|
| Barnett, A. et al. (2016) [18] | Mean age years (SD) age: 76 (6) Male: 34% Female: 66% | n = 527 (participant s with VI) | IPAQ-SF (Chinese version) | VI was determined using information from clinical health-problems checklists obtained from the Elderly Health Center (EHC). For participants recruited outside of the EHCs VI was self-reported. | Glaucoma Cataracts | The study examined if VI had a moderating effect on associations between perceived neighbourhood characteristics and physical activity outcomes. | Hong Kong | Socio demographics, type of recruitment centre, specific diagnosed chronic condition type, number of other medical conditions, and other significant perceived neighbourhood characteristics and environment by chronic condition interaction effects. | Land use mix–access to services was positively associated with non-walking PA. Physical barriers to walking were negatively associated with non-walking PA. Weekly frequency and minutes of within-neighbourhood walking for transport was not significantly associated with aesthetics in participants with VI. |
| Black, A. et al. (2011) [19] | Mean age (SD) years: 74.2 (5.9) Female: 47% Male: 53% | n = 74 | Self-reported. Physical Activity Scale for the Elderly (PASE) | VA: Standard Bailey-Lovie high-contrast letter chart. VF: Humphrey Field Analyzer; model HFA-II 750; Carl Zeiss Meditec Inc., Dublin, CA, USA). Monocular 24-2 Swedish Interactive Threshold Algorithm (SITA)-Standard threshold tests. | Glaucoma patients. | Multivariate regression used to determine which vision parameters predicted variations in PASE scores. Principal components factors analysis with varimax transformation was used to create three vision factors which were assessed in multivariate analysis. | Australia | Age and gender | PASE scores were significantly associated with contrast sensitivity (r = 0.24) and all of the VF measures. The multivariate regression which examined vision factors and PA reported 10.2% of the variance in PASE scores was explained by vision factors, contrast factor was a significant predictor of PASE scores, whilst superior and inferior field factors were not. |
| Haegele, J. et al. (2016) [20] | Mean age years: 47.04 Female: 52.8% Male: 47.2% | n = 176 | IPAQ-SF | Self-reported visual impairment classification | Any | Multiple regression analysis with total MET minutes per week as the dependable variable and sociodemographic variables as the predictors. | USA | Gender, ethnicity, VI type, onset, years of VI, K-12 education mobility aid and college education included in multiple regression. | Gender was the only significant predictor of MET minutes per week (β = 0.25, p < 0.05), with men reporting more MET minutes than women. |
| Haegele, J. et al. (2017) [21] | Mean age (SD) years: 46.88 (13.91) Female: 54.3% Male: 45.7% | n = 92 | IPAQ-SF | Self-reported VI category. B1 (blind), B2 (travel vision), and B3 (legal blindness) = 28. | No | Hierarchical multiple regression analysis with forced entry | USA | Hierarchical multiple regression analysis controlled for vision status, sex and age. | The hierarchical regression found vision category (p < 0.001) and social support significantly predicted total METs (p = 0.037) but self-regulation (p = 0.094), sex (p = 0.069), and age did not. |
| Haegele, J. et al. (2017) [22] | Mean age (range) years: 45.3 (18–86) Female: 65.6% Male: 34.4% | n = 209 | BAPS-VI scale | Participants self-reported as: B1, B2, B3 and B4 in accord with the United States Association of Blind Athletes classification system. | No | Hierarchical multiple regression analysis. | USA | Attitudes and beliefs variables, intention to engage in PA or sedentary behaviour, gender, age, and nature of VI (congenital versus acquired). | The model using theory of planned behaviour explained 7% of the variance in PA. Only intention to engage in PA resulted in a significant beta coefficient (β = 0.30). |
| Haegele, J. et al. (2017) [23] | Mean age (SD): 47.5 (12.4) Female: 62.5% Male: 37.5% | n = 80 | Self-reported PA by the IPAQ-SF | Self-reported visual impairment. Participants had the option to select B1 (i.e., Blind), B2 (i.e., travel vision), or B3 (i.e., legal blindness). | No | Spearman rank correlation (to test ordinal variables), Pearson correlation (to test continuous variables). | USA | No confounders controlled for when conducting Spearman rank correlation testing. | Men reported higher levels of PA than women (p = 0.002). Level of independence and PA had a significant relationship (p = 0.003), and health related quality of life and PA (p = 0.010). Sedentary behaviour and PA were negatively correlated (p = 0.004). |
| Haegele, J. et al. (2018) [24] | Mean age (SD): 44.3 (15.3) Female: 65.2% Male: 34.8% | n = 147 | IPAQ-SF | Self-Report visual impairment level. (B1, B2, B3) | No. | Linear multiple regression with forced entry for all independent variable to explore impact between variables and MET-min/week. | USA | Age, gender, VI classification and household income and self-efficacy included in the multiple regression analysis, MET-min/week was the dependent variable. | In multiple regression analysis self-efficacy was the only variable that reached significance as a positive predictor of MET-min/week (p = 0.001). |
| Haegele, J. et al. (2019) [25] | Mean age (SD) years: 44.77 (15.3) Male: 27.7% Female: 72.3% | n = 159 | IPAQ-SF | Self-reported VI classification based on the United States Association of Blind Athletes system. | No. | Hypothesised structural model was tested. | USA | The structural model predicting quality of life, examined the direct and indirect paths predicting self-efficacy for exercise, physical health and psychological health and MVPA. | Self-efficacy for exercise positively predicted participants’ weekly MVPA (β = 0.26). |
| Haegele, J. et al. (2021) [26] | Mean age (SD) years: 44.8 (15.5) Male: 43.6% Female: 65.4% | n = 182 | IPAQ-SF | Self-reported VI classification based on the United States Association of Blind Athletes system | No | Pearson product-moment correlation analysis. Hierarchical regression analyses | USA | No confounders controlled for in-person product moment correlation analysis. VI level, sex. Age, race, education level., body weight status, met MVPA guideline, met sedentary time guideline, and met sleep guidance were included in hierarchical regression analyses. | MVPA had a negative correlation with BMI (p < 0.05). The association between MVPA, and age, sedentary time, sleep and depression was not significant in correlation analysis. No significant association was found between meeting PA guidelines and depression in regression analysis. |
| Holbrook, E. et al. (2009) [27] | Age range: 18–60 Male: 60% Female: 40% | n = 25 | Step Activity Monitor (SAM; Cyma, Seattle, WA; Model SW3). | Self-report VI severity based on the ICD classification | No | 3 (mild, moderate, severe) × 2 (male, female) ANOVAs. | USA | The data was stratified by VI severity and by gender. | No interaction between the severity of VI and gender for four of the PA variables: average daily step counts, (p = 0.35) percentage of time at low activity, (p = 0.36) percentage of time at moderate activity (p = 0.93.) |
| Holbrook, K. et al. (2013) [28] | Mean age (SD) years: 45.9 (11.). Female: 61.3% Male: 38.7% | n = 31 | Pedometer (Orbxy, Electronics Model 6310610, Concord, Canada) | Self-reported VI classification based on the International Statistical Classification for Disease schematic. | No | One-way repeated measures ANOVA Generalizability theory analysis | USA | PA stability was assessed across varying VI severity. | No difference in daily step activity across the days of the week in the whole sample (p = 0.633). 4 days monitoring was sufficient for a reliable measure of PA among people with mild-moderate VI and 9 days for people with severe VI. |
| Inoue, S. et al. (2018) [29] | Mean age (SD, range) years: 69.6 (14.5, 20–93) Male: 118 (54.9%) | n = 215 | IPAQ-Japan | BCVA was assessed using clinical measures. | No | Univariate and multivariate ordinal logistic regression analysis to assess the association between physical activity and variables. | Japan | Sex, age, VFQ-25 score, BCVA in the better eye, and BCVA in the worse eye, systemic comorbidity, and BMI included in multivariate models. | Multivariate ordinal logistic regression analysis reported PA was significantly associated with VFQ-25 score (p < 0.001) and BCVA in the worse eye (p = 0.01) but not BCVA in better eye. Sex, age, systemic comorbidity, and BMI was not associated with PA in univariate or multivariate models. |
| Jaarsma, E. et al. (2014) [30] | Mean age (SD) years: 49.1 (17.9) Female: 52% Male: 48% | n = 648 | Questionnaire. | Self-reported VI category based on ICD-10 | No | Logistic regression (method enter) which included all variables related to sports participation (p ≤0.1). | The Netherlands | Education, use of white cane, use of computer software, having a guide dog, disability (experienced as a barrier), cost as a barrier, lack of peers/buddies as a barrier, and gender were entered as predictors of sports participation in the logistic regression. | The significant factors predicting sports participation were education, disability (experienced as a barrier), costs, lack of peer/buddies and use of computer software. |
| Jones, G. et al. (2010) [31] | Vision loss but not blindness group: Age 65–74: 43.5% ≥75: 56.6% Male: 38.5% Female: 61.5% Blindness: Age 65–74: 28.8% ≥75.5: 71.2% Male: 39.7% Female: 60.3% | Normal sight: n = 33, 497 Blind: n = 477 Vision loss but not blindness: n = 6721 | Self-reported PA: Respondents were deemed physically inactive if they reported no regular weekly exercise. | Individuals who reported trouble seeing, even with glasses or contact lenses were classified as having vision loss. Participants were asked if they were blind or could not see at all. This was the case definition of blindness. | No | Logistic regression | USA | Age, sex, race/ethnicity, income, education, marital status, and correlated health behaviours. | There was a strong association between physical inactivity and severity of sight loss. 75.9% of adults with blindness did not exercise weekly (Adjusted odds ratio = 2.24), compared to 61.2% of adults with vision loss and not blindness (Adjusted odds ratio = 1.25). |
| Łabudzki, T. et al. (2013) [32] | Mean age (SD): 38 (±12.1) Female: 52.4% Male: 47.6% | n = 82 | IPAQ-SF | Self-reported prior medical diagnosis of VI (significant, moderate or light impairment). | No. | Chi- square test for gender difference. | Poland | None controlled for when testing for differences in PA between genders. | No difference in PA in relation to gender (Chi square = 0.256, p = 0.88). |
| Lee M. et al. (2014) [33] | Age groups: n 20s: 20 30s: 16 40s: 23 50s: 52 >60s: 33 Female: 66.6% Male: 33.3% | n = 144 with VI/blind. | PASIPD | Self-report VA | No | Descriptive statistics used to screen the data. Pearson Product Moment Correlations (to examine relationship between PA participation and PA barriers). | USA | Confounders not controlled for when examining the relationship between PA and self-reported barriers to PA. | PA in the normal weight group was higher than in the overweight/obese group (t = 2.09, p < 0.04). A significant correlation (r = 0.41) was reported between PA levels and the logit of reported barriers to PA. |
| Loprinzi, S. et al. (2013) [34] | Dual sensory impairment sample: Mean age (range): 73.7 (58.7–88.7) Female: 59.5% Male: 40.5% | All participants: n = 1445 Mild/worse hearing loss: n = 817 VI: n= 35 Dual sensory impairment n = 29 | Accelerometer (ActiGraph 7164; ActiGraph LLC) | Visual acuity (VA) assessed by an autorefractor. VA in the better eye worse than 20/40 after autorefraction or who self-reported not being able to see light with both eyes were classified as VI. | No | Negative binomial regression model | USA | Age, sex, race/ethnicity, education, body mass index, comorbidity index, cotinine level, C-reactive protein level, number of valid days of accelerometry, and accelerometer wear time. | Dual sensory impairment was associated with less PA compared to those with a single sensory impairment (Hearing loss × vision loss interaction: IRR, 0.45; 95% CI, 0.29–0.68, p = 0.001). |
| Marmeleira, J. et al. (2014) [35] | Mean age (SD) years: 47.4 (11.3) Male: 41 Female: 22 | n = 63 | Accelerometery(model GT1M; ActiGraph, Fort Walton Beach, FL) | People who were declared as legally blind by the Associatjao dos Cegos e Amblfopes de Portugal (The main Portuguese association for people with a VI). | Any | Independent sample t test or the nonparametric Mann-Whitney U test were used to compare PA between genders and congenital/acquired blindness groups. Chi-square test compared the proportion of participants who achieved the recommended levels of PA by gender. One-way ANOVA compared PA between BMI categories. Pearson’s correlation test relationship between physical activity and age. | Portugal | Not controlled for. | No significant gender difference in any of the PA variables. No differences across PA variables across BMI categories, age, age of blindness onset, or when comparing PA between people with congenital or acquired blindness. |
| McMullan, I. et al. (2020) [7] | Mean age years: 63.57 Female: 55% Male: 45% | n = 8255 | IPAQ-SF | Self-Report. Participants were asked ‘Is your eyesight (using glasses or corrective contact lenses) excellent, very good, good, fair, or poor?’ | No | Path analysis | Republic of Ireland | Age, marital status, sex, self-reported health, education, employment, depression, history of high blood pressure, eye disease, diabetes, and cardiovascular disease, and disability of activities of daily living. | Self-reported sight loss did not directly affect PA. However, PA had a cumulative effect on future PA, via its effect on vision over 6 years. |
| Montarzino, A. et al. (2007) [36] | Mean age (SD): 80.15 (8.2) Female: 67% Male: 33% | n = 66 | Travel questionnaire. | Recruited from an eye clinic. | Any | Kruskal Wallis 1-way analysis of variance was carried out to identify significant differences in walking distance across all acuity ranges at p < 0.01. Kruskal Wallis ANOVA was run to test variables were significant discriminators of walking distance. The significant variables were then placed in a binary logistic regression to predict walking distance. | UK (Scotland) | Regression tree analysis included age, visual acuity and safety concerns as predictors of walking distance in the model and prioritised their importance. | The main restrictions on walking are the age of the participant, vision in the better and worse eyes, and feelings of safety, however these factors varied by age. |
| Nguyen, A et al. (2015) [37] | Controls: Age, median (IQR) 69.4 (65.2, 72.8) Female: 61.7% Glaucoma: Age, median (IQR) 70.4 (66.4, 74.5) Female: 53% AMD: Age, median (IQR) 75.8 years (71.0, 78.3) Female: 57.1% | Controls: n = 59 Glaucoma: n = 83 AMD: n = 58 | Accelerometer (Actical; Respironics, Inc., Adover, MA, USA) | VF: Humphrey 24-2 VF testing (Carl Zeiss Meditec, Dublin, CA). VA: ETDRS chart | Glaucoma and AMD | Separate univariate negative binomial analyses were performed with MVPA as the dependent variable to identify covariates to be further explored in multivariate analyses. | USA | Covariates included in model 1 multivariate analysis were CS, Age, Sex, Race, Education, and Comorbidity as independent variables. In model 2 fear of falling was included as a possible mediator between CS and MVPA. | For participants with AMD, the association between CS and PA was no longer significant once fear of falling was added to the model (p = 0.53). For participants with glaucoma related VI, VF loss remained a statistically significant predictor of physical activity once fear of falling was added to the model (p < 0.01). |
| Ramulu, P. et al. (2012) [38] | No glaucoma: Age: 69.3 Female (%): 62.1 Glaucoma: Age: 70.3 Female: 54.2% | No glaucoma: n = 58 Glaucoma: n = 83 | Omnidirectional accelerometer (Actical; Respironics, Inc., Andover, MA, USA). | VA: ETDRS chart. CS: Pelli-Robson chart (under binocular conditions) VF: Humphrey 24-2 VF testing (Carl Zeiss Meditec, Dublin, CA). | Glaucoma | Univariate analysis and Multivariate analysis negative binomial regression models. | USA | Variables included in multivariate analysis: Glaucoma (present), severe Glaucoma (present), visual field, age, race, gender, education, comorbidities, depressive symptoms, BMI, cognitive ability. | When the extent of VF loss, visual acuity, and contrast sensitivity were included in the same multivariate models, only VF loss remained predictive of either MVPA or steps (p < 0.01 for both). |
| Ramulu, P. et al. (2019) [39] | Age mean (SD): 70.7 (7.6) Female: 48% Male: 52% | n = 230 | Accelerometer (Actical, Respironics Inc., Murrysville, PA, USA) | VF: Humphrey Field Analyzer 24-2 test (Carl Zeiss Meditec, Inc., Dublin, CA, USA) VA: ETDRS chart CS: MARS chart | Glaucoma | Univariate and multivariable negative binomial models. | USA | Age, race, gender, number of comorbid illnesses, and polypharmacy. | In multivariable models, worse integrated visual field sensitivity, older age, female gender, African-American race and polypharmacy was associated with less daily steps (p ≤ 0.05 for all) greater comorbid illness was not associated with less daily steps (p = 0.41). |
| Sengupta, N. et al. (2015) [40] | Control group: Age mean: 69.3 (5.3) Female: 62.7% AMD group: Age mean: 74.4 (5.2) Female: 57.9% | AMD patients: n = 57 Controls with normal vision: n=59 | Accelerometer (Actical; Respironics, Inc., Andover, MA, USA) | VA: ETDRS chart CS: Pelli-Robson chart | AMD | Univariate and multivariate negative binomial regression models. | USA | Multivariate negative binomial regression models adjusted for age, gender, race, comorbidities, and education. | A significant dose-dependent relationship was observed between worse clinical measures of vision and daily MVPA and daily steps (p < 0.05). |
| Shakarchi, A. et al. (2019) [41] | Age mean (±SD): 70 (±6.8) Female: 53% Male: 47% | n = 151 | Accelerometer, (Actical, Respironics, Inc., Murrysville, PA, USA) | VA: ETDRS chart CS: MARS chart VF: Humphrey Field Analyzer 24-2 test (Carl Zeiss Meditec, Inc., Dublin, CA, USA) AULCSF: Estimated from the quick CS function (qCSF) test (Adaptive Sensory Technology, San Diego, CA, USA) Colour vision: Hardy-Rand-Rittler (OttLite Technology, Tampa, FL, USA) Stereoacuity: Distance Randot Stereotest (Stereo Optical, Chicago, IL, USA). ViN: Pelli-Levi Dual Acuity Chart | Glaucoma | Likelihood ratio testing determined tested association between PA and vision parameters. Dominance analysis determined the relative importance of the various visual parameters. | USA | Age, sex, race, marital status, living arrangements, employment status, and education. Polypharmacy (defined as having five or more non-eyedrop prescription) and comorbidities index. | Vision parameters significantly predicted daily steps p = 0.01. The dominant predictor of differences in daily steps was AULCF. |
| Starkoff, B. et al. (2017) [42] | Mean age (SD) years: 36.1 (13.9) Men: 48.7% Women: 51.3% | n = 115 | IPAQ-SF | VI was self-report classification based on the International Blind Sports Federation and US association of blind athletes guidelines (B1, B2, B3, B4). | No. | One-way ANOVAs to assess PA differences between gender, BMI and extent of VI. To differentiate between blind and VI participants a 2X4 ANOVA was used to assess differences in PA between gender and BMI. | USA | Data was stratified by different types of PA (walking, moderate PA, MVPA and vigorous PA) | Males engaged in more moderate PA than females (p = 0.008). Walk time was significantly greater in participants who were visually impaired compared to those who were blind (p = 0.021). Overweight participants engaged in more vigorous PA compared to normal-weight participants (p = 0.020). |
| Subhi, Y. et al. (2016) [43] | No AMD: Mean age (SD): 70.5 (7.5) Female: 63% Male: 37% Early AMD Mean age (SD): 77.1 (5.6) Female: 52% Male: 48% Late AMD: Mean age (SD): 75.9 (7.6) Female: 64% Male: 36% | No AMD: n = 68 Early AMD: n = 25 Late AMD: n = 103 | Self-report questionnaire. | BCVA in each eye was measure using Early Treatment of the Diabetic Retinopathy study chart. | AMD | Chi-Square test or Fisher’s exact test when numbers were small. | Denmark | Participants were age matched with healthy participants with no AMD. | No difference in between participants at different stages of AMD. People with worse BVCA in best-seeing eye and worse-seeing eye were more likely to report: not engaging in PA weekly, to report engaging in vigorous PA <1 times a week compared to ≥1 a week and walking ≤ 10 stairs steps daily compared to 11–50 stairs steps and > 50 stairs steps. |
| van Landingham, S. et al. (2012) [44] | Age years: 40+ Female: 53% | Normal VF: n = 1321 Unilateral VF loss: n = 88 Bilateral VF loss: n = 59 | Accelerometer (Actigraph, LLC, Ft. Walton Beach, FL) | VF Humphrey Matrix FDT 19-point suprathreshold screening test (N-30-5). VA post refraction: Nidek Autorefractor/Keratometer (model ARK-760A) | No. | Multivariable negative binomial models to assess relationship between VF and PA. Multivariate analysis was also used to test association between other vision and sociodemographic factors on PA. | USA | Covariates included in the multivariable models were age, sex, race/ethnicity, and education. Medical comorbidities included in the multivariable models were chronic obstructive pulmonary disease/asthma, arthritis, diabetes, congestive heart failure, and stroke. | In multivariable models bilateral VF loss but not unilateral VF loss was associated with fewer daily steps (p < 0.05) and less MVPA (p < 0.01). Post-refraction VA was associated with fewer 15% daily steps (p = 0.04) and 36% less MVPA (p = 0.04). |
| Zult, T., (2020) [45] | AMD subjects with vision loss: Age (SD): 76 (7) Male: 45.5% Female: 54.5% AMD subjects without vision loss: Age: 76(7) Male: 60% Female: 50% Controls with normal vision: Age: 70(4) Male: 45.5% Female: 54.5% | AMD subjects with vision loss: n = 11 AMD subjects without vision loss: n = 10, Control group with normal vision: n = 11 | Accelerometer (Actigraph GT3X tri-axial), activity monitor log and interview using the World Health Organisation: Global Physical Activity Questionnaire. | VA: Bailey-Lovie logMAR chart CS: Pelli-Robson chart VF: Humphrey Field Analyzer (Carl Zeiss Meditec Inc., Dublin, CA, USA) SITA-Standard 30–2 threshold test | AMD | Pearson’s correlation coefficients were calculated to assess whether there is a relationship between the severity of vision loss and outcomes of the Actigraph and GPAQ. | UK (England) | Control group was age matched with AMD group. | There was a significant negative correlation between objectively measured MVPA and worse VA, VF and CS. However, when self-reported MVPA and step count was examined, the associations were weaker and in the opposite direction, compared to when PA levels were objectively measured. |
| High Quality | Medium Quality | Low Quality |
|---|---|---|
| Loprinzi, S. et al. [34] Shakarchi, A. et al. [41] Ramulu, P. et al. (2019) [39] van Landingham, S. et al. (2012) [44] | Barnett, A. et al. [18] Black, A. et al. [19] Haegele, J. et al. (2017) [23] Haegele, J. et al. (2021) [26] Inoue, S. et al. [29] Jaarsma, E. et al. [30] Jones, G. et al. [31] Marmeleira, J. et al. (2014) [35] McMullan, I. et al. (2020) [7] Montarzino, A. et al. (2007) [36] Nguyen, A et al. (2015) [37] Ramulu, P. et al. (2012) [38] Sengupta, N. et al. (2015) [40] Subhi, Y. et al. (2016) [43] | Haegele, J. et al. (2016) [20] Haegele, J. et al. (2017) [21] Haegele, J. et al. (2017) [22] Haegele, J. et al. (2018) [24] Haegele, J. et al. (2019) [25] Holbrook, E. et al. (2009) [27] Holbrook, K. et al. (2013) [28] Łabudzki, T. et al. (2013) [32] Lee M. et al. (2014) [33] Starkoff, B. et al. (2017) [42] Zult, T., (2020) [45] |
| Measure of Vision | Positive Association | Negative Association | No Association | |||
|---|---|---|---|---|---|---|
| Self-Reported | SR. PA | Obj.PA | SR. PA | Obj. PA | SR. PA | Obj. PA |
| Self-reported VI classification (blindness vs VI) | [21,31] | [42] | ||||
| Self report VI classification (B1, B2, B3,B4) | [20,24,42] | |||||
| Onset of VI (congenital vs after birth) | [20,22] | [35] | ||||
| PA has an accumulative effect on PA over time via its effect on vision | [36] | |||||
| Years of VI | [20] | [35] | ||||
| Self-rated vision | [36] | |||||
| Objective Measures | Positive Association | Negative Association | No Association | |||
| SR. PA | Obj. PA | SR. PA | Obj. PA | SR. PA | Obj. PA | |
| Contrast sensitivity (worse) | [19] | [40,45] | [45] | [37,38] | ||
| Colour vision | [41] | |||||
| Visual acuity without noise | [41] | |||||
| Visual acuity (best seeing eye) (worse) | [40,45] | [29,43,45] | ||||
| VA (worse seeing eye) (worse) | [29] | [43] | ||||
| Visual field (worse) | [37,38,44,45] | [19,45] | [44] | |||
| Glaucoma (present) | [38] | |||||
| Severe Glaucoma (present) | [38] | |||||
| Stage of AMD | [43] | |||||
| AMD present | [40] | |||||
| Significant cataracts/PCO (present) | [40] | |||||
| Measure of Vision | Positive Association | Negative Association | No Association | |||
|---|---|---|---|---|---|---|
| Self-Reported | SR. PA | Obj. PA | SR. PA | Obj.PA | SR.PA | Obj.PA |
| Vision loss (self-reported blindness vs. self-reported VI) | [42] * | |||||
| Self-report VI classification | [42] ** | |||||
| Onset of VI (Congenital vs. acquired blindness) | [35] | |||||
| Years of VI/Age of onset | [35] | |||||
| Severity of VI × Gender | [25] | |||||
| Objective Measures | Positive Association | Negative Association | No Association | |||
| SR. PA | Obj.PA | SR. PA | Obj. PA | SR. PA | Obj. PA | |
| Contrast sensitivity (worse) | [38,40,45] | |||||
| Visual acuity (Best seeing eye) (worse) | [36] *** [43] (stairs taken daily) | [40] | [36,43], *** | |||
| Visual acuity (Worse seeing eye) | [43] (stairs taken daily) | [43] | [44] | |||
| Visual field (worse) | [39] (Integrated visual field sensitivity) [38] (visual field loss in better eye) [45] | [45] (unilateral visual field loss was not associated with less steps) [44] | ||||
| Vision parameters | [41] | |||||
| Glaucoma (present) | [38] | |||||
| Glaucoma (severe) (present) | [38] | |||||
| AMD (present) | [40] | |||||
| Stage of AMD | [43] | |||||
| Sig. Cataract/PCO | [40] | |||||
| Personal Characteristics | Positive Association | Negative Association | No Association | |||
|---|---|---|---|---|---|---|
| SR. PA | Obj. PA | SR. PA | Obj. PA | SR. PA | Obj. PA | |
| Comorbidities | [29] | |||||
| Hearing loss (dual sensory impairment) | [34] | |||||
| BMI (Higher) | [26,33] | [24,29,42] | [35] | |||
| Use of a mobility aid | [20] | |||||
| Health related quality of life (higher) | [23] | |||||
| Depression | [26] | |||||
| Level of independence (Higher) | [23] | |||||
| Age (older) | [21,22,24,26,29] | |||||
| Gender (men) | [20,23,42] | [21,22,24,29,31] | [35] | |||
| Household income | [24] | |||||
| Ethnicity- (comparing Caucasian, African America, Asian, Hispanics and other ethnic groups) | [20] | |||||
| Education | [20] | |||||
| Personal | Positive Association | Negative Association | No Association | |||
|---|---|---|---|---|---|---|
| SR. PA | Obj. PA | SR. PA | Obj. PA | SR.PA | Obj.PA | |
| Comorbidities | [39] | |||||
| Polypharmacy (≥5 vs. <5 non-eye drop medication) | [39] | |||||
| BMI (Higher) | [42] | [35] | ||||
| Gender (male) | [42] | [35] | ||||
| Severity of VI × Gender | [25] | |||||
| Age (older) | [36] ** | [36] ** | ||||
| Personal Factors | Positive Association | Negative Association | No Association | |||
|---|---|---|---|---|---|---|
| SR. PA | Obj. PA | SR. PA | Obj. PA | SR. PA | Obj. PA | |
| Self efficacy | [24,25] | |||||
| Self-regulation | [21] | |||||
| Social support | [21] | |||||
| Intention to engage in PA | [22] | |||||
| Attitudes/beliefs (theory of planned behaviour constructs) | [22] | |||||
| Sedentary behaviour (more time in SB) | [23] | [22,26] | ||||
| Level of independence (Higher) | [23] | |||||
| Use of mobility aid | [20] | |||||
| Fewer perceived PA barriers | [33] | |||||
| Sleep time (Higher) | [26] | |||||
| Environmental | Positive Association | Negative Association | No Association | |||
|---|---|---|---|---|---|---|
| SR. PA | Obj. PA | SR. PA | Obj. PA | SR. PA | Obj. PA | |
| Fewer perceived PA barriers | [33] | |||||
| Land use mix- access to services (1 unit increase) | [18] | |||||
| Physical barriers to walking (1 unit increase) | [18] | |||||
| Environmental | Positive Association | Negative Association | No Association | |||
|---|---|---|---|---|---|---|
| SR. PA | Obj. PA | SR.PA | Obj.PA | SR.PA | Obj.PA | |
| Feeling of safety when walking in the neighbourhood (worse) | [36] | |||||
| Years lived at the same address (i.e., neighbourhood familiarity) | [36] | |||||
| Neighbourhood aesthetics | [18] | |||||
Publisher’s Note: MDPI stays neutral with regard to jurisdictional claims in published maps and institutional affiliations. |
© 2021 by the authors. Licensee MDPI, Basel, Switzerland. This article is an open access article distributed under the terms and conditions of the Creative Commons Attribution (CC BY) license (https://creativecommons.org/licenses/by/4.0/).
Share and Cite
Lindsay, R.K.; Di Gennaro, F.; Allen, P.M.; Tully, M.A.; Marotta, C.; Pizzol, D.; Gorely, T.; Barnett, Y.; Smith, L. Correlates of Physical Activity among Adults with Sight Loss in High-Income-Countries: A Systematic Review. Int. J. Environ. Res. Public Health 2021, 18, 11763. https://doi.org/10.3390/ijerph182211763
Lindsay RK, Di Gennaro F, Allen PM, Tully MA, Marotta C, Pizzol D, Gorely T, Barnett Y, Smith L. Correlates of Physical Activity among Adults with Sight Loss in High-Income-Countries: A Systematic Review. International Journal of Environmental Research and Public Health. 2021; 18(22):11763. https://doi.org/10.3390/ijerph182211763
Chicago/Turabian StyleLindsay, Rosie K., Francesco Di Gennaro, Peter M. Allen, Mark A. Tully, Claudia Marotta, Damiano Pizzol, Trish Gorely, Yvonne Barnett, and Lee Smith. 2021. "Correlates of Physical Activity among Adults with Sight Loss in High-Income-Countries: A Systematic Review" International Journal of Environmental Research and Public Health 18, no. 22: 11763. https://doi.org/10.3390/ijerph182211763
APA StyleLindsay, R. K., Di Gennaro, F., Allen, P. M., Tully, M. A., Marotta, C., Pizzol, D., Gorely, T., Barnett, Y., & Smith, L. (2021). Correlates of Physical Activity among Adults with Sight Loss in High-Income-Countries: A Systematic Review. International Journal of Environmental Research and Public Health, 18(22), 11763. https://doi.org/10.3390/ijerph182211763