
Urbanization Affects Soil Microbiome Profile Distribution in the Russian Arctic Region

 , , and
Abstract
:1. Introduction
2. Materials and Methods
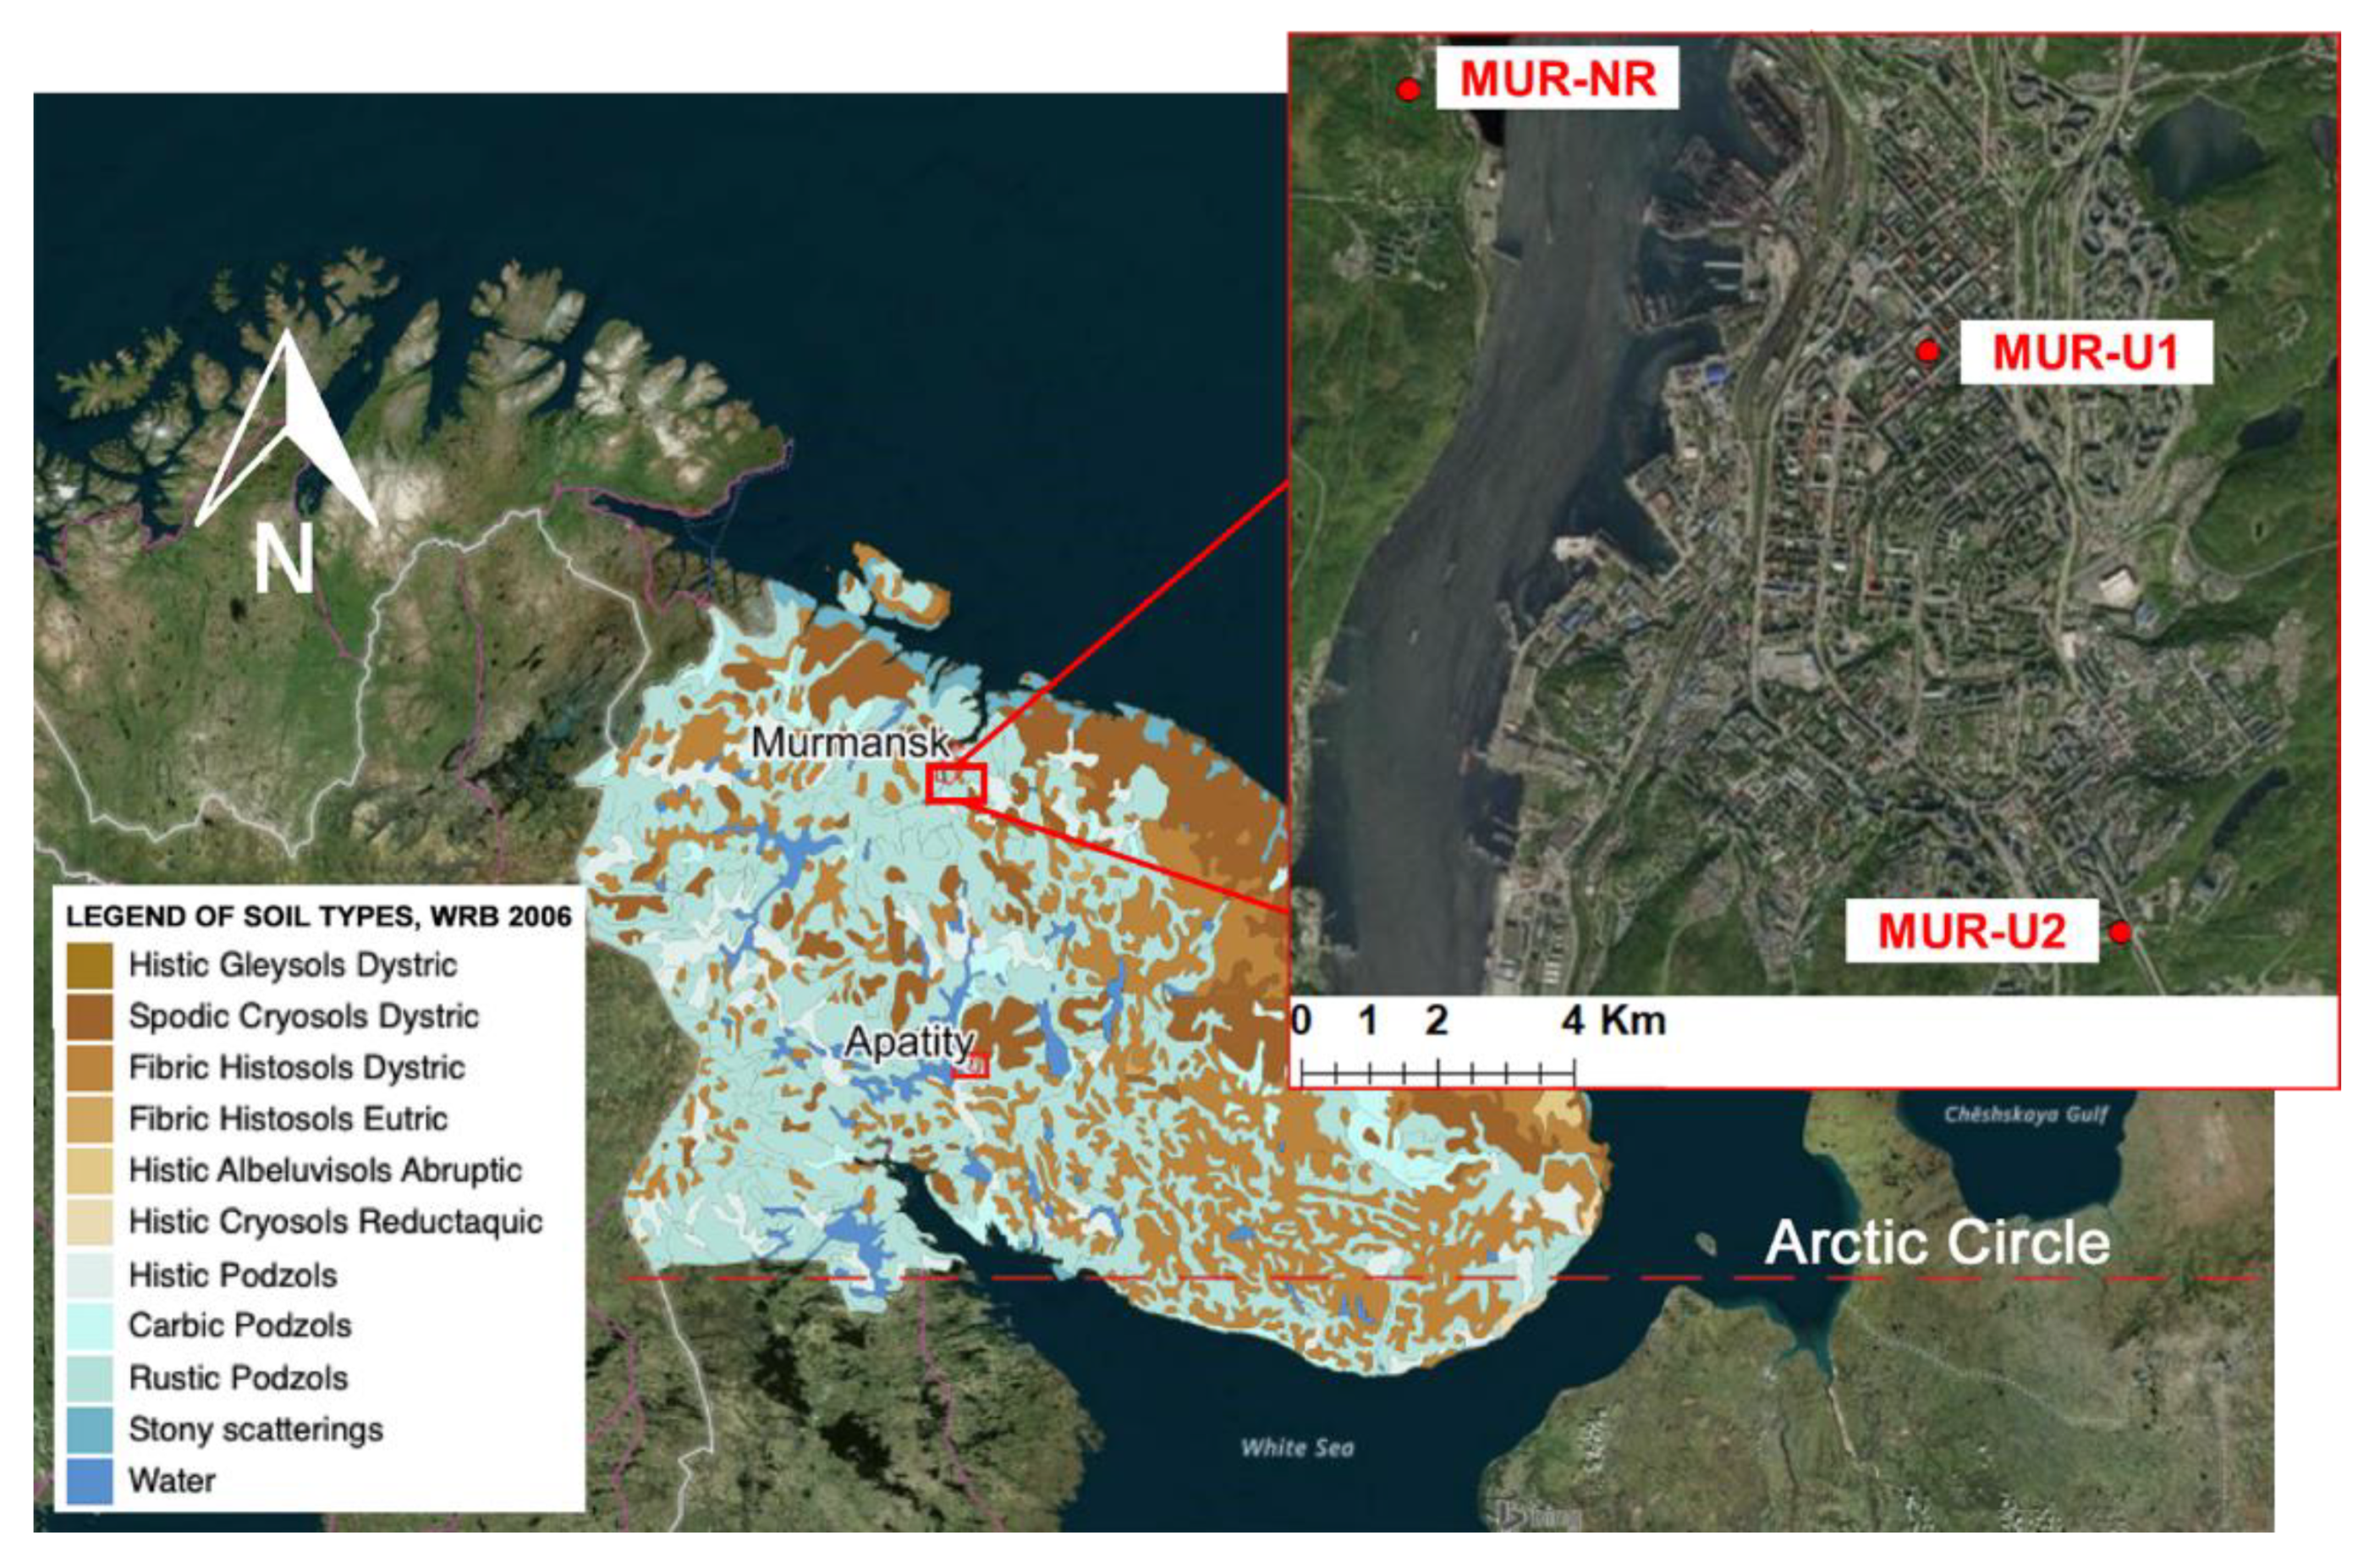
2.1. Research Area
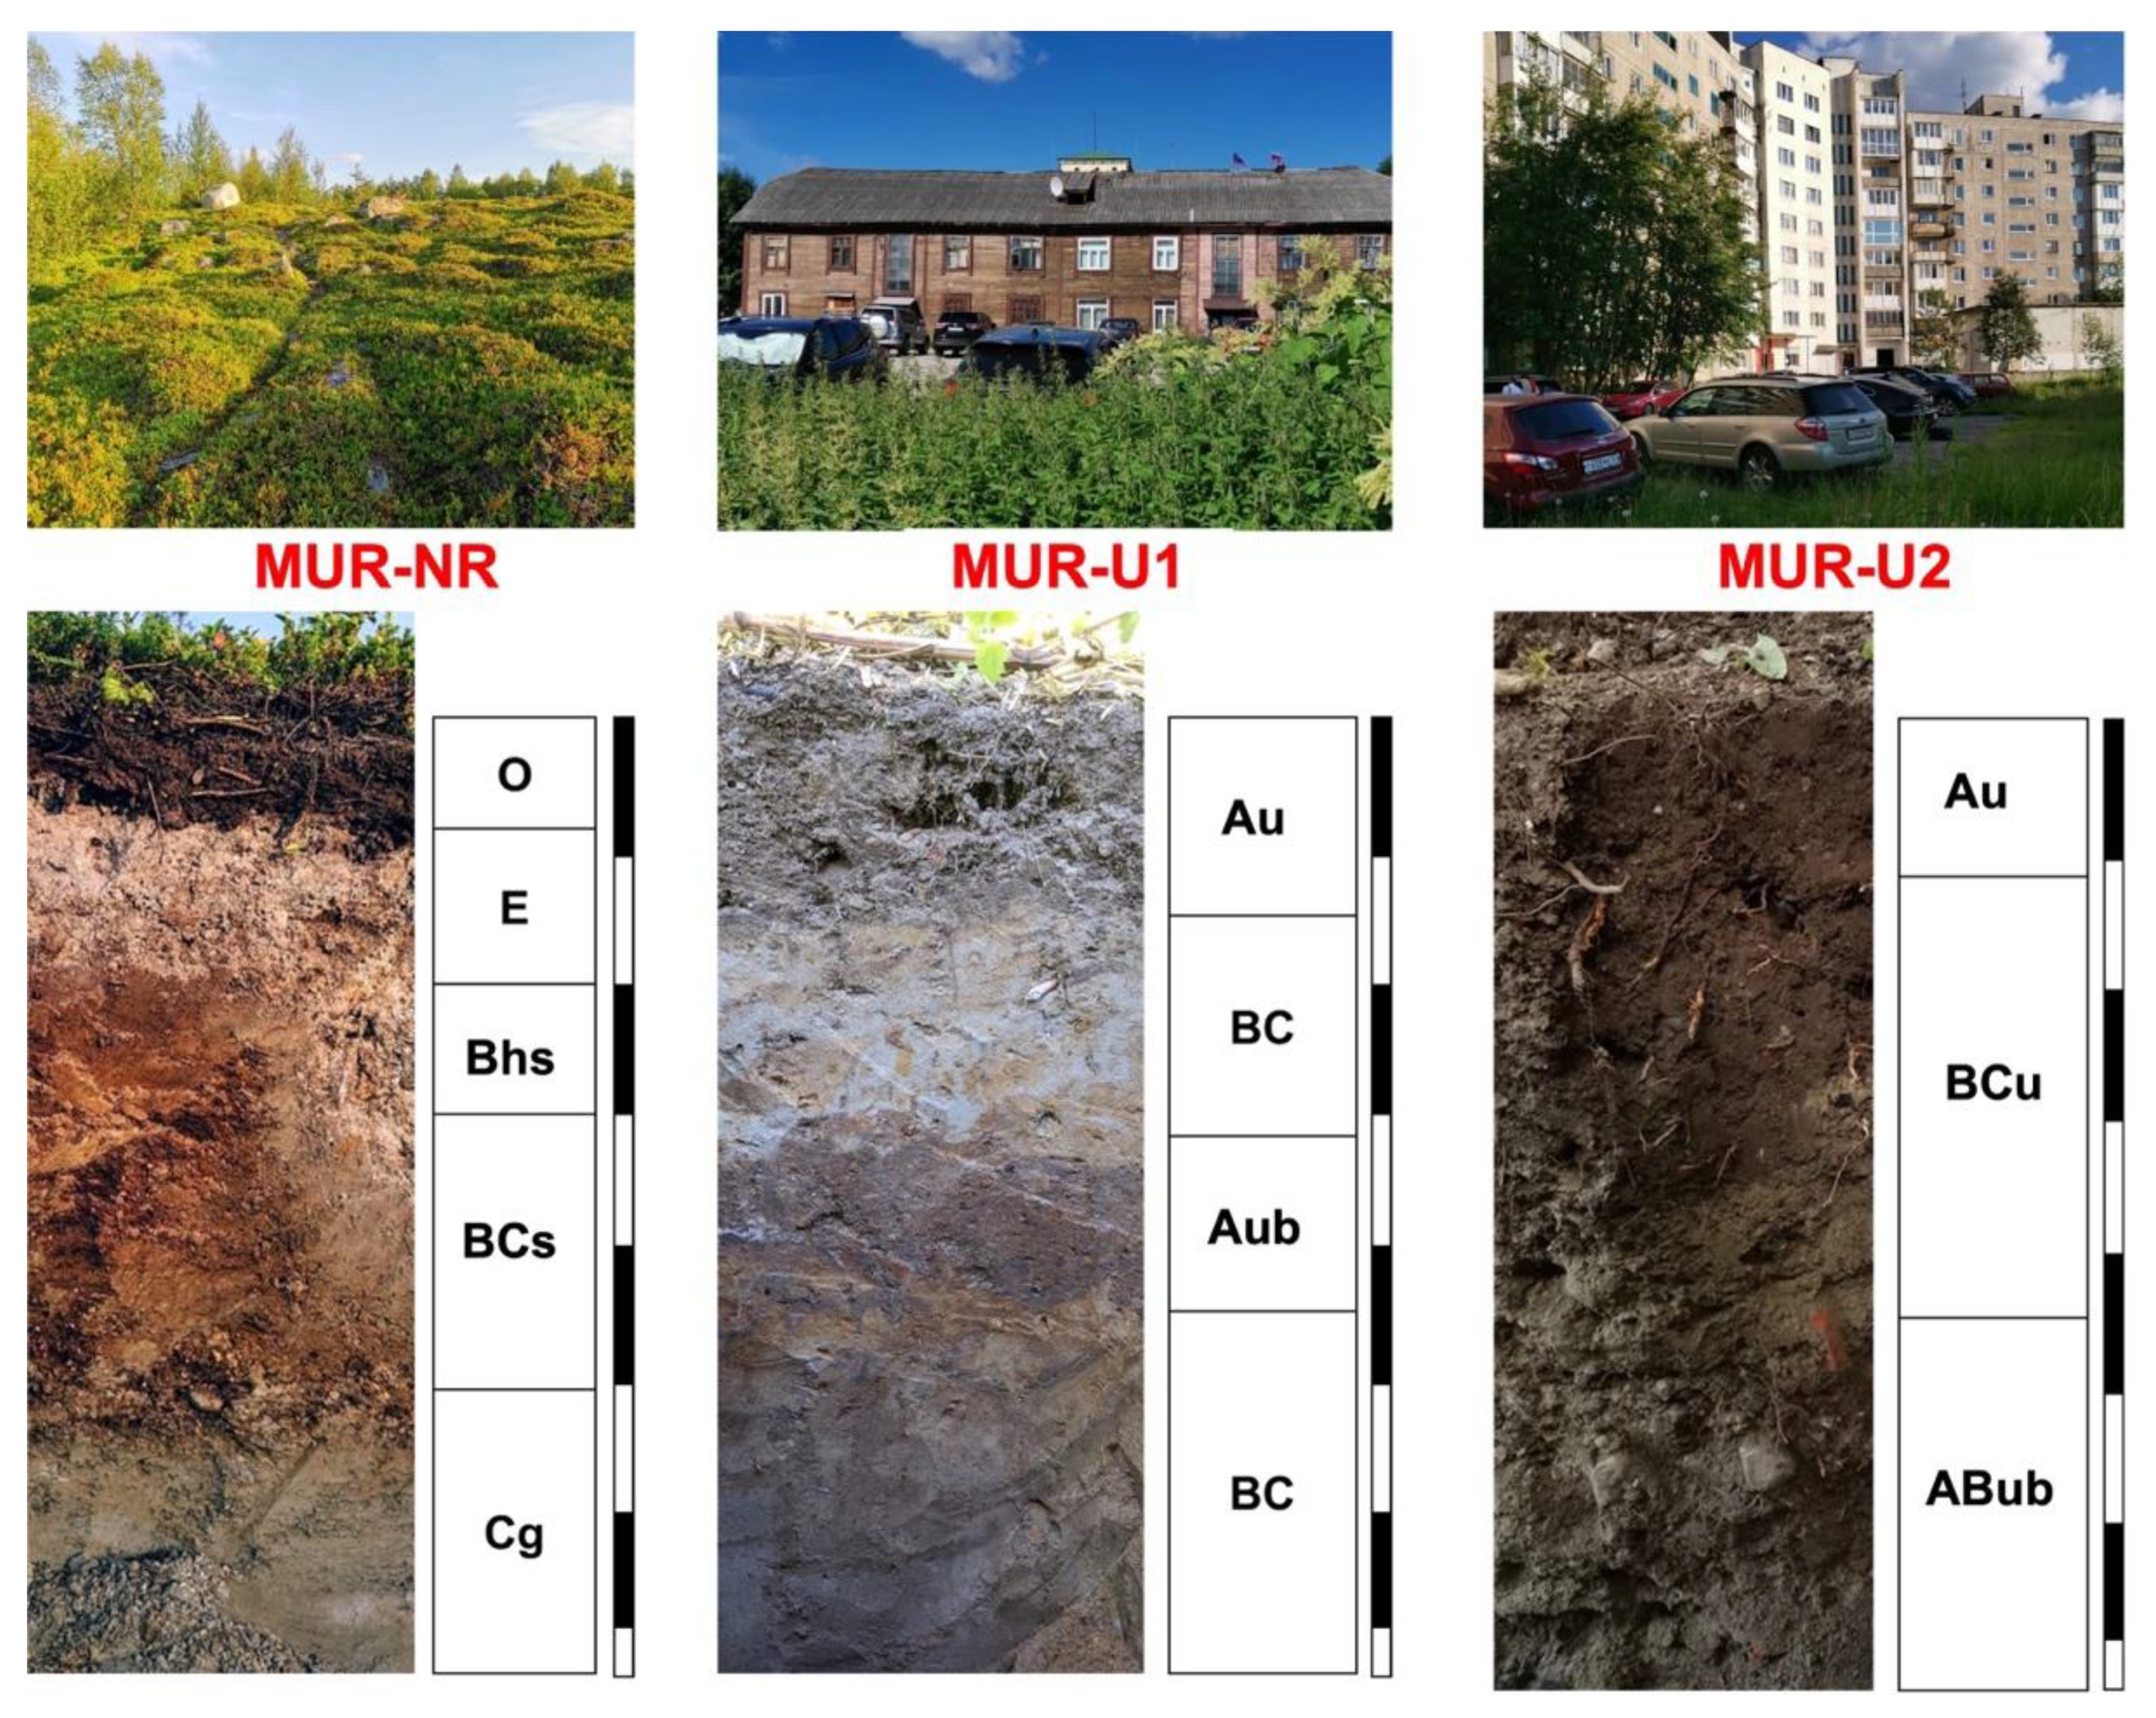
2.2. Soil Survey
2.3. Soil Physical and Chemical Properties
2.4. Soil Microbiological Properties
3. Results
3.1. Soil Morphological and Chemical Properties
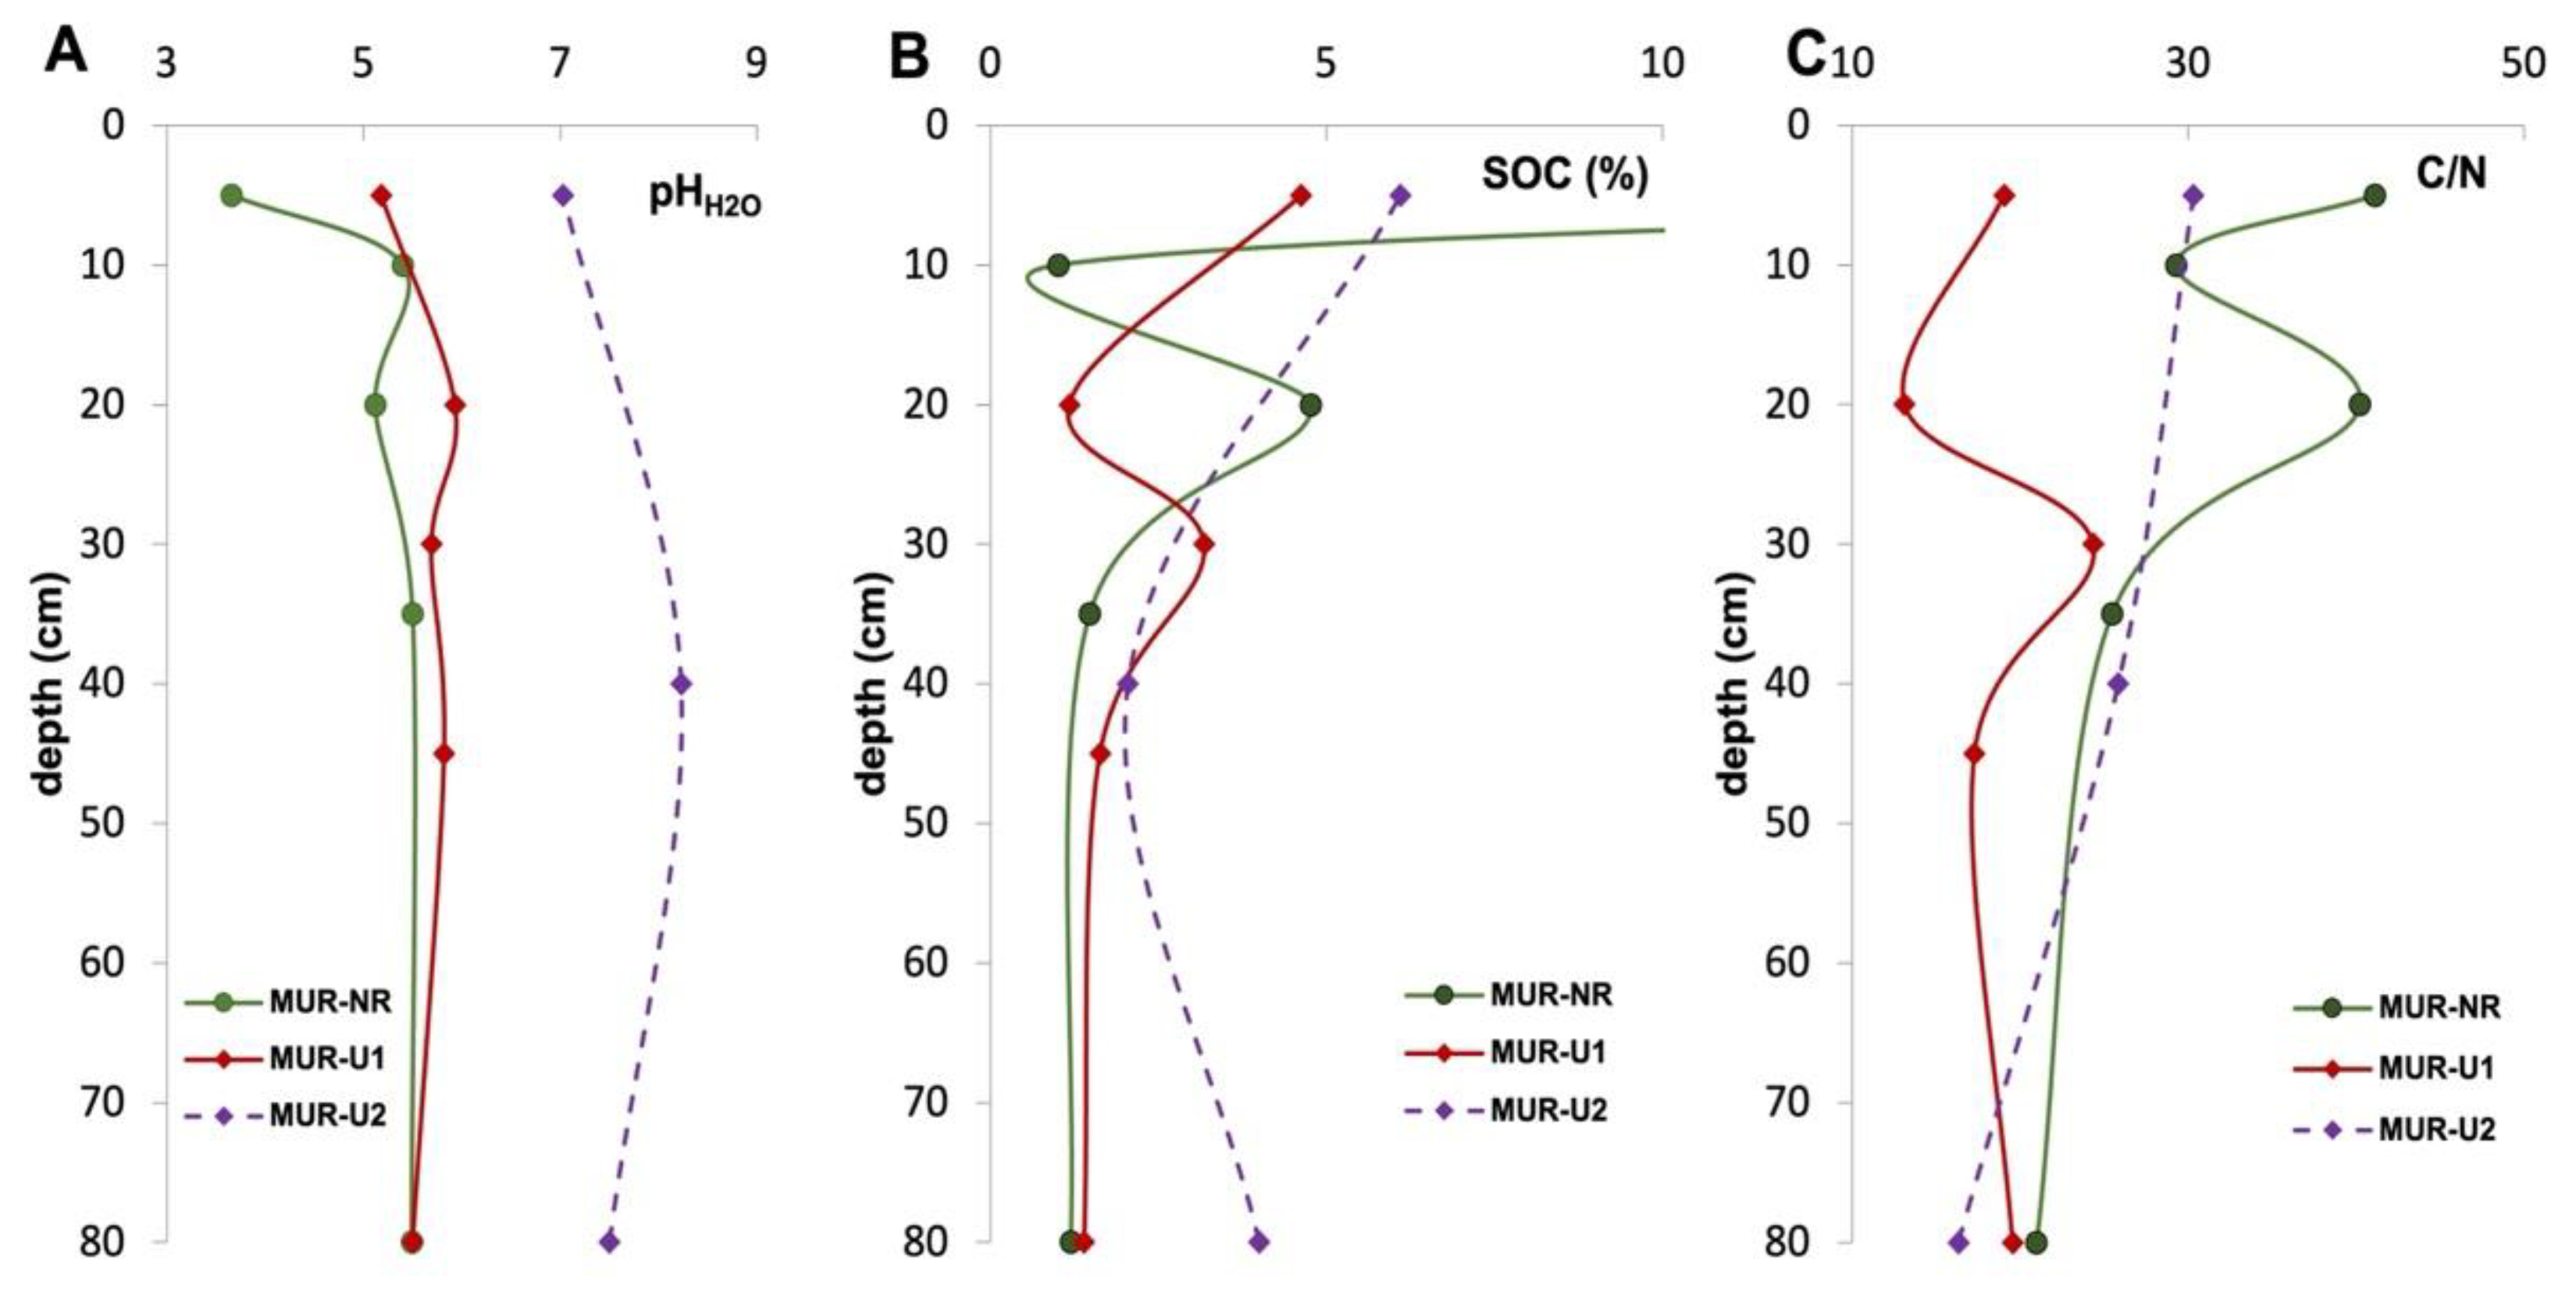
3.2. Chemical Properties
3.3. Microbiological Properties
3.3.1. Number of Gene Copies
Archaea
Bacteria
Fungi
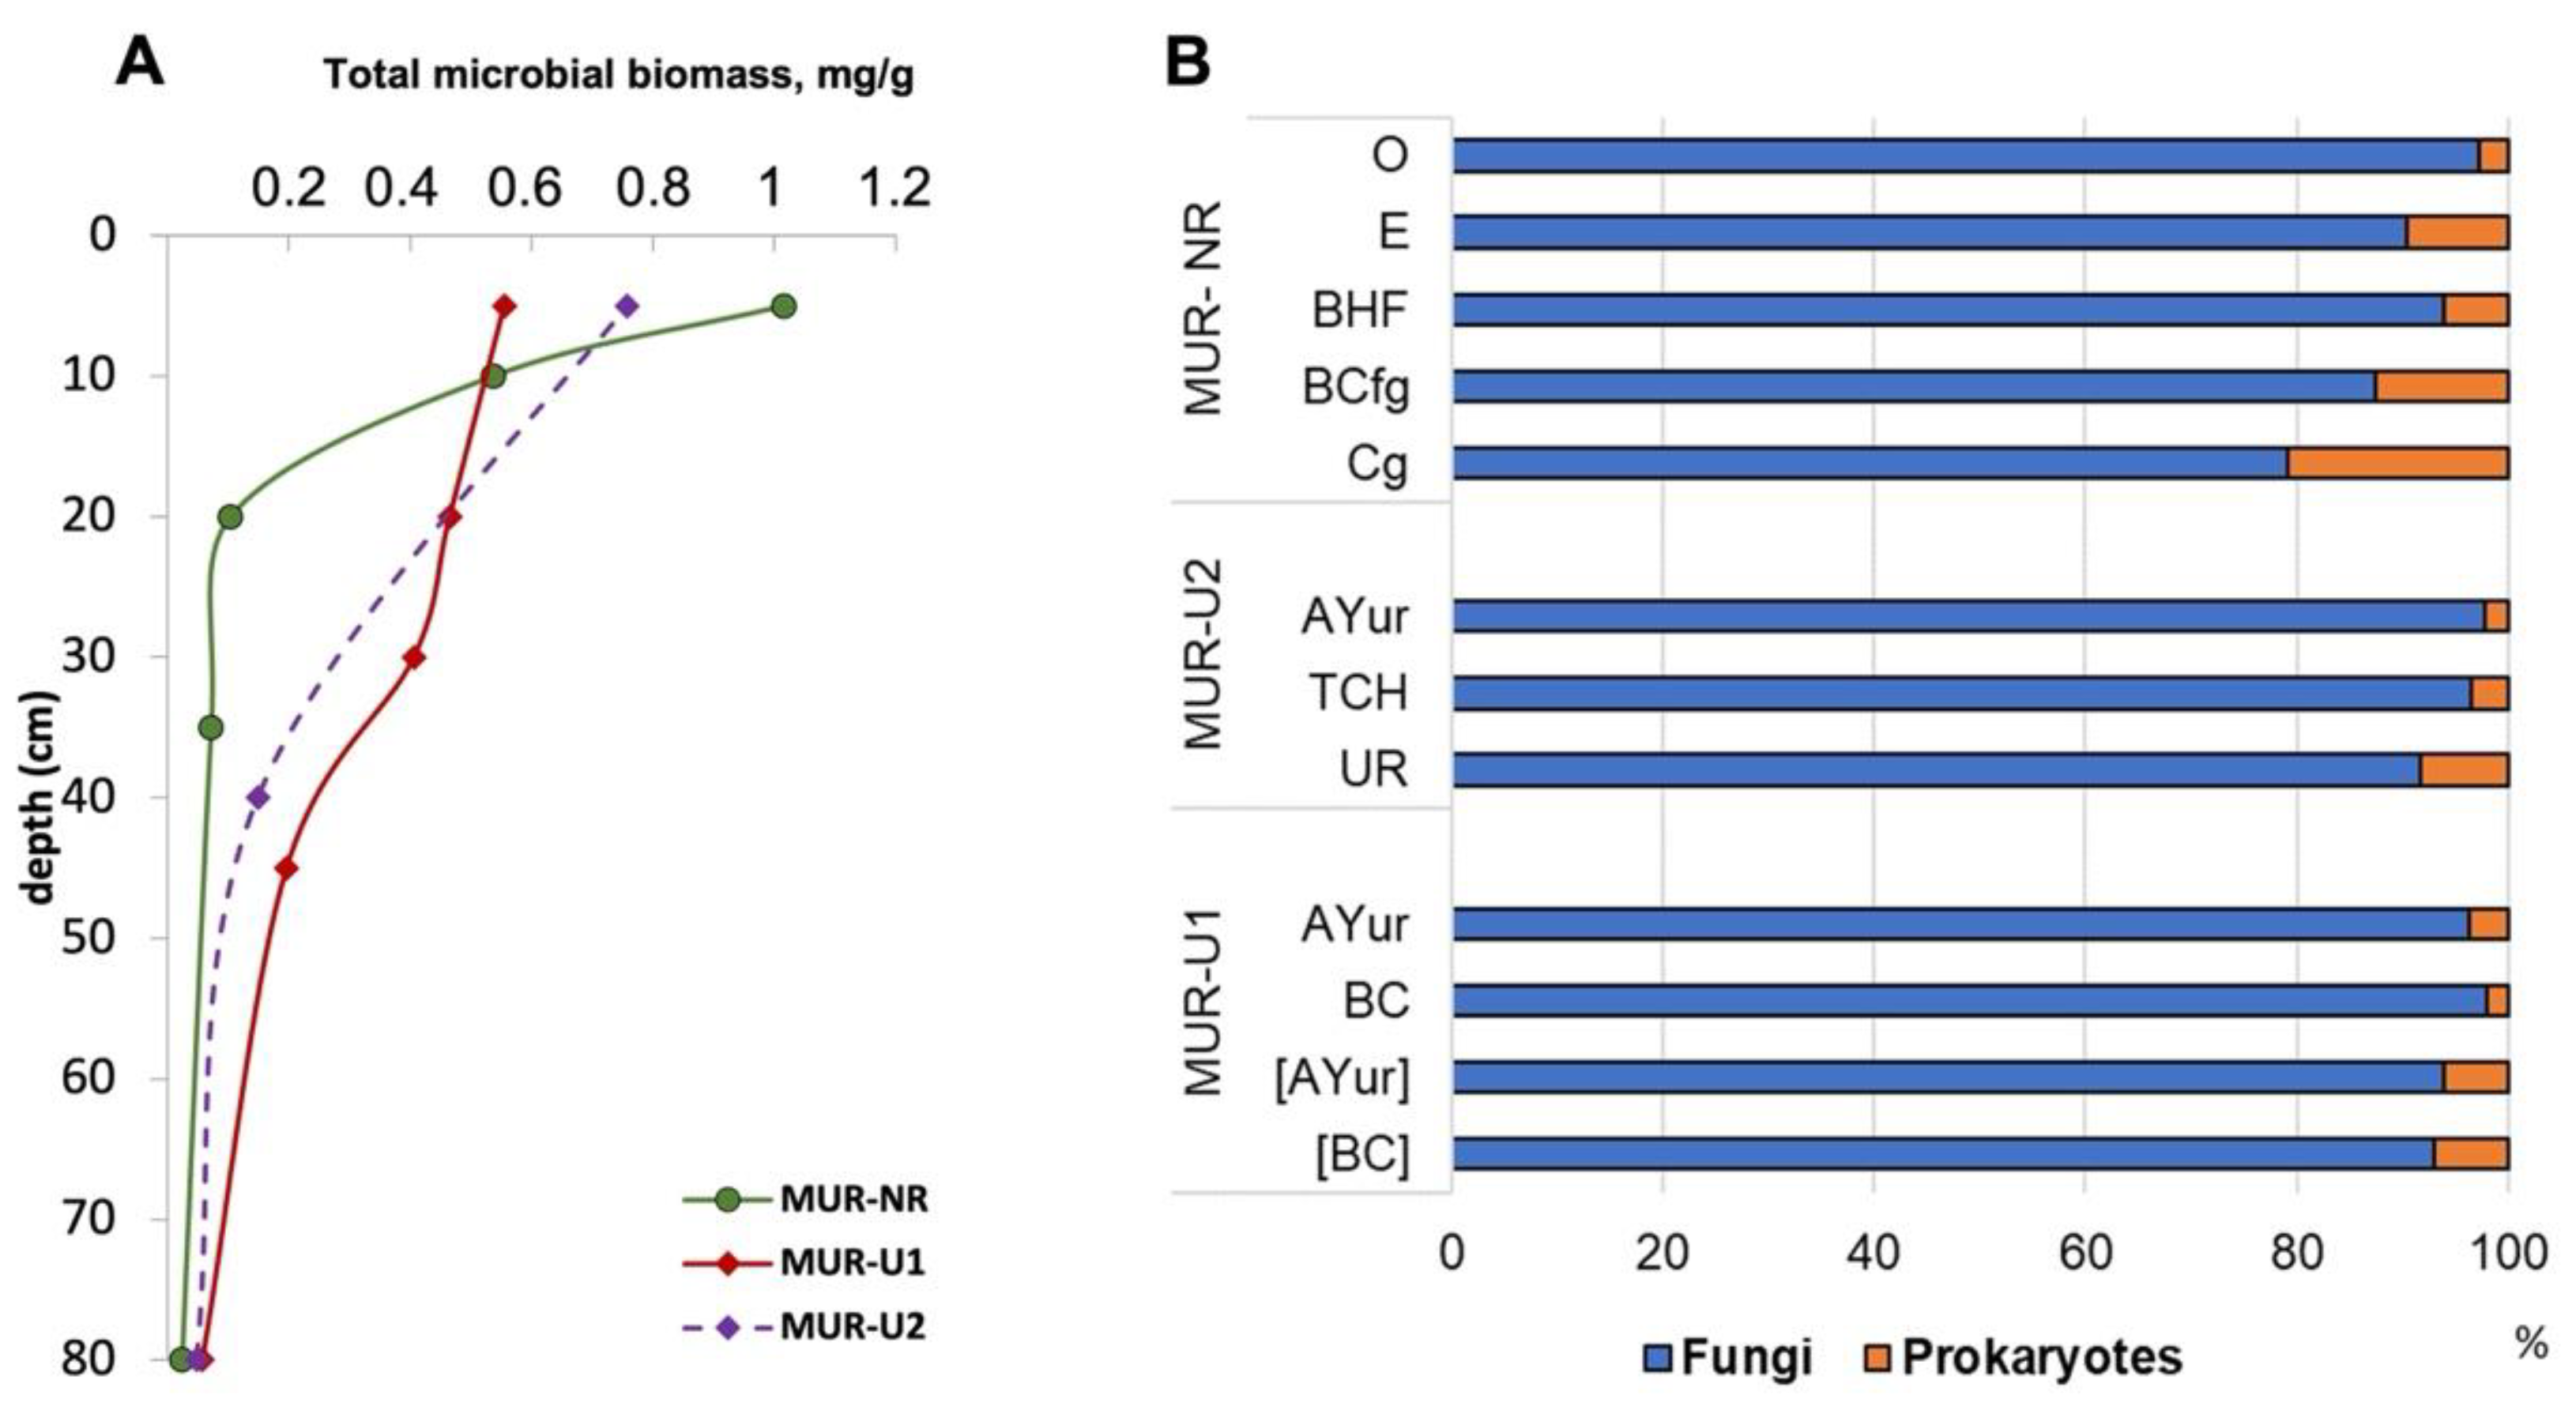
3.3.2. Microbial Biomass
3.3.3. Fungal Biomass
3.3.4. Prokaryote’s Biomass
4. Discussion
4.1. The Effect of Urbanization on Soil Chemical and Microbial Properties in the Arctic
4.2. Subsoil Contribution to Microbiota in Urban and Natural Soils in Subarctic
5. Conclusions
Author Contributions
Funding
Institutional Review Board Statement
Informed Consent Statement
Data Availability Statement
Conflicts of Interest
Disclaimer
References
- Chapin, F.S., III; Jefferies, R.L.; Reynolds, J.F.; Shaver, G.R.; Svoboda, J.; Chu, E.W. Arctic Ecosystems in a Changing Climate: An. Ecophysiological Perspective; Academic Press: San Diego, CA, USA, 2012; p. 468. [Google Scholar]
- Vincent, W.F. Arctic Climate Change: Local Impacts, Global Consequences, and Policy Implications. In The Palgrave Handbook of Arctic Policy and Politics; Coates, K.S., Holroyd, C., Eds.; Palgrave Macmillan: Cham, Germany, 2020; pp. 507–526. [Google Scholar] [CrossRef]
- Masson-Delmotte, V.; Zhai, P.; Pirani, A.; Connors, S.L.; Péan, C.; Berger, S.; Caud, N.; Chen, Y.; Goldfarb, L.; Gomis, M.I.; et al. Climate Change 2021: The Physical Science Basis; Contribution of Working Group I to the Sixth Assessment Report of the Intergovernmental Panel on Climate Change; Cambridge University Press: Cambridge, UK, 2021; p. 42. [Google Scholar]
- Lara, M.J.; Nitze, I.; Grosse, G.; Martin, P.; McGuire, A.D. Reduced arctic tundra productivity linked with landform and climate change interactions. Sci. Rep. 2018, 8, 2345. [Google Scholar] [CrossRef] [PubMed]
- Zubova, E.M.; Kashulin, N.A.; Dauvalter, V.A.; Denisov, D.B.; Valkova, S.A.; Vandysh, O.I.; Slukovskii, Z.I.; Terentyev, P.M.; Cherepanov, A.A. Long-term environmental monitoring in an arctic lake polluted by metals under climate change. Environments 2020, 7, 34. [Google Scholar] [CrossRef]
- Mustonen, T.; Van Dam, B. Towards a shared understanding of Arctic climate change and urgency in Alaska. Geogr. J. 2021, 187, 269–277. [Google Scholar] [CrossRef]
- Fazlioglu, F. Tracing phenology of subarctic plants over the last century. Pol. Polar Res. 2018, 39, 413–424. [Google Scholar] [CrossRef]
- Slukovskaya, M.V.; Vasenev, V.I.; Ivashchenko, K.V.; Morev, D.V.; Drogobuzhskaya, S.V.; Ivanova, L.A.; Kremenetskaya, I.P. Technosols on mining wastes in the subarctic: Efficiency of remediation under Cu-Ni atmospheric pollution. Int. Soil Water Conserv. Res. 2019, 7, 297–307. [Google Scholar] [CrossRef]
- Saltan, N.V.; Sviatkovskaya, E.A. Tree Health of Larix sibirica Ledeb. in the Railway Impact Zone on Kola Peninsula. In Advanced Technologies for Sustainable Development of Urban Green Infrastructure. SSC 2020. Springer Geography; Vasenev, V., Dovletyarova, E., Valentini, R., Cheng, Z., Calfapietra, C., Inostroza, L., Leuchner, M., Eds.; Springer: Cham, Germany, 2021; pp. 1–8. [Google Scholar] [CrossRef]
- Koptsik, S.; Koptsik, G.; Livantsova, S.; Eruslankina, L.; Zhmelkova, T.; Vologdina, Z. Heavy metals in soils near the nickel smelter: Chemistry, spatial variation, and impacts on plant diversity. J. Environ. Monit. 2003, 5, 441–450. [Google Scholar] [CrossRef] [PubMed]
- Polyakov, V.; Petrova, A.; Kozlov, A.; Abakumov, E. Toxicological state and chemical properties of soils in urbanized ecosystems of Murmansk. Czech. Polar Rep. 2018, 8, 230–242. [Google Scholar] [CrossRef]
- Deeb, M.; Groffman, P.M.; Blouin, M.; Egendorf, S.P.; Vergnes, A.; Vasenev, V.; Cao, D.L.; Walsh, D.; Morin, T.; Séré, G. Using constructed soils for green infrastructure—Challenges and limitations. SOIL 2020, 6, 413–434. [Google Scholar] [CrossRef]
- Leguédois, S.; Séré, G.; Auclerc, A.; Cortet, J.; Huot, H.; Ouvrard, S.; Watteau, F.; Schwartz, C.; Morel, J.L. Modelling pedogenesis of Technosols. Geoderma 2016, 262, 199–212. [Google Scholar] [CrossRef]
- Siedt, M.; Schäffer, A.; Smith, K.E.; Nabel, M.; Roß-Nickoll, M.; van Dongen, J.T. Comparing straw, compost, and biochar regarding their suitability as agricultural soil amendments to affect soil structure, nutrient leaching, microbial communities, and the fate of pesticides. Sci. Total Environ. 2021, 751, 141607. [Google Scholar] [CrossRef]
- Hinkel, K.M.; Nelson, F.E.; Klene, A.E.; Bell, J.H. The urban heat island in winter at Barrow, Alaska. Int. J. Climatol. 2003, 23, 1889–1905. [Google Scholar] [CrossRef] [Green Version]
- Konstantinov, P.; Varentsov, M.; Esau, I. A high density urban temperature network deployed in several cities of Eurasian Arctic. Environ. Res. Lett. 2018, 13, 075007. [Google Scholar] [CrossRef]
- Maliszewska-Kordybach, B.; Wilson, M.J. Soil Quality, Sustainable Agriculture and Environmental Security in Central and Eastern Europe, 2nd ed.; Springer Science: Amsterdam, The Netherlands, 2012; p. 375. [Google Scholar] [CrossRef]
- Ananyeva, N.D.; Sushko, S.V.; Ivashchenko, K.V.; Vasenev, V.I. Soil microbial respiration in subtaiga and forest-steppe ecosystems of European Russia: Field and laboratory approaches. Eurasian Soil Sci. 2020, 53, 1492–1501. [Google Scholar] [CrossRef]
- Li, Z.; Tian, D.; Wang, B.; Wang, J.; Wang, S.; Chen, H.Y.; Xu, X.; Wang, C.; He, N.; Niu, S. Microbes drive global soil nitrogen mineralization and availability. Glob. Chang. Biol. 2019, 25, 1078–1088. [Google Scholar] [CrossRef]
- Liu, X.; Koestler, R.J.; Warscheid, T.; Katayama, Y.; Gu, J.D. Microbial deterioration and sustainable conservation of stone monuments and buildings. Nat. Sustain. 2020, 3, 991–1004. [Google Scholar] [CrossRef]
- Basu, S.; Kumar, G.; Chhabra, S.; Prasad, R. Role of soil microbes in biogeochemical cycle for enhancing soil fertility. In New and Future Developments in Microbial Biotechnology and Bioengineering; Verma, J.P., Macdonald, C.A., Gupta, V.K., Podile, A.R., Eds.; Elsevier: Amsterdam, The Netherlands, 2021; pp. 149–157. [Google Scholar] [CrossRef]
- Karimi, B.; Maron, P.A.; Boure, N.C.; Bernard, N.; Gilbert, D.; Ranjard, L. Microbial diversity and ecological networks as indicators of environmental quality. Environ. Chem. Lett. 2017, 15, 265–281. [Google Scholar] [CrossRef]
- Berg, G.; Köberl, M.; Rybakova, D.; Müller, H.; Grosch, R.; Smalla, K. Plant microbial diversity is suggested as the key to future biocontrol and health trends. FEMS Microbiol. Ecol. 2017, 93, fix050. [Google Scholar] [CrossRef]
- Kumar, J.S.; Ponmurugan, P. Microbial Biodiversity, 1st ed.; Cambridge Scholars Publishing: Newcastle upon Tyne, UK, 2020; p. 209. [Google Scholar]
- Turchanovskaya, N.S.; Bogdanova, O.Y. Microbiological study of the soil of Murmansk City. Uspekhi Sovrem. Yestestvoznaniya 2011, 8, 72. (In Russian) [Google Scholar]
- Litvinova, M.Y. Microbiological Analysis of Soil in Recreation Zones of the Murmansk City. In Sovremennyye Ekologo-Biologicheskiye i Khimicheskiye Issledovaniya, Tekhnika i Tekhnologiya Proizvodstv [Modern Ecological, Biological and Chemical Research, Technology and Production Technology], Materialy Mezhdunarodnoy Nauchno-Prakticheskoy Konferentsii [Proceedings of the International Scientific and Practical Conference], Murmansk, Russia, 7 April 2017; Kravets, P.P., Ed.; P.C. Murmanskiy Gosudarstvennyy Tekhnicheskiy Universitet: Murmansk, Russia, 2017; pp. 33–38. (In Russian) [Google Scholar]
- Vlasov, D.Y.; Kirtsideli, I.Y.; Teshebayev, S.B.; Panin, A.L.; Krayeva, L.A.; Ryabusheva, Y.V. Opportunistic microorganisms in soils and grounds in the areas of polar settlements. Uspekhi Meditsinskoy Mikol. 2018, 19, 83–86. (In Russian) [Google Scholar]
- Sherman, C.; Unc, A.; Doniger, T.; Ehrlich, R.; Steinberger, Y. The effect of human trampling activity on a soil microbial community at the Oulanka Natural Reserve, Finland. Appl. Soil Ecol. 2019, 135, 104–112. [Google Scholar] [CrossRef]
- Pereverzev, V.N. Forest Soils of the Kola Peninsula. In Proceedings of the Lesnoye Khozyaystvo i Zelenoye Stroitelstvo v Zapadnoy Sibiri [Forestry and Green Building in Western Siberia], Materialy 3 Mezhdunarodnogo Internet-Seminara [Materials of the 3rd International Webinar], Tomsk, Russia, 1–31 May 2007; Kulizhskiy, S.P., Danchenko, A.M., Bekh, I.A., Danchenko, M.A., Eds.; P.C. Tomskiy Gosudarstvennyy Universitet: Tomsk, Russia, 2007; pp. 225–231. (In Russian). [Google Scholar]
- Lorenz, K.; Kandeler, E. Biochemical characterization of urban soil profiles from Stuttgart, Germany. Soil Biol. Biochem. 2005, 37, 1373–1385. [Google Scholar] [CrossRef]
- Dvornikov, Y.A.; Vasenev, V.I.; Romzaykina, O.N.; Grigorieva, V.E.; Litvinov, Y.A.; Gorbov, S.N.; Dolgikh, A.V.; Korneykova, M.V.; Gosse, D.D. Projecting the urbanization effect on soil organic carbon stocks in polar and steppe areas of European Russia by remote sensing. Geoderma 2021, 399, 115039. [Google Scholar] [CrossRef]
- Peretrukhina, A.T. Sanitary and microbiological studies of soils in Murmansk city and the Murmansk region. Mezhdunarodnyy Zhurnal Eksperiment. Obraz. 2011, 6, 14–16. (In Russian) [Google Scholar]
- Nesterkin, M.G.; Khludneva, N.N. Fertility status of soil in Murmansk region. Dostizheniya Nauk. I Tekhniki APK 2018, 32, 10–14. (In Russian) [Google Scholar] [CrossRef]
- Beck, H.E.; Zimmermann, N.E.; McVicar, T.R.; Vergopolan, N.; Berg, A.; Wood, E.F. Present and future Köppen-Geiger climate classification maps at 1-km resolution. Sci. Data 2018, 5, 1–12. [Google Scholar] [CrossRef] [Green Version]
- Petrova, A.A.; Abakumov, E.V. Content of heavy metals in the soils of the city of Murmansk. Gig. I Sanit. 2019, 98, 478–482. [Google Scholar] [CrossRef]
- Goryachkin, S.V. Soil Cover of the North. (Structure, Genesis, Ecology, Evolution); P.C. GEOS: Moscow, Russia, 2010; p. 414. (In Russian) [Google Scholar]
- FAO. World Reference Base for Soil Resources 2014, update 2015. In International Soil Classification System for Naming Soils and Creating Legends for Soil Maps; World Soil Resources Reports No 106.; Food and Agriculture Organization of the United Nations: Rome, Italy, 2015; p. 203. [Google Scholar]
- ISO 18400-206:2018. In Soil Quality—Sampling—Part. 206: Collection, Handling and Storage of Soil under Aerobic Conditions for the Assessment of Microbiological Processes, Biomass and Diversity in the Laboratory; ISO: Geneva, Switzerland, 2018; p. 10.
- Jahn, R.; Blume, H.P.; Asio, V.B.; Spaargaren, O.; Schad, P. Guidelines for Soil Description, 4th ed.; Food and Agriculture Organization of the United Nations: Rome, Italy, 2006; p. 97. [Google Scholar]
- Rosstandart. In GOST-12536-2014. Soils. Methods of Laboratory Granulometric (Grain-Size) and Microaggregate Distribution; GOST is the Gosudarstvenniy standart [The National Standart]; Rosstandart [Federal Agency for Technical Regulation and Metrology]: Moscow, Russia, 2014; p. 19. (In Russian)
- Vorobyeva, L.A. Chemical Analysis of Soils; P.C. MGU: Moscow, Russia, 1998; p. 272. (In Russian) [Google Scholar]
- Rosstandart. In GOST M-MVI 80-2008. Technique for Performing Measurements of the Mass Fraction of Elements in Samples of Soils, Soils and Bottom Sediments Using Atomic Emission Spectrometry; GOST is the Gosudarstvenniy standart [The National Standart]; Rosstandart [Federal Agency for Technical Regulation and Metrology]: Moscow, Russia, 2008; p. 16. (In Russian)
- Zvyagintsev, D.G. Methods of Soil Microbiology and Biochemistry; P.C. MGU: Moscow, Russia, 1991; p. 304. (In Russian) [Google Scholar]
- Polyanskaya, L.M.; Zvyagintsev, D.G. The content and composition of microbial biomass as an index of the ecological status of soil. Eurasian Soil Sci. 2005, 38, 625–633. [Google Scholar]
- Lorenz, K.; Lal, R. Biogeochemical C and N cycles in urban soils. Environ. Int. 2009, 35, 1–8. [Google Scholar] [CrossRef]
- Vasenev, V.; Kuzyakov, Y. Urban soils as hot spots of anthropogenic carbon accumulation: Review of stocks, mechanisms and driving factors. Land Degrad. Dev. 2018, 29, 1607–1622. [Google Scholar] [CrossRef]
- Ministry of Health, HN-2.1.7.2041-06. Admissible Concentration Limit (ACL) of the Chemical Substances in Soil; HN is the Gigiyenicheskiye normativy [Hygienic regulations]; Minzdrav [Ministry of Health]: Moscow, Russia, 2006; p. 15. (In Russian)
- Ministry of Health. HN-2.1.7.2511-09. Approximate Permissible Concentration (APC) of Chemicals in the Soil; HN is the Gigiyenicheskiye normativy [Hygienic regulations]; Minzdrav [Ministry of Health]: Moscow, Russia, 2009; p. 10. (In Russian) [Google Scholar]
- Bonner, C.; Agnew, A.D.Q. Soil phosphorus as an indicator of canine faecal pollution in urban recreation areas. Environ. Pollut. B Chem. Phys. 1983, 6, 145–156. [Google Scholar] [CrossRef]
- Zhang, M.K.; Ke, Z.X. Heavy metals, phosphorus and some other elements in urban soils of Hangzhou City, China. Pedosphere 2004, 14, 177–185. [Google Scholar]
- Ivashchenko, K.; Ananyeva, N.; Vasenev, V.; Sushko, S.; Seleznyova, A.; Kudeyarov, V. Microbial C-availability and organic matter decomposition in urban soils of megapolis depend on functional zoning. Soil Environ. 2019, 38, 31–41. [Google Scholar] [CrossRef]
- Nizamutdinov, T.; Abakumov, E.; Morgun, E.; Loktev, R.; Kolesnikov, R. Agrochemical and pollution status of urbanized agricultural soils in the central part of yamal region. Energies 2021, 14, 4080. [Google Scholar] [CrossRef]
- Prokof’eva, T.V.; Kiryushin, A.V.; Shishkov, V.A.; Ivannikov, F.A. The importance of dust material in urban soil formation: The experience on study of two young Technosols on dust depositions. J. Soils Sediments 2017, 17, 515–524. [Google Scholar] [CrossRef]
- Bååth, E.; Anderson, T.H. Comparison of soil fungal/bacterial ratios in a pH gradient using physiological and PLFA-based techniques. Soil Biol. Biochem. 2003, 35, 955–963. [Google Scholar] [CrossRef]
- Liu, P.W.G.; Chang, T.C.; Chen, C.H.; Wang, M.Z.; Hsu, H.W. Bioaugmentation efficiency investigation on soil organic matters and microbial community shift of diesel-contaminated soils. Int. Biodeterior. Biodegrad. 2014, 95, 276–284. [Google Scholar] [CrossRef]
- Nizamutdinov, T.; Morgun, E.; Pechkin, A.; Kostecki, J.; Greinert, A.; Abakumov, E. Differentiation of trace metal contamination level between different urban functional zones in permafrost affected soils (The example of several cities in the Yamal Region, Russian arctic). Minerals 2021, 11, 668. [Google Scholar] [CrossRef]
- Dymov, A.A.; Kaverin, D.A.; Gabov, D.N. Properties of soils and soil-like bodies in the Vorkuta area. Eurasian Soil Sci. 2013, 46, 217–224. [Google Scholar] [CrossRef]
- Mgelwa, A.S.; Hu, Y.L.; Xu, W.B.; Ge, Z.Q.; Yu, T.W. Soil carbon and nitrogen availability are key determinants of soil microbial biomass and respiration in forests along urbanized rivers of southern China. Urban. For. Urban. Green. 2019, 43, 126351. [Google Scholar] [CrossRef]
- Elias, E.; Dougherty, M.; Srivastava, P.; Laband, D. The impact of forest to urban land conversion on streamflow, total nitrogen, total phosphorus, and total organic carbon inputs to the converse reservoir, Southern Alabama, USA. Urban. Ecosyst. 2013, 16, 79–107. [Google Scholar] [CrossRef]
- Scharenbroch, B.C.; Lloyd, J.E.; Johnson-Maynard, J.L. Distinguishing urban soils with physical, chemical, and biological properties. Pedobiologia 2005, 49, 283–296. [Google Scholar] [CrossRef]
- Masloboev, V.A.; Makarov, D.V.; Klyuchnikova, E.M. Sustainable development of the mining complex of the Murmansk region: Minimization of man-made impacts on the environment. Ustoychivoye Razvit. Gorn. Territ. 2021, 13, 188–200. (In Russian) [Google Scholar] [CrossRef]
- Yang, J.L.; Yuan, D.G.; Zhao, Y.G.; He, Y.; Zhang, G.L. Stoichiometric relations of C, N, and P in urban top soils in Nanjing, China, and their biogeochemical implications. J. Soils Sediments 2021, 21, 2154–2164. [Google Scholar] [CrossRef]
- Evdokimova, G.A.; Mozgova, N.P. Comparative characterization of microbial biomass in Al–Fe-humus podzols of the Kola Peninsula. Eurasian Soil Sci. 2001, 34, 1305–1312. [Google Scholar]
- Korneykova, M.V. Comparative analysis of the number and structure of the complexes of microscopic fungi in tundra and taiga soils in the north of the Kola Peninsula. Eurasian Soil Sci. 2018, 51, 89–95. [Google Scholar] [CrossRef]
- Korneykova, M.V.; Nikitin, D.A.; Dolgikh, A.V.; Soshina, A.S. Soil mycobiota of the Apatity City (Murmansk region). Mikol. Fitopatol. 2020, 54, 264–277. (In Russian) [Google Scholar] [CrossRef]
- Vodyanitskii, Y.N. Organic matter of urban soils: A review. Eurasian Soil Sci. 2015, 48, 802–811. [Google Scholar] [CrossRef]
- Demyanenko, D.A. Analysis of the Environmental State of the Murmansk Region. In Aktualnyye Problemy i Perspektivy Razvitiya Gosudarstvennoy Statistiki v Sovremennykh Usloviyakh [Current Problems and Prospects for the Development of State Statistics in Modern Conditions], Sbornik Dokladov Mezhdunarodnoy Nauchno-Prakticheskoy Konferentsii, Proceedings of the International Scientific and Practical Conference, Saratov, Russia, 20–22 January 2020; P.C. Saratovskiy Sotsialno-Ekonomicheskiy Institut (filial) FGBOU VO “REU Imeni G.V. Plekhanova”: Saratov, Russia, 2020; pp. 66–69. (In Russian) [Google Scholar]
- Esau, I.; Miles, V.; Soromotin, A.; Sizov, O.; Varentsov, M.; Konstantinov, P. Urban heat islands in the Arctic cities: An updated compilation of in situ and remote-sensing estimations. Adv. Sci. Res. 2021, 18, 51–57. [Google Scholar] [CrossRef]
- Nikitin, D.A.; Lysak, L.V.; Kholod, S.S.; Mergelov, N.S.; Dolgikh, A.V.; Goryachkin, S.V. Biological activity of soils island Severny (Novaya Zemlya). Pochvovedeniye 2021. in print. [Google Scholar]
- Korneykova, M.V.; Nikitin, D.A.; Myazin, V.A. Qualitative and quantitative characteristics of soil microbiome of Barents Sea coast, Kola Peninsula. Microorganisms 2021, 9, 2126. [Google Scholar] [CrossRef]
- Schmidt, N.; Bölter, M. Fungal and bacterial biomass in tundra soils along an arctic transect from Taimyr Peninsula, central Siberia. Polar Biol. 2002, 25, 871–877. [Google Scholar] [CrossRef]
- Nikitin, D.A.; Semenov, M.V.; Semikolennykh, A.A.; Maksimova, I.A.; Kachalkin, A.V.; Ivanova, A.E. Fungal biomass and species diversity of the cultivated mycobiota of soils and substrates of about. Northbrook (Franz Josef Land). Mikol. Fitopatol. 2019, 53, 210–222. (In Russian) [Google Scholar] [CrossRef]
- Nikitin, D.A.; Lysak, L.V.; Mergelov, N.S.; Dolgikh, A.V.; Zazovskaya, E.P.; Goryachkin, S.V. Microbial biomass, carbon stocks, and CO2 emission in soils of Franz Josef land: High-arctic tundra or polar deserts? Eurasian Soil Sci. 2020, 53, 444–462. [Google Scholar] [CrossRef]
- Dubrova, M.S.; Lubsanova, D.A.; Makarova, E.P.; Kozhevin, P.A.; Manucharova, N.A.; Zenova, G.M. Psychrotolerant actinomycetes in soils of the tundra and northern taiga. Mosc. Univ. Soil Sci. Bull. 2011, 66, 45–49. [Google Scholar] [CrossRef]
- Millán-Aguiñaga, N.; Soldatou, S.; Brozio, S.; Munnoch, J.T.; Howe, J.; Hoskisson, P.A.; Duncan, K.R. Awakening ancient polar Actinobacteria: Diversity, evolution and specialized metabolite potential. Microbiology 2019, 165, 1169–1180. [Google Scholar] [CrossRef]
- Kudinova, A.G.; Lysak, L.V.; Soina, V.S.; Mergelov, N.S.; Dolgikh, A.V.; Shorkunov, I.G. Bacterial communities in the soils of cryptogamic barrens of East Antarctica (the Larsemann Hills and Thala Hills oases). Eurasian Soil Sci. 2015, 48, 276–287. [Google Scholar] [CrossRef]
- Lysak, L.V.; Lapygina, E.V. The diversity of bacterial communities in urban soils. Eurasian Soil Sci. 2018, 51, 1050–1056. [Google Scholar] [CrossRef]
- Zhelezova, A.D.; Kutovaya, O.V.; Dmitrenko, V.N.; Thakahova, A.K.; Hohlov, S.F. Estimation of DNA quantity in different groups of microorganisms within genetic horizons of the dark-gray soil. Byulleten Pochvennogo Inst. Im. V.V. Dokuchayeva 2015, 78, 87–98. (In Russian) [Google Scholar]
- Ivanova, E.A.; Pershina, E.V.; Shapkin, V.M.; Kichko, A.A.; Aksenova, T.S.; Kimeklis, A.K.; Gladkov, G.V.; Zverev, A.O.; Vasilyeva, N.A.; Andronov, E.E.; et al. Shifting prokaryotic communities along a soil formation chronosequence and across soil horizons in a South Taiga ecosystem. Pedobiologia 2020, 81, 150650. [Google Scholar] [CrossRef]
- Miller, R.M.; Jastrow, J.D. Mycorrhizal Fungi Influence Soil Structure. In Arbuscular Mycorrhizas: Physiology and Function; Kapulnik, Y., Douds, D.D., Eds.; Springer: Dordrecht, the Netherlands, 2000; pp. 3–18. [Google Scholar] [CrossRef]
- Khabibullina, F.M.; Kuznetsova, E.G.; Vaseneva, I.Z. Micromycetes in podzolic and bog-podzolic soils in the middle taiga subzone of northeastern European Russia. Eurasian Soil Sci. 2014, 47, 1027–1032. [Google Scholar] [CrossRef]
- Ananyeva, N.D.; Polyanskaya, L.M.; Stol’nikova, E.V.; Zvyagintsev, D.G. Fungal to bacterial biomass ratio in the forest soil profile. Izv. Akad. Nauk Ser. Biol. 2010, 3, 308–317. (In Russian) [Google Scholar] [CrossRef]
- Golovchenko, A.V.; Kurakov, A.V.; Semenova, T.A.; Zvyagintsev, D.G. Abundance, diversity, viability, and factorial ecology of fungi in peatbogs. Eurasian Soil Sci. 2013, 46, 74–90. [Google Scholar] [CrossRef]
- Vasenev, V.I.; Stoorvogel, J.J.; Dolgikh, A.V.; Ananyeva, N.D.; Ivashchenko, K.V.; Valentini, R. Changes in soil organic carbon stocks by urbanization. In Urban Soils, 1st ed.; Lal, R., Stewart, B.A., Eds.; CRC Press: Boca Raton, FL, USA, 2017; pp. 61–92. [Google Scholar] [CrossRef]
- Mazurek, R.; Kowalska, J.; Gasiorek, M.; Setlak, M. Micromorphological and physico-chemical analyses of cultural layers in the urban soil of a medieval city—A case study from Krakow, Poland. Catena 2016, 141, 73–84. [Google Scholar] [CrossRef]
- Dolgikh, A.V.; Aleksandrovskii, A.L. Soils and cultural layers in Velikii Novgorod. Eurasian Soil Sci. 2010, 43, 477–487. [Google Scholar] [CrossRef]
- Raciti, S.M.; Groffman, P.M.; Fahey, T.J. Nitrogen retention in urban lawns and forests. Ecol. Appl. 2008, 18, 1615–1626. [Google Scholar] [CrossRef] [PubMed]
- Semenov, M.V.; Chernov, T.I.; Tkhakakhova, A.K.; Zhelezova, A.D.; Ivanova, E.A.; Kolganova, T.V.; Kutovaya, O.V. Distribution of prokaryotic communities throughout the Chernozem profiles under different land uses for over a century. Appl. Soil Ecol. 2018, 127, 8–18. [Google Scholar] [CrossRef]


| Target Group of Process | Target Gene | Primer Name | Primer Sequence (F, R) | Standard Source | Reference |
|---|---|---|---|---|---|
| Total Bacteria | 16s rRNA | Eub338 Eub518 | ACCTCTACGGGAGGCAGCAG ATTACCGCGGCTGCTGCTGG | Escherichia coli | Fierer et al., 2005 |
| Total Archea | 16s rRNA | 915f 1059r | AGGAA TTGGC GGGGG AGCAC GCCAT GCACC WCCTC T | Strain FG08 Halobacterium salinarum | Yu et al., 2005 |
| Total Fungi | ITS region | ITS1f 5.8 s | TCC GTA GGT GAA CCT GCG G CGC TGC GTT CTT CAT CG | Saccharomyces cerevisiae Meyen 1B-D1606 | Fierer et al., 2005 |
| Horizon | BD (g cm−3) | P (mg kg−1) | K (mg kg−1) | Heavy Metals (mg kg−1) | |||||
|---|---|---|---|---|---|---|---|---|---|
| Pb | Zn | Co | Cd | Cu | Ni | ||||
| MUR-NR | |||||||||
| O | 0.16 | 348 | 75 | 34.5 | 50.9 | 3.3 | 0.12 | 21.9 | 29.8 |
| E | 1.45 | 64 | 64 | 24.5 | 13.8 | 2.3 | 0.3 | 1.1 | 7.4 |
| Bhs | 1.2 | 554 | 65 | 29.2 | 48.2 | 9.1 | 0.25 | 9.4 | 22.5 |
| BCs | 1.22 | 260 | 57 | 31.5 | 60.3 | 14.9 | 0.55 | 11.2 | 39.5 |
| Cg | 1.62 | 675 | 44 | 22.7 | 59.6 | 15.8 | 0.31 | 27.9 | 44.3 |
| MUR-U1 | |||||||||
| Au | 0.9 | 1054 | 84 | 66 | 149.8 | 13.5 | 0.39 | 20.3 | 38.4 |
| BC | 1.38 | 1002 | 64 | 21.7 | 58.1 | 11.8 | 0.35 | 6.1 | 26.3 |
| Aub | 1.35 | 401 | 55 | 32.4 | 94.2 | 11.4 | 0.37 | 30.4 | 25.5 |
| BC | 1.34 | 428 | 105 | 24.4 | 102.1 | 10.8 | 0.42 | 8.2 | 29.6 |
| C | 1.6 | 550 | 50 | 20 | 60 | 11 | 0.3 | 9 | 28 |
| MUR-U2 | |||||||||
| Au | 0.85 | 669 | 121 | 35.8 | 136.2 | 15.2 | 0.3 | 22.7 | 44.7 |
| BCu | 1.41 | 340 | 102 | 22.3 | 65.7 | 13.5 | 0.17 | 16.1 | 37.8 |
| ABub | 1.5 | 610 | 110 | 25 | 80 | 15 | 0.25 | 22 | 45 |
| Horizon (Depth, cm) | Total Biomass of Fungi, µg/g | Biomass of Mycelium, µg/g (d = 3 µ) | Biomass of Spores, µg/g | Share of Mycelium in the Total Biomass, % | Number of Spores (Diameter, µ) | |||
|---|---|---|---|---|---|---|---|---|
| 2, Unit/g × 104 | 3, Unit/g × 104 | 5, Unit/g × 103 | 7, Unit/g × 103 | |||||
| MUR-U1 | ||||||||
| Au (0–10) | 0.535 ± 0.096 | 0.324 ± 0.038 | 0.211 ± 0.038 | 60.6 | 27.62 ± 3.79 | 9.03 ± 1.24 | 1.39 ± 0.24 | - |
| BC (10–35) | 0.456 ± 0.082 | 0.347 ± 0.041 | 0.109 ± 0.020 | 76.1 | 13.38 ± 1.84 | 5.49 ± 0.74 | - | - |
| Aub (35–45) | 0.391 ± 0.070 | 0.213 ± 0.025 | 0.178 ± 0.032 | 54.5 | 10.36 ± 1.42 | 12.26 ± 1.70 | - | - |
| BC (45–55) | 0.189 ± 0.034 | 0.100 ± 0.012 | 0.089 ± 0.016 | 52.9 | 13.38 ± 1.84 | 3.87 ± 0.51 | - | - |
| C (55–90) | 0.053 ± 0.009 | 0.015 ± 0.002 | 0.038 ± 0.007 | 28.3 | 6.905 ± 0.948 | 1.29 ± 0.14 | - | - |
| MUR-U2 | ||||||||
| Au (0–10) | 0.741 ± 0.133 | 0.418 ± 0.049 | 0.323 ± 0.058 | 56.4 | 11.22 ± 1.54 | 16.13 ± 2.24 | 2.78 ± 0.47 | 0.693 ± 0.124 |
| BCu (10–55) | 0.141 ± 0.025 | 0.068 ± 0.008 | 0.073 ± 0.013 | 48.2 | 8.632 ± 1.18 | 3.87 ± 0.54 | - | - |
| ABub (55–90) | 0.044 ± 0.008 | 0.022 ± 0.003 | 0.022 ± 0.004 | 50.0 | 4.316 ± 0.592 | 0.645 ± 0.090 | - | - |
| MUR-NR | ||||||||
| O (0–7) | 0.992 ± 0.179 | 0.733 ± 0.086 | 0.259 ± 0.047 | 73.9 | 12.52 ± 1.77 | 16.42 ± 2.28 | 3.13 ± 0.54 | 1.04 ± 0.190 |
| E (7–20) | 0.522 ± 0.094 | 0.344 ± 0.040 | 0.178 ± 0.032 | 65.9 | 17.26 ± 2.44 | 9.67 ± 1.34 | 1.04 ± 0.18 | - |
| Bhs (20–30) | 0.094 ± 0.017 | 0.025 ± 0.003 | 0.069 ± 0.012 | 26.6 | 9.500 ± 1.34 | 3.22 ± 0.45 | - | - |
| BCs (30–55) | 0.063 ± 0.011 | 0.029 ± 0.003 | 0.034 ± 0.006 | 46.0 | 0.333 ± 0.047 | 2.90 ± 0.40 | - | - |
| Cg (55–90) | 0.019 ± 0.003 | - | 0.019 ± 0.003 | 0.0 | 0.194 ± 0.027 | 1.61 ± 0.22 | - | - |
| Horizon (Depth, cm) | Number, Unit/g, ×108 | Biomass of Oligocellular Prokaryotes, µg/g of Soil | Length of Actinomycetes Mycelium, m/g | Biomass of Actinomycetes Mycelium, µg/g | Portion of Mycelium in the Total Biomass, % | Total Prokaryotes Biomass, µg/g of Soil | Average Prokaryotes Biomass in the Soil Profile, µg/g of Soil |
|---|---|---|---|---|---|---|---|
| MUR-U1 | |||||||
| Au (0–10) | 8.38 ± 1.23 | 17.66 ± 2.66 | 71.46 ± 10.8 | 2.67 ± 0.45 | 13.1 | 20.33 ± 3.66 | 11.03 ± 1.99 |
| BC (10–35) | 4.21 ± 0.62 | 8.87 ± 1.33 | 1.04 ± 0.16 | 0.038 ± 0.0064 | 0.4 | 8.90 ± 1.60 | |
| Aub (35–45) | 6.33 ± 0.93 | 13.33 ± 2.00 | 40.14 ± 6.07 | 1.50 ± 0.25 | 10.1 | 14.83 ± 2.67 | |
| BC (45–55) | 3.27 ± 0.48 | 6.88 ± 1.04 | 7.76 ± 1.17 | 0.29 ± 0.05 | 4.0 | 7.17 ± 1.29 | |
| C (55–90) | 1.86 ± 0.27 | 3.94 ± 0.59 | - | - | 0.0 | 3.94 ± 0.59 | |
| MUR-U2 | |||||||
| Au (0–10) | 6.80 ± 1.00 | 14.32 ± 2.16 | 75.06 ± 11.35 | 2.55 ± 0.43 | 15.1 | 16.87 ± 3.04 | 9.64 ± 1.74 |
| BCu (10–55) | 3.82 ± 0.56 | 8.05 ± 1.21 | 4.71 ± 0.71 | 0.16 ± 0.03 | 2.0 | 8.21 ± 1.48 | |
| ABub (55–90) | 1.86 ± 027 | 3.85 ± 0.58 | - | - | 0.0 | 3.85 ± 0.58 | |
| MUR-NR | |||||||
| O (0–7) | 10.91 ± 1.60 | 22.97 ± 3.45 | 54.82 ± 8.29 | 1.86 ± 0.31 | 7.49 | 24.83 ± 4.47 | 13.51 ± 2.43 |
| E (7–20) | 5.79 ± 0.85 | 12.20 ± 1.84 | 83.82 ± 12.68 | 2.84 ± 0.48 | 18.9 | 15.04 ± 2.71 | |
| Bhs (20–30) | 5.05 ± 0.74 | 10.65 ± 1.60 | 4.07 ± 0.62 | 0.14 ± 0.02 | 1.3 | 10.79 ± 1.94 | |
| BCs (30–55) | 4.13 ± 1.84 | 8.70 ± 1.31 | 11.45 ± 1.73 | 0.39 ± 0.07 | 4.29 | 9.09 ± 1.64 | |
| Cg (55–90) | 2.46 ± 1.09 | 5.20 ± 0.78 | 2.42 ± 0.37 | 0.08 ± 0.13 | 1.5 | 5.28 ± 0.95 | |
Publisher’s Note: MDPI stays neutral with regard to jurisdictional claims in published maps and institutional affiliations. |
© 2021 by the authors. Licensee MDPI, Basel, Switzerland. This article is an open access article distributed under the terms and conditions of the Creative Commons Attribution (CC BY) license (https://creativecommons.org/licenses/by/4.0/).
Share and Cite
Korneykova, M.V.; Vasenev, V.I.; Nikitin, D.A.; Soshina, A.S.; Dolgikh, A.V.; Sotnikova, Y.L. Urbanization Affects Soil Microbiome Profile Distribution in the Russian Arctic Region. Int. J. Environ. Res. Public Health 2021, 18, 11665. https://doi.org/10.3390/ijerph182111665
Korneykova MV, Vasenev VI, Nikitin DA, Soshina AS, Dolgikh AV, Sotnikova YL. Urbanization Affects Soil Microbiome Profile Distribution in the Russian Arctic Region. International Journal of Environmental Research and Public Health. 2021; 18(21):11665. https://doi.org/10.3390/ijerph182111665
Chicago/Turabian StyleKorneykova, Maria V., Viacheslav I. Vasenev, Dmitry A. Nikitin, Anastasia S. Soshina, Andrey V. Dolgikh, and Yulia L. Sotnikova. 2021. "Urbanization Affects Soil Microbiome Profile Distribution in the Russian Arctic Region" International Journal of Environmental Research and Public Health 18, no. 21: 11665. https://doi.org/10.3390/ijerph182111665
APA StyleKorneykova, M. V., Vasenev, V. I., Nikitin, D. A., Soshina, A. S., Dolgikh, A. V., & Sotnikova, Y. L. (2021). Urbanization Affects Soil Microbiome Profile Distribution in the Russian Arctic Region. International Journal of Environmental Research and Public Health, 18(21), 11665. https://doi.org/10.3390/ijerph182111665