
Health and Economic Impacts Assessment of O3 Exposure in Mexico

 , and
, and
Abstract
:1. Introduction
2. Materials and Methods
2.1. Air Pollution Data
2.2. Cities Selection and Population Exposure
2.3. Concentration–Response Function
2.4. Health and Demographic Data
2.5. Avoidable Deaths
2.6. Economic Assessment
3. Results
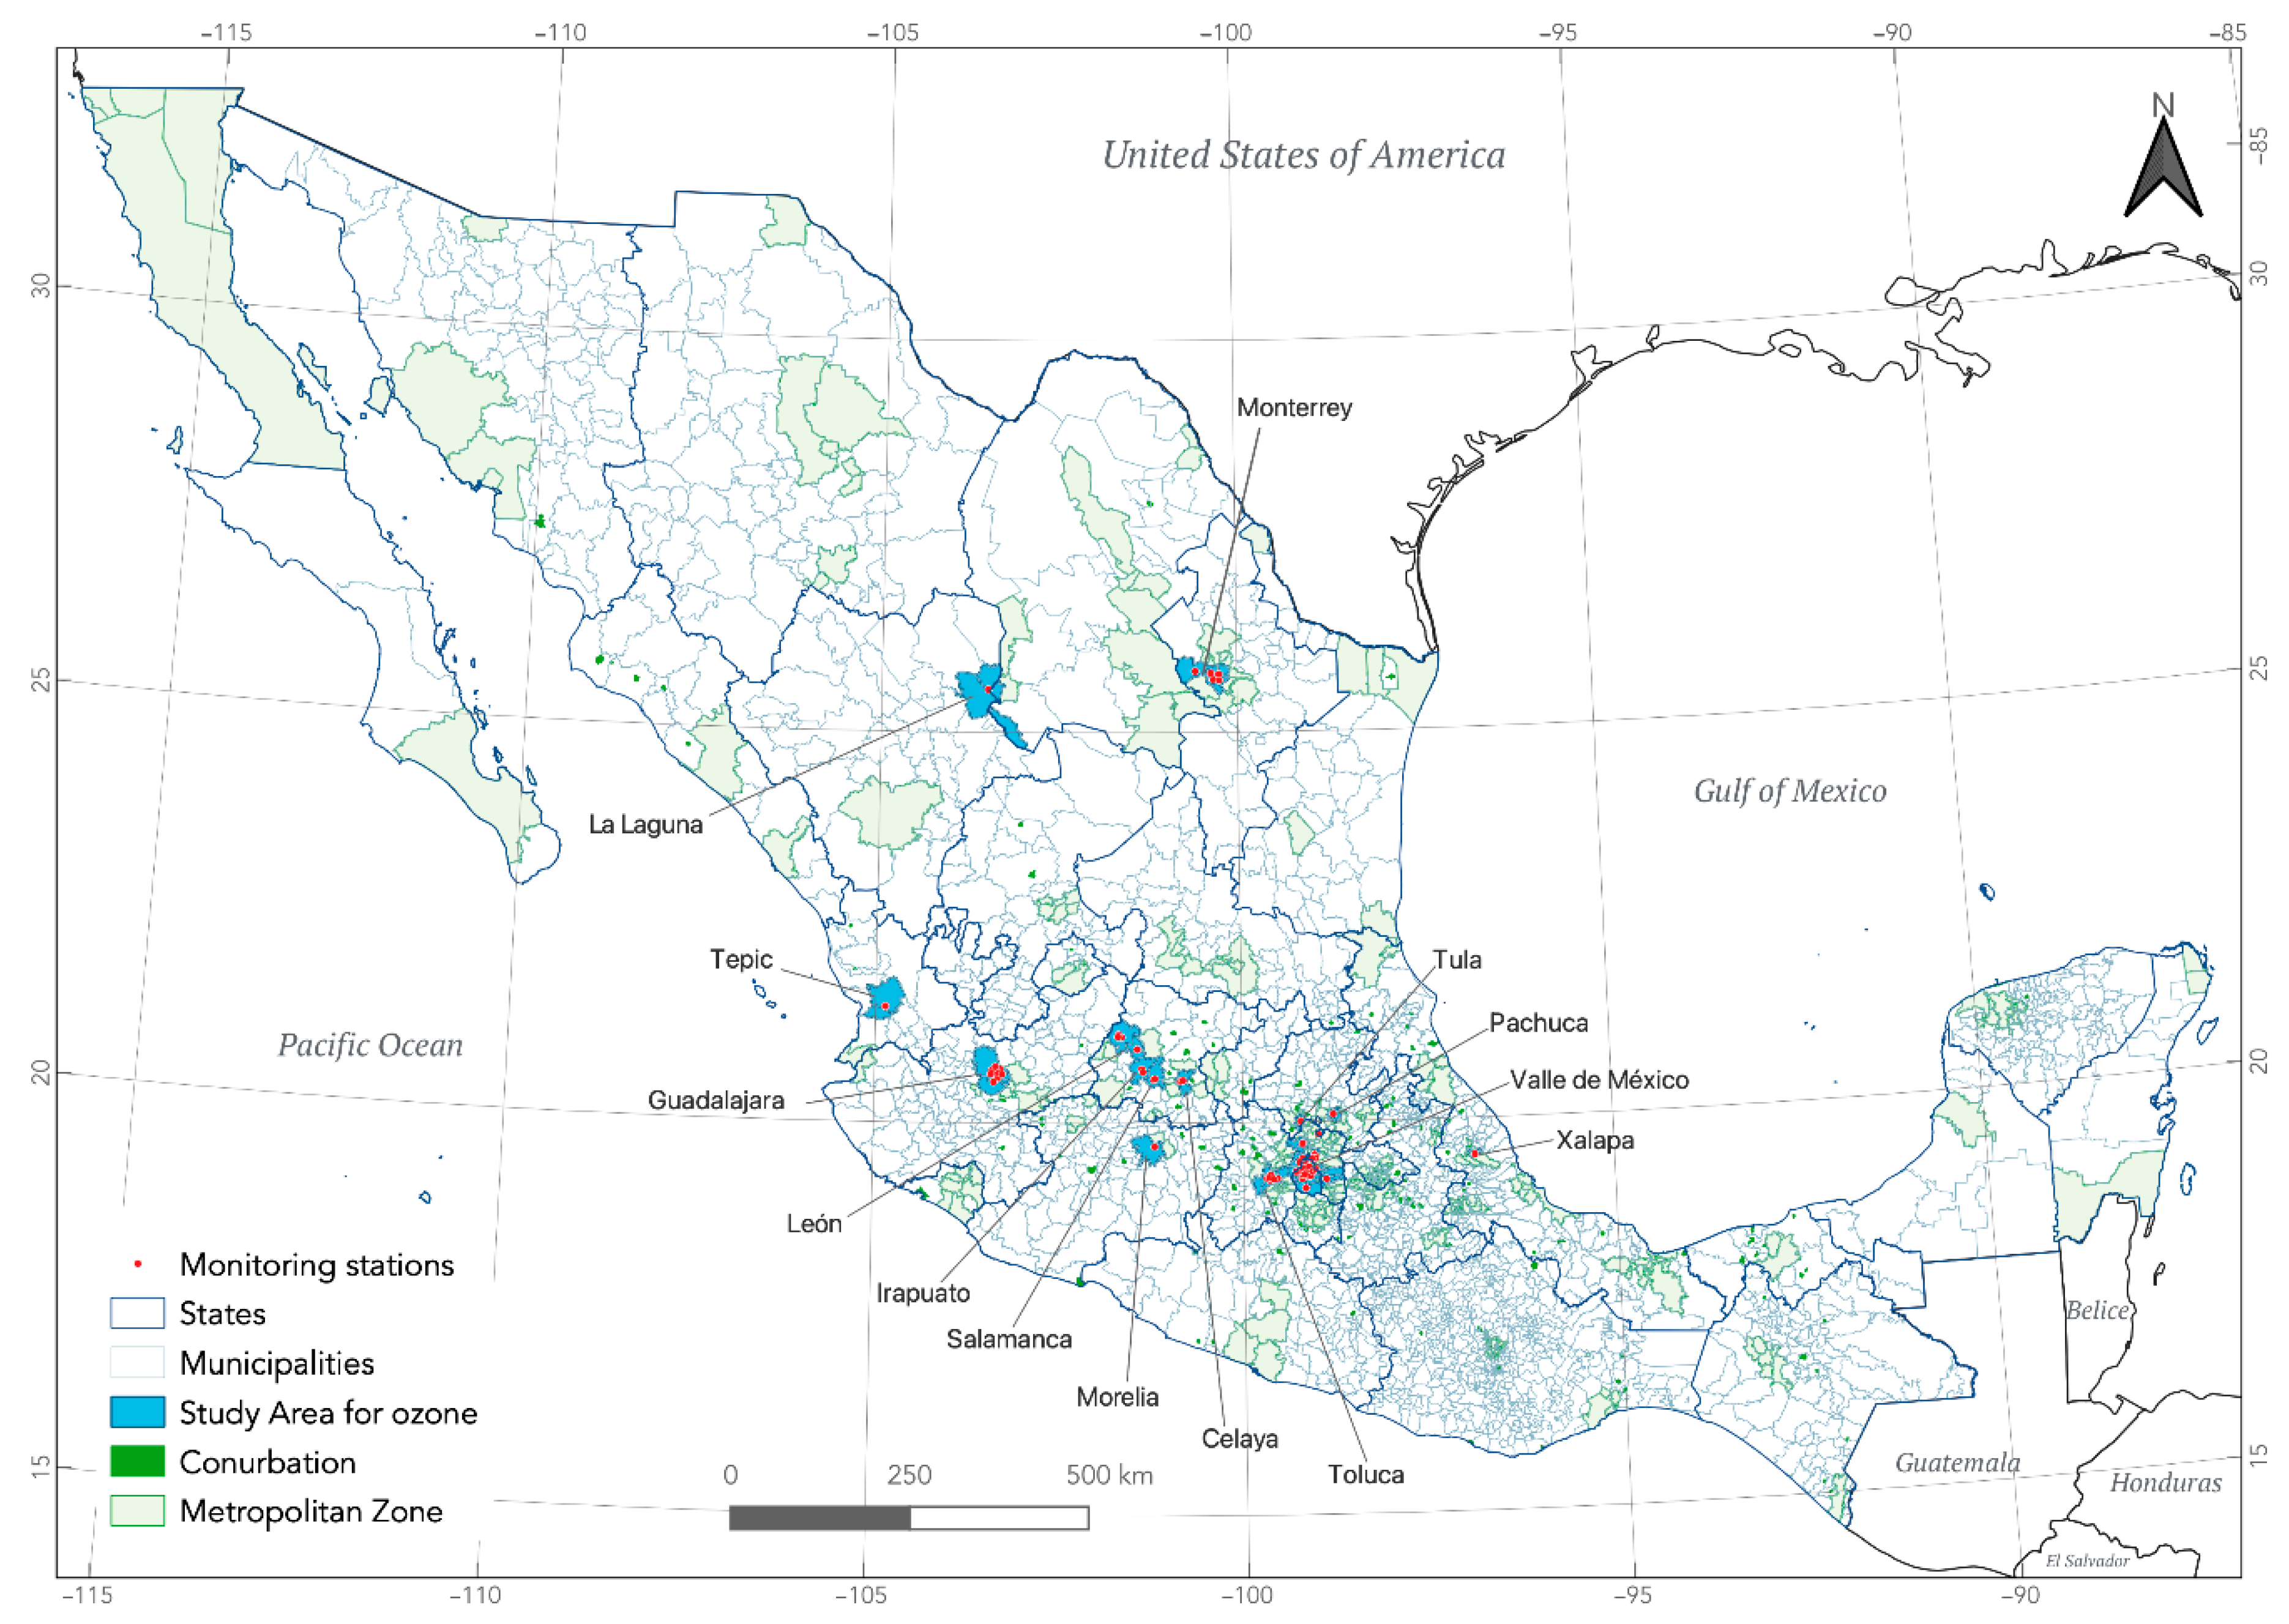
3.1. Study Area
3.2. Estimates of Exposure to O3
3.3. Economic and Health Impacts (Avoidable Deaths)
4. Discussion
5. Conclusions
Supplementary Materials
Author Contributions
Funding
Institutional Review Board Statement
Informed Consent Statement
Data Availability Statement
Acknowledgments
Conflicts of Interest
References
- GBD 2015 Risk Factors Collaborators. Global, regional, and national comparative risk assessment of 79 behavioural, environmental and occupational, and metabolic risks or clusters of risks, 1990–2015: A systematic analysis for the Global Burden of Diseases Study 20. Lancet 2016, 388, 1659–1724. [Google Scholar] [CrossRef] [Green Version]
- Mannucci, P.M.; Harari, S.; Martinelli, I.; Franchini, M. Effects on health of air pollution: A narrative review. Intern. Emerg. Med. 2015, 10, 657–662. [Google Scholar] [CrossRef]
- Sun, Z.; Zhu, D. Exposure to outdoor air pollution and its human health outcomes: A scoping review. PLoS ONE 2019, 14, e0216550. [Google Scholar] [CrossRef]
- Zhang, J.J.; Wei, Y.; Fang, Z. Ozone pollution: A major health hazard worldwide. Front. Immunol. 2019, 10, 2518. [Google Scholar] [CrossRef] [Green Version]
- Ji, M.; Cohan, D.S.; Bell, M.L. Meta-analysis of the association between short-term exposure to ambient ozone and respiratory hospital admissions. Environ. Res. Lett. 2011, 6, 024006. [Google Scholar] [CrossRef]
- Nawahda, A.; Yamashita, K.; Ohara, T.; Kurokawa, J.; Ohizumi, T.; Chen, F.; Akimoto, H. Premature mortality in Japan due to ozone. Atmos. Environ. 2013, 81, 538–545. [Google Scholar] [CrossRef]
- Pascal, M.; Wagner, V.; Chatignoux, E.; Falq, G.; Corso, M.; Blanchard, M.; Host, S.; Larrieu, S.; Pascal, L.; Declercq, C. Ozone and short-term mortality in nine French cities: Influence of temperature and season. Atmos. Environ. 2012, 62, 566–572. [Google Scholar] [CrossRef]
- Martínez-Lazcano, J.C.; González-Guevara, E.; Del Carmen Rubio, M.; Franco-Pérez, J.; Custodio, V.; Hernández-Cerón, M.; Livera, C.; Paz, C. The effects of ozone exposure and associated injury mechanisms on the central nervous system. Rev. Neurosci. 2013, 24, 337–352. [Google Scholar] [CrossRef] [PubMed]
- Zu, K.; Shi, L.; Prueitt, R.L.; Liu, X.; Goodman, J.E. Critical review of long-term ozone exposure and asthma development. Inhal. Toxicol. 2018, 30, 99–113. [Google Scholar] [CrossRef] [PubMed]
- Dimakopoulou, K.; Douros, J.; Samoli, E.; Karakatsani, A.; Rodopoulou, S.; Papakosta, D.; Grivas, G.; Tsilingiridis, G.; Mudway, I.; Moussiopoulos, N.; et al. Long-term exposure to ozone and children’s respiratory health: Results from the RESPOZE study. Environ. Res. 2020, 182, 109002. [Google Scholar] [CrossRef] [PubMed]
- Wang, Q.; Miao, H.; Warren, J.L.; Ren, M.; Benmarhnia, T.; Knibbs, L.D.; Zhang, H.; Zhao, Q.; Huang, C. Association of maternal ozone exposure with term low birth weight and susceptible window identification. Environ. Int. 2021, 146, 106208. [Google Scholar] [CrossRef]
- Kazemiparkouhi, F.; Eum, K.D.; Wang, B.; Manjourides, J.; Suh, H.H. Long-term ozone exposures and cause-specific mortality in a US Medicare cohort. J. Expo. Sci. Environ. Epidemiol. 2020, 30, 650–658. [Google Scholar] [CrossRef] [Green Version]
- Lim, C.C.; Hayes, R.B.; Ahn, J.; Shao, Y.; Silverman, D.T.; Jones, R.R.; Garcia, C.; Bell, M.L.; Thurston, G.D. Long-term exposure to ozone and cause-specific mortality risk in the United States. Am. J. Respir. Crit. Care Med. 2019, 200, 1022–1031. [Google Scholar] [CrossRef] [PubMed]
- Boldo, E.; Linares, C.; Lumbreras, J.; Borge, R.; Narros, A.; García-Pérez, J.; Fernández-Navarro, P.; Pérez-Gómez, B.; Aragonés, N.; Ramis, R.; et al. Health impact assessment of a reduction in ambient PM2.5 levels in Spain. Environ. Int. 2011, 37, 342–348. [Google Scholar] [CrossRef]
- Nuvolone, D.; Petri, D.; Voller, F. The effects of ozone on human health. Environ. Sci. Pollut. Res. 2018, 25, 8074–8088. [Google Scholar] [CrossRef] [PubMed]
- World Health Organization (WHO). Review of Evidence on Health Aspects of Air Pollution—REVIHAAP; World Health Organization: Geneva, Switzerland, 2013. [Google Scholar]
- World Health Organization (WHO). Health Risk of Ozone from Long-Range Transboundary Air Pollution; World Health Organization: Geneva, Switzerland, 2008. [Google Scholar]
- Rabl, A.; Spadaro, J.V.; Holland, M. How Much Is Clean Air Worth? Calculating the Benefits of Pollution Control; Cambridge University Press: Cambridge, UK, 2014. [Google Scholar]
- Karimi, A.; Shirmardi, M.; Hadei, M.; Birgani, Y.T.; Neisi, A.; Takdastan, A.; Goudarzi, G. Concentrations and health effects of short- and long-term exposure to PM2.5, NO2, and O3 in ambient air of Ahvaz city, Iran (2014–2017). Ecotoxicol. Environ. Saf. 2019, 180, 542–548. [Google Scholar] [CrossRef] [PubMed]
- Malmqvist, E.; Oudin, A.; Pascal, M.; Medina, S. Choices behind Numbers: A Review of the Major Air Pollution Health Impact Assessments in Europe. Curr. Environ. Health Rep. 2018, 5, 34–43. [Google Scholar] [CrossRef] [PubMed] [Green Version]
- Thondoo, M.; Rojas-Rueda, D.; Gupta, J.; De Vries, D.H.; Nieuwenhuijsen, M.J. Systematic Literature Review of Health Impact Assessments in Low and Middle-Income Countries Keywords: Health impact assessment (HIA); systematic review; process evaluation; low and middle-income country. Int. J. Environ. Res. Public Health 2019, 16, 2018. [Google Scholar] [CrossRef] [Green Version]
- Martenies, S.E.; Wilkins, D.; Batterman, S.A. Health impact metrics for air pollution management strategies. Environ. Int. 2015, 85, 84–95. [Google Scholar] [CrossRef] [Green Version]
- Lehtomäki, H.; Korhonen, A.; Asikainen, A.; Karvosenoja, N.; Kupiainen, K.; Paunu, V.V.; Savolahti, M.; Sofiev, M.; Palamarchuk, Y.; Karppinen, A.; et al. Health impacts of ambient air pollution in Finland. Int. J. Environ. Res. Public Health 2018, 15, 736. [Google Scholar] [CrossRef] [Green Version]
- Hadei, M.; Hopke, P.K.; Shahsavani, A.; Jahanmehr, N.; Rahmatinia, M.; Farhadi, M.; Yarahmadi, M.; Kermani, M. Mortality and morbidity economic burden due to PM2.5 and ozone; an AirQ+ modelling in Iran. J. Air Pollut. Health 2020, 5, 1–10. [Google Scholar] [CrossRef]
- Trejo-González, A.G.; Riojas-Rodriguez, H.; Texcalac-Sangrador, J.L.; Guerrero-López, C.M.; Cervantes-Martínez, K.; Hurtado-Díaz, M.; de la Sierra-de la Vega, L.A.; Zuñiga-Bello, P.E. Quantifying health impacts and economic costs of PM2.5 exposure in Mexican cities of the National Urban System. Int. J. Public Health 2019, 64, 561–572. [Google Scholar] [CrossRef]
- Instituto Nacional de Ecología y Cambio Climático. Informe Nacional de Calidad del Aire 2018, México; Coordinación General de Contaminación y Salud Ambiental, Dirección de Investigación de Calidad del Aire y Contaminantes Climáticos: Ciudad de México, México, 2019. [Google Scholar]
- Medina, S.; Ballester, F.; Chanel, O.; Declercq, C.; Pascal, M. Quantifying the health impacts of outdoor air pollution: Useful estimations for public health action. J. Epidemiol. Community Health 2013, 67, 480–483. [Google Scholar] [CrossRef] [PubMed] [Green Version]
- Castro, A.; Künzli, N.; Götschi, T. Health benefits of a reduction of PM10 and NO2 exposure after implementing a clean air plan in the Agglomeration Lausanne-Morges. Int. J. Hyg. Environ. Health 2017, 220, 829–839. [Google Scholar] [CrossRef]
- Bacigalupe, A.; Esnaola, S.; Calderón, C.; Zuazagoitia, J.; Aldasoro, E. La evaluación del impacto sobre la salud: Una herramienta para incorporar la salud en las intervenciones no sanitarias. Gac. Sanit. 2009, 23, 62–66. [Google Scholar] [CrossRef] [PubMed] [Green Version]
- Héroux, M.E.; Anderson, H.R.; Atkinson, R.; Brunekreef, B.; Cohen, A.; Forastiere, F.; Hurley, F.; Katsouyanni, K.; Krewski, D.; Krzyzanowski, M.; et al. Quantifying the health impacts of ambient air pollutants: Recommendations of a WHO/Europe project. Int. J. Public Health 2015, 60, 619–627. [Google Scholar] [CrossRef] [PubMed] [Green Version]
- OECD. The Economic Consequences of Outdoor Air Pollution; OECD: Paris, France, 2016; ISBN 9789264257474. [Google Scholar]
- The World Bank GDP Deflator (Base Year Varies by Country). Available online: https://data.worldbank.org/indicator/NY.GDP.DEFL.ZS (accessed on 3 May 2021).
- INEGI. PIB Por Entidad Federativa (PIBE). Base. 2013. Available online: https://www.inegi.org.mx/programas/pibent/2013/ (accessed on 3 May 2021).
- INEGI. Encuesta Nacional de Ocupación y Empleo (ENOE). Población de 15 Años y Más de Edad. Available online: https://www.inegi.org.mx/programas/enoe/15ymas/ (accessed on 3 May 2021).
- OECD. Purchasing Power Parities (PPP). Available online: https://data.oecd.org/conversion/purchasing-power-parities-ppp.htm (accessed on 3 May 2021).
- Turner, M.C.; Jerrett, M.; Arden, C.; Krewski, D.; Gapstur, S.M.; Diver, R.; Beckerman, B.S.; Marshall, J.D.; Su, J.; Crouse, D.L.; et al. Long-Term Ozone Exposure and Mortality in a Large Prospective Study. Am. J. Respir. Crit. Care Med. 2016, 193, 1134–1142. [Google Scholar] [CrossRef] [Green Version]
- Valuntaitė, V.; Girgždienė, R. Nivo ozona u otvorenom i zatvorenom prostoru-mogući uticaj na zdravlje ljudi [Outdoor and indoor ozone level-A potential impact on human health]. Vojn. Pregl. 2015, 78, 696–701. [Google Scholar] [CrossRef]
- Martuzzi, M.; Mitis, F.; Iavarone, I.; Serinelli, M. Impatto sanitario dell’ozono in 13 città italiane [Health impact of ozone in 13 Italian cities]. Epidemiol. Prev. 2007, 31, 323–332. [Google Scholar]
- Instituto Nacional de Salud Pública. Estimación de Impactos en la Salud Por Contaminación Atmosférica en la Región Centro del País y Alternativas de Gestión; Coordinación General de Contaminación y Salud Ambiental: Mexico City, Mexico, 2016. [Google Scholar]
- Hammitt, J.K. Extrapolating the Value per Statistical Life Between Populations: Theoretical Implications. J. Benefit-Cost Anal. 2017, 8, 215–225. [Google Scholar] [CrossRef] [Green Version]
- Viscusi, W.K.; Masterman, C.J. Income Elasticities and Global Values of a Statistical Life. J. Benefit-Cost Anal. 2017, 8, 226–250. [Google Scholar] [CrossRef] [Green Version]
- Kniesner, T.J.; Viscusi, W.K. The Value of a Statistical Life. Oxford Research Encyclopedia of Economics and Finance. Available online: https://oxfordre.com/economics/view/10.1093/acrefore/9780190625979.001.0001/acrefore-9780190625979-e-138 (accessed on 21 October 2021).

| State | City | Population | Population > 30 Years | Mortality Rate a | Mun | SOMO35 by Mun Mean (Min–Max) |
|---|---|---|---|---|---|---|
| Nuevo León | Monterrey * | 3,615,075 | 1,810,793 | 85.2 | 7 | 7.82 (5.74–13.4) |
| Coahuila Durango | La Laguna * | 1,174,885 | 556,665 | 77.5 | 3 | 1.5 |
| Nayarit | Tepic * | 471,026 | 217,436 | 76.7 | 2 | 6.4 |
| Jalisco | Guadalajara * | 4,725,603 | 2,194,989 | 90.6 | 6 | 7.63 (5.98–9.16) |
| Guanajuato | León * | 1,768,193 | 771,130 | 77.5 | 2 | 16.1 (16.1–16.6) |
| Guanajuato | Irapuato † | 574,344 | 251,291 | 91.0 | 1 | 19.4 |
| Guanajuato | Salamanca † | 273,271 | 134,162 | 74.1 | 1 | 16.3 |
| Guanajuato | Celaya * | 494,304 | 227,157 | 55.9 | 1 | 19.1 |
| Morelia | Morelia * | 784,776 | 371,420 | 115.8 | 1 | 9.2 |
| Hidalgo | Pachuca * | 427,551 | 210,422 | 80.9 | 2 | 15.5 |
| Hidalgo | Tula * | 68,247 | 32,222 | 77.8 | 2 | 12.2 |
| Estado de Mexico | Toluca * | 1,512,455 | 712,063 | 86.0 | 5 | 8.22 (7.46–9.71) |
| Mexico City Estado de Mexico | Valle de Mexico * | 17,156,425 | 9,157,798 | 90.3 | 33 | 20.8 (8.9–29.0) |
| Veracruz | Xalapa * | 480,841 | 241,693 | 81.9 | 1 | 4.5 |
| Total | 33,526,996 | 16,889,241 | 85.2 | 67 | 14.8 (1.5–29.0) |
| City | Avoidable Deaths (95% UI) | Economic Valuation b (Min–Max) | Lost Productivity (USD) |
|---|---|---|---|
| Irapuato | 11 (4–18) | $15.9 (8.7–23.8) | $311,673.4 (228,810.7–394,536.1) |
| Salamanca | 4 (2–7) | $5.8 (3.2–8.7) | $142,685.1 (113,212–173,821.5) |
| La Laguna | 1 (0–3) | $2.0 (1.4–2.5) | $78,669.9 (70,110.1–87,229.6) |
| Valle de Mexico | 461 (166–767) | $1106.3 (962.4–1278.7) | $22,395,473.2 (21,018,939–23,772,007.4) |
| Celaya | 9 (3–15) | $13.0 (7.1–19.5) | $357,668.0 (264,351.7–450,984.3) |
| León | 30 (11–51) | $43.4 (23.7–65.0) | $1,103,163.9 (1,008,491.8–1,197,836.1) |
| Pachuca | 6 (3–10) | $7.3 (3.5–11.8) | $315,349.6 (286,099.3–344,599.8) |
| Tula | 0 | 0 | 0 |
| Guadalajara | 50 (19–86) | $88.2 (54.9–120.9) | $2,235,794.5 (2,107,509.1–2,364,079.9) |
| Toluca | 12 (4–20) | $14.0 (6.6–23.1) | $475,383.0 (424,168.1–526,597.9) |
| Morelia | 7 (2–11) | $7.6 (3.4–12.9) | $257,349.4 (234,074.5–280,624.4) |
| Tepic | 3 (1–6) | $3.7 (1.8–6.0) | $96,211.8 (87,603.2–104,820.4) |
| Monterrey | 31 (11–53) | $88.2 (75.6–97.8) | $1,854,470.6 (1,761,086.9–1,947,854.3) |
| Xalapa | 2 (1–4) | $2.5 (1.2–4.0) | $62,171.7 (43,690.6–82,601.2) |
| Total | 627 (227–1051) | $1397.8 (1153.6–1674.6) | $29,686,064.1 (27,648,147–31,727,592.9) |
Publisher’s Note: MDPI stays neutral with regard to jurisdictional claims in published maps and institutional affiliations. |
© 2021 by the authors. Licensee MDPI, Basel, Switzerland. This article is an open access article distributed under the terms and conditions of the Creative Commons Attribution (CC BY) license (https://creativecommons.org/licenses/by/4.0/).
Share and Cite
Texcalac-Sangrador, J.L.; Hurtado-Díaz, M.; Félix-Arellano, E.E.; Guerrero-López, C.M.; Riojas-Rodríguez, H. Health and Economic Impacts Assessment of O3 Exposure in Mexico. Int. J. Environ. Res. Public Health 2021, 18, 11646. https://doi.org/10.3390/ijerph182111646
Texcalac-Sangrador JL, Hurtado-Díaz M, Félix-Arellano EE, Guerrero-López CM, Riojas-Rodríguez H. Health and Economic Impacts Assessment of O3 Exposure in Mexico. International Journal of Environmental Research and Public Health. 2021; 18(21):11646. https://doi.org/10.3390/ijerph182111646
Chicago/Turabian StyleTexcalac-Sangrador, José Luis, Magali Hurtado-Díaz, Eunice Elizabeth Félix-Arellano, Carlos Manuel Guerrero-López, and Horacio Riojas-Rodríguez. 2021. "Health and Economic Impacts Assessment of O3 Exposure in Mexico" International Journal of Environmental Research and Public Health 18, no. 21: 11646. https://doi.org/10.3390/ijerph182111646
APA StyleTexcalac-Sangrador, J. L., Hurtado-Díaz, M., Félix-Arellano, E. E., Guerrero-López, C. M., & Riojas-Rodríguez, H. (2021). Health and Economic Impacts Assessment of O3 Exposure in Mexico. International Journal of Environmental Research and Public Health, 18(21), 11646. https://doi.org/10.3390/ijerph182111646