Abstract
Ammonia is a representative PM-2.5 secondary product, and the need for management is emerging as health and living damage caused by fine particulate matter worsens. The main source of ammonia is the agricultural sector, and in Korea, 79% of the total ammonia emissions are emitted from the agricultural sector. Among them, there is high uncertainty about how to calculate emissions from ammonia discharged from fertilizer use, and inventory in the U.S. and Europe is borrowed, so inventory needs to be improved according to the situation in Korea. In this study, the ammonia inventory in the agricultural sector in Korea and abroad was examined, and additional activity data that can be used were reviewed. In addition, in order to improve the emission calculation method, the emission was calculated in three ways by different factors. As a result, it was confirmed that the amount of discharge varies depending on the type of soil use or whether cultivated crops are considered, and the possibility of excessive fertilizer top-dress by farmers was confirmed. In order to calculate the emission at a more detailed level based on this study, basic data such as fertilizer input method and regional distribution of crops should be systematically collected, and related follow-up studies should be conducted.
1. Introduction
Various studies worldwide have reported damages to human health caused by particulate matter, which has become a critical social issue [1,2,3]. Particles smaller than or equal to 2.5μm in diameter are defined as fine particulate matter (PM-2.5). Since the diameter of PM-2.5 is less than 1/20 the diameter of human hair, these particles can reach pulmonary alveoli or bronchial tubes without being filtered by the nose and cause respiratory diseases. Additionally, they may affect various other organs and cause cardiovascular disease, lung cancer, cell aging, and infections [4,5,6,7]. Hence, the International Agency for Research on Cancer, an affiliated organization of the World Health Organization, specified particulate matter as a carcinogen in 2013 [8].
Depending on their formation, PM-2.5 are categorized as either primary or secondary PM-2.5. Primary PM-2.5 are generated from the source and are directly emitted as solid fine dust. Secondary PM-2.5 refers to emitted SOx and NOx that form ammonium sulfate or ammonium nitrate by reacting with substances such as ammonia (NH3) in the air [9,10,11]. Secondary PM-2.5 accounts for over 72% of PM-2.5 generated in South Korea [12], and their importance is increasing due to an increase in the number of high PM-2.5 concentration days.
NH3 concentrations are closely related to the change in PM-2.5 concentration, thus requiring accurate emission calculations and the identification of emission sources. However, in comparison to SOx and NOx, NH3 is under less strict control in South Korea.
A management system is enforced for the total SOx and NOx load, and these pollutants are measured in real time at large-scale workplaces; currently, there is no such management scheme for NH3.
According to South Korea’s national emission statistics in 2017, total NH3 emissions were 308,298 tons, of which the majority (79.3%) was generated from the agricultural sector [13]. Chemical fertilizers are excessively applied in South Korean farmlands to increase productivity. The aggregate amount of chemical fertilizer application in South Korea ranked the highest among Organisation for Economic Co-operation and Development countries [14]. Therefore, regulation is necessary for NH3 emissions, which are generated from volatilization from soils due to excessive chemical fertilizer application.
Currently, the list of emission sources and most emission factors are adopted from overseas systems for calculating NH3 emissions of fertilized farmland in South Korea. In addition, an accurate emission calculation method based on the agricultural environment in South Korea is required because the calculated emissions are evenly distributed for each month and fail to reflect the circumstances of the actual environment.
In this study, global NH3 emission calculation methods were reviewed to devise potential enhancements for an accurate and a reliable method of NH3 emission calculation in the South Korean agricultural sector.
2. Review of the Ammonia Measurements Methods in Agriculture Sector
Each country uses different methods to control and account for NH3 emission sources in the agricultural sector, taking country-specific factors into account. The United States (US) and the European Union (EU) provide detailed guidelines for calculating NH3 emissions in the agricultural sector. These guidelines are reviewed in Table 1.

Table 1.
Comparison and Implications of Ammonia Inventory in the World Agricultural Sector.
In the US, agricultural emissions are classified into four categories: crop cultivation, dust from livestock, fertilizer application, and livestock feces management. NH3 emission sources from fertilizer application are classified into 14 nitrogen-based fertilizers (including anhydrous ammonia, aqueous ammonia, and urea). The Fertilizer Emission Scenario Tool for CMAQ is used in the emission calculations, and the soil profile, climate variables, volume of fertilizer supply, and the status of the cultivation area are used as activity data. Information on cultivation management (fertilizer application period, fertilizer components, application methods, and application quantities) is obtained through surveys, and the soil nutrient content and crop nutrient demand are estimated for their use in the NH3 emission calculation. The emission factors are calculated monthly for each administrative region, considering the percentage of NH3 emissions due to the total nitrogen fertilizer use. The calculated emissions consider the crop cultivation circumstances in the US [15].
The EU controls NH3 emissions through country-specific methods stated in the EMEP/EEA Air Pollutant Emission Inventory Guidebook. The guidebook classifies the agricultural sector into four emission sources, according to the NFR (Nomenclature For Reporting) code: manure management, crop production, agricultural soils, and other agriculture, which includes the use of pesticides and the burning of agricultural waste in the field. NH3 emission sources from fertilizer applications are restricted to those from nitrogen-based fertilizers. There are three emission calculation methods: Tier 1, Tier 2, and Tier 3. In Tier 1, the basic emission factors are multiplied by the annual fertilizer supply volume. In Tier 2, the climatic zone and soil pH are considered based on the 2006 Intergovernmental Panel on Climate Change Guidelines for National Greenhouse Gas Inventories and the unique emission factors for 11 nitrogen-based fertilizers are used. Finally, specific data such as crop growth processes, land type, climate conditions, the local distribution by crop type, and average nitrogen demand by crop type are utilized in Tier 3 for greater precision [16].
In South Korea, the agricultural sector is classified into two emission sources: fertilized farmland and feces management. The emission sources within fertilized farmland are further classified into 10 types of nitrogen-based fertilizers (such as urea, compound fertilizers, and ammonium sulfate). The emissions are calculated by multiplying the regional fertilizer supply by the fertilizer nitrogen content and the emission factor. Then, the emission quantities are allocated according to the farmland area. The volume of fertilizer supplied regionally by the National Agricultural Cooperative Federation is used, since accurate figures of the applied fertilizer quantities are difficult to obtain. In addition, the agriculturally active period is assumed to be eight months (from March to October), considering the average temperatures. During this period, NH3 emissions are evenly distributed. However, the exact fertilizer type and application location are unknown, and the assumption that the annual supply of fertilizer is completely consumed in the supplied region differs from reality. Lastly, the even distribution of NH3 emissions from March to October does not reflect actual agricultural activities, and emissions from greenhouses are not considered [17].
The US and most EU member countries use models to calculate national emissions. This allows for the exact location and the management of specific emissions information (cultivation plans, fertilizer application period, crop nutrient demand, etc.) to be taken into account. Currently, obtaining specific information related to NH3 emissions and model applications are difficult in South Korea. Nevertheless, accuracy in emission control can be improved using the acquired data on farmland area, cultivated crops, and nationally recommended cultivation methods by crop type.
3. Materials and Methods
3.1. Study Site Selection
Jeolla Province was selected as the pilot study area for the development of an enhanced NH3 emission calculation method based on fertilized farmland (Figure 1). This region emits the largest amount of NH3 from the largest area of arable land in South Korea. National emissions statistics in 2017 revealed that fertilized farmland emitted 17,754 tons of NH3 out of 244,335 tons of total NH3 emissions, and 6189 tons (34.9%) originated from Jeolla Province. South Korea has a total farmland area of 1,320,795 ha, and 493,059 ha (30.4%) area is distributed in Jeolla Province [18].
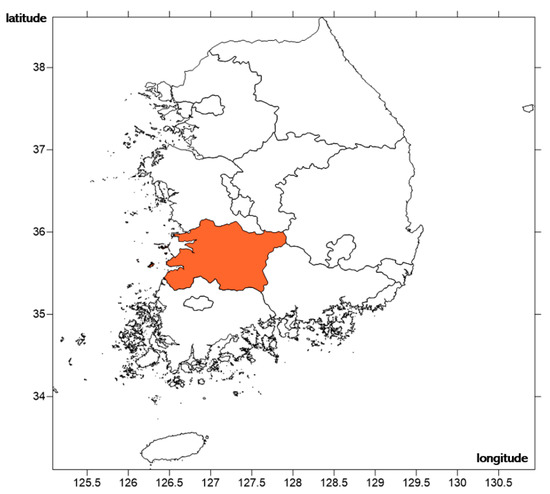
Figure 1.
Location of study site (Jeolla Province, South Korea).
3.2. Fertilized Farmland NH3 Emission Calculation Method
In South Korea, NH3 emissions are calculated based only on the regional fertilizer supply volume and the nitrogen content. They are allocated to administrative districts based on the farmland area during the agriculturally active period (March–October), which does not reflect the actual duration or location of fertilization. The spatial and temporal resolution of the NH3 emission calculation method was enhanced and compared to the existing method as shown in Table 2. In this study, 2017 data was used for comparison with the latest national emissions (2017). In the enhanced calculation method, the most common land use types in South Korea (rice paddies, fields, greenhouses, and pomiculture), according to their current emission source classification system depending on the current fertilization types, the crops cultivated by region and farmland type, the standard fertilizer application amount for each crop type, and farming schedules, were considered.
Table 2.
Overview of methods for calculating NH3 emissions in fertilized application sector.
3.2.1. NH3 Emission Calculation Method Considering the Volume of Fertilizer Supply
Method I (NH3 emission calculation considering the volume of supply for each fertilizer type) considers the volume of supply for each fertilizer type to calculate NH3 emission. This method is currently used in NH3 emission calculations from fertilization applications in South Korea. The emission sources’ classification system is based on fertilizer types (including urea, compound fertilizers, and ammonium sulfate) as shown in Table 3.
Table 3.
The classification system of fertilizer-use agricultural land emission sources used in Korea.
The NH3 emission is calculated by multiplying the volume of fertilizer and nitrogen content by the fertilizer type and emission factor as shown in Equation (1). The EPA emission factors were adopted for ammonium sulfate and other nitrogen-based fertilizers, and emission factors were developed in South Korea and are used for urea and compound fertilizers as shown in Table 4.
where E is NH3 Emission (kg-NH3/yr); A is supply volume of fertilizer (ton-fertilizer/yr); N is nitrogen content or product (%); 100 is nitrogen content unit conversion factor; EF is emission factor (kg-NH3/ton-fertilizer).
Table 4.
Emission factor of fertilizer-use agricultural land emission sources used in Korea.
3.2.2. NH3 Emission Calculation Method with Spatial and Temporal Resolution Enhancement Considering the Volume of Fertilizer
Method II (NH3 emission calculation considering the representative crops and the standard fertilizer application amount) considers the volume of fertilizer supply and the farming schedule for spatially and temporally enhancing the resolution of the NH3 emission calculation. The emission sources’ classification system is based on land use types (rice paddies, fields, greenhouses, and pomiculture) as shown in Table 5.
Table 5.
The classification system of fertilizer-use agricultural land emission sources considering Method II.
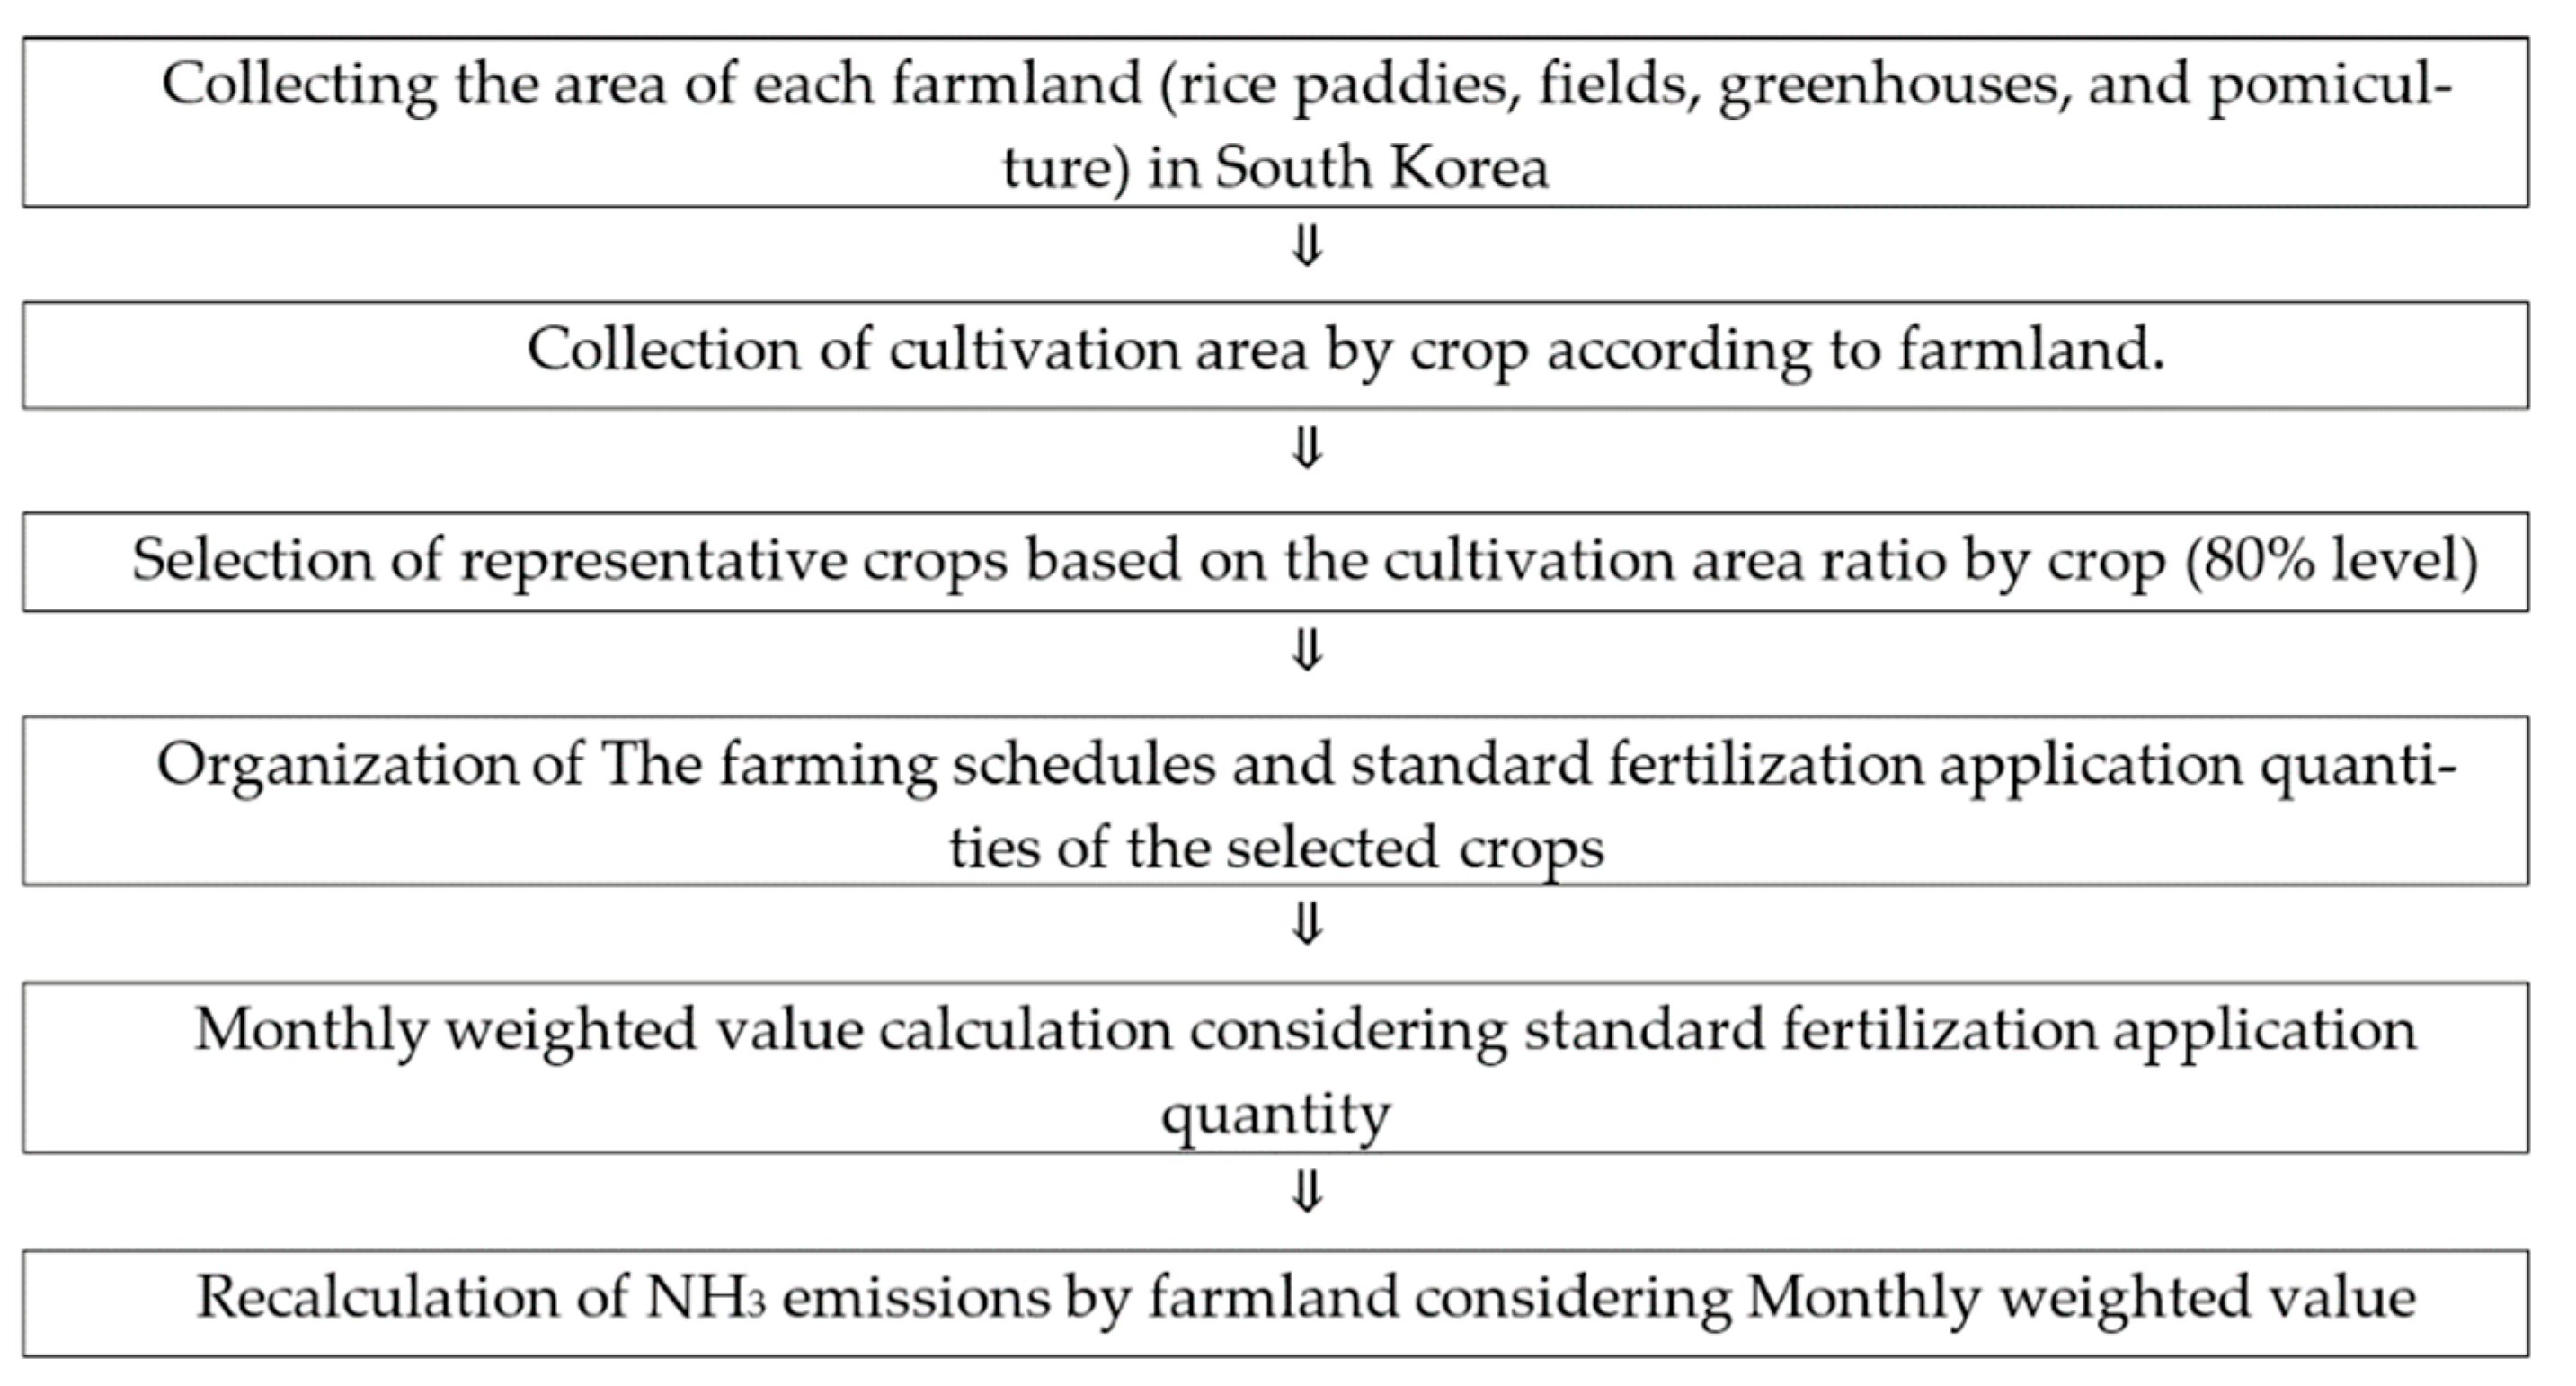
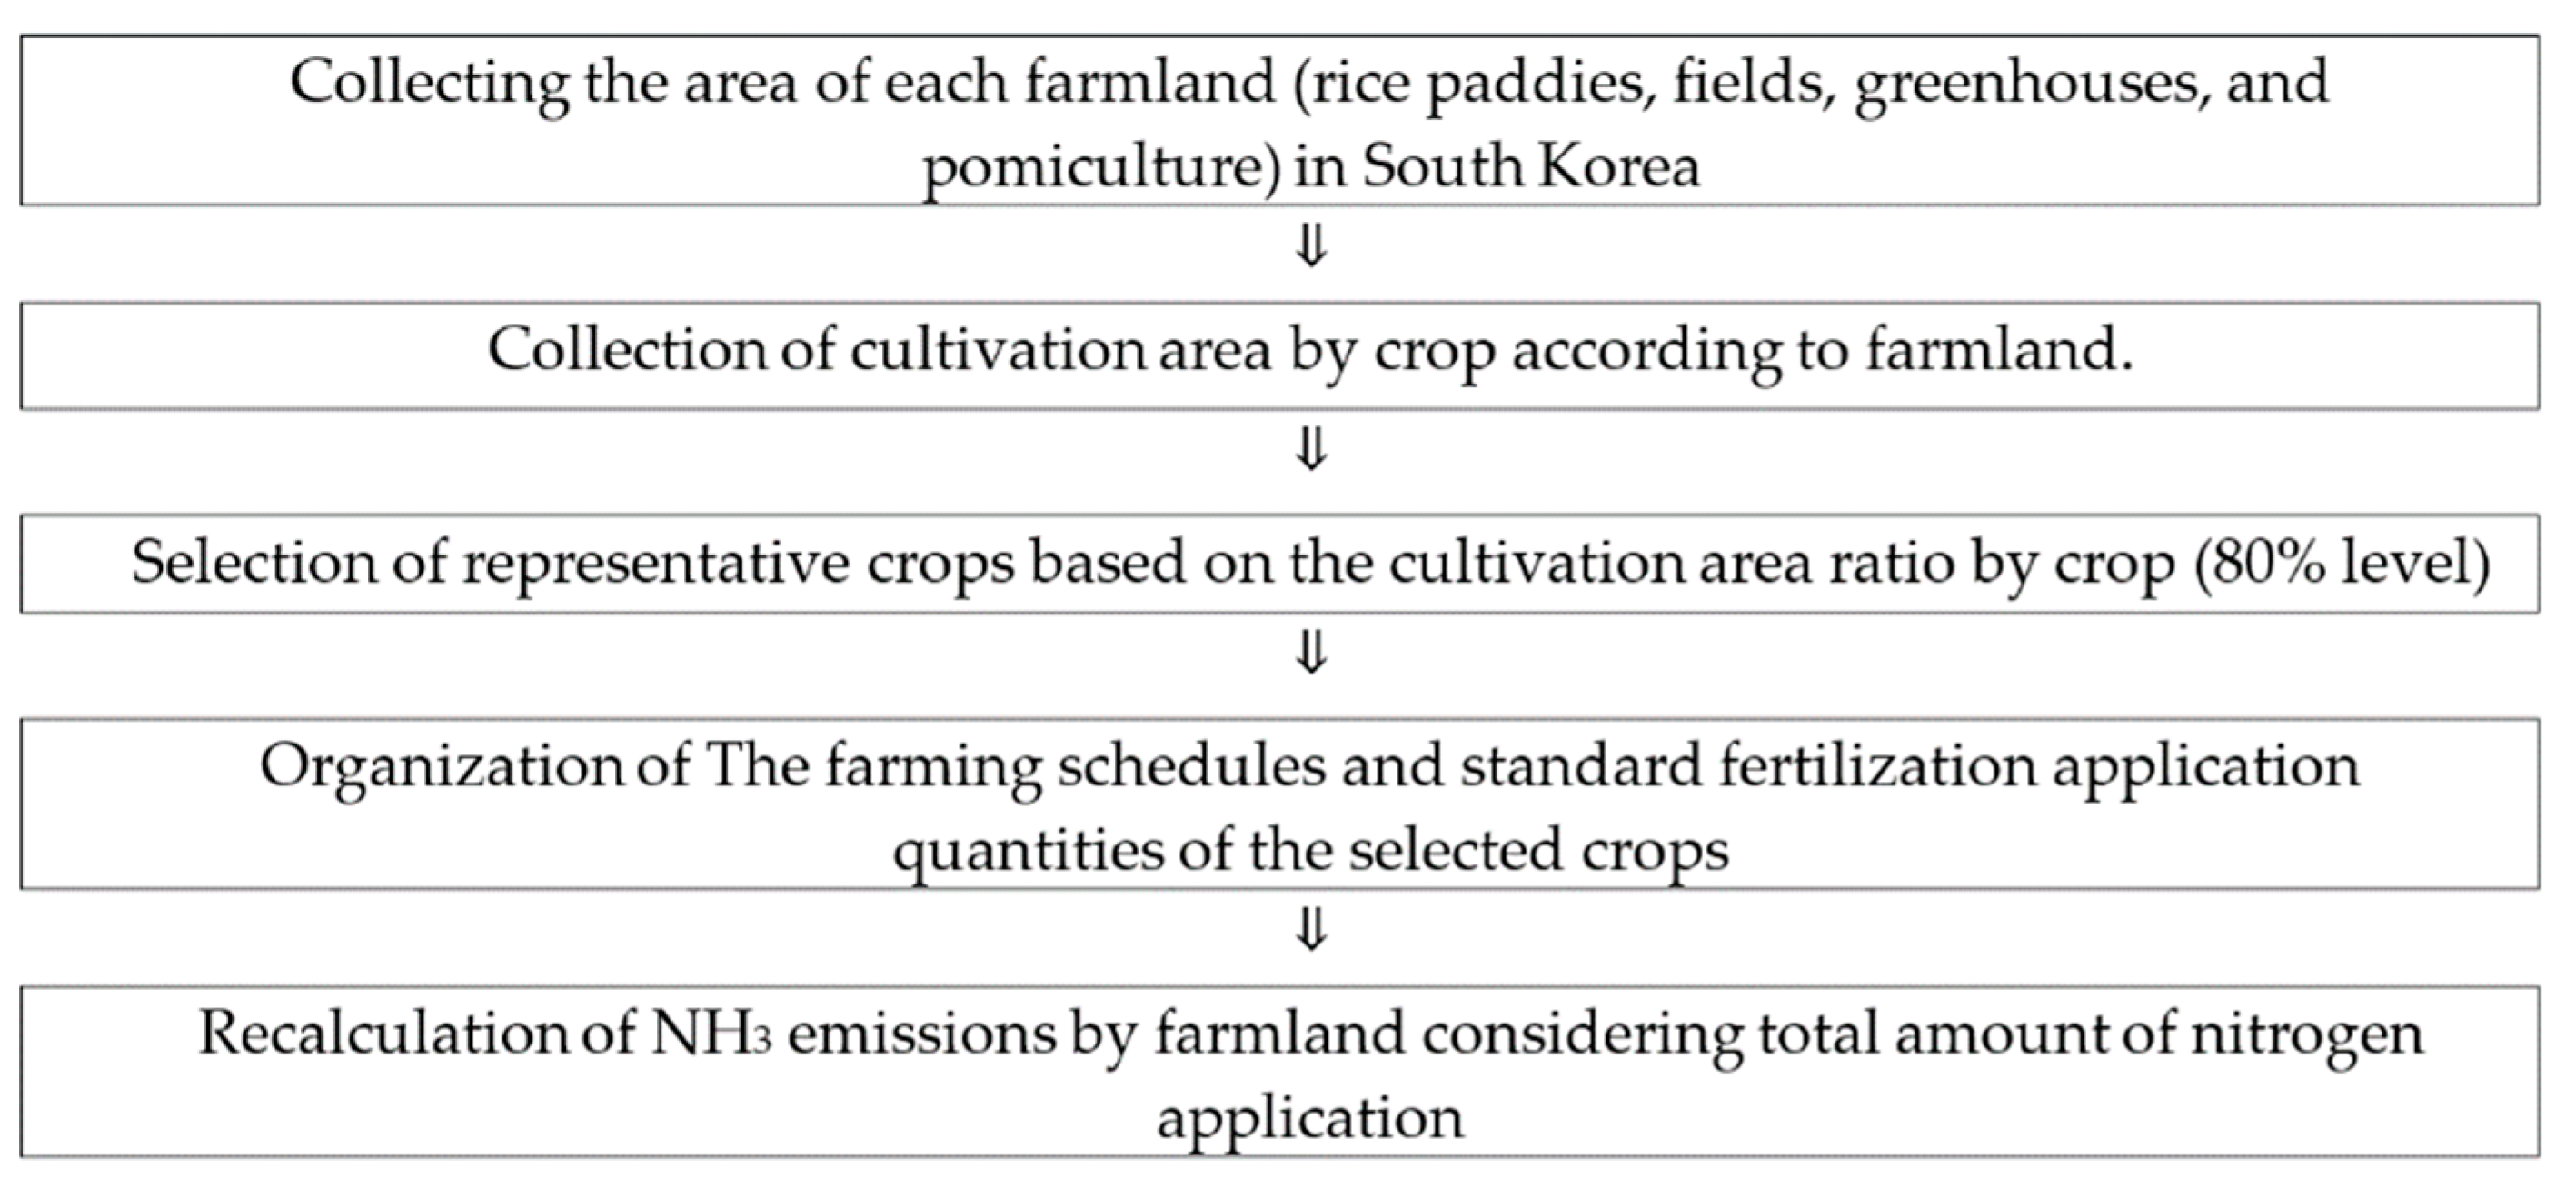
The order of the emissions calculated using Method II is shown in Figure 2.
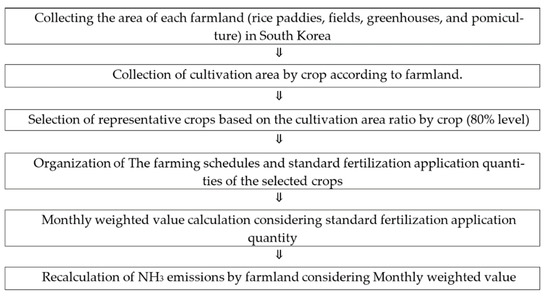
Figure 2.
Spatial-Temporal resolution improvement work flow-chart (Method II).
In this study, the area of four farmland types (rice paddies, fields, greenhouses, and pomiculture) and the area cultivated for every crop type were collected [19]. Representative crops from regional farmlands were selected based on a land occupation rate of approximately 80%.
The farming schedules and standard fertilization application quantities of the selected crops were designed according to the standard cultivation method [20]. Then, weighted values for each month were calculated and the NH3 emission quantities for each farmland type were calculated using Equation (2). The fertilizer supply provided in Method I was assumed to have been allocated by area of each farmland type. The same values as in Table 4 were applied for emission factors.
Previous studies confirmed that over 80% of NH3 volatilized within 1 week in general [21,22,23,24], although temperature and seasonal effects were affected [25]. Therefore, the weighted values were calculated based on the assumption that volatilization and fertilizer application occur simultaneously.
where E is NH3 Emission (kg-NH3/month); A is supply volume of fertilizer (ton-fertilizer/month); Weight is representative crops’ weighted values for each month; N is nitrogen content or product (%); 100 is nitrogen content unit conversion factor; EF is emission factor (kg-NH3/ton-fertilizer).
3.2.3. NH3 Emission Calculation Method with Spatial and Temporal Resolution Enhancement Considering Nitrogen Application
Method III (NH3 emission calculation considering crop-specific nitrogen application) considers the nitrogen quantities in the farming schedules for spatially and temporally enhancing the resolution of the NH3 emission calculation. The emission sources’ classification system is based on land use types (rice paddies, fields, greenhouses, and pomiculture) as shown in Table 6.
Table 6.
The classification system of fertilizer-use agricultural land emission sources considering Method III.
The order of the emissions calculated using Method III is shown in Figure 3.
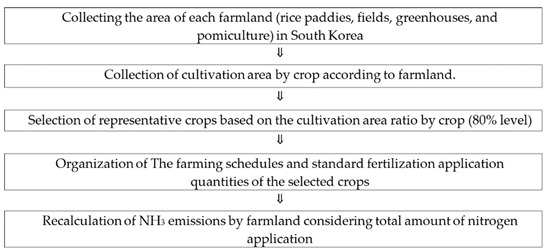
Figure 3.
Spatial-Temporal resolution improvement work flow-chart (Method III).
Similar to Methods II and III, the spatially and temporally enhanced resolution of the considered emissions took into account the standard fertilizer application amount for farmland area based on the nitrogen content. Based on the farmland area for each selected crop type, the standard fertilizer application amount was multiplied to generate the monthly nitrogen application amount as shown in Equation (3).
where E is total amount of nitrogen application (kg/month); cultivation area is the area cultivated for every crop type (ha); standard fertilization application quantity is standard fertilization application quantities of the selected crops (g-N/m2); 104 is area unit conversion factor (m2 to ha); 10−3 is fertilization unit conversion factor (g to kg).
4. Results and Discussions
4.1. Results of NH3 Emission Calculation Considering the Volume of Fertilizer Supply
Using Method I (NH3 emission calculation considering the volume of supply for each fertilizer type), the total NH3 emissions in 2017 in Jeolla Province was calculated to be 2,420,292 kg, as shown in Table 7. Among the 14 administrative districts in Jeolla Province, Gimje city generated the highest NH3 emission at 337,283 kg, followed by Iksan city (316,961 kg) and Gunsan city (313,683 kg). Together, four cities (Gimje, Iksan, Gunsan, and Jeongeup) accounted for 51% (1,231,034 kg) of the total emissions.
Table 7.
NH3 emissions in Jeolla-do (2017) with Method I.
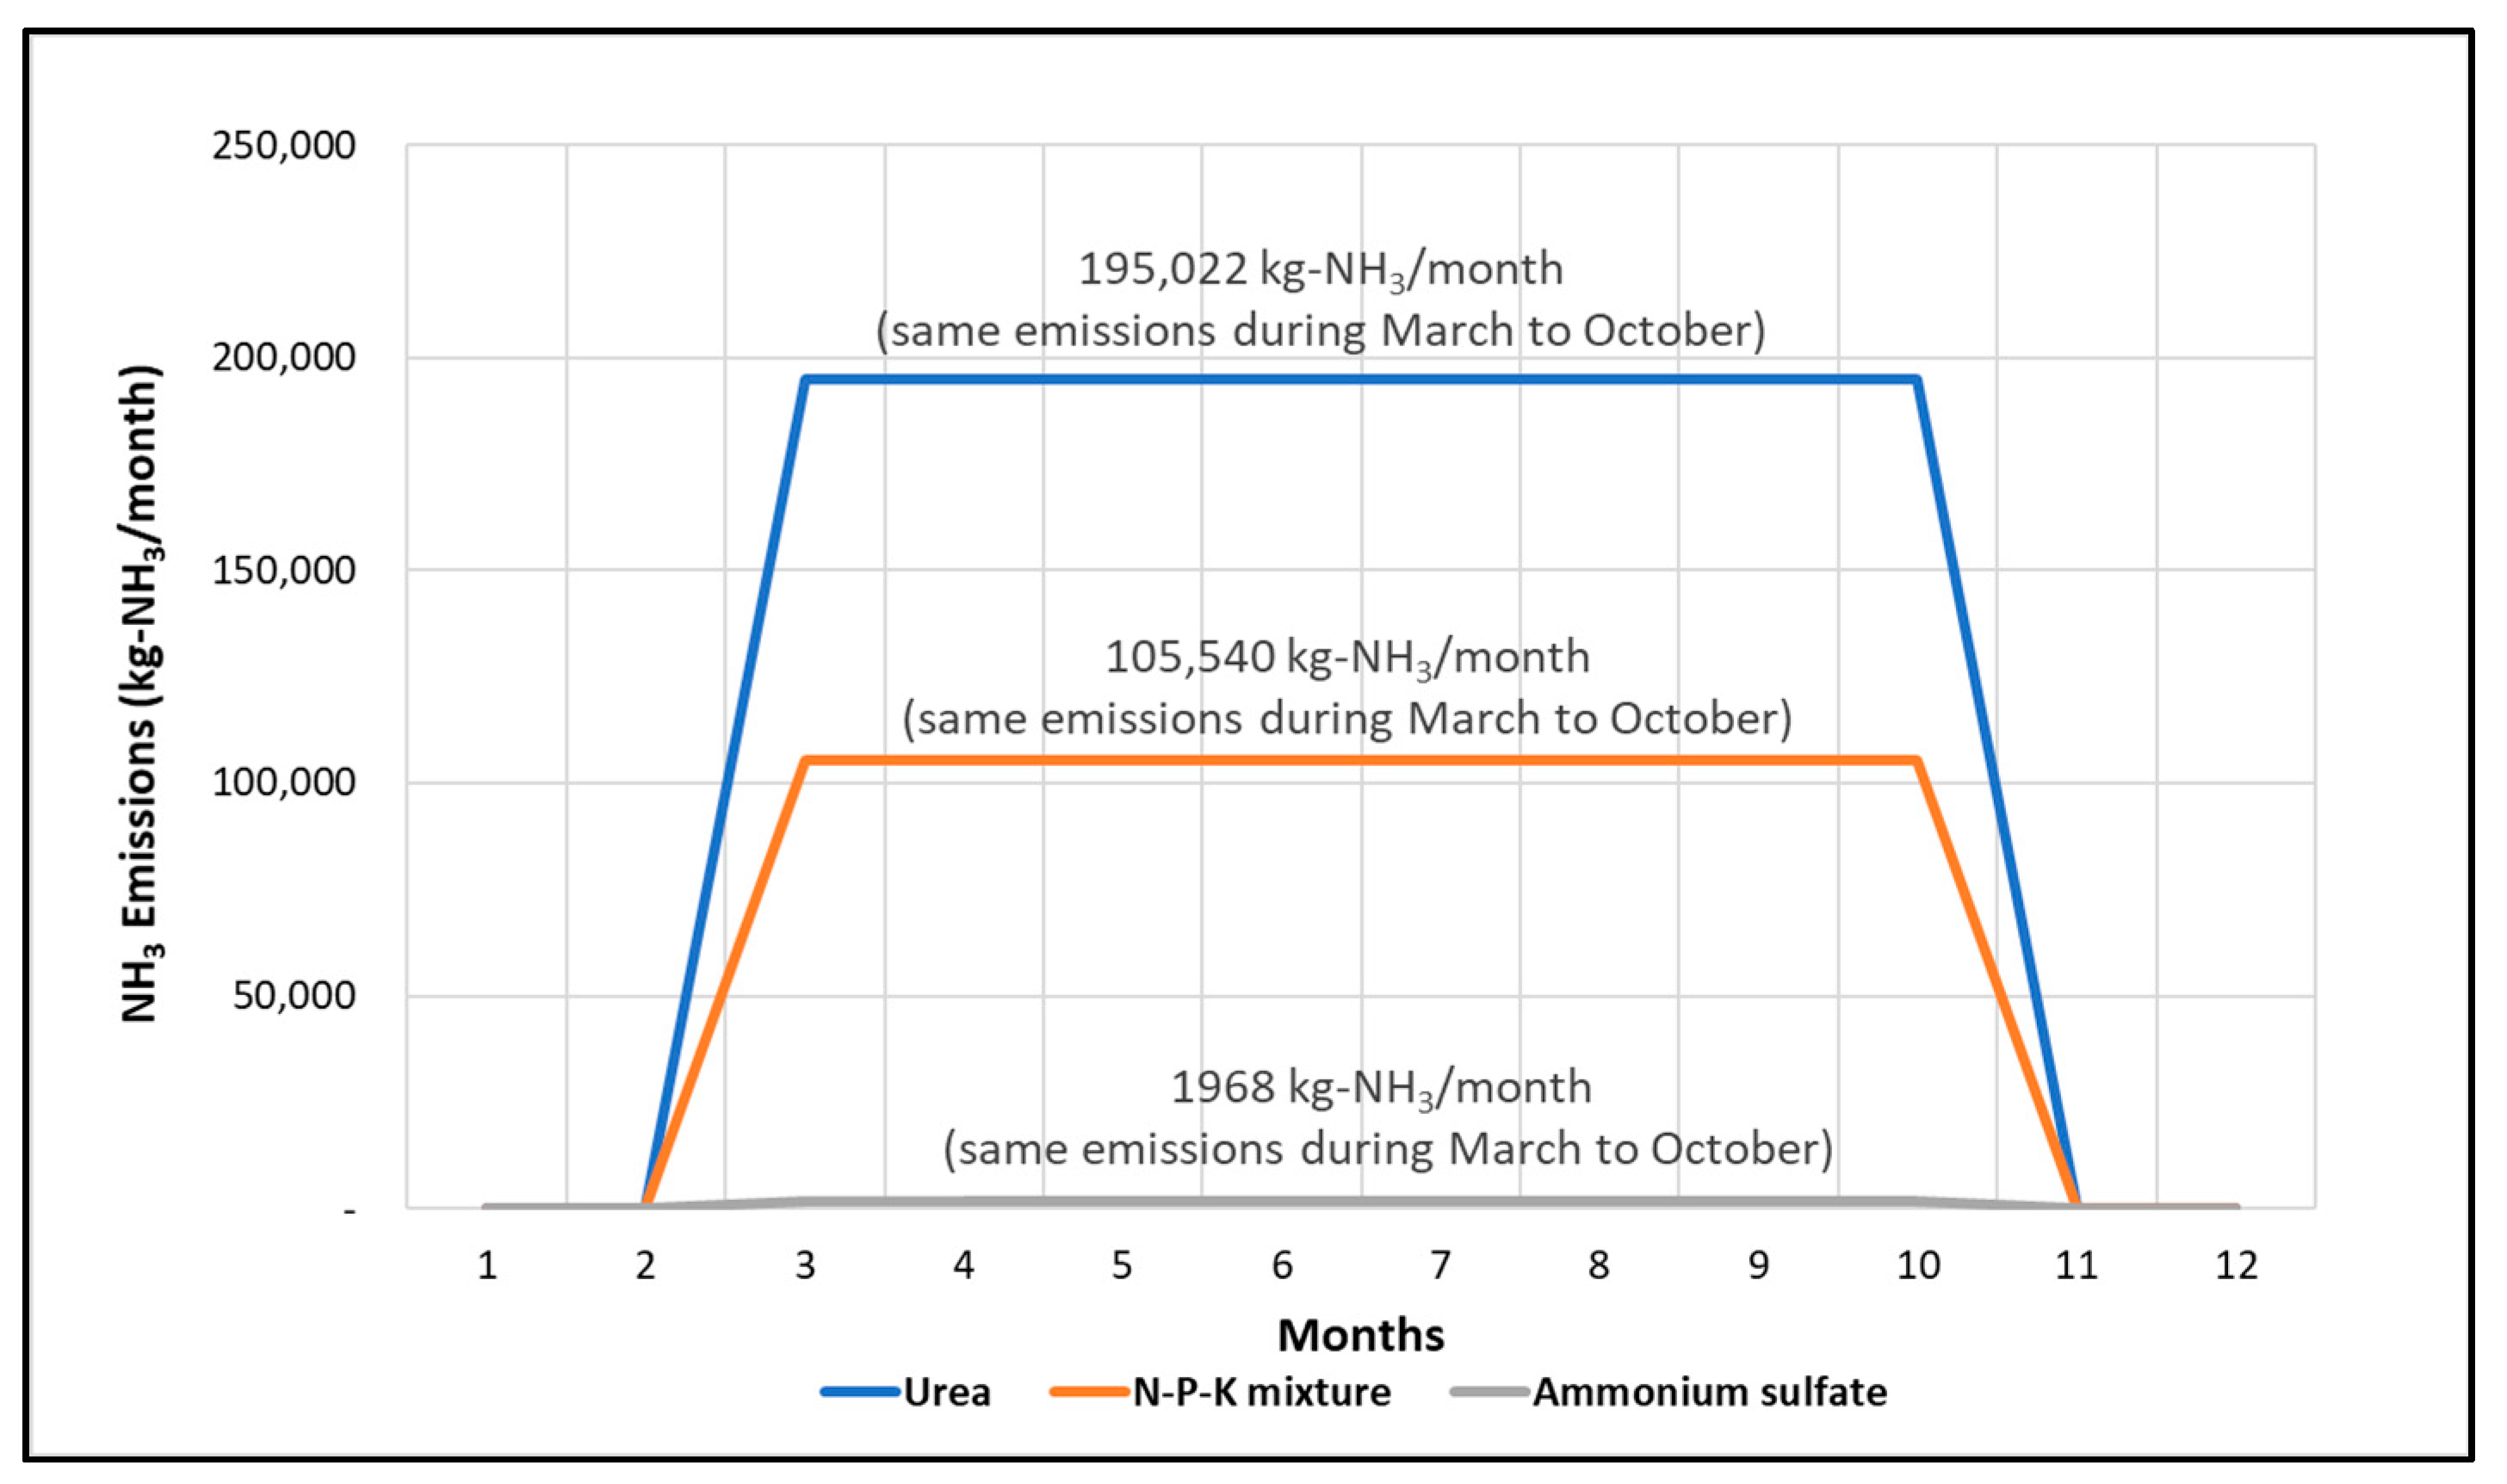
The monthly emission in Jeolla Province calculated using Method I was the same from March to October, as shown in Figure 4. Urea was the most frequently applied fertilizer, followed by compound fertilizers and ammonium sulfate. Currently, South Korea’s classification system identifies “farmland” as an emission source, which is not further classified into different land use types. Therefore, the spatial and temporal emission characteristics are unidentifiable.
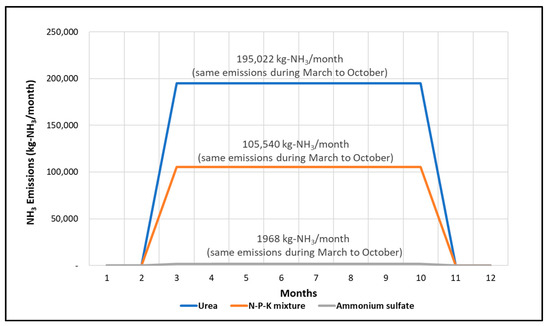
Figure 4.
NH3 emissions by fertilizer in Jeolla-do (2017) with Method I.
4.2. Results of NH3 Emission Calculation Considering the Regional Representative Crops and Their Standard Fertilizer Application Amount
Using Method II (NH3 emission calculation considering the representative crops and standard fertilizer application amount), the total NH3 emission in Jeolla Province was calculated to be 2,439,895 kg, as shown in Table 8. Gimje city generated the largest NH3 emission at 339,241 kg, followed by Iksan and Gunsan city.
Table 8.
NH3 emissions in Jeolla-do(2017) with Method II.
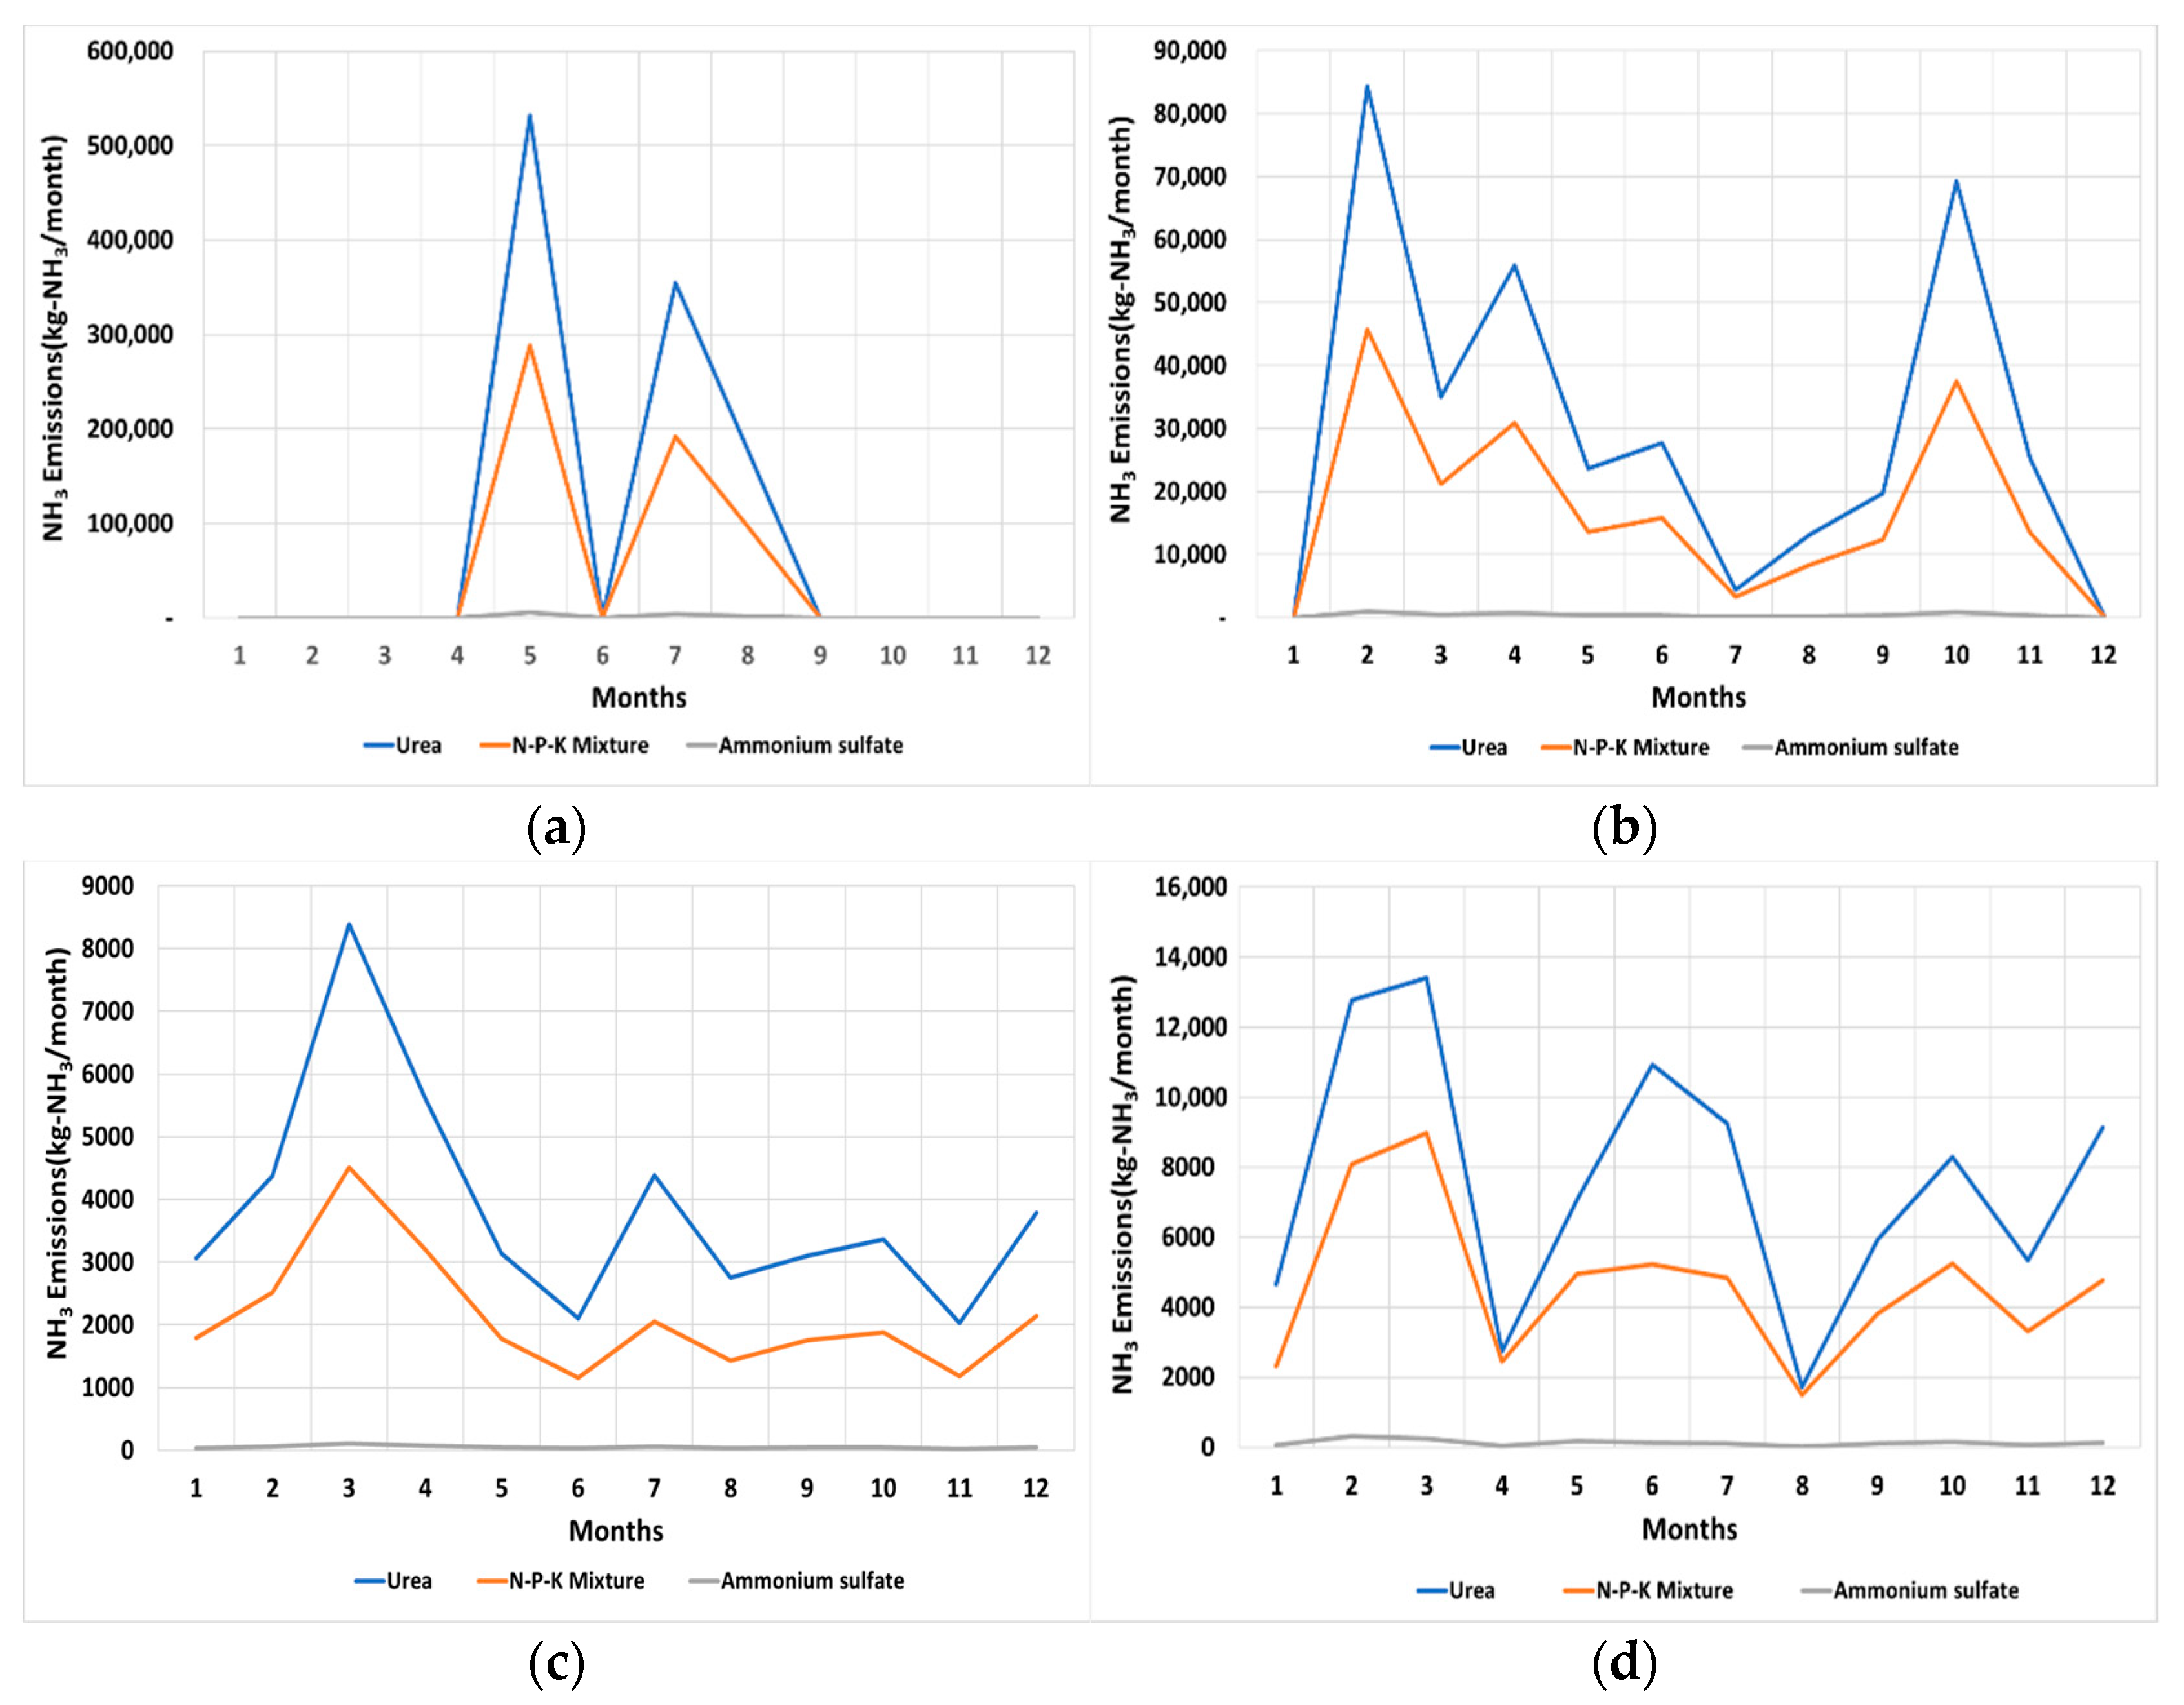
The monthly emissions varied while using Method II for the calculation, as shown in Figure 5. The monthly emission varied according to the fertilizer type when the representative crops were equal, while the overall pattern remained similar. Urea application generated the highest amount of NH3 emissions, followed by compound fertilizers and ammonium sulfate. Ammonium sulfate generated the lowest amount of NH3 emissions in all farmlands. Rice paddies fertilized by urea generated the largest emissions in May (531,000 kg), followed by fields (urea, 153,000 kg in February and October, lowest from December to January), greenhouses (highest emissions in March, even throughout the year), and pomiculture (highest emissions in February and March).
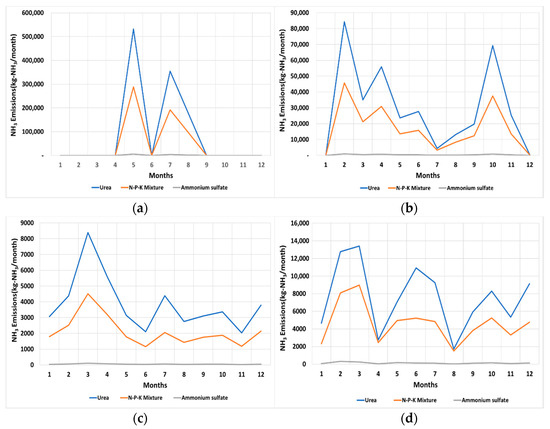
Figure 5.
NH3 emissions by farmland in Jeolla-do (2017) with Method II. (a) Rice paddies; (b) fields; (c) greenhouses; (d) pomiculture.
In more detail, rice is cultivated in rice paddies with an area of 98% or more, and rice is fertilized in May, July, and August under the farming schedules, so it can be seen that emissions stand out during the month. In fields, 35% of the total area of the fields is cultivated with barley, wheat, and onions, and these crops are fertilized in February and October, indicating that the emissions are high during the month. In the facility, watermelon cultivation area occupies 25%, accounting for the largest proportion, and it can be seen that the largest amount of discharge occurs because additional fertilization is given in March. In addition, in the pomiculture, 39% of the total area is cultivated for apples and persimmons, and these crops are basal fertilized in February and March. Based on South Korea’s current NH3 emission calculation method, spatial and temporal emission characteristics are unidentifiable. Therefore, the representative crop and farmland type identifications used in Method II will enhance NH3 emission controls.
4.3. Results of NH3 Emission Calculation Considering the Amount of Nitrogen Application by Crop Type
Table 9 shows the total amount of nitrogen application (15,488,710 kg) and NH3 emissions in Jeolla Province calculated by Method III (NH3 emission calculation considering crop-specific nitrogen application). The regional nitrogen application amount was converted to NH3 emissions by multiplying the regional nitrogen application amount by the existing fertilizer type-dependent emission factors. The emission factors were additionally weighted based on the regional supply volume of different fertilizer types. A total of 1,505,393 kg of NH3 were emitted. Gimje city generated the largest amount of NH3 emissions at 246,627 kg, followed by Iksan and Jeongeup city. The regional emission value derived from Method III differed from that derived from Method II, which is likely caused by the difference in the manner of fertilizer application between Jeongeup and Gunsan city.
Table 9.
Amount of N application and NH3 emissions in Jeolla-do (2017) with Method III.
As shown in Figure 6, monthly NH3 emissions varied with application in Method III, since the farming schedule for each crop was considered. The fertilization application schedule was the same for all crops, which resulted in a development similar to Method II. However, the results showed different emission levels. In May, July, and August, when emissions are highest, the NH3 emissions calculated by Method III (1,050,661 kg) were lower than those calculated with Method II (1,063,984 kg) by 13,322 kg. Method III yielded lower emissions for other farmland types as well. This confirms that actual farmlands are fertilized beyond their standard amounts set by South Korea.
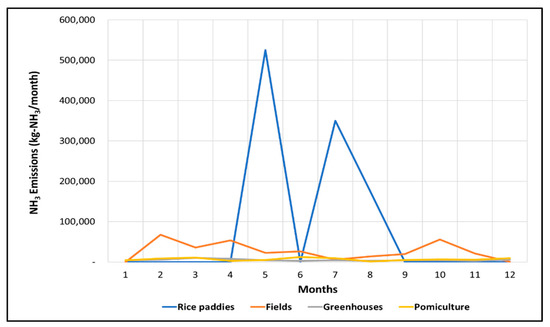
Figure 6.
NH3 emissions by farmland in Jeolla-do (2017) with Method III.
4.4. Comparison of the Fertilized Farmland NH3 Emission Calculation Methods
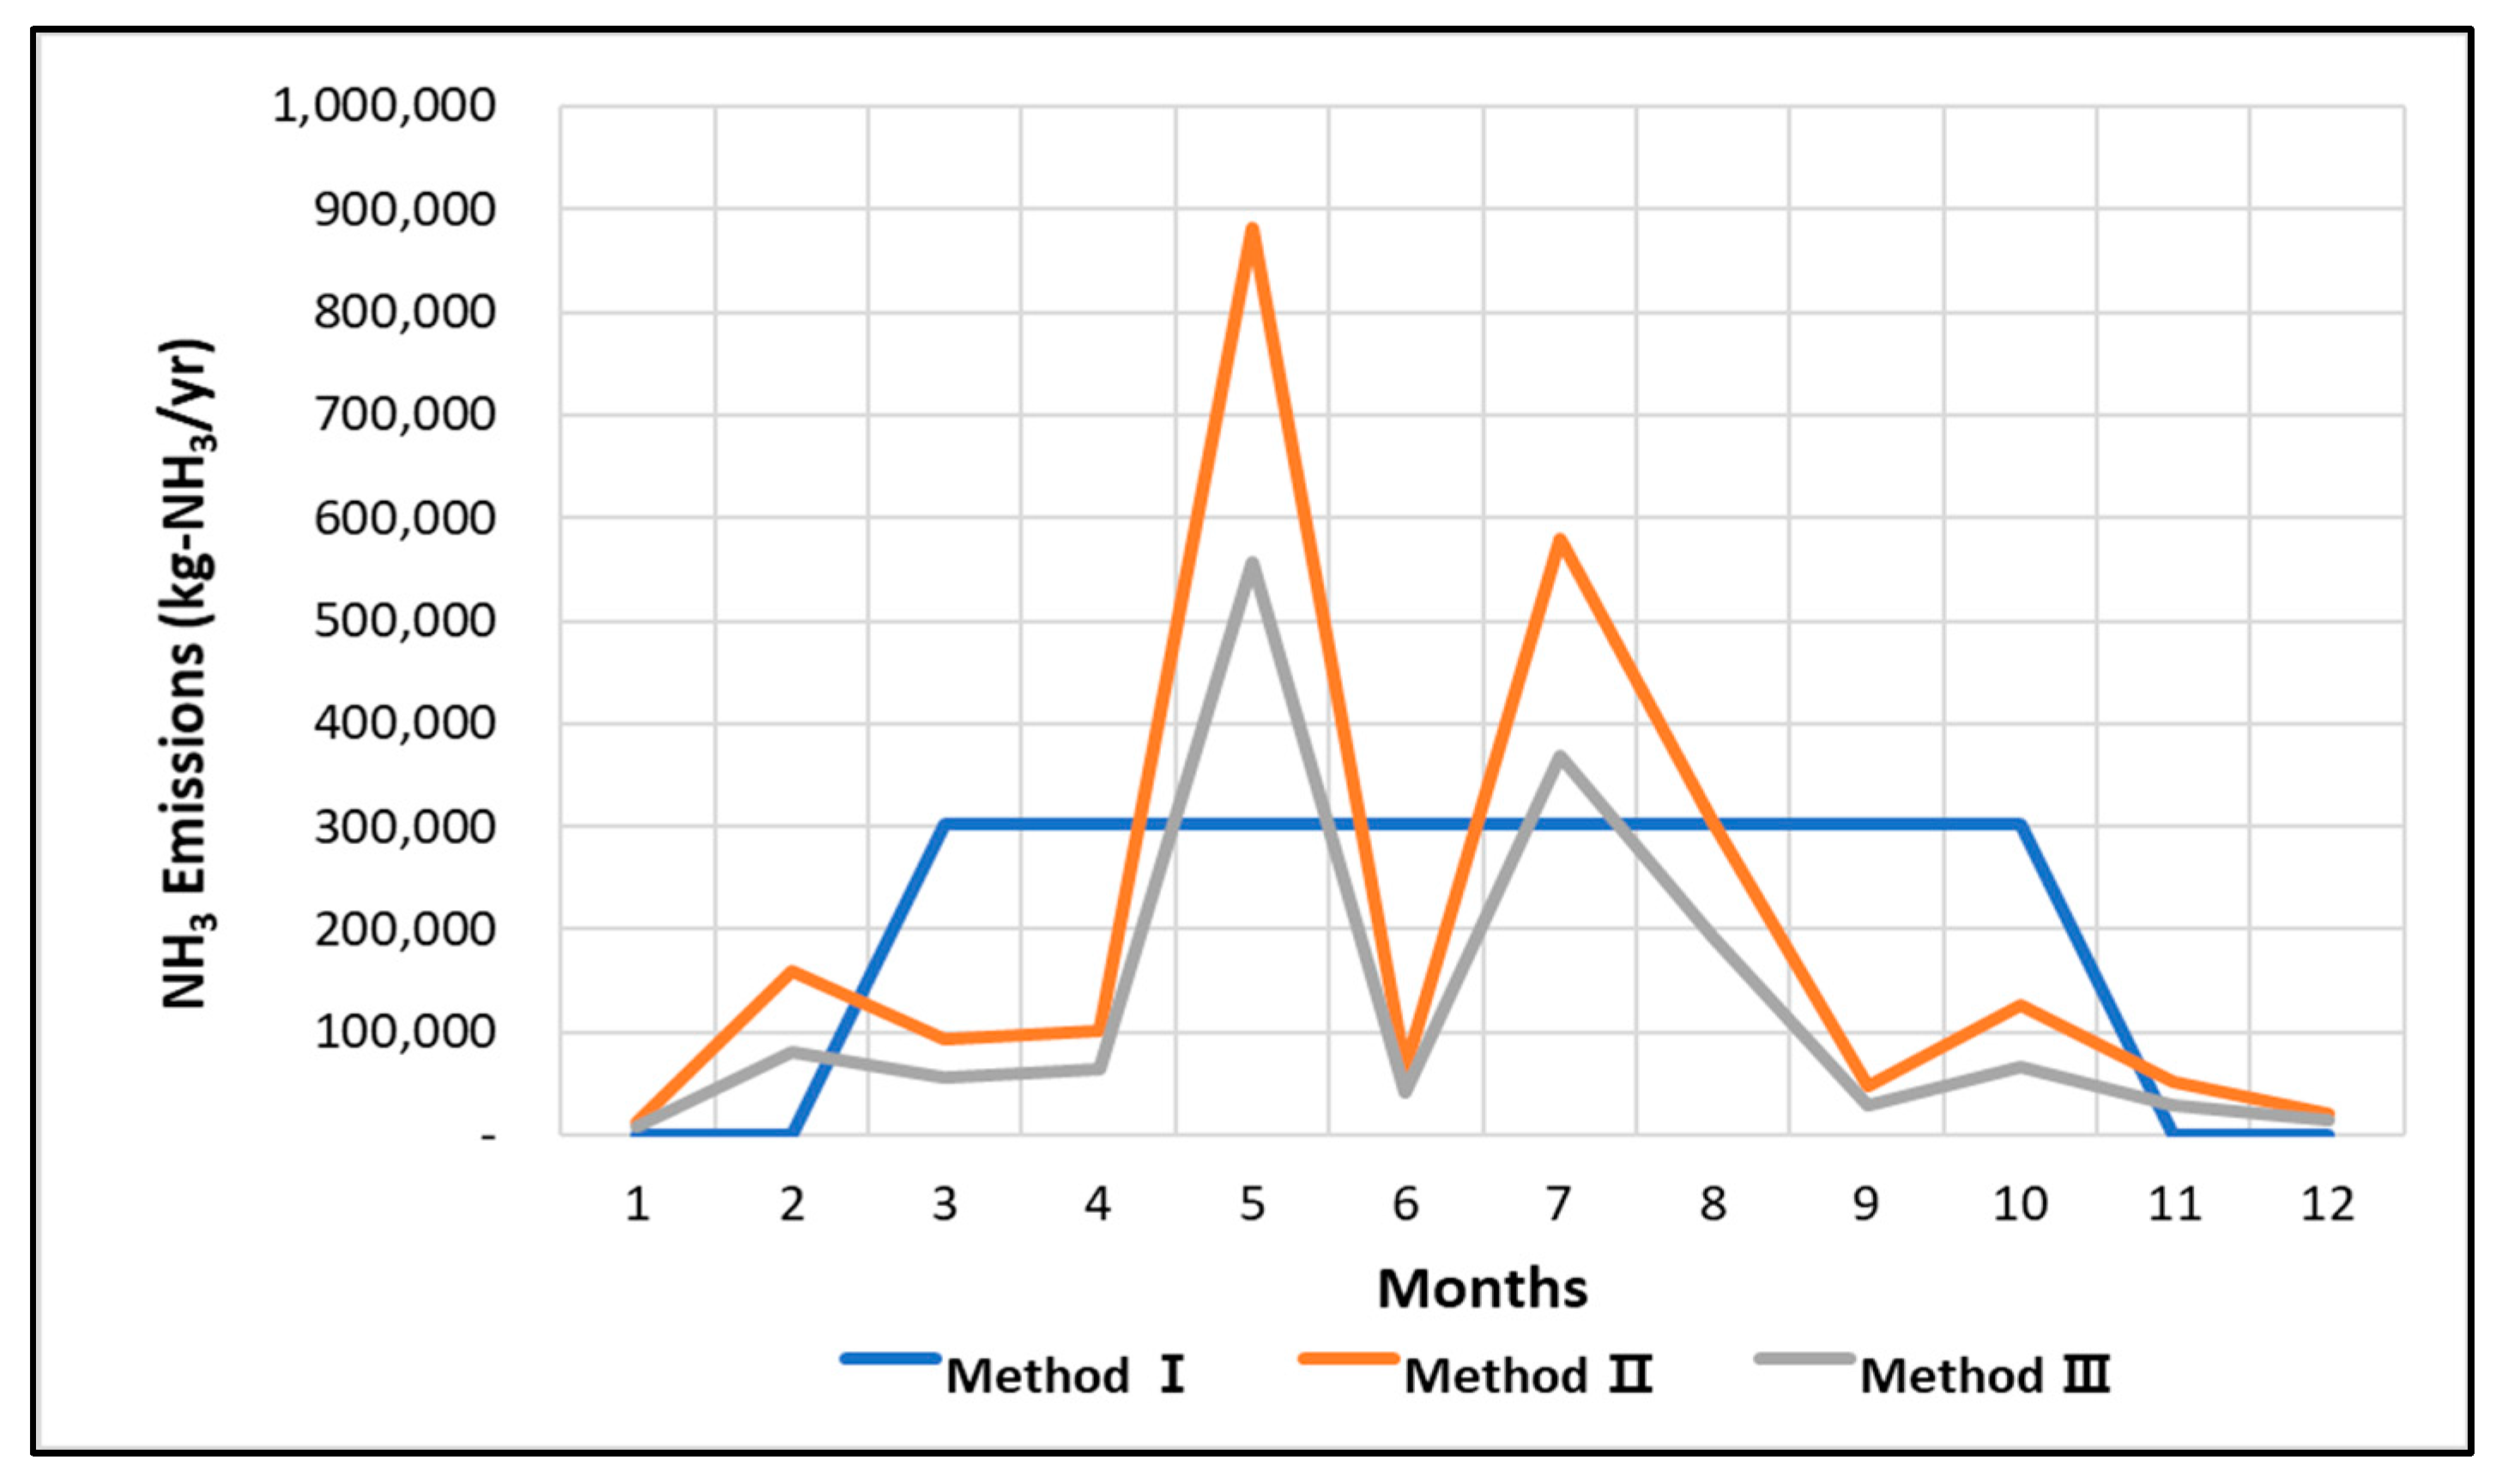
A comparison between the previous and the enhanced NH3 emission calculation methods is shown in Figure 7. Method I is based on the volume of fertilizer supply, Method II has the additional considerations of regional representative crops and the standard fertilization application amount for each crop, and Method III incorporates the nitrogen application amounts, resulting in 2420, 2439, and 1505 tons of calculated NH3 emissions, respectively. Methods I and II, which used data based on current activities, resulted in similar emission values. Method II has the advantage that fertilizer supply data are available from the official national emission calculation. For actual compound fertilizers, the nitrogen content varies as per the manufacturer. In this study, an average value was used instead of considering the varying nitrogen content, which may have yielded different results. Method III generated the lowest emission value, which is caused by excessive fertilization. Although chemical fertilizers increase agricultural productivity, their excessive application may impoverish the soil and negatively affect crop physiology and quality [26,27,28]. The standard fertilizer application amount for each crop is defined in South Korea. However, additional amounts are optionally applied to increase productivity. Previous studies showed that nitrogen-based fertilizers are applied 1.5–2.4 times more than the standard amount [29]. Studies that evaluate changes in soil properties by farmland type showed that for rice paddies, chemical fertilizers are mostly applied within the optimal range. However, in greenhouses and pomiculture, numerous chemical fertilizers exceed the optimal range [30,31]. The results from Method III differ from those from Method I by 915 tons, demonstrating the excessive application of fertilizer on actual farmlands.
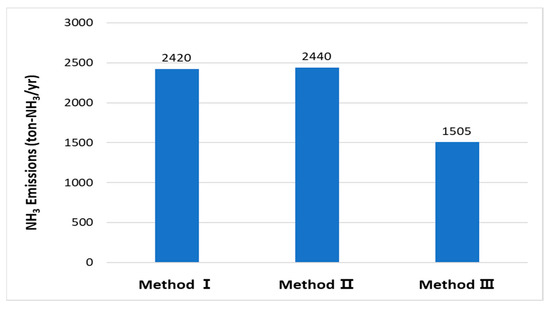
Figure 7.
Comparison of NH3 emissions in fertilizer application by calculation method.
Specific regional fertilizer application excess can be ascertained using Method III, combined with the annual data on soil quality and the state of the soil, provided by the National Institute of Agricultural Sciences in South Korea. These data may be useful for the development of soil and NH3 emission control policies [32]. However, this combination requires complementary measures to take into account fertilizer-specific emission factors and to convert the calculated total nitrogen application amount to NH3.
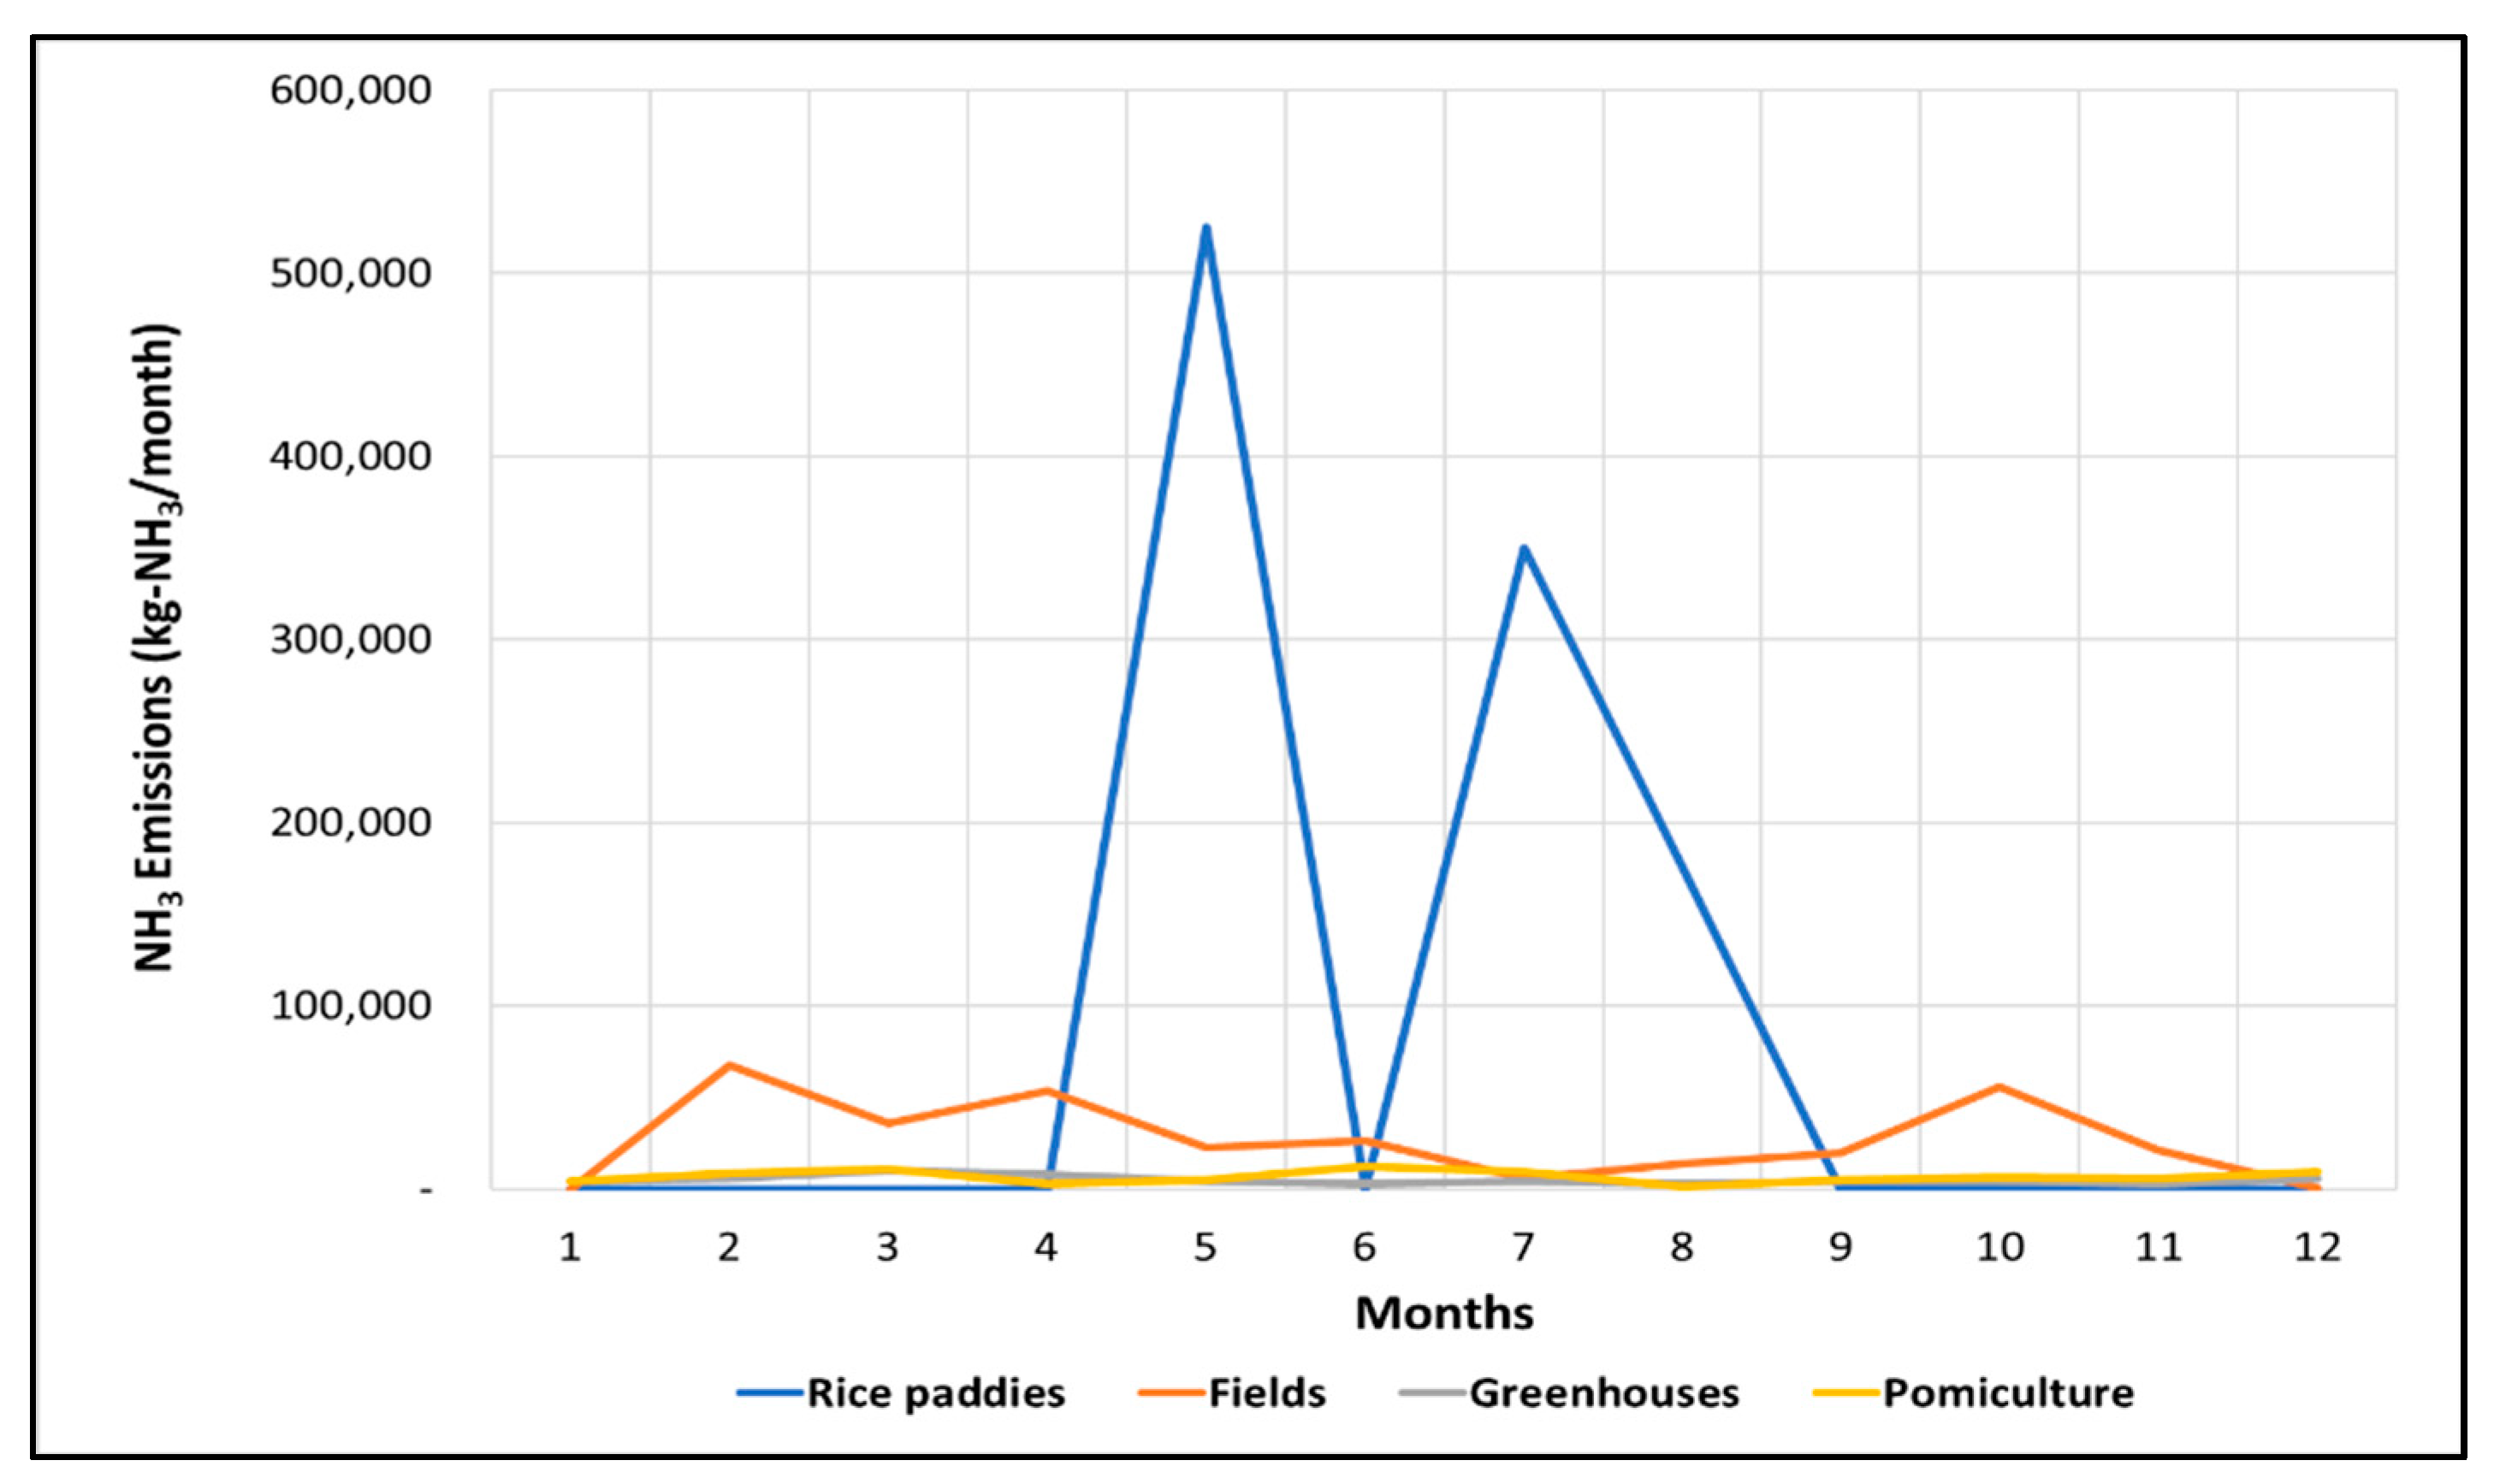
Monthly emissions based on fertilizer application are shown in Figure 8. The regional crop characteristics reflected in Methods II and III are expected to improve the evenly distributed emissions in Method I. In Methods II and III, the largest emissions were generated in May, July, and August. This was likely caused by rice paddy NH3 emissions that exceeded other farmland type NH3 emissions. In fact, rice paddies account for the largest proportion of the area by farmland in Jeolla-do, with 68.1% of rice paddies, 22.9% of fields, 3.1% of facilities, and 5.9% of fruit trees. Rice is cultivated on an area of more than 98% in rice paddies, and according to the standard cultivation method, rice is fertilized in May, July, and August, so it is judged that the graph shown in the figure below is shown.

Figure 8.
Monthly NH3 emissions from fertilizer application by calculation method.
5. Conclusions
With the increase in the number of days with a high fine dust concentration and as NH3 is the main source of secondary PM-2.5 formation, controlling NH3 emissions is crucial. The US and the EU members monitor their country-specific farmland types, climate zones, precipitation values, temperatures, soil pH, and CECs, given that the main source of NH3 emission is the agricultural sector. In contrast, South Korea’s NH3 emission calculation method only considers the regional fertilizer supply volume and the nitrogen content of each product. The calculated amount of NH3 emission is distributed evenly for each month, which fails to reflect spatial and temporal characteristics of the crops’ cultivation periods that vary by latitude and greenhouse crops that are cultivated in winter.
In this study, the current NH3 emission calculation method was reviewed and two enhanced methods were derived to increase the accuracy and reliability of the results. Consequently, Methods II and III resulted in varied monthly emissions based on land use or cultivated crop types. Additionally, actual farmlands may be applying fertilizers in excess, as determined by comparing Methods I and III.
Methods II and III distinguish farmlands by land use type and consider crop-specific farming schedules by selecting representative regional crops, allowing for the identification of monthly and farmland-specific emission characteristics. In addition, the theoretical crop-specific nitrogen demand can be calculated using Method III, which may increase the precision of the NH3 emission calculation and the accuracy in emissions control when combined with regional data on soil quality and the state of the soil. This calculation method may be used for precise emissions control in the US or EU. Systematic data collection on future crop management plans, fertilizer application methods, and regional distributions of crops will enable precise emissions control in South Korea. NH3 emission prediction models can be developed in the future, with the continuous accumulation of data on soil quality and the state of the soil, climate zones, and climatic conditions.
Author Contributions
All authors contributed to the research presented in this work. Their contributions are presented below. Conceptualization, E.-C.J.; Methodology and writing—original draft preparation, J.W.; Methodology, S.K.; Analysis, S.S. All authors have read and agreed to the published version of the manuscript.
Funding
This work is supported by Korea Ministry of Environment (MOE) and Korea Environment Corporation.
Institutional Review Board Statement
Not applicable.
Informed Consent Statement
Not applicable.
Data Availability Statement
Data sharing not applicable.
Acknowledgments
This work is financially supported by Korea Ministry of Environment (MOE) as “Graduate School specialized in Climate Change”. This work was carried out with the support of “Cooperative Research Program for Agriculture Science and Technology Development (Project No. PJ014909)” Rural Development Administration, Republic of Korea.
Conflicts of Interest
The authors declare no conflict of interest.
References
- NISA (National Information Society Agency). Particulate Matter Issue and Big Data Utilization Plan. NEAR& Future INSIGHT; National Information Society Agency: Daegu, Korea, 2017.
- OECD (Organisation for Economic Co-Operation and Development). The Economics Consequence of Outdoor Air Pollution; Organisation for Economic Co-Operation and Development: Paris, France, 2016. [Google Scholar]
- Robert, J.A.; Steven, C.S.; Norris, J.R.; Zender, C.S. Recent Northern Hemisphere tropical expansion primarily driven by black carbon and tropospheric ozone. Nature 2017, 485, 350–354. [Google Scholar]
- Hongbo, C.; Junhui, W.; Mengying, W.; Siyue, W.; Jiating, W.; Huan, Y.; Yonghua, H.; Shaomei, S. Impact of exposure to ambient fine particulate matter pollution on adults with knee osteoarthritis. Int. J. Environ. Res. Public Health 2021, 18, 9644. [Google Scholar]
- Robert, H.; Gokhan, M. Particulate matter air pollution: Effects on the cardiovascular system. Front. Endocrinol. 2018, 9, 680. [Google Scholar]
- WHO (World Health Organization). Ambient Air Pollution: A Global Assessment of Exposure and Burden of Disease; World Health Organization: Geneva, Switzerland, 2016. [Google Scholar]
- Dean, S. The health effects of ultrafine partilcles. Exp. Mol. Med. 2020, 52, 311–317. [Google Scholar]
- IARC (International Agency for Research on Cancer). Air Pollution and Cancer; International Agency for Research on Cancer: Lyon, France, 2013. [Google Scholar]
- KEI (Korea Environment Institute). Management Strategies to Reduce PM-2.5 Emission: Emphasis-Ammonia; Korea Environment Institute: Sejong, Korea, 2018. [Google Scholar]
- Soon-tae, K.; Chang-han, B.; Byeong-Uk, K.; Hyun Cheol, K. PM2.5 Simulations for the Seoul Metropolitan Area: (I) Contributions of Precursor Emissions in the 2013 CAPSS Emissions Inventory. Korean Soc. Atmos. Environ. 2017, 33, 139–158. [Google Scholar]
- Zhang, Q.; Quan, J.; Tie, X. Effects of Meteorology and Secondary Particle Formation on Visibility during Heavy Haze Events in Beijing, China. Sci. Total Environ. 2015, 502, 578–584. [Google Scholar] [CrossRef]
- MOE (Ministry of Environment). Comprehensive Measures for Particulate Matter Management; Ministry of Environment: Sejong, Korea, 2017.
- MOE (Ministry of Environment). National Air Pollutants Emission; Ministry of Environment: Sejong, Korea, 2017.
- MAFRA (Ministry of Agriculture, Food and Rural Affairs). Agriculture, Food and Rural Affairs Statistics Yearbook; Ministry of Agriculture, Food and Rural Affairs: Sejong, Korea, 2017.
- EPA (Environmental Protection Agency). 2014 NEI Technical Support Document (TSD); Environmental Protection Agency: Washington, DC, USA, 2018.
- EMEP/EEA. Air Pollutant Emission Inventory Guidebook 2016; EMEP/EEA: København, Denmark, 2016. [Google Scholar]
- MOE (Ministry of Environment). National Air Pollutant Emission Calculation Method Manual (IV); Ministry of Environment: Sejong, Korea, 2020.
- KOSIS (Korean Statistical Information Service). Available online: https://kosis.kr/statHtml/statHtml.do?orgId=101&tblId=DT_1EB001&conn_path=I3 (accessed on 12 October 2021).
- MAFRA (Ministry of Agriculture, Food and Rural Affairs). Agricultural Management Company Registration Information Inquiry Service 2017; Ministry of Agriculture, Food and Rural Affairs: Sejong, Korea, 2017.
- RDA (Rural Development Administration). Available online: http://www.nongsaro.go.kr/ (accessed on 3 November 2021).
- Hamilton, S.P.; Leão, A.F.; Verginassi, A.; Aurélio, M.; Carbone, C. Ammonia volatilization of urea in the out-of-season corn. Rev. Bras. Ciência Solo 2009, 33, 1685–1694. [Google Scholar]
- Yupu, H.; Shihong, Y.; Junzeng, X.; Yijiang, W.; Shizhang, P. Ammonia volatilization and nitrogen utilization efficiency in response to urea application in rice fields of the Tiaju lake region, China. Sci. World J. 2014, 2014, 417605. [Google Scholar]
- Hong-Bae, Y.; Youn, L.; Sang-Min, L.; Suk-Chul, K.; Yong-Bok, L. Evaluation of Ammonia Emission Following Application Techniques of Pig Manure Compost in Upland Soil. Korean J. Environ. Agric. 2009, 28, 15–19. [Google Scholar]
- Maria, S.; Artur, N. Ammonia volatilization from fertilizer urea-A new challenge for agriculture and industry in view of growing global demand for food and energy crops. Agriculture 2021, 11, 822. [Google Scholar]
- Liying, S.; Zhen, W.; Yuchun, M.; Yinglie, L.; Zhengqin, X. Ammonia volatilization and atmospheric N deposition following straw and urea application from a rice-wheat rotation in southeastern China. Atmos. Environ. 2018, 181, 97–105. [Google Scholar]
- Chung, D.Y.; Lee, K.S. Role of Chemical Fertilizer and Change of Agriculture in Korea. Korean J. Agric. Sci. 2008, 35, 69–83. [Google Scholar]
- NAS (National Institute of Agricultural Sciences). Methods of Soil and Crop Plant Analysis; National Institute of Agricultural Science and Technology: Wanju, Korea, 2000. [Google Scholar]
- Pingping, F.; David, A.; Guanghua, L.; Ali, S.; Quan, Q. Substituting organic fertilizer for chemical fertilizer: Evidence from apple growers in China. Land 2021, 10, 858. [Google Scholar]
- Sae-Jin, H.; Byung-Sup, K.; Nam-Il, P.; Hyang-Lan, E. Influence of Nitrogen Fertilization on Storability and the Occurrence of Black Speck in Spring Kimchi Cabbage. Hortic. Sci. Technol. 2017, 35, 727–736. [Google Scholar]
- Hyeon-Ji, K.; Sun-Kook, K.; Sung-Woo, K.; Kyung-Jin, K.; Oh-Do, K. Changes in Chemical Properties of Orchard Soils in Jeonnam Province between 2002 and 2018. Korean J. Soil Sci. Fertil. 2021, 54, 1–9. [Google Scholar]
- KREI (Korea Rural Economic Institute). Evaluation of Korea’s Soil Nutrient Management Policy; Korea Rural Economic Institute: Naju, Korea, 2015. [Google Scholar]
- Soil and Environmental Information System of Korea. Available online: http://soil.rda.go.kr/soil/ (accessed on 3 November 2021).


Publisher’s Note: MDPI stays neutral with regard to jurisdictional claims in published maps and institutional affiliations. |
© 2021 by the authors. Licensee MDPI, Basel, Switzerland. This article is an open access article distributed under the terms and conditions of the Creative Commons Attribution (CC BY) license (https://creativecommons.org/licenses/by/4.0/).